
A Novel Improved Genetic Algorithm for Multi-Period Fractional Programming Portfolio Optimization Model in Fuzzy Environment


Abstract
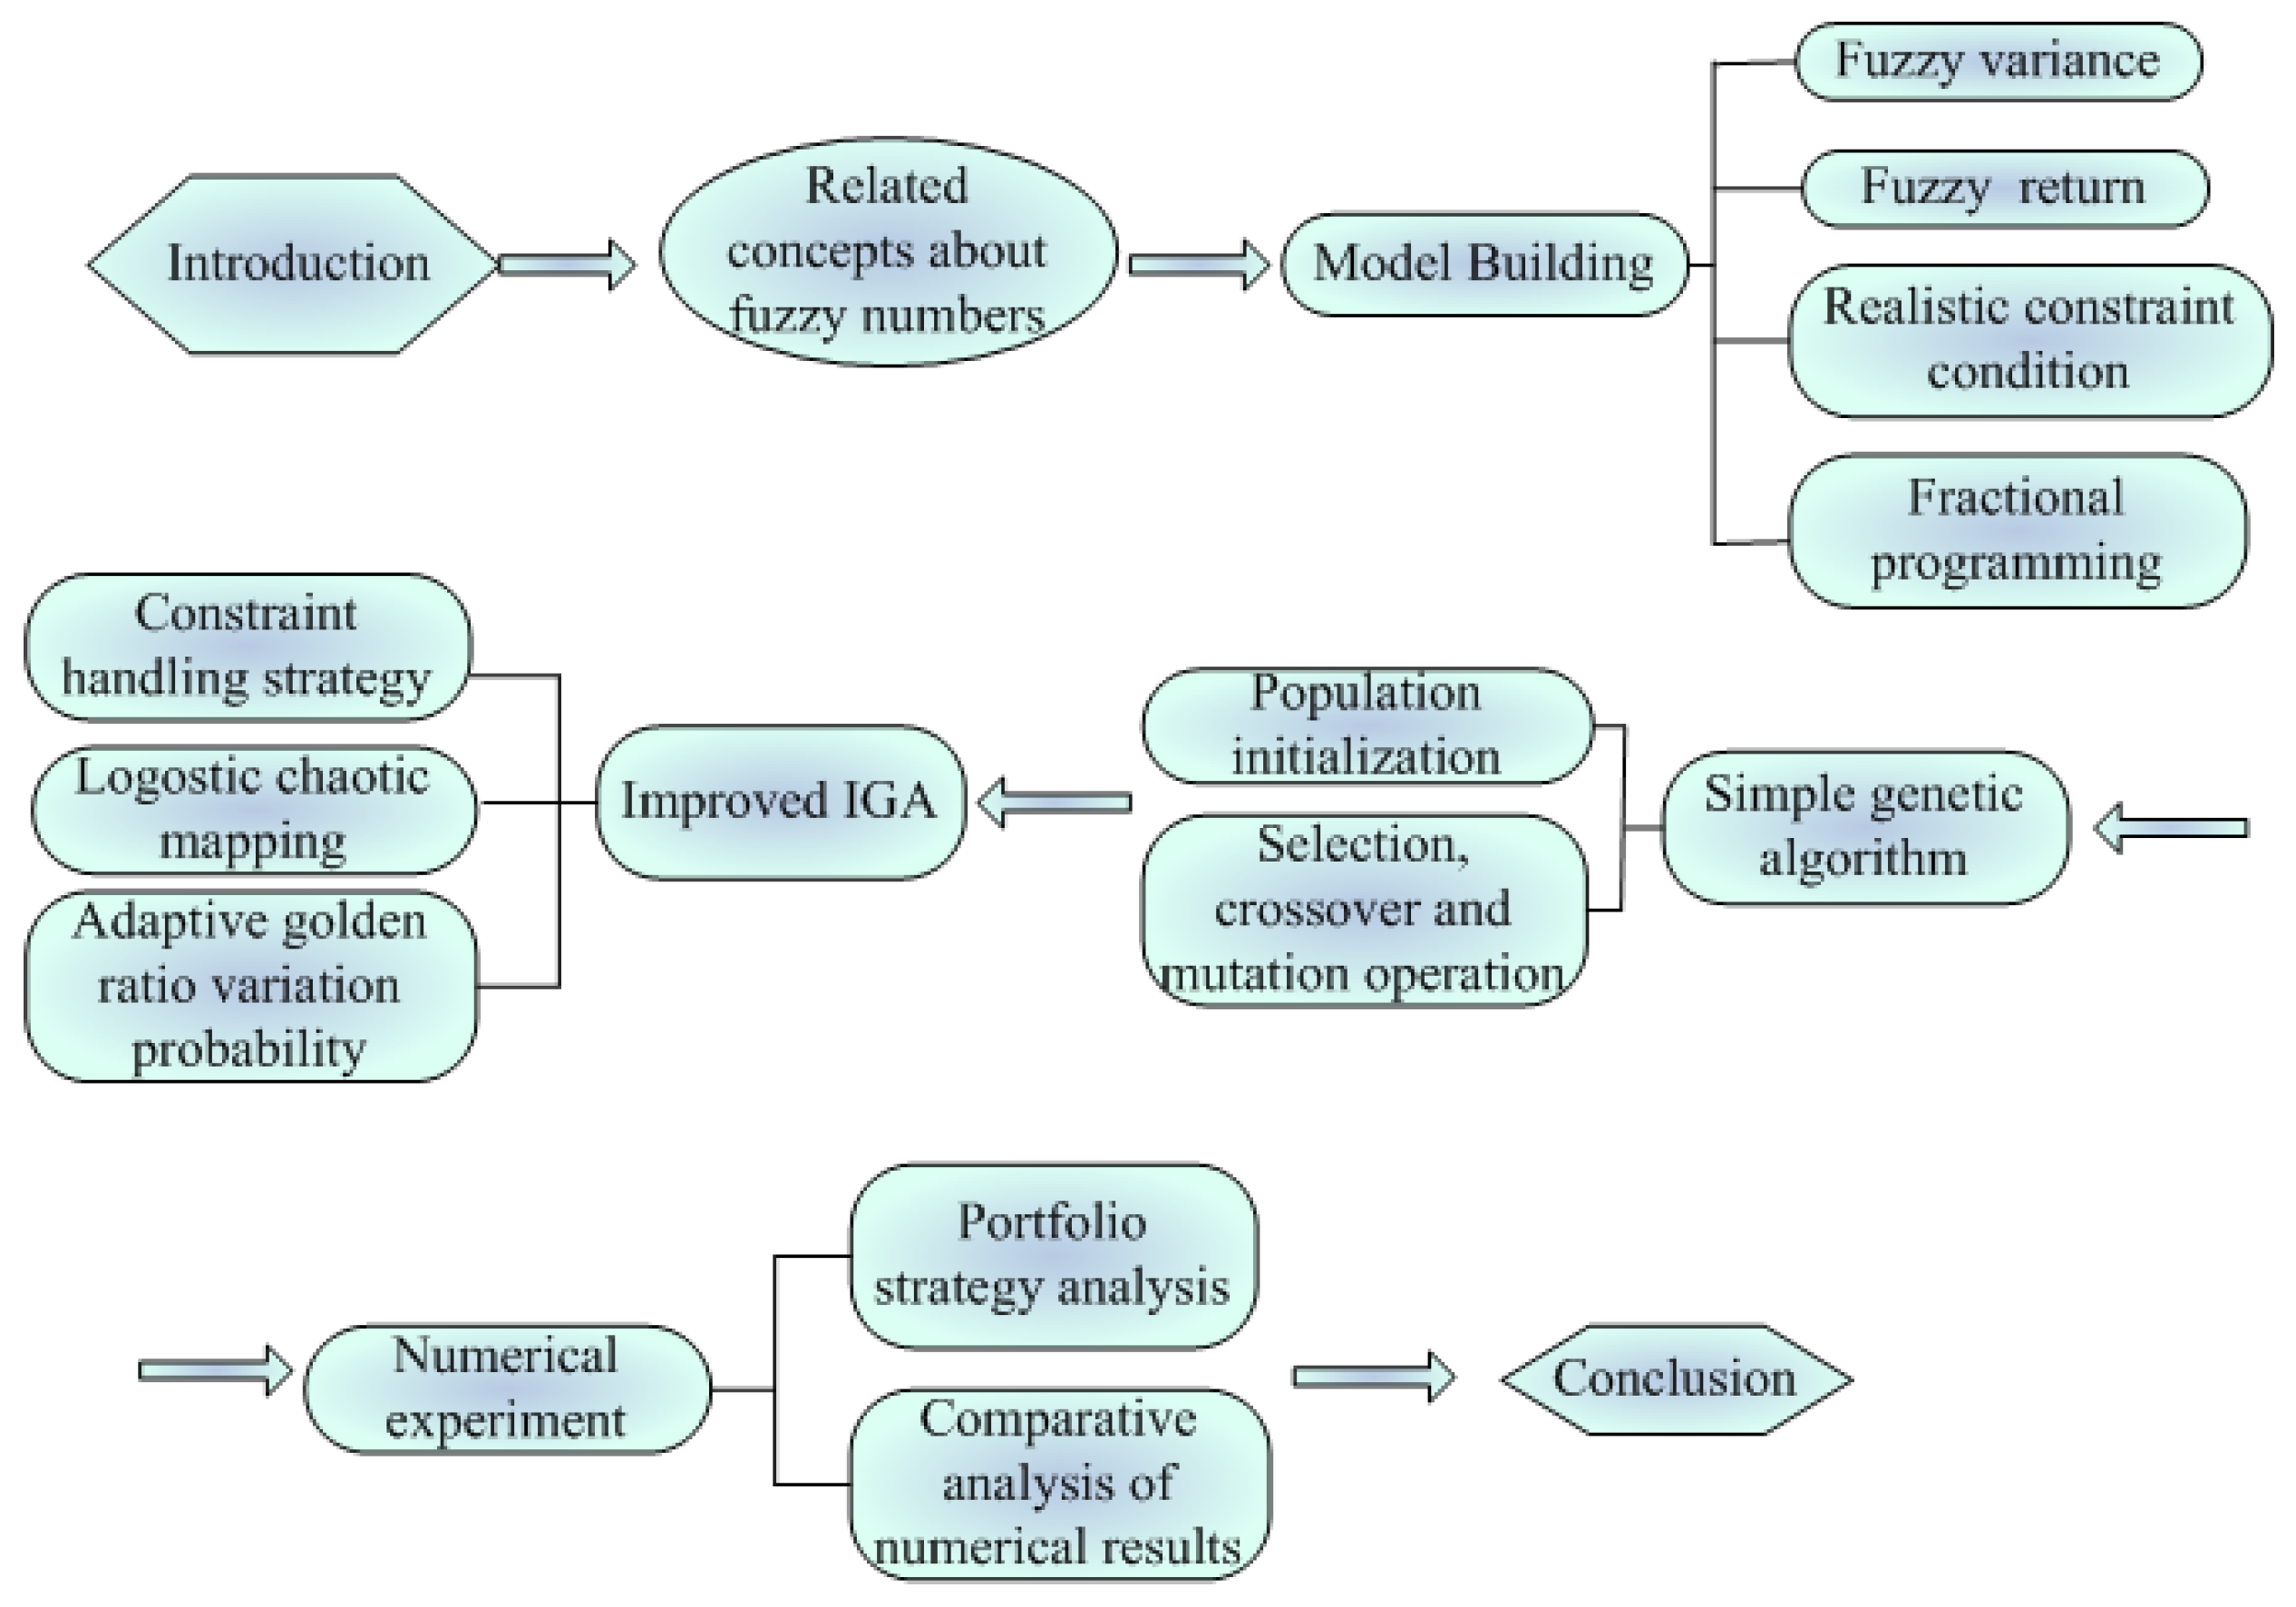
1. Introduction
2. Preliminaries
- (1)
- is regular, exist make ;
- (2)
- is convex, means when , have , and also have ;
- (3)
- is upper semi-continuous and bounded, which means , grep is a fuzzy support set;
- (4)
- is a compact set, which also is a support set of .
 is any given n fuzzy numbers, and is a real number, then
3. Fuzzy Multi-Period Portfolio Model
3.1. Related Symbol Specification
3.2. Fractional Programming Multi-Period Portfolio Model with Realistic Constraints in Fuzzy Environment
- Cardinality constraint
- Asset holding limits
- Limit on the proportion of total investment
- Terminal wealth
- Fuzzy risk
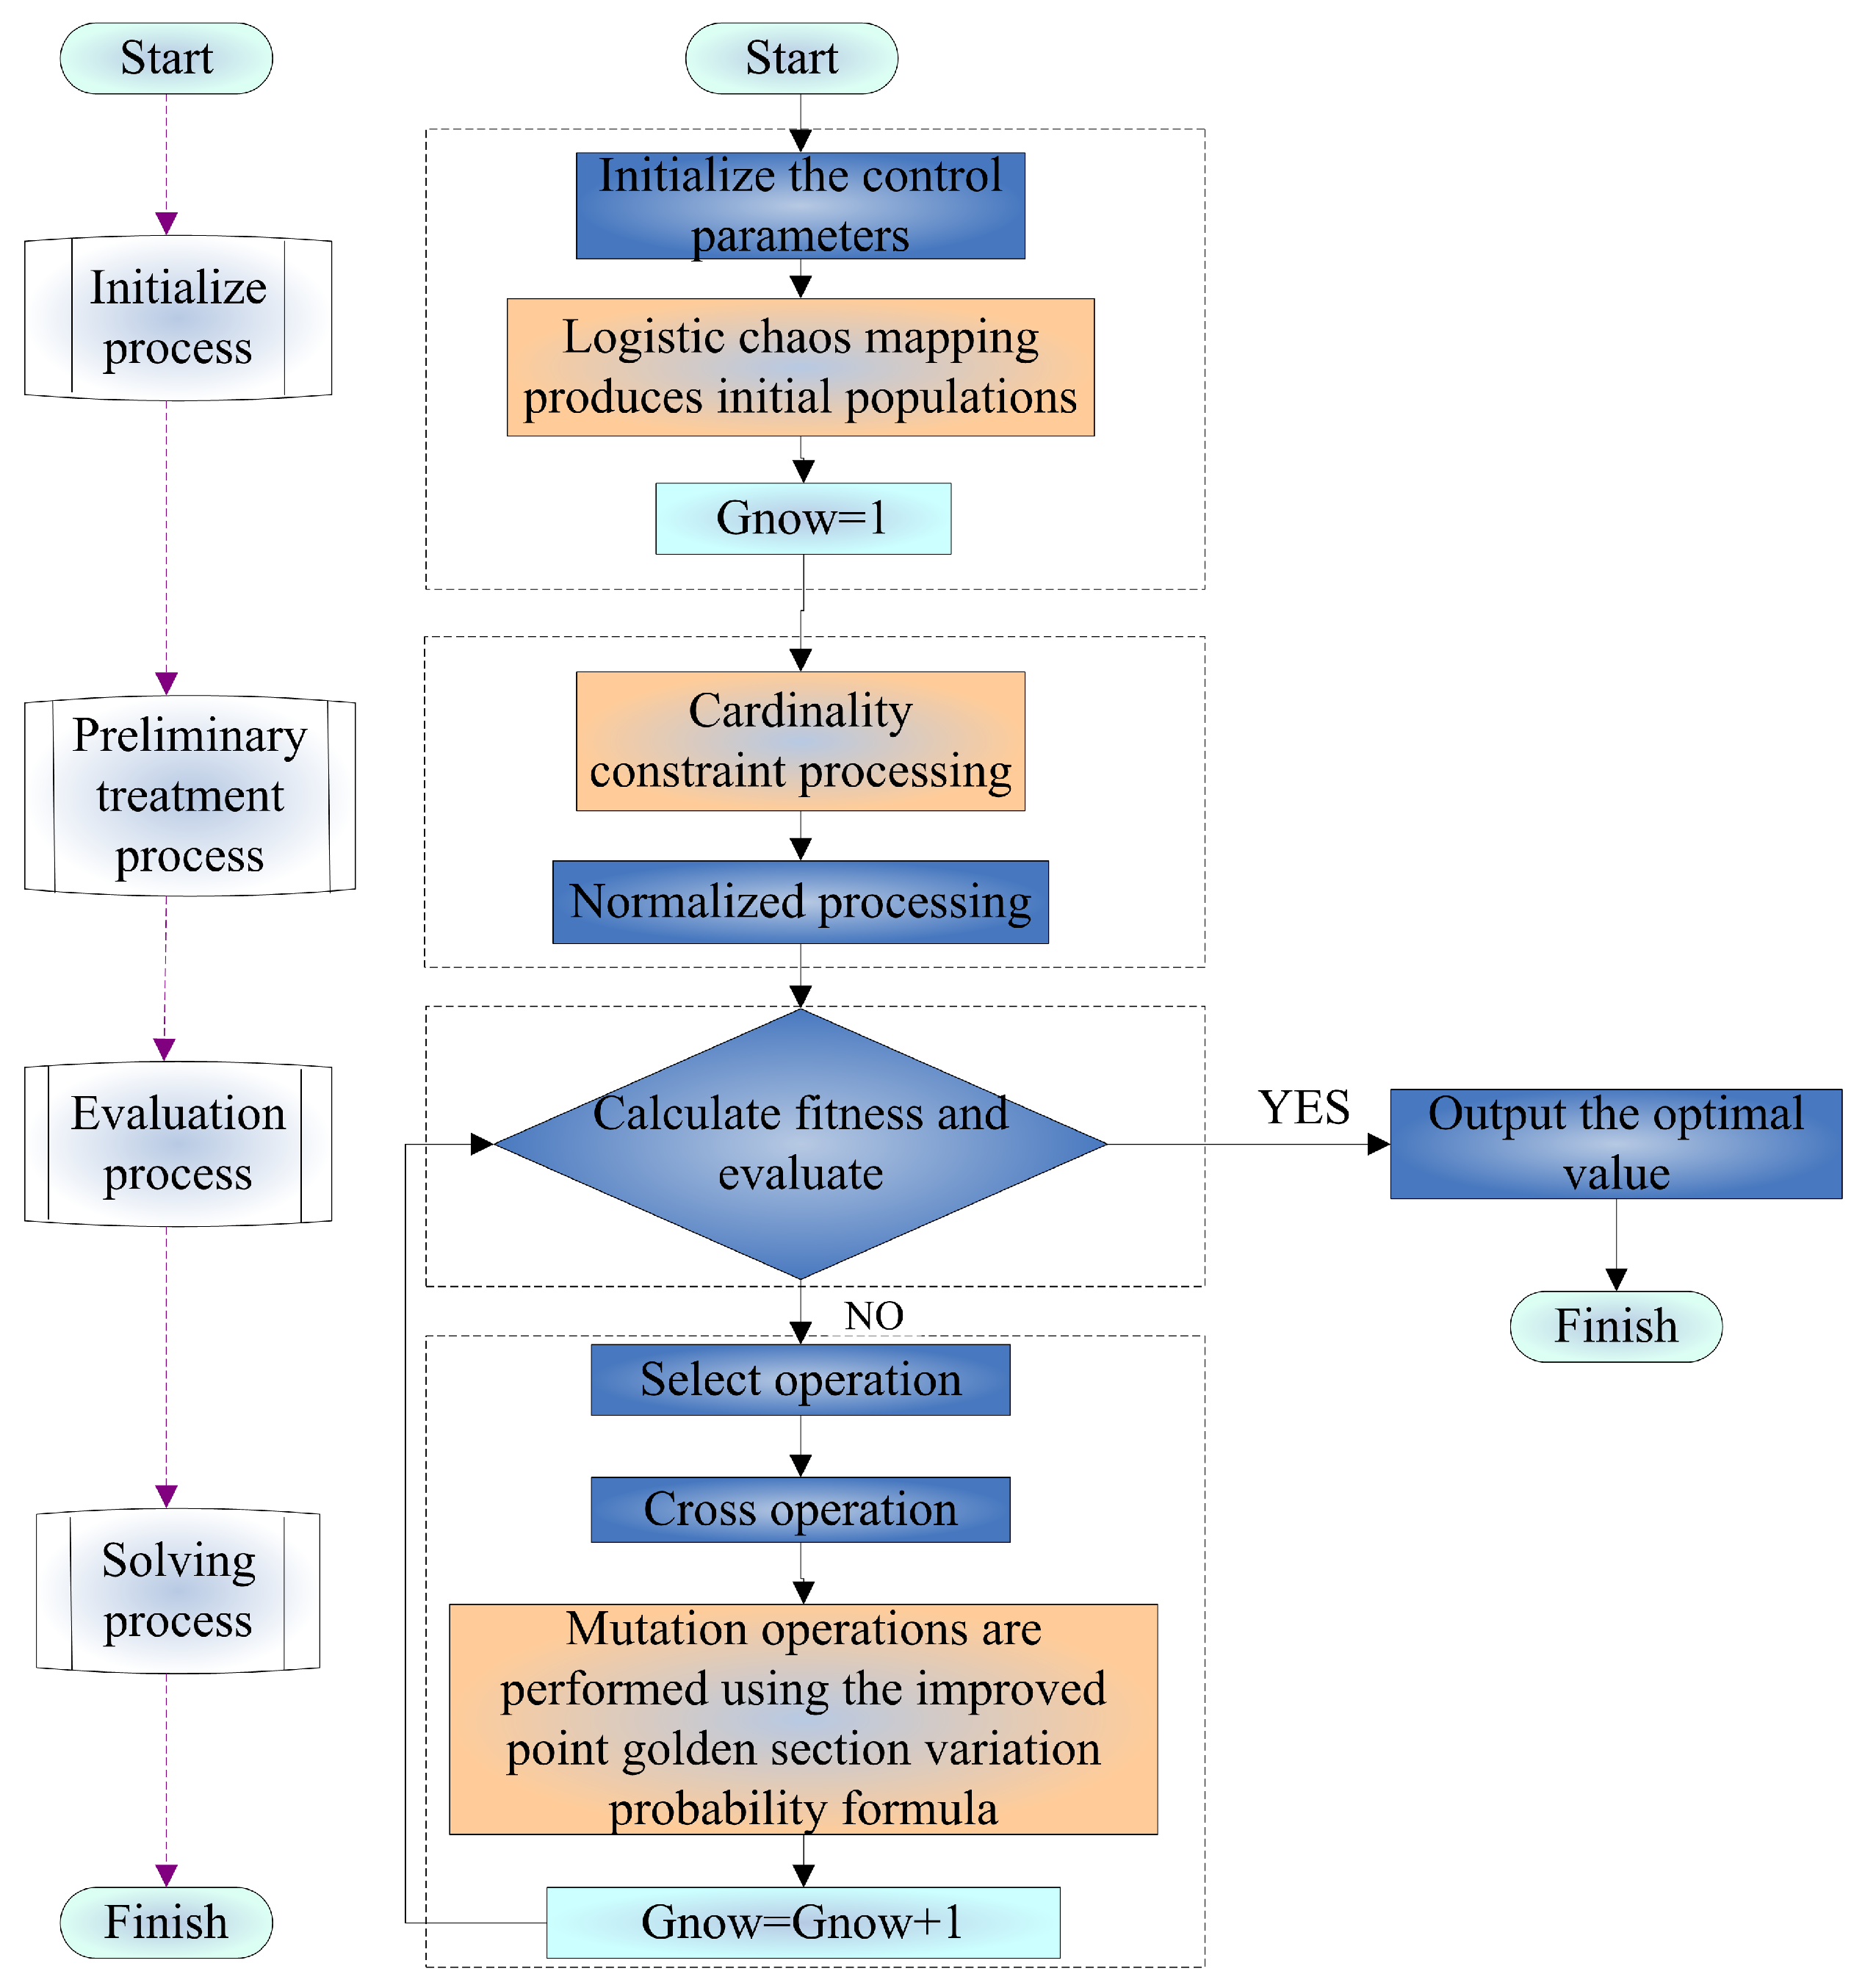
4. Solution Method for Model
4.1. Constraint Processing Method (Semi-Penalty Function Method)
4.2. The Proposed Improved Genetic Algorithm, IGA
4.2.1. Basic Genetic Algorithm
- (1)
- Select Operator: The procedure of picking excellent people from a group and weeding out bad people is referred to as a selection operation. To ensure that the next generation is a good individual, select individuals using the roulette method to the greatest extent individual, i, for the selected probability , where is individual fitness value and is the sum of all individual fitness values in the population.
- (2)
- Crossover operator: Cross operation refers to the operation of replacing and recombining part of the structure of two parent individuals to produce a new individual; the purpose of cross is to produce a new individual in the next generation. Randomly selected from two individuals, to exchange, to the parent genes passed on to the next generation, to produce a new individual. Chromosome and chromosome on j make a cross as follows:where b is a random number in the range .
- (3)
- Mutation operator: Mutation manipulation occurs when the gene values on some locus in the coding string of an individual chromosome are replaced with the remaining alleles on that locus to form a new individual. The mutation operation of the first j gene, , of the first individual, i, is:where is ceiling, is floor, , for the random number, g for the current number of iterations, for the maximum number of iterations, r to random number.
| Algorithm 1 Pseudo−Code of the Standard Genetic Algorithm |
| Input: Set initialization parameters; |
Output: Optimum solution;
|
4.2.2. The Proposed Improved Genetic Algorithm, IGA
- (1)
- Population initialization
- (2)
- Cardinality constraint process
- (a)
- Calculation is not zero in each individual chromosome number P, where , K for a given the biggest asset investment base;
- (b)
- Determine whether the value of P satisfies the inequality constraint . If the inequality is satisfied, proceed to the next step. Otherwise, randomly select at the corresponding position of p of and set it to 0, so that the value of P satisfies the inequality constraint , and the specific pseudo-code is Algorithm 2.
| Algorithm 2 Cardinality Constraint Handling Strategy |
| Input: Initial |
| Output: Initial population X |
|
- (3)
- Adaptive golden section mutation operator
- (4)
- Evaluation function
| Algorithm 3 Pseudo-Code of the Improved IGA |
| Input: Set initialization parameters; |
| Output: Optimum solution |
|
- (5)
- Complexity analysis of IGA
4.2.3. Proof of Convergence for IGA
5. Numerical Example
- (1)
- Analyze portfolio strategies under different base constraints to reflect the impact of cardinality constraints on the portfolio;
- (2)
- Analyze the portfolio strategy under the previous and next limits of different investment ratios in order to analyze the influence of different parameters of the upper and lower limits of investment ratios on the portfolio;
- (3)
- The numerical results of solving the SPFM model by different algorithms are compared to verify the effectiveness of the IGA proposed in the next paper;
- (4)
- Verify the influence of the adjustment for cost rate parameters on the numerical results by comparing the numerical results under different algorithms and different transaction cost rates;
- (5)
- The numerical results of different algorithms under different iterations were analyzed for comparative analysis to highlight the impact of iterations on numerical results, and the numerical results of other comparison algorithms were also compared.
5.1. Experimental Results
5.2. Performances of the Proposed IGA
6. Conclusions
Author Contributions
Funding
Data Availability Statement
Conflicts of Interest
References
- Markowitz, H.M. Portfolio selection. J. Financ. 1952, 7, 77. [Google Scholar]
- Plachel, L. A unified model for regularized and robust portfolio optimization. Econ. Dyn. Control 2019, 109, 103779. [Google Scholar] [CrossRef]
- Wang, W.; Li, W.; Zhang, N.; Liu, K. Portfolio formation with preselection using deep learning from long-term financial data. Expert Syst. Appl. 2020, 143, 113042. [Google Scholar] [CrossRef]
- Chen, W.; Zhang, H.; Mehlawat, M.K.; Jia, L. Mean–variance portfolio optimization using machine learning-based stock price prediction. Appl. Soft Comput. 2021, 100, 106943. [Google Scholar] [CrossRef]
- Ma, Y.; Han, R.; Wang, W. Portfolio optimization with return prediction using deep learning and machine learning. Expert Syst. Appl. 2021, 165, 113973. [Google Scholar] [CrossRef]
- Zadel, L.A. Fuzzy sets. Inf. Control 1965, 8, 338–353. [Google Scholar]
- Katagiri, I. Chance constrained bottleneck spanning tree problem with fuzzy random edge costs. J. Oper. Res. Soc. Jpn. 2000, 43, 128–137. [Google Scholar] [CrossRef]
- Pahade, J.K.; Jha, M. A Hybrid Fuzzy-SCOOT Algorithm to Optimize Possibilistic Mean Semi-absolute Deviation Model for Optimal Portfolio Selection. Int. J. Fuzzy Syst. 2022, 24, 1958–1973. [Google Scholar] [CrossRef]
- Pahade, J.K.; Jha, M. Credibilistic variance and skewness of trapezoidal fuzzy variable and mean–variance–skewness model for portfolio selection. Results Appl. Math. 2021, 11, 100159. [Google Scholar] [CrossRef]
- Gupta, P.; Mehlawat, M.K.; Khan, A.Z. Multi-period portfolio optimization using coherent fuzzy numbers in a credibilistic environment. Expert Syst. Appl. 2021, 167, 114135. [Google Scholar] [CrossRef]
- Mehlawat, M.K.; Gupta, P.; Khan, A.Z. Multiobjective portfolio optimization using coherent fuzzy numbers in a credibilistic environment. Int. J. Intell. Syst. 2021, 36, 1560–1594. [Google Scholar] [CrossRef]
- Gao, W.; Sheng, H.; Wang, J.; Wang, S. Artificial bee colony algorithm based on novel mechanism for fuzzy portfolio selection. IEEE Trans. Fuzzy Syst. 2018, 27, 966–978. [Google Scholar] [CrossRef]
- Vercher, E.; Bermúdez, J.D. Portfolio optimization using a credibility mean-absolute semi-deviation model. Expert Syst. Appl. 2015, 42, 7121–7131. [Google Scholar] [CrossRef]
- Leung, M.-F.; Wang, J.; Che, H. Cardinality-constrained portfolio selection via two-timescale duplex neurodynamic optimization. Neural Netw. 2022, 153, 399–410. [Google Scholar] [CrossRef] [PubMed]
- Leung, M.-F.; Wang, J. Cardinality-constrained portfolio selection based on collaborative neurodynamic optimization. Neural Netw. 2022, 145, 68–79. [Google Scholar] [CrossRef] [PubMed]
- Meng, X.; Zhou, X. Multi-period Fuzzy Portfolio Selection Model with Cardinality constraints. In Proceedings of the 2019 16th International Conference on Service Systems and Service Management (ICSSSM), Shenzhen, China, 13–15 July 2019. [Google Scholar]
- Zhao, H.; Chen, Z.G.; Zhan, Z.H.; Kwong, S.; Zhang, J. Multiple populations co-evolutionary particle swarm optimization for multi-objective cardinality constrained portfolio optimization problem. Neurocomputing 2021, 430, 58–70. [Google Scholar] [CrossRef]
- Yang, M.; Qian, W.; Yang, L.; Hou, X.; Yuan, X.; Dong, Z. A Synergistic Multi-Objective Evolutionary Algorithm with Diffusion Population Generation for Portfolio Problems. Mathematics 2024, 12, 1368. [Google Scholar] [CrossRef]
- Delikta, D.; Ustun, O. Multi-objective genetic algorithm based on the fuzzy MULTIMOORA method for solving the cardinality constrained portfolio optimization. Appl. Intell. 2022, 53, 14717–14743. [Google Scholar] [CrossRef]
- Alshraideh, M.A.; Mahafzah, B.A.; Salman, H.S.E.; Salah, I. Using genetic algorithm as test data generator for stored PL/SQL program units. J. Softw. Eng. Appl. 2013, 6, 65–73. [Google Scholar] [CrossRef]
- Chen, W.; Li, D.; Liu, Y.J. A novel hybrid ICA-FA algorithm for multiperiod uncertain portfolio optimization model based on multiple criteria. IEEE Trans. Fuzzy Syst. 2018, 27, 1023–1036. [Google Scholar] [CrossRef]
- Liu, Y.J.; Zhang, W.G.; Gupta, P. Multiperiod portfolio performance evaluation model based on possibility theory. IEEE Trans. Fuzzy Syst. 2019, 28, 3391–3405. [Google Scholar] [CrossRef]
- Yang, X.Y.; Chen, S.D.; Liu, W.L.; Zhang, Y. A Multi-period fuzzy portfolio optimization model with short selling constraints. Int. J. Fuzzy Syst. 2022, 24, 2798–2812. [Google Scholar] [CrossRef]
- Li, X.; Qin, Z. Interval portfolio selection models within the framework of uncertainty theory. Econ. Model. 2014, 41, 338–344. [Google Scholar] [CrossRef]
- Zhang, B.; Peng, J.; Li, S. Uncertain programming models for portfolio selection with uncertain returns. Int. J. Syst. Sci. 2015, 46, 2510–2519. [Google Scholar] [CrossRef]
- Qin, Z.; Kar, S.; Zheng, H. Uncertain portfolio adjusting model using semiabsolute deviation. Soft Comput. 2016, 20, 717–725. [Google Scholar] [CrossRef]
- Chen, W.; Wang, Y.; Gupta, P.; Mehlawat, M.K. A novel hybrid heuristic algorithm for a new uncertain mean-variance-skewness portfolio selection model with real constraints. Appl. Intell. 2018, 48, 2996–3018. [Google Scholar] [CrossRef]
- Zhang, W.G.; Wang, Y.L. Notes on possibilistic variances of fuzzy numbers. Appl. Math. Lett. 2007, 20, 1167–1173. [Google Scholar] [CrossRef]
- Deb, K. An efficient constraint handling method for genetic algorithms. Comput. Methods Appl. Mech. Eng. 2000, 186, 311–338. [Google Scholar] [CrossRef]
- Holl, J.H. Genetic algorithms. Sci. Am. 1992, 267, 66–73. [Google Scholar]
- Michalewicz, Z. Genetic Algorithms + Data Structures = Evolution Programs; Springer: Berlin/Heidelberg, Germany, 1999. [Google Scholar]
- Katoch, S.; Chauhan, S.S.; Kumar, V. A review on genetic algorithm: Past, present, and future. Multimed. Tools Appl. 2021, 80, 8091–8126. [Google Scholar] [CrossRef]
- Lambora, A.; Gupta, K.; Chopra, K. Genetic algorithm-A literature review. In Proceedings of the 2019 IEEE International Conference on Machine Learning, Big Data, Cloud and Parallel Computing (COMITCon), Faridabad, India, 14–16 February 2019; pp. 380–384. [Google Scholar]
- Liu, Y.-J.; Zhang, W.-G. A multi-period fuzzy portfolio optimization model with minimum transaction lots. Eur. J. Oper. Res. 2015, 242, 933–941. [Google Scholar] [CrossRef]


| Attribute | Li [24] | Zhang [25] | Qin [26] | Chen [27] | Our Paper |
|---|---|---|---|---|---|
| Return | ✓ | ✓ | ✓ | ✓ | ✓ |
| Risk | Semiabsolute | Variance | Semiabsolute | Variance | Variance |
| deviation | deviation | ||||
| Skewness | ✓ | ✓ | |||
| Transaction cost | ✓ | ✓ | ✓ | ||
| Bounds on holding | ✓ | ✓ | ✓ | ||
| Cardinality | ✓ | ✓ | |||
| mulit-period | ✓ | ||||
| Solution method | Solver | Hybrid intelligent algorithm | Solver | FA-GA | IGA |
| Symbols | Meanings |
|---|---|
| Return rate on asset i in period t | |
| Investment proportion of the i asset in period t | |
| Lower bound of the expected return in period t | |
| Upper limit of acceptable risk in period t | |
| Lower bound of the | |
| Upper bound of the | |
| Transaction costs of security i at period t | |
| Total investment cost for phase t | |
| Binary variable, | |
| K | Maximum number of investable assets per |
| Net return on the t-period portfolio after transaction costs | |
| The expected probability of wealth at the end of period t | |
| The expected end wealth gained over the investment period | |
| Terminal wealth | |
| Cumulative wealth | |
| The variance of probabilities for period t | |
| The cumulative risk of the portfolio over the life of the investment | |
| Final risk | |
| Cumulative risk |
| Parameters | IGA | I−GA/GGA/GA/DE |
|---|---|---|
| Maximum generation | 200 | 200 |
| Crossover rate | 0.7 | 0.7 |
| Population size | 50 | 50 |
| Mutation rate | Formula (26) | 0.01 |
| Transaction cost rate | 0.003 | 0.003 |
| The initial wealth | 10,000 | 10,000 |
| Expected return value | 1,000,000 | 1,000,000 |
| Expected value at risk | 0.004 | 0.004 |
| Lower bound of investment ratio | 0.005 | 0.005 |
| Upper bound of investment ratio | 0.05 | 0.05 |
| Code | t = 1 | t = 2 | t = 3 |
|---|---|---|---|
| 600031 | −0.0031, 0.0132, 0.0282, 0.0767 | −0.0043, 0.0091, 0.0342, 0.0532 | −0.0063, 0.0090, 0.0339, 0.0769 |
| 600036 | −0.0070, 0.0043, 0.0207, 0.0697 | −0.0056, 0.0103, 0.0352, 0.0687 | −0.0090, 0.0006, 0.0222, 0.0490 |
| 600048 | −0.0007, 0.0128, 0.0257, 0.0890 | −0.0046, 0.0172, 0.0407, 0.0748 | −0.0012, 0.0106, 0.0262, 0.0580 |
| 600104 | |||
| 600196 | |||
| 600276 | |||
| 600519 | |||
| 600690 | |||
| 600703 | |||
| 600837 | |||
| 601111 | |||
| 601166 | |||
| 601186 | |||
| 601211 | |||
| 601229 | 2 | ||
| 601288 | |||
| 601318 | |||
| 601328 | |||
| 601336 | |||
| 601398 | |||
| 601601 | |||
| 601628 | |||
| 601668 | |||
| 601688 | |||
| 601766 | |||
| 601800 | |||
| 601818 | |||
| 601857 | |||
| 601888 | |||
| 601939 |
| Security i | K = 5 | K = 10 | K = 15 | ||||||
|---|---|---|---|---|---|---|---|---|---|
| t = 1 | t = 2 | t = 3 | t = 1 | t = 2 | t = 3 | t = 1 | t = 2 | t = 3 | |
| 1 | 0.000000 | 0.000000 | 0.000000 | 0.000000 | 0.000000 | 0.000000 | 0.000000 | 0.001754 | 0.037900 |
| 2 | 0.000000 | 0.260869 | 0.000000 | 0.000000 | 0.000000 | 0.000000 | 0.000000 | 0.000000 | 0.095089 |
| 3 | 0.000000 | 0.000000 | 0.320645 | 0.000000 | 0.000000 | 0.000000 | 0.000000 | 0.130874 | 0.000000 |
| 4 | 0.000000 | 0.000000 | 0.000000 | 0.000000 | 0.000000 | 0.000000 | 0.068375 | 0.023831 | 0.153749 |
| 5 | 0.000000 | 0.000000 | 0.000000 | 0.000000 | 0.000000 | 0.085218 | 0.011456 | 0.000000 | 0.000000 |
| 6 | 0.000000 | 0.000000 | 0.000000 | 0.000000 | 0.000000 | 0.000000 | 0.030715 | 0.000000 | 0.017278 |
| 7 | 0.000000 | 0.000000 | 0.000000 | 0.100455 | 0.000000 | 0.023266 | 0.059278 | 0.072255 | 0.000000 |
| 8 | 0.000000 | 0.000000 | 0.000000 | 0.000000 | 0.150548 | 0.000000 | 0.102979 | 0.096101 | 0.000000 |
| 9 | 0.000000 | 0.000000 | 0.000000 | 0.000000 | 0.199465 | 0.000000 | 0.103765 | 0.100637 | 0.000000 |
| 10 | 0.000000 | 0.146264 | 0.000000 | 0.100075 | 0.212776 | 0.000000 | 0.000000 | 0.000000 | 0.000000 |
| 11 | 0.000000 | 0.000000 | 0.000000 | 0.000000 | 0.097569 | 0.000000 | 0.104372 | 0.007608 | 0.055814 |
| 12 | 0.000000 | 0.000000 | 0.000000 | 0.100071 | 0.000000 | 0.025909 | 0.000000 | 0.002632 | 0.000000 |
| 13 | 0.000000 | 0.000000 | 0.000000 | 0.100569 | 0.000000 | 0.000000 | 0.052732 | 0.000000 | 0.000000 |
| 14 | 0.000000 | 0.000000 | 0.000000 | 0.000000 | 0.000000 | 0.000000 | 0.086246 | 0.000000 | 0.054818 |
| 15 | 0.000000 | 0.000000 | 0.000000 | 0.000000 | 0.000000 | 0.000000 | 0.016176 | 0.064958 | 0.043020 |
| 16 | 0.141721 | 0.000000 | 0.000000 | 0.000000 | 0.000000 | 0.000000 | 0.000000 | 0.000000 | 0.000000 |
| 17 | 0.187437 | 0.000000 | 0.000000 | 0.100380 | 0.028916 | 0.000000 | 0.098534 | 0.061085 | 0.071520 |
| 18 | 0.000000 | 0.000000 | 0.015706 | 0.000000 | 0.000000 | 0.000000 | 0.000000 | 0.000000 | 0.000000 |
| 19 | 0.000000 | 0.000000 | 0.000000 | 0.000000 | 0.000000 | 0.000000 | 0.103191 | 0.000000 | 0.012031 |
| 20 | 0.000000 | 0.225638 | 0.000000 | 0.097519 | 0.000000 | 0.000000 | 0.000000 | 0.000000 | 0.000000 |
| 21 | 0.000000 | 0.000000 | 0.000000 | 0.000000 | 0.072464 | 0.118195 | 0.004876 | 0.000000 | 0.083993 |
| 22 | 0.000000 | 0.194206 | 0.000000 | 0.100068 | 0.000000 | 0.029936 | 0.091445 | 0.142546 | 0.095191 |
| 23 | 0.000000 | 0.000000 | 0.000000 | 0.000000 | 0.000000 | 0.056751 | 0.000000 | 0.000000 | 0.058997 |
| 24 | 0.000000 | 0.173023 | 0.276908 | 0.000000 | 0.035396 | 0.258969 | 0.065862 | 0.055453 | 0.000000 |
| 25 | 0.241831 | 0.000000 | 0.253158 | 0.000000 | 0.000000 | 0.050349 | 0.000000 | 0.000000 | 0.000000 |
| 26 | 0.000000 | 0.000000 | 0.000000 | 0.100271 | 0.063890 | 0.000000 | 0.000000 | 0.079067 | 0.031997 |
| 27 | 0.249027 | 0.000000 | 0.000000 | 0.100194 | 0.000000 | 0.000000 | 0.000000 | 0.000000 | 0.100381 |
| 28 | 0.000000 | 0.000000 | 0.000000 | 0.000000 | 0.053445 | 0.249357 | 0.000000 | 0.000000 | 0.000000 |
| 29 | 0.000000 | 0.000000 | 0.000000 | 0.000000 | 0.085530 | 0.000000 | 0.000000 | 0.084817 | 0.088223 |
| 30 | 0.179984 | 0.000000 | 0.133583 | 0.100399 | 0.000000 | 0.102050 | 0.000000 | 0.076382 | 0.000000 |
| risk | 0.000371 | 0.000533 | 0.000671 | 0.000310 | 0.000691 | 0.000546 | 0.000428 | 0.000580 | 0.000524 |
| return | 0.004207 | 0.009109 | 0.015064 | 0.004019 | 0.009481 | 0.012509 | 0.005390 | 0.008867 | 0.013460 |
| Security i | K = 20 | K = 25 | ||||
|---|---|---|---|---|---|---|
| t = 1 | t = 2 | t = 3 | t = 1 | t = 2 | t = 3 | |
| 1 | 0.000000 | 0.003352 | 0.057986 | 0.041797 | 0.063562 | 0.054045 |
| 2 | 0.049885 | 0.086630 | 0.000000 | 0.038638 | 0.000000 | 0.058458 |
| 3 | 0.050277 | 0.072789 | 0.051490 | 0.033949 | 0.034032 | 0.014626 |
| 4 | 0.051452 | 0.050446 | 0.071125 | 0.000000 | 0.050883 | 0.058843 |
| 5 | 0.049866 | 0.041012 | 0.007240 | 0.042693 | 0.013818 | 0.046176 |
| 6 | 0.049829 | 0.000000 | 0.009403 | 0.042647 | 0.000000 | 0.063794 |
| 7 | 0.000000 | 0.000000 | 0.000000 | 0.029914 | 0.050383 | 0.053468 |
| 8 | 0.000000 | 0.091543 | 0.000000 | 0.042189 | 0.057238 | 0.021875 |
| 9 | 0.048101 | 0.031988 | 0.000000 | 0.042481 | 0.000000 | 0.000000 |
| 10 | 0.000000 | 0.000000 | 0.068983 | 0.041510 | 0.000000 | 0.030155 |
| 11 | 0.051797 | 0.000000 | 0.113017 | 0.000000 | 0.058653 | 0.048256 |
| 12 | 0.000000 | 0.000000 | 0.096745 | 0.040023 | 0.047882 | 0.020202 |
| 13 | 0.049857 | 0.054944 | 0.000000 | 0.041980 | 0.015022 | 0.061777 |
| 14 | 0.049586 | 0.065261 | 0.000000 | 0.029960 | 0.057192 | 0.000000 |
| 15 | 0.000000 | 0.000000 | 0.034832 | 0.040822 | 0.002838 | 0.019790 |
| 16 | 0.000000 | 0.043153 | 0.040450 | 0.042690 | 0.033376 | 0.054462 |
| 17 | 0.049709 | 0.000000 | 0.000000 | 0.042689 | 0.012283 | 0.017952 |
| 18 | 0.000000 | 0.063281 | 0.056330 | 0.041959 | 0.024937 | 0.000000 |
| 19 | 0.049626 | 0.077864 | 0.011921 | 0.042232 | 0.060160 | 0.032515 |
| 20 | 0.053492 | 0.025012 | 0.049093 | 0.038909 | 0.009951 | 0.061689 |
| 21 | 0.000000 | 0.082726 | 0.051317 | 0.000000 | 0.047563 | 0.024170 |
| 22 | 0.049775 | 0.023012 | 0.000000 | 0.000000 | 0.062615 | 0.011303 |
| 23 | 0.049600 | 0.094477 | 0.109376 | 0.038930 | 0.010610 | 0.031247 |
| 24 | 0.049711 | 0.000000 | 0.041161 | 0.042179 | 0.062156 | 0.000000 |
| 25 | 0.048725 | 0.064740 | 0.058407 | 0.035975 | 0.059785 | 0.046954 |
| 26 | 0.000000 | 0.016993 | 0.012510 | 0.000000 | 0.000000 | 0.000000 |
| 27 | 0.050148 | 0.000000 | 0.008849 | 0.041053 | 0.026207 | 0.041300 |
| 28 | 0.049151 | 0.000000 | 0.049765 | 0.042251 | 0.058546 | 0.054184 |
| 29 | 0.049863 | 0.002572 | 0.000000 | 0.039834 | 0.061081 | 0.011208 |
| 30 | 0.049550 | 0.008206 | 0.000000 | 0.049550 | 0.008206 | 0.000000 |
| risk | 0.000440 | 0.000620 | 0.000453 | 0.000425 | 0.000565 | 0.000492 |
| return | 0.005655 | 0.010977 | 0.015419 | 0.005818 | 0.009633 | 0.013472 |
| Security i | = 0.002 | = 0.005 | = 0.01 | ||||||
|---|---|---|---|---|---|---|---|---|---|
| t = 1 | t = 2 | t = 3 | t = 1 | t = 2 | t = 3 | t = 1 | t = 2 | t = 3 | |
| 1 | 0.000000 | 0.046773 | 0.111659 | 0.068361 | 0.000000 | 0.000000 | 0.000000 | 0.033350 | 0.000000 |
| 2 | 0.000000 | 0.000000 | 0.020950 | 0.069255 | 0.000000 | 0.000000 | 0.083086 | 0.105600 | 0.016413 |
| 3 | 0.000000 | 0.000000 | 0.000000 | 0.000000 | 0.057633 | 0.000000 | 0.000000 | 0.041518 | 0.090919 |
| 4 | 0.000000 | 0.095427 | 0.000000 | 0.069637 | 0.005565 | 0.000000 | 0.000000 | 0.000000 | 0.000000 |
| 5 | 0.000000 | 0.000000 | 0.000000 | 0.000000 | 0.000000 | 0.076553 | 0.057422 | 0.094949 | 0.084346 |
| 6 | 0.045850 | 0.000000 | 0.000000 | 0.067915 | 0.083802 | 0.000000 | 0.000000 | 0.000000 | 0.000000 |
| 7 | 0.124599 | 0.000000 | 0.000000 | 0.069635 | 0.000000 | 0.038970 | 0.000000 | 0.000000 | 0.000000 |
| 8 | 0.084286 | 0.017359 | 0.000000 | 0.000000 | 0.060973 | 0.022504 | 0.000000 | 0.000000 | 0.000000 |
| 9 | 0.000000 | 0.000000 | 0.000000 | 0.000000 | 0.000000 | 0.122943 | 0.000000 | 0.102052 | 0.000000 |
| 10 | 0.000000 | 0.017645 | 0.000000 | 0.068830 | 0.000000 | 0.017324 | 0.000000 | 0.000000 | 0.056520 |
| 11 | 0.103747 | 0.000000 | 0.083774 | 0.069302 | 0.000000 | 0.000000 | 0.061800 | 0.000000 | 0.000000 |
| 12 | 0.038348 | 0.000000 | 0.000000 | 0.000000 | 0.060423 | 0.089116 | 0.038226 | 0.081505 | 0.031321 |
| 13 | 0.061500 | 0.000000 | 0.124855 | 0.063063 | 0.089643 | 0.157392 | 0.039901 | 0.011992 | 0.115158 |
| 14 | 0.000000 | 0.034908 | 0.011125 | 0.000000 | 0.000000 | 0.000000 | 0.041489 | 0.053676 | 0.000000 |
| 15 | 0.000000 | 0.060808 | 0.000000 | 0.000000 | 0.080901 | 0.030171 | 0.107298 | 0.000000 | 0.021464 |
| 16 | 0.088236 | 0.000000 | 0.128272 | 0.059176 | 0.000000 | 0.031123 | 0.000000 | 0.042125 | 0.000000 |
| 17 | 0.040637 | 0.000000 | 0.005354 | 0.000000 | 0.087499 | 0.000000 | 0.020544 | 0.000000 | 0.000000 |
| 18 | 0.034735 | 0.095370 | 0.048185 | 0.000000 | 0.000000 | 0.093408 | 0.000000 | 0.000000 | 0.098859 |
| 19 | 0.000000 | 0.000000 | 0.059499 | 0.069532 | 0.064896 | 0.000000 | 0.073200 | 0.000000 | 0.070524 |
| 20 | 0.000000 | 0.033224 | 0.000000 | 0.069345 | 0.000000 | 0.063452 | 0.000000 | 0.084927 | 0.000000 |
| 21 | 0.047227 | 0.069396 | 0.102351 | 0.068979 | 0.000000 | 0.019459 | 0.039104 | 0.058219 | 0.000000 |
| 22 | 0.119812 | 0.096599 | 0.000000 | 0.065804 | 0.000000 | 0.022897 | 0.070376 | 0.024588 | 0.000000 |
| 23 | 0.000000 | 0.000000 | 0.077829 | 0.000000 | 0.095586 | 0.155252 | 0.000000 | 0.048088 | 0.031246 |
| 24 | 0.041352 | 0.092040 | 0.044985 | 0.000000 | 0.077328 | 0.000000 | 0.000000 | 0.113095 | 0.009509 |
| 25 | 0.000000 | 0.000000 | 0.034745 | 0.000000 | 0.028583 | 0.000000 | 0.000000 | 0.000000 | 0.000000 |
| 26 | 0.000000 | 0.067036 | 0.000000 | 0.000000 | 0.046137 | 0.059434 | 0.153348 | 0.000000 | 0.054151 |
| 27 | 0.050040 | 0.000000 | 0.000000 | 0.000000 | 0.000000 | 0.000000 | 0.000000 | 0.000000 | 0.000000 |
| 28 | 0.084958 | 0.087377 | 0.103804 | 0.069608 | 0.100100 | 0.000000 | 0.100519 | 0.000000 | 0.055604 |
| 29 | 0.000000 | 0.082371 | 0.042614 | 0.000000 | 0.060930 | 0.000000 | 0.032011 | 0.104317 | 0.165089 |
| 30 | 0.034674 | 0.103668 | 0.000000 | 0.051561 | 0.000000 | 0.000000 | 0.081675 | 0.000000 | 0.098878 |
| risk | 0.000327 | 0.000516 | 0.000439 | 0.000360 | 0.000576 | 0.000469 | 0.000413 | 0.000582 | 0.000549 |
| return | 0.005332 | 0.009883 | 0.013324 | 0.004959 | 0.010059 | 0.012510 | 0.006122 | 0.010941 | 0.017473 |
| Lower Bound | Mean | SD | Objective Value | Time | ||||
|---|---|---|---|---|---|---|---|---|
| l_it = 0.002 | 0.007021 | 0.028539 | 0.001281 | 12.538912 | ||||
| l_it = 0.005 | 0.006241 | 0.027529 | 0.001405 | 12.207077 | ||||
| l_it = 0.01 | 0.011703 | 0.034536 | 0.001544 | 12.149167 |
| Security i | = 0.4 | = 0.5 | = 0.6 | ||||||
|---|---|---|---|---|---|---|---|---|---|
| t = 1 | t = 2 | t = 3 | t = 1 | t = 2 | t = 3 | t = 1 | t = 2 | t = 3 | |
| 1 | 0.080231 | 0.000000 | 0.039102 | 0.068361 | 0.000000 | 0.000000 | 0.068794 | 0.108239 | 0.000000 |
| 2 | 0.000000 | 0.099757 | 0.064892 | 0.069255 | 0.000000 | 0.000000 | 0.069760 | 0.130889 | 0.058319 |
| 3 | 0.052485 | 0.099637 | 0.000000 | 0.000000 | 0.057633 | 0.000000 | 0.066071 | 0.000000 | 0.000000 |
| 4 | 0.000000 | 0.000000 | 0.029532 | 0.069637 | 0.005565 | 0.000000 | 0.000000 | 0.000000 | 0.060695 |
| 5 | 0.082538 | 0.000000 | 0.000000 | 0.000000 | 0.000000 | 0.076553 | 0.000000 | 0.036671 | 0.000000 |
| 6 | 0.000000 | 0.039757 | 0.000000 | 0.067915 | 0.083802 | 0.000000 | 0.068631 | 0.000000 | 0.000000 |
| 7 | 0.094233 | 0.053709 | 0.070848 | 0.069635 | 0.000000 | 0.038970 | 0.054559 | 0.000000 | 0.050357 |
| 8 | 0.094527 | 0.096845 | 0.000000 | 0.000000 | 0.060973 | 0.022504 | 0.057336 | 0.000000 | 0.017014 |
| 9 | 0.000000 | 0.092314 | 0.094660 | 0.000000 | 0.000000 | 0.122943 | 0.068293 | 0.000000 | 0.109344 |
| 10 | 0.000000 | 0.000000 | 0.000000 | 0.068830 | 0.000000 | 0.017324 | 0.070105 | 0.000000 | 0.000000 |
| 11 | 0.083807 | 0.088190 | 0.000000 | 0.069302 | 0.000000 | 0.000000 | 0.000000 | 0.130683 | 0.130980 |
| 12 | 0.094568 | 0.000000 | 0.000000 | 0.000000 | 0.060423 | 0.089116 | 0.000000 | 0.073400 | 0.000000 |
| 13 | 0.028221 | 0.020500 | 0.008767 | 0.063063 | 0.089643 | 0.157392 | 0.000000 | 0.000000 | 0.114202 |
| 14 | 0.000000 | 0.000000 | 0.069430 | 0.000000 | 0.000000 | 0.000000 | 0.000000 | 0.061677 | 0.128340 |
| 15 | 0.000000 | 0.000000 | 0.000000 | 0.000000 | 0.080901 | 0.030171 | 0.000000 | 0.035777 | 0.031686 |
| 16 | 0.000000 | 0.000000 | 0.075869 | 0.059176 | 0.000000 | 0.031123 | 0.000000 | 0.000000 | 0.000000 |
| 17 | 0.000000 | 0.072827 | 0.058336 | 0.000000 | 0.087499 | 0.000000 | 0.068553 | 0.000000 | 0.053088 |
| 18 | 0.092417 | 0.000000 | 0.066818 | 0.000000 | 0.000000 | 0.093408 | 0.070217 | 0.046066 | 0.000000 |
| 19 | 0.014761 | 0.000000 | 0.096427 | 0.069532 | 0.064896 | 0.000000 | 0.000000 | 0.000000 | 0.011680 |
| 20 | 0.000000 | 0.000000 | 0.000000 | 0.069345 | 0.000000 | 0.063452 | 0.066718 | 0.047670 | 0.000000 |
| 21 | 0.033649 | 0.088559 | 0.096362 | 0.068979 | 0.000000 | 0.019459 | 0.000000 | 0.086889 | 0.054412 |
| 22 | 0.000000 | 0.000000 | 0.035981 | 0.065804 | 0.000000 | 0.022897 | 0.000000 | 0.000000 | 0.000000 |
| 23 | 0.090049 | 0.000000 | 0.000000 | 0.000000 | 0.095586 | 0.155252 | 0.000000 | 0.085757 | 0.000000 |
| 24 | 0.000000 | 0.000000 | 0.000000 | 0.000000 | 0.077328 | 0.000000 | 0.000000 | 0.000000 | 0.000000 |
| 25 | 0.004080 | 0.011780 | 0.000000 | 0.000000 | 0.028583 | 0.000000 | 0.069433 | 0.003612 | 0.000000 |
| 26 | 0.000000 | 0.000000 | 0.098552 | 0.000000 | 0.046137 | 0.059434 | 0.062817 | 0.015008 | 0.000000 |
| 27 | 0.069308 | 0.068958 | 0.000000 | 0.000000 | 0.000000 | 0.000000 | 0.000000 | 0.021664 | 0.071641 |
| 28 | 0.085128 | 0.071407 | 0.094424 | 0.069608 | 0.100100 | 0.000000 | 0.070001 | 0.000000 | 0.039248 |
| 29 | 0.000000 | 0.029190 | 0.000000 | 0.000000 | 0.060930 | 0.000000 | 0.000000 | 0.000000 | 0.000000 |
| 30 | 0.000000 | 0.066573 | 0.000000 | 0.051561 | 0.000000 | 0.000000 | 0.068711 | 0.115998 | 0.068995 |
| risk | 0.000330 | 0.000630 | 0.000504 | 0.000360 | 0.000576 | 0.000469 | 0.000384 | 0.000567 | 0.000571 |
| return | 0.007124 | 0.012673 | 0.015587 | 0.004959 | 0.010059 | 0.012510 | 0.005864 | 0.010219 | 0.013297 |
| Upper Bound | Mean | SD | Objective Value | Time | ||||
|---|---|---|---|---|---|---|---|---|
| u_it = 0.4 | 0.014072 | 0.035384 | 0.001464 | 12.31108 | ||||
| u_it = 0.5 | 0.006241 | 0.027529 | 0.001405 | 12.207077 | ||||
| u_it = 0.6 | 0.007968 | 0.029380 | 0.001522 | 12.331869 |
| Cardinal | Algorithm | Mean | SD | Objective Value | Time | ||||
|---|---|---|---|---|---|---|---|---|---|
| k = 5 | IGA | 0.018378 | 0.034959 | 0.001293 | 12.305498 | ||||
| I-GA | 0.013202 | 0.032589 | 0.001530 | 12.366694 | |||||
| GGA | 0.012557 | 0.033154 | 0.001715 | 12.307717 | |||||
| GA | 0.012938 | 0.036521 | 0.001479 | 12.254093 | |||||
| DE | 0.011473 | 0.031870 | 0.001585 | 12.314597 | |||||
| k = 10 | IGA | 0.014305 | 0.034980 | 0.001385 | 12.179674 | ||||
| I-GA | 0.009163 | 0.027743 | 0.001537 | 12.390631 | |||||
| GGA | 0.009837 | 0.032921 | 0.001431 | 12.398594 | |||||
| GA | 0.011915 | 0.031510 | 0.001481 | 12.339224 | |||||
| DE | 0.010652 | 0.032235 | 0.001550 | 12.266834 | |||||
| k = 15 | IGA | 0.012379 | 0.033606 | 0.001466 | 12.248432 | ||||
| I-GA | 0.009752 | 0.031480 | 0.001471 | 12.335145 | |||||
| GGA | 0.012197 | 0.032014 | 0.001577 | 12.306202 | |||||
| GA | 0.010192 | 0.033471 | 0.001459 | 12.375541 | |||||
| DE | 0.010411 | 0.032232 | 0.001537 | 12.275137 | |||||
| k = 20 | IGA | 0.013350 | 0.034879 | 0.001462 | 12.231906 | ||||
| I-GA | 0.008593 | 0.030872 | 0.001474 | 12.276594 | |||||
| GGA | 0.011404 | 0.033155 | 0.001487 | 12.293927 | |||||
| GA | 0.010079 | 0.032058 | 0.001527 | 12.249116 | |||||
| DE | 0.010331 | 0.032180 | 0.001468 | 12.199623 | |||||
| k = 25 | IGA | 0.012503 | 0.033981 | 0.001466 | 12.420597 | ||||
| I-GA | 0.011209 | 0.033081 | 0.001490 | 12.574274 | |||||
| GGA | 0.011450 | 0.033385 | 0.001479 | 12.358661 | |||||
| GA | 0.008981 | 0.030773 | 0.001493 | 12.415204 | |||||
| DE | 0.010795 | 0.032754 | 0.001509 | 12.542644 |
| Cost Rate | Algorithm | Mean | SD | Objective Value | Time | ||||
|---|---|---|---|---|---|---|---|---|---|
| 0 | IGA | 0.042592 | 0.001486 | 0.001493 | 12.148158 | ||||
| I-GA | 0.034252 | 0.047509 | 0.050048 | 12.334505 | |||||
| GGA | 0.041453 | 0.051617 | 0.001502 | 12.285395 | |||||
| GA | 0.036532 | 0.051631 | 0.001507 | 12.289878 | |||||
| DE | 0.038800 | 0.050535 | 0.001517 | 12.409885 | |||||
| 0.003 | IGA | 0.012632 | 0.030601 | 0.001460 | 12.302401 | ||||
| I-GA | 0.009295 | 0.031376 | 0.001492 | 12.613548 | |||||
| GGA | 0.011425 | 0.033067 | 0.001472 | 12.307118 | |||||
| GA | 0.008632 | 0.034125 | 0.001545 | 12.200709 | |||||
| DE | 0.010084 | 0.031189 | 0.001468 | 12.205157 | |||||
| 0.005 | IGA | 0.002530 | 0.019700 | 0.001480 | 12.174379 | ||||
| I-GA | 0.002667 | 0.020372 | 0.001501 | 12.405563 | |||||
| GGA | 0.005054 | 0.024556 | 0.001540 | 12.334962 | |||||
| GA | 0.003183 | 0.021184 | 0.001448 | 12.338755 | |||||
| DE | 0.003022 | 0.020521 | 0.001472 | 12.300000 |
| Iteration | Algorithm | Mean | SD | Objective Value | Time | ||||
|---|---|---|---|---|---|---|---|---|---|
| 100 | IGA | 0.011050 | 0.034275 | 0.001475 | 6.195688 | ||||
| I-GA | 0.009307 | 0.031197 | 0.001478 | 6.160365 | |||||
| GGA | 0.012766 | 0.030225 | 0.001534 | 6.192599 | |||||
| GA | 0.008556 | 0.032842 | 0.001512 | 6.185103 | |||||
| DE | 0.009402 | 0.031101 | 0.001486 | 6.147192 | |||||
| 200 | IGA | 0.011181 | 0.034320 | 0.001453 | 12.249210 | ||||
| I-GA | 0.009343 | 0.033410 | 0.001478 | 12.337585 | |||||
| GGA | 0.010524 | 0.032203 | 0.001517 | 12.199484 | |||||
| GA | 0.013297 | 0.031608 | 0.001516 | 12.305086 | |||||
| DE | 0.009937 | 0.032183 | 0.001523 | 12.209633 | |||||
| 300 | IGA | 0.009124 | 0.031099 | 0.001319 | 18.292692 | ||||
| I-GA | 0.010575 | 0.032253 | 0.001514 | 18.481712 | |||||
| GGA | 0.012394 | 0.033947 | 0.001518 | 18.281167 | |||||
| GA | 0.010786 | 0.032489 | 0.001475 | 18.459560 | |||||
| DE | 0.007975 | 0.028906 | 0.001437 | 18.202808 |
| Parameter | IGA | I-GA | GGA | GA | DE |
|---|---|---|---|---|---|
| Cardinal | 52.5% | 15% | 7.5% | 12.5% | 12.5% |
| Cost rate | 58.33% | 4.16% | 8.33 % | 16.67% | 12.5% |
| Iteration | 58.33% | 0 | 16.67 % | 4.16% | 20.83% |
Disclaimer/Publisher’s Note: The statements, opinions and data contained in all publications are solely those of the individual author(s) and contributor(s) and not of MDPI and/or the editor(s). MDPI and/or the editor(s) disclaim responsibility for any injury to people or property resulting from any ideas, methods, instructions or products referred to in the content. |
© 2024 by the authors. Licensee MDPI, Basel, Switzerland. This article is an open access article distributed under the terms and conditions of the Creative Commons Attribution (CC BY) license (https://creativecommons.org/licenses/by/4.0/).
Share and Cite
Hu, C.; Gao, Y.; Guo, E. A Novel Improved Genetic Algorithm for Multi-Period Fractional Programming Portfolio Optimization Model in Fuzzy Environment. Mathematics 2024, 12, 1694. https://doi.org/10.3390/math12111694
Hu C, Gao Y, Guo E. A Novel Improved Genetic Algorithm for Multi-Period Fractional Programming Portfolio Optimization Model in Fuzzy Environment. Mathematics. 2024; 12(11):1694. https://doi.org/10.3390/math12111694
Chicago/Turabian StyleHu, Chenyang, Yuelin Gao, and Eryang Guo. 2024. "A Novel Improved Genetic Algorithm for Multi-Period Fractional Programming Portfolio Optimization Model in Fuzzy Environment" Mathematics 12, no. 11: 1694. https://doi.org/10.3390/math12111694
APA StyleHu, C., Gao, Y., & Guo, E. (2024). A Novel Improved Genetic Algorithm for Multi-Period Fractional Programming Portfolio Optimization Model in Fuzzy Environment. Mathematics, 12(11), 1694. https://doi.org/10.3390/math12111694