Abstract
The growing population and lack of change in resources of cultivated land have led to the search for more efficient farming solutions. The recovery of soil is facilitated by using chemicals designed for the enrichment of cultivated soil. Fertilisers are made of a combination of various substances that determine not only the chemical but also the shape characteristics of the fertiliser pellets. The effect of the quality of fertilisation on yield size is related to even distribution. Shape and size are closely related to the quality of the fertilisation process. The intense control of the production process would not be possible without automatised and quick measurements within the production line. Constant control is necessary to ensure that the products meet quality standards. The contactless assessment of pellet sizes allows a quick reaction to changes in production quality and reduces the costs arising from the reprocessing of defective pellets. The results of the assessment of pellet volume using their two-dimensional image are presented in this publication. Pellets must be analysed according to their most characteristic position, which can provide valuable information about their properties. The aim is to determine the placement positions of the equipment based on calculations and to compare the results with those of gold-standard equipment. Correctly calibrated equipment ensures that the measurement results match the results of the control equipment of fertiliser producers. Reliable non-contact measurements can reduce the reaction time to production changes.
MSC:
93-05
1. Introduction
The granular form of materials is widely used in various industries. One of the main uses of the granular form is as a transitional raw material for the production of various products. Such a form allows for the convenient transportation and rationing of fertiliser within the manufacturing process. In the case of the fertilisation of cultivated land, pellet forms allow for achieving long-distance fertilisation [1] and even the distribution of fertilisers. One of the main parameters of the quality of granular products is the shape of the pellets. The shortcomings of sieving techniques widely used in manufacturing plants do not allow for a detailed assessment of the pellet surface’s shape. However, this technique, as the gold standard, is used for the assessment of the granulometric composition in relation to mass. The contactless assessment technique for pellets based on the processing of digital images increases the frequency of measurements (as it is difficult to automatise) and the number of analysed parameters (form, colour, and size parameters [2,3]).
One of the most widely used methods of fertilizer production in the industry is the use of a drying tower. While falling in the drying tower, pellets collide with the opposite airflow and crystallize, while residues of the melted mixture of chemical substances settle on the perforated plates, which gradually clogs them up. This leads to decreased production capacities, increased fine fractions, and increased pellet diameter dispersion, and the quality parameters of production fall below the tolerance limit. After the identification of such changes, the equipment must be washed by stopping the entire technological process. The currently used sieving method is time-consuming because of the required preparation and transportation of samples. The objective evaluation of the clogging of equipment can be carried out using a contactless measuring method. Because of the high efficiency of computer equipment, the method of digital image processing can be considered one of the most promising contactless pellet-measuring methods. This measurement method allows for saving the image of every separate pellet and examining it later using different image processing algorithms. Measuring more than 10 times faster compared to traditional direct measuring methods would allow the precise determination of early contamination, ensure the rational performance of equipment, and minimize the amount of fine fraction.
The surface texture of fertiliser pellets is precisely assessed by taking detailed measurements using microscopes and video cameras. However, the slow measurement process affects the latency of the reaction to changes in quality parameters. The rapid development of computer equipment constantly enhances the conditions for using more complex measuring algorithms. This is the reason for the increase in the adoption of 3D processing methods in the field of particle assessment [4,5,6]. However, the use of this method is not always the most rational choice. It usually creates difficulties in technology application and result verification. In the first case, a compact system structure is required for the analysis of fine fertiliser pellets. Three-dimensional scanning equipment often takes up a lot of space or requires special arrangement. In the second case, it is difficult to verify the reliability of results using simple methods. Since the sieving method used by manufacturers is often considered the gold standard, an analysis of regularly shaped pellets leads to discrepancies between the results (the results of an analysis of regular pellets match [7]). The 3D processing technique provides more information about pellets, but it also requires more video cameras and clearly defined pellet transportation methods; they must not overlap, and only a small number of pellets is allowed in the field of view. The 3D method also sets the limit for the minimum size of the measured pellets, whereas the 2D technique allows the assessment of pellets that are up to three times smaller [8].
2. Related Works
For determining the granulometric composition using the contactless method, it is very important to calculate the volume of pellets. Algorithms for the assessment of the granulometric composition of sand particles (one of the fields—analysis of raw materials of concrete [9]) are widely discussed in the literature by comparing the efficiency of 2D and 3D processing. Regular 2D DIA uses morphological operations by scanning the particles in random positions, whereas the system based on 3D DIA follows falling particles from 8 or 12 perspectives. Although 2D DIA cannot properly determine the largest and smallest axes of the particle, a statistical assessment of the shortest and longest sand particle axis can be calculated according to the smallest Feret diameter. The convexity of the pellets is insensitive to the resolutions used in this type of analysis, whereas its values are similar between 2D and 3D DIA. Research revealed that statistical analyses of the size and shape of pellets are possible and convenient when dynamic image analysis is used. Size parameters are relatively independent of technical equipment, whereas shape descriptions are more dependent on the algorithms used [8]. The 3D morphological features, including size (length, width, thickness, volume, and surface area) and shape (elongation, flatness, and sphericity) can be evaluated using 2D morphological features [10,11]. The SURF and BRIEF algorithms are used for the identification and analysis of features [12].
In scientific papers, interdependencies between the size and shape characteristics of 3D ellipsoids are analysed using their 2D equivalents [13]. The average radius of ellipsoids can be properly evaluated according to the median or statistical average of the average radius of respective projected 2D images [14]. However, respective 3D descriptions cannot always be reliably calculated according to the evaluated characteristics of the image’s form. Results show that the quantitative assessment of particle shape characteristics using 2D images can only be useful for pellets that are shaped similarly to the expansion of spheroids. The efficiency of forecasting is reduced as particles transform from spheroids to blades. By using the advantages of easily visualised ellipsoids, such examinations clearly show that 2D images can be used to draw conclusions about the characteristics of particle size and shape [14].
The roundness of particles is one of the main shape parameters influencing the micro- and microscopic mechanical features of granular material. Most present methods of particle roundness assessment are based on 2D algorithms that use the projection of particles. However, the morphology of particle projection is affected by subjectively selected projection angles. Correctly distinguished objects within visual information are particularly important (BLOB identification) [15]. Based on Waddell’s proven particle angle and particle roundness definitions, publication [16] provides innovative methods for the quantitative assessment of the 3D roundness of particles. Firstly, this method reconstructs the particle in a triangular mesh. Secondly, corner parts are identified by finding surface peaks with high local curvatures and relatively large connected areas. After corner identification, the sphere-filling method is used in order to fill the corner parts with spheres. Finally, 3D Waddell’s roundness is calculated by comparing the average radius of filling spheres with the ratio of the largest recorded sphere. After comparing the 3D and 2D roundness of these particles, it is evident that the proposed method can produce results that match 2D contour results [16].
The methods of 3D analysis often provide more information about the roughness of surfaces, while an object’s surface texture negatively affects the assessment of particles using 2D images [17]. More complex assessment methods of pellet shape, roundness, and compactness are based on X-ray micro-computed tomography. Such methods allow the simplification of a 3D model and the elimination of surface texture; by carrying these steps out, the corners of the surface can be distinguished more precisely [18].
Two-dimensional analysis methods are widely used for the analysis of statistical pellet shape parameters, such as aspect ratio, sphericity, roundness, or convexity. One of the main criteria of selection is fast measurement operations and the compact structure of the equipment. However, by combining the results of several cameras placed at different angles, a 3D model of pellets can be formed. In other cases, a connection between the 2D image’s conformity and its 3D shape can be searched for [19,20].
Algorithms of 2D image analysis provide sufficient information about pellets. However, one of the most important factors during the assessment of irregularly shaped pellets is the matching between the obtained results and the results of the control equipment. The division of areas that are limited by pellets into layers provides additional information, which, combined with the results of larger scope measurements, provides the results of contact measurements [13,21,22].
Three-dimensional image processing techniques allow for the detailed analysis of pellet surfaces and the precise calculation of their volume. However, such methods are not always the most rational choice because of the following:
- (1)
- The adoption of measuring equipment is complex and expensive (e.g., X-ray micro-computed tomography);
- (2)
- The insufficient assurance of measurement performance when exceptionally small particles are being measured (e.g., the average diameter of fertiliser pellets is ~3 mm);
- (3)
- Verifying the precision of measurements is difficult because laboratory equipment must be used as control equipment.
Analyses of two-dimensional images within the assessment of fertilisers make up the shortcomings of 3D methods. The granulometric composition of products matches the results obtained when using contact measurement methods that are used in the industry. High-performance computer equipment allows the analysis of irregularly shaped pellets by dividing them into layers. This is how the volume of the pellet is calculated. However, the main problem is the scanning of pellets using their characteristic angle. The characteristic angle is defined as the 2D image of the pellet, which shows its irregular shape.
3. Experiments
3.1. Materials and Methods
Due to the large production volumes of the fertiliser industry, fertiliser producers monitor the quality of production very carefully. Even slight deviations can lead to the reprocessing of hundreds of tons of fertiliser. Such actions increase energy usage and create conditions for the contamination of equipment, and this leads to downtime because it necessitates cleaning. The fine fraction of particles, large number of particles, and efficient production can only be controlled using contactless measurement methods. The choice of the 2D processing method was determined by fast measurement procedures.
In the fertiliser industry, production lines are designed for the production of fertilisers of specific chemical compositions. Therefore, pellets produced in these production lines are characterised by the same shape features (roundness, roughness, etc.). Results matching the results of control measurement equipment were obtained after applying corrections to granulometric composition results. Previous studies revealed the benefits of using linear video cameras [23]. However, when analysing irregularly shaped pellets, it is very important to scan them from a position that provides the largest amount of information.
Based on the results of previous studies [24], it was determined that the most precise volume calculation results are obtained by analysing images from two synchronically operating video cameras. In the same studies, it was observed that one of the most common geometric shapes is the ellipsoid. During non-contact measurements, based on digital image processing, the analyzed scan of the pellet image is two-dimensional; therefore, in calculations, we additionally use the width of the ellipsoid instead of one radius of the ellipsoid, which is equal to the depth of the image, and the other radius is used in Equation (1):
where is the radius of the ellipsoid, and is the length of the ellipsoid (ellipsoid scheme in Figure 1).
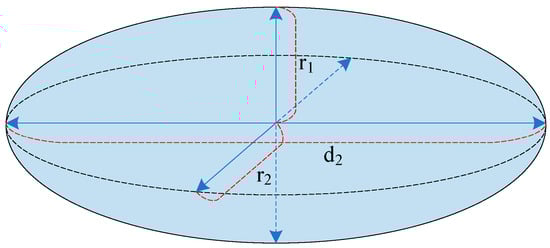
Figure 1.
The ellipse model [24].
Based on insights from a previous study [23], the area limited by the pellet’s silhouette is divided into layers of the shortest height. This height is equal to the height of one point of the image. Using this method, the area of the circle, which limits every layer, is calculated using Equation (2):
where is the area of the circle that limits the layer, and is the width of the ellipse layer (particle scheme in Figure 2).
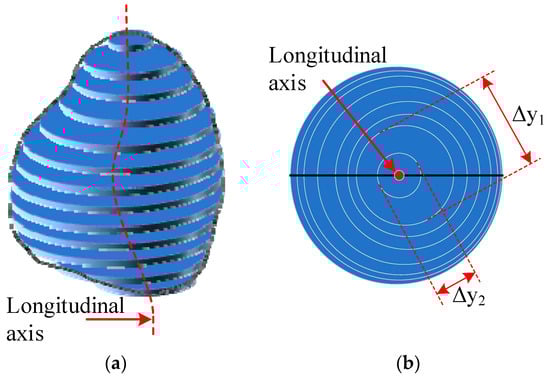
Figure 2.
The layering of an ellipse: (a) side view of an ellipse model; (b) top view of an ellipse model [24].
After filling the notch in the pellet with its convex shape, its depth can be rationally evaluated. The elliptical geometric shape fills the cross-section area of a pellet more precisely. A three-dimensional model of irregular pellets is presented in Figure 3 [23].
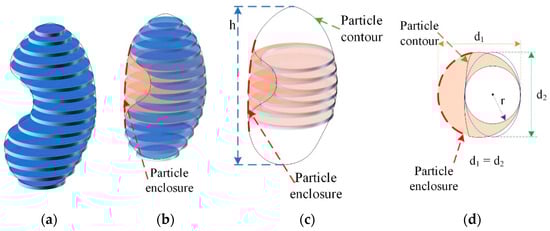
Figure 3.
Three-dimensional (3D) model of irregular pellets: (a) the pellet’s volume consists of the sum of layer circles; (b) the shape of the regular pellet is limited by the pellet’s envelope line; (c) discrepancy between irregular volumes and volumes limited by envelope line; (d) cross-section of pellet limited by its envelope line [24].
The volume is calculated by using both contours of the pellet—the real and notched areas limited by the envelope line. The pellet’s volume is divided into cross-section areas, for which their height is equal to one point of the image, and they are perpendicular to the longitudinal axis. Then, the pellet’s volume is calculated by integrating (according to Figure 3) Equations (3) and (4) [23]:
where S(h) is the area of the ellipse that limits the layer; r is half of the cross-section of the real area that is limited by the pellet; d2 is the diameter of the cross-section limited by the pellet’s envelope line; h is the length of a pellet, and it is perpendicular to the planes of the layers that limit it; V is the volume limited by the pellet [24].
Pellets are transported to the measurement position using a vibrational feeder traveling within the duct of the vibrating feeder. It is assumed that they are moving on the largest surface that overlaps with the plane because their movement on the narrow edge in relation to the plane would defy the principles of physics. Therefore, the opposing position of pellet scanning (Figure 2—position of the red video camera), where the largest area of the pellet region is distinguished, is the least characteristic. When pellets are assessed using the 2D perspective, discrepancies between results increase with an increase in volume. The form region limited by pellets that are rotated at a 90° angle (the view was scanned using the orange video camera shown in Figure 4) in relation to the longitudinal axis can be considered a characteristic position. Tests were carried out using a Basler raL2048-48gm linear video camera (Basler AG, Berlin, Germany), VS-Technology VS-L3528/F lens (VST Europe B. V, Amsterdam, The Netherlands Japan), Aviteq vibrating feeder KF1-2 (Aviteq Vibrationstechnik GmbH, Hattersheim, Germany), and CCS LFL series side lamps (CCS Inc., Woburn, MA, USA).
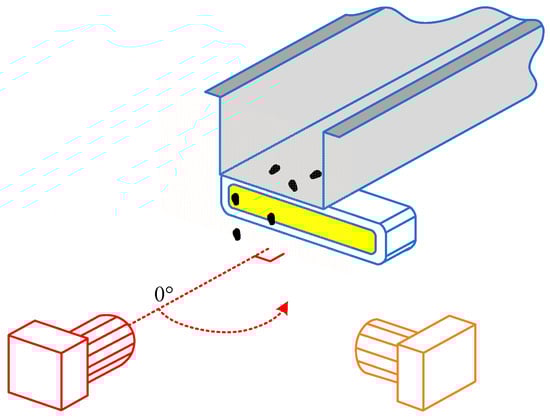
Figure 4.
The camera and vibroconveyor system for particle analysis.
The system was designed and assembled in a laboratory. Experiments were carried out using real products from the production line. Tests were carried out using mechanically resistant chemical substances that allow for repeated tests without the disintegration of their shape.
3.2. Effect of the Number of Cameras on the Measurements of Pellet Volume
The study was conducted in order to find out the effect of the pellet’s position in relation to the camera on volume measuring results. During the course of this study, pellet models were scanned using two video cameras, and their fields of view formed 0°, 15°, 30°, 45°, 60°, 75°, and 90° angles between each other (they synchronically scanned the view of the pellet’s outline from two different directions). The scope of the analysis reached up to 200 separate particles. Video cameras positioned at different angles allowed assessing the ellipticity parameters (diagonals) of a pellet. The obtained results (some results are provided in Table 1) were compared to the results obtained using the hydrostatic weighing method. Each measured object was immersed in a measuring cylinder containing water. The volume of the displaced water was measured using a 100 cm3 measuring cylinder (cylinder volume error is ±0.5 mL at 20 °C, MCHA-100-001) and a 10 cm3 measuring cylinder (cylinder volume error is ±0.1 mL at 20 °C temperature, MCHA-010-001). During the course of the experiment, the video cameras were positioned not only in relation to each other but also at a different angle relative to the pellet’s falling plane.

Table 1.
The estimation of the pellet’s volume from different positions.
The results of the study confirmed that the statistically most characteristic position of the pellet is achieved when the cameras are placed at 90° angles between each other. The positions scanned using one of the models are provided in Figure 5. The relative error of the most precise calculations, when the pellet volume is assessed using images from two cameras, is lower than 5%. This was calculated by evaluating the most precise results (bolded volume measurement results in Table 1) using the percentage error (an expression of the relative error), as shown in Formula (5):
where is the actual observed value, and is the most precise calculated value.
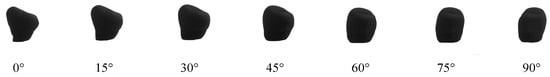
Figure 5.
Scanning of particles at different angles relative to their falling plane.
The obtained results allow us to state that the most precise volume calculation results, obtained via the assessment of the two-dimensional view of particles, can be ensured by analysing the images of two cameras that are perpendicular to each other. However, additional calculation resources are required for pellet volume assessments using two cameras. Also, the operation of two video cameras must be synchronised. The measurement system’s structure has an effect on measurement speeds. In an ideal case, particles should not cover each other at the time of scanning. The pellet flow’s increase can be achieved by using the improved shape of the vibrational feeder’s duct (Figure 6). There is no pellet flow overlap in the given example.
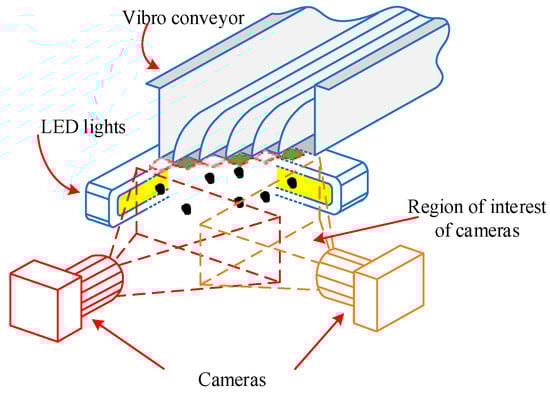
Figure 6.
Pellet scanning in two positions (avoids the overlap of pellet streams).
The shape of the vibrational feeder duct allows the assessment of the flow of more than one pellet during real measurements; therefore, it increases the speed of measurements. However, there is another problem—the varying distance between the camera and the pellets. In this case, the field of view must be divided into zones, which would have different coefficients assigned for the recalculation of the pellet’s size. Also, setting an appropriate focus depth for all analysis positions is difficult, even when diaphragm is slightly closed.
In order to ensure the quality and correctness of production measurement results, it is necessary to assess each particle of the sample. The individual assessment of each particle is ensured by using the special structure of vibrational feeder ducts, which form particle monolayers that prevent overlapping. A vibrational feeder is used with a sample that is taken according to regulated standards.
If a sample contains a flat pellet, its volume, which is scanned in the field of view of the camera using the standard duct of the vibrational feeder, will be assessed incorrectly. In order to maintain the measurement speed and retain the monolayer of analysed particles, a special technical solution for the modern vibrational feeders can be applied. At the time of the experiment, the special shape (Figure 7) of the duct of the vibration feeder was assessed. This shape was meant to modify the flow in order to form the characteristic position of the pellets when the pellets are assessed by analysing two-dimensional images. This duct shape allows the analysis of more than 20 pellet flows at the same time (width of the flow—1 pellet).
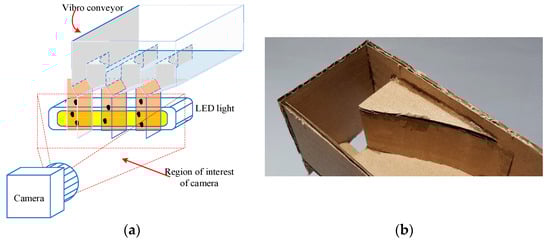
Figure 7.
(a) Sketch of a modernized vibroconveyor tray and (b) the layout of the tested trough.
Tests carried out using the modernised vibrational feeder confirmed the correct operational principle of the equipment. All pellets were scanned at their characteristic position, which provides the most amount of information about the shape of a pellet. When pellets are analysed by assessing their shape, dividing them into layers (areas are approximated as regions limited by ellipses), and using modernised duct shapes (Figure 7), the margin of error of the volume assessment is reduced. At consequent stages, the correction of the cumulative curve of pellet granulometric compositions is carried out, which reduces the error margins of results compared to the results of control equipment.
3.3. Effect of Pellet Scanning Positions on the Results of Granulometric Compositions
The model of the pellet volume assessment is best used with characteristic pellet shadow images. Such an assumption is made based on the measurement results of the shape of manufactured pellets. This leads to the statement that “notches” within pellets must be exhibited within the field of view of the camera. Therefore, experiments with real pellet products were carried out using the special shape of the vibrational feeder duct. The prototype used for taking measurements is shown in Figure 8.
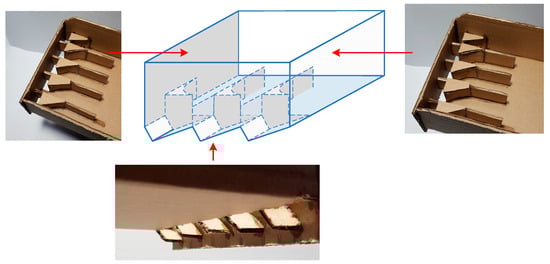
Figure 8.
Prototype of a conveyor used to evaluate particle size distributions.
By assessing the granulometric composition using a prototype of the vibrational feeder duct, the pellet sample’s flow position in relation to the field of view was changed. While particles moved within the duct of the feeder, at the end of the feeder, they rotated by 90° in relation to the video cameras. This action ensures the obtainment of a detailed scan of the pellet’s shadow. This view reveals the most significant irregularities of the pellet’s shape: for example, “notches”. Fifty samples from a real production line were used and analysed during the experiment. Each sample was analysed using the contact measurement method—sieving. After that, contactless measuring methods were used: scanning the images of pellets while using and not using the special shape of the duct. The number of pellets that meet the quality criteria was assessed; i.e., the number of pellets that are within the 1–4 mm diameter range was assessed. The obtained results are provided in Table 2 and Figure 9. The results obtained are presented in separate graphs for clarity. Figure 10, Figure 11 and Figure 12 show granulometric composition measurements when production quality (granule diameter in the range of 1–4 mm) numbers fall within the ranges of 85–90%, 90–95%, and 95–100%. As the quantity of products that meet the quality criteria decreases, measurement errors increase. However, it should be noted that the applied particle layering together with a special vibratory conveyor solution allows for obtaining uniform results in the entire production quality range.
Table 2.
Pellet measurements using a vibroconveyor prototype.
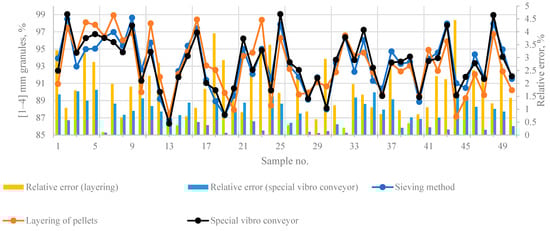
Figure 9.
Comparison of granulometric composition results using a special vibroconveyor prototype.
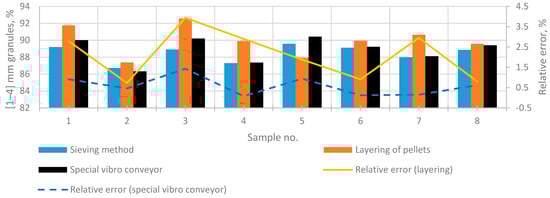
Figure 10.
Comparison of granulometric composition results (production quality in the range of [85–90].
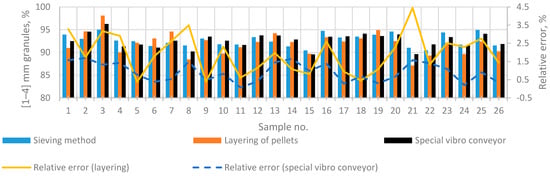
Figure 11.
Comparison of granulometric composition results (the quantity of quality production is reaching [90–95].
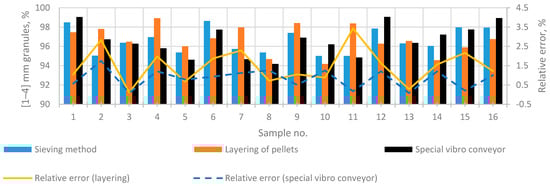
Figure 12.
Comparison of granulometric composition results (the quantity of quality production is reaching [95–100].
It was observed that the results of the tests matched the results of control equipment when the relative error was up to 4.45%. This was conditioned using the pellet volume assessment method, which divides the pellets into ellipses when the general convexity of the shape was assessed. The determined decrease in the roundness of the pellet’s shape in the case of contamination increased the dispersion of the results. Therefore, the prototype vibrational feeder shape was used, which helped scan the pellets at their most characteristic position. This action resulted in a decrease (down to 1.75%) in the relative error of measurements (when compared to the results of control equipment). The obtained results cannot be compared with other studies because such alternative methods have not been published. The proposed measurement method allows the reliable assessment of granulometric compositions via the analysis of two-dimensional images. The main advantages are simple measuring equipment and the high degree of conformity of results relative to the results of control equipment. Conformity with gold standard measurements allows fertiliser producers to rely on and easily verify the results using standard methods.
4. Conclusions
The benefit of non-contact particle size measurements is the rapid response to changes in pellet production. The proposed vibrational feeder duct shape solution allows for changing the mechanical sieving method to a much faster and fully automated one. The influence of the positioning of the particle scanning equipment on the measurements’ accuracy was determined. Two video cameras with a 90-degree angle between them were used to obtain the most accurate data. However, this benefit was achieved by analysing one pellet at a time, since ensuring the same transport conditions for all particles moving through the vibroconveyor was difficult, e.g., due to image focus. Therefore, tests were carried out by analysing pellets using one video camera. It was observed that the results of the tests matched the results of control equipment when the relative error was up to 4.45% (using the particle approximation method described in a previous study [24]). Meanwhile, after applying another modification of the transport trough using one video camera, it was possible to achieve a relative error that was lower than 2% by processing two-dimensional images and using the field of view of one camera. This was confirmed using measurements that were obtained by analysing irregularly shaped pellets. The method thus applied can be used to replace the mechanical measurement method.
Author Contributions
Conceptualization: D.A., A.L. and A.V.; methodology: A.L., D.A., D.N. and M.Z.; software: D.N., A.L. and J.R.; validation: D.A., A.V., M.Z., L.B., J.R., R.S., Z.L., J.J. and A.M.; visualization: D.A., A.L., Z.L., R.S., L.B. and J.J.; investigation: M.Z., D.N., A.L., D.A., A.V., R.S., J.R. and M.Z.; resources: A.V. and D.A.; data curation: D.N., M.Z. and L.B.; writing—original draft preparation: A.L., D.A., R.S. and D.N.; writing—review and editing: M.Z., D.A., J.J., L.B., Z.L. and A.V.; supervision: D.A.; project administration: D.A. All authors have read and agreed to the published version of the manuscript.
Funding
This research received no external funding.
Data Availability Statement
Not applicable.
Conflicts of Interest
The authors declare no conflict of interest.
References
- Cool, S.R.; Pieters, J.G.; Van Acker, J.; Bulcke, J.V.D.; Mertens, K.C.; Nuyttens, D.R.; Van De Gucht, T.C.; Vangeyte, J. Determining the effect of wind on the ballistic flight of fertiliser particles. Biosyst. Eng. 2016, 151, 425–434. [Google Scholar] [CrossRef]
- Hryciw, R.D.; Zheng, J.; Shetler, K. Particle Roundness and Sphericity from Images of Assemblies by Chart Estimates and Computer Methods. J. Geotech. Geoenviron. Eng. 2016, 142, 9. [Google Scholar] [CrossRef]
- Laucka, A.; Adaskeviciute, V.; Andriukaitis, D. Research of the Equipment Self-Calibration Methods for Different Shape Fertilizers Particles Distribution by Size Using Image Processing Measurement Method. Symmetry 2019, 11, 838. [Google Scholar] [CrossRef]
- Zhang, D.; Tian, Q. A Novel Fuzzy Optimized CNN-RNN Method for Facial Expression Recognition. Elektron. Ir Elektrotech. 2021, 27, 67–74. [Google Scholar] [CrossRef]
- Ulutas, H.; Aslantas, V. A Fast and Accurate Method for Classifying Tomato Plant Health Status Using Machine Learning and Image Processing. Elektron. Ir Elektrotech. 2023, 29, 54–68. [Google Scholar] [CrossRef]
- Kirmizitas, H.; Besli, N. Image and Texture Independent Deep Learning Noise Estimation Using Multiple Frames. Elektron. Ir Elektrotech. 2022, 28, 42–47. [Google Scholar] [CrossRef]
- Soppela, I.; Airaksinen, S.; Hatara, J.; Räikkönen, H.; Antikainen, O.; Yliruusi, J.; Sandler, N. Rapid Particle Size Measurement Using 3D Surface Imaging. AAPS PharmSciTech 2011, 12, 476–484. [Google Scholar] [CrossRef]
- Li, L.; Iskander, M. Comparison of 2D and 3D dynamic image analysis for characterization of natural sands. Eng. Geol. 2021, 290, 106052. [Google Scholar] [CrossRef]
- Yang, J.; Yu, W.; Fang, H.-Y.; Huang, X.-Y.; Chen, S.-J. Detection of size of manufactured sand particles based on digital image processing. PLoS ONE 2018, 13, e02061352018. [Google Scholar] [CrossRef]
- Theodon, L.; Coufort-Saudejaud, C.; Debayle, J. GRAPE: A Stochastic Geometrical 3D Model for Aggregates of Particles With Tunable 2D Morphological Projected Properties. Image Anal. Ster. 2023, 42, 1. [Google Scholar] [CrossRef]
- Chen, Q.; Li, Z.; Dai, Z.; Wang, X.; Zhang, C.; Zhang, X. Mechanical behavior and particle crushing of irregular granular material under high pressure using discrete element method. Sci. Rep. 2023, 13, 7843. [Google Scholar] [CrossRef]
- Jin, S.; Lin, Q.; Yang, J.; Bie, Y.; Tian, M.; Li, Z. A Novel Information Fusion Method for Vision Perception and Location of Intelligent Industrial Robots. Elektron. Ir Elektrotech. 2019, 25, 4–10. [Google Scholar] [CrossRef]
- Cuzzi, J.N.; Olson, D.M. Recovering 3D particle size distributions from 2D sections. Meteorit. Planet. Sci. 2017, 52, 532–545. [Google Scholar] [CrossRef] [PubMed]
- Yan, W.; Su, D. Inferring 3D particle size and shape characteristics from projected 2D images: Lessons learned from ellipsoids. Comput. Geotech. 2018, 104, 281–287. [Google Scholar] [CrossRef]
- Xu, Y.; Wu, T.; Charlton, J.R.; Bennett, K.M. GAN Training Acceleration Using Fréchet Descriptor-Based Coreset. Appl. Sci. 2022, 12, 7599. [Google Scholar] [CrossRef]
- Nie, Z.; Liang, Z.; Wang, X. A three-dimensional particle roundness evaluation method. Granul. Matter 2018, 20, 32. [Google Scholar] [CrossRef]
- Su, D.; Wang, X.; Yang, H.-W.; Hong, C. Roughness analysis of general-shape particles, from 2D closed outlines to 3D closed surfaces. Powder Technol. 2019, 356, 423–438. [Google Scholar] [CrossRef]
- Zhao, B.; Wang, J. 3D quantitative shape analysis on form, roundness, and compactness with μCT. Powder Technol. 2015, 291, 262–275. [Google Scholar] [CrossRef]
- Zhao, L.; Zhang, S.; Deng, M.; Wang, X. Statistical analysis and comparative study of multi-scale 2D and 3D shape features for unbound granular geomaterials. Transp. Geotech. 2021, 26, 100377. [Google Scholar] [CrossRef]
- Al-Thelaya, K.; Agus, M.; Gilal, N.U.; Yang, Y.; Pintore, G.; Gobbetti, E.; Calí, C.; Magistretti, P.J.; Mifsud, W.; Schneider, J. InShaDe: Invariant Shape Descriptors for visual 2D and 3D cellular and nuclear shape analysis and classification. Comput. Graph. 2021, 98, 105–125. [Google Scholar] [CrossRef]
- Gawenda, T.; Krawczykowski, D.; Krawczykowska, A.; Saramak, A.; Nad, A. Application of Dynamic Analysis Methods into Assessment of Geometric Properties of Chalcedonite Aggregates Obtained by Means of Gravitational Upgrading Operations. Minerals 2020, 10, 180. [Google Scholar] [CrossRef]
- Krawczykowski, D. Application of a vision systems for assessment of particle size and shape for mineral crushing products. IOP Conf. Ser. Mater. Sci. Eng. 2018, 427, 012013. [Google Scholar] [CrossRef]
- Andriukaitis, D.; Laucka, A.; Valinevicius, A.; Zilys, M.; Markevicius, V.; Navikas, D.; Sotner, R.; Petrzela, J.; Jerabek, J.; Herencsar, N.; et al. Research of the Operator’s Advisory System Based on Fuzzy Logic for Pelletizing Equipment. Symmetry 2019, 11, 1396. [Google Scholar] [CrossRef]
- Laucka, A.; Andriukaitis, D.; Valinevicius, A.; Navikas, D.; Zilys, M.; Markevicius, V.; Klimenta, D.; Sotner, R.; Jerabek, J. Method for Volume of Irregular Shape Pellets Estimation Using 2D Imaging Measurement. Appl. Sci. 2020, 10, 2650. [Google Scholar] [CrossRef]
Disclaimer/Publisher’s Note: The statements, opinions and data contained in all publications are solely those of the individual author(s) and contributor(s) and not of MDPI and/or the editor(s). MDPI and/or the editor(s) disclaim responsibility for any injury to people or property resulting from any ideas, methods, instructions or products referred to in the content. |
© 2023 by the authors. Licensee MDPI, Basel, Switzerland. This article is an open access article distributed under the terms and conditions of the Creative Commons Attribution (CC BY) license (https://creativecommons.org/licenses/by/4.0/).