Abstract
We estimate measures of economies of scale and scope for a sample of 48 Canadian universities that produce multiple outputs. Estimates have not been previously attempted for Canadian universities to our knowledge. Declining financial support from provincial governments makes finding cost efficiencies a priority for policy makers. Our approach features two useful innovations: by using panel data for 2011–2019, instead of a cross-section for a single year, there is more variation in the variables to estimate a multi-product trans-log cost function; and we consider the appropriateness of using research funding as a measure of research output by alternatively using publication counts. We did not find economies of scale at any university size but did find ray economies of scale up to 60% of the median university size. Economies of scope were evident up to roughly 1.2 times the median university size. No significant differences in results were found between using publication counts or research funding. Small institutions that cater to different outputs could be merged into comprehensive institutions. The lack of economies of scope for Canada’s larger universities suggests that they could be broken up into smaller specialized institutions if cost efficiencies are a priority.
1. Introduction
To economists, discussion of the efficient size of an organization generally boils down to its economies of scale, the level of output that achieves constant returns to scale—the level of output where a small increase or decrease in output does not change the average cost (cost per unit of output). In a market economy, competitive pressures force profit-maximizing firms constantly to strive to produce more efficiently and achieve constant returns to scale. Firms that produce with increasing returns to scale (decreasing average cost) should increase their output, if demand allows, to achieve their efficient scale of output (size). Likewise, firms that produce with decreasing returns to scale (increasing average cost) should consider decreasing their output or divesting themselves of parts of their business. Information about the efficient organization of production can be deduced by observing organizations in the same industry that survive and prosper in a competitive environment. However, in the context of publicly funded higher education in Canada, the answer is not so simple for at least three reasons: (i) tuition fees paid by students do not cover the full cost of their educational experience and are regulated by Canada’s provincial governments; (ii) operating grants that fund large portions of university operations are determined by provincial governments using a mix of formula-based and discretionary methods; and (iii) all universities in Canada and elsewhere produce multiple outputs, not just undergraduate education. The financial constraints placed on Canada’s universities imply that the only margin that they have is to choose an enrollment size that achieves an efficient scale of operation in terms of total costs. Rockerbie and Easton (2024) provide a review of the Canadian university system and its challenges.
Our study will estimate economies of scale and scope for Canadian universities by incorporating several innovations. First, due to the much larger availability of financial data from the CAUBO database (Canadian Association of University Business Officers), economies of scale and scope can be estimated using panel data covering several years. Previous studies for Canadian universities have suffered by only having access to a single year of financial data; thus, they are only able to estimate scale and scope economies for very large groups of institutions with limited variations in the data. Second, the availability of publication counts for Canadian universities offers an improvement in measuring research output in comparison to the use of research funding often used by other studies. Publication counts were used as a measure of research output by de Groot et al. (1991) for a sample of U.S. universities. The association between publication counts and research funding was investigated by Gralka et al. (2019) in the context of performing a data envelope analysis to measure cost efficiencies for universities in Germany. They found little difference using either measure. Our results will add evidence to this question. In addition, our results will provide useful policy recommendations to Canada’s university administrators and provincial governments concerning future paths for specialization in programs and the possible diversification of existing programs to achieve cost efficiencies.
Estimating the cost of producing academic outputs is complicated by the fact that many, if not all, universities produce multiple products. Typically, the products include undergraduate and/or graduate instruction and research output. In addition to these basic outputs, many institutions also produce public services such as medical services, business assistance programs, museums of various sorts, theater productions, and the like. And, of course, universities produce both intramural and extramural athletics. Thus, for purposes of estimating unit costs, it is essential to treat universities as multiproduct “firms.” Further, it seems highly likely that the production of certain outputs affects the unit cost of producing other outputs. For example, the production of graduate instruction requires hiring faculty with more extensive training and ability than is required to teach only at the undergraduate level. Doctorally qualified faculty are more expensive to hire than non-doctorally qualified faculty. To the extent that the set of faculty providing graduate instruction and the set of faculty providing undergraduate instruction are mutually exclusive, the provision of the former has no cost spillover to the latter. However, if the graduate faculty also teach undergraduate courses, then the unit cost of providing undergraduate education will be higher at universities that produce both graduate and undergraduate education than at those that produce only undergraduate education. On the other hand, to the extent that relatively low-paid graduate students are used to teach undergraduate courses, unit costs of the latter may be lower than one would find at traditional undergraduate-education-only institutions.
The ability to achieve lower average costs by offering a greater variety of outputs is termed economies of scope. There is evidence that higher education is characterized by (dis)economies of scope. Using data from 1981 to 1982, Cohn et al. (1989) estimated multiproduct cost functions for 1195 U.S. public colleges and universities and 692 private U.S. colleges and universities and found that at the mean levels of outputs in their samples there were economies of scope in private sector institutions and diseconomies of scope in public sector institutions.
The empirical method to estimate economies of scale and scope involves the estimation of a non-linear cost function using multiple regression methods. Data are acquired regarding the various costs that universities incur, as well as measures of their various “outputs”. Statistical tests of restrictions of the regression coefficients suggest evidence for the returns to scale of average costs and the presence of economies of scope.
The empirical literature estimating scale and scope economies for universities is moderately extensive, although a single study exists for Canadian universities. Dickson (1994) found evidence for increasing returns to scale for Canadian universities using data for 1986. The empirical method employed is simplistic and relatively more powerful econometric methods have become available recently, the sample is limited only to one year, and the types of degrees offered are not controlled for. We hope to improve on this study by using more detailed data for a larger sample of years and more powerful econometric techniques to reduce the likelihood of bias in the results.
A much larger sample of literature exists for estimating scale and scope economies for U.S. universities, only a sample of which is given here. de Groot et al. (1991) found economies of scale and scope for a sample of 147 universities using 1982–1983 data. Koshal and Koshal (1995) grouped universities into four categories based on their size (measured by student enrollments and revenues) and type of degree offered (undergraduate only or comprehensive). The results for 204 U.S. universities for the year 1990 suggest increasing returns to scale and large positive reputational effects on overall costs. Koshal and Koshal (1999) follow up their earlier study with a larger sample that controls for degree type, public and private institutions, and multiple outputs, using 171 public and 158 private intuitions, respectively, for the year 1991. They estimate significant increasing returns to scale and economies of scope; however, they also estimate lower economies of scope for smaller institutions. Liberal arts colleges also exhibited economies of scale and scope, but not surprisingly, cost inefficiencies in producing research (Koshal & Koshal, 2000). Hashimoto and Cohn (1997) found economies of scale and scope in a sample of 94 private universities in Japan using data for the year 1991. Undergraduate and graduate students were found to demonstrate stronger returns to scale and scope for smaller universities, while research output stronger for larger universities. Laband and Lentz (2003) use a much larger sample of 1492 private institutions and 1450 public institutions in the U.S. using data for 1995. Their results suggest universities operate with increasing returns to scale, but do not benefit from economies of scope when outputs are classified as undergraduate education, graduate education, and research output. Sav (2007) found economies of scale for U.S. private sector institutions, but only for small public sector institutions. Sav (2011) found diseconomies of scale after controlling for the type of institution (Ph.D, Masters, undergraduate), with economies of scope for all types using a sample of U.S. institutions over 2000–2007.
Longlong et al. (2009) test for economies of scale and scope in a sample of 74 universities in China, in the year 2000. They found economies of scale in research output but diseconomies of scale in undergraduate and graduate enrollments. Economies of scope were found for smaller institutions but not larger institutions. Testing for economies of scale and scope has proven popular using U.K. universities. An early example is Johnes (1996), who found economies of scale and scope, followed by Johnes (1997) with largely the same results. Johnes and Johnes (2016) test for economies of scale and scope using a sample of 103 universities in the U.K. for the year 2013. The method differs from that proposed here in that it uses a frontier estimation method that estimates the “distance” at which an institution achieves its total costs relative to an estimate of the “efficient” cost (that which lies on the cost-minimizing production frontier). This has become a popular estimation method (see also Izadi et al. (2002) and Hashimoto and Cohn (2014)), however, it asks a different set of questions. Regardless, the results suggest increasing returns to scale and that U.K. universities operate very close to their efficient frontiers, leaving little room to achieve greater efficiencies. More recent contributions include Vamosiu et al. (2018) and Vamosiu et al. (2024) that both utilize data for U.S. colleges. A useful review of previous research is provided by Toutkoushian and Lee (2018). Zhang and Worthington (2018) provide a useful review using meta-analysis. Whether universities can achieve cost savings and scope economies by merging was tested by Mizutani et al. (2024) for a sample of Japanese universities using 2014 and 2018 data. They could not find evidence of either effect.
The plan for our paper is as follows. Section 2 describes the research methodology used, specifically the specification of a multi-output cost function that possesses the standard theoretical properties of a cost function, and the measures of economies of scale and scope. Section 3 describes the measures of output, a factor price used in the cost function, as well as the sources of data. The estimated cost function is presented in Section 3. And provides the estimates of returns to scale and scope. Conclusions are provided in Section 4.
2. Methodology
2.1. Method
Estimating economies of scale for a multi-product firm requires the estimation of a cost function that includes the firm outputs and factor prices. The cost function should conform to the economic properties of a proper cost function (Greer, 2012). These properties include producing non-negative quantities of output, non-negative marginal costs, and linear homogeneity in factor prices (factor prices and cost increase by the same proportion). The quadratic cost function is simple to operationalize and conforms to these properties. In our case, the cost function contains k outputs for each of the N universities in our panel estimate, with outputs denoted by j and m and university denoted by i = 1 to N. Each of the k outputs for university i is denoted as , the factor price is denoted as , and total cost is denoted as .
Taking the natural log of (1) gives the form of the estimating equation for university i in period t.
Our panel data contains observations over a sample of years for each university; however, we exclude time subscripts in further equations for convenience. Each output is captured in a linear term, a quadratic term, and a cross-product term for each of the other k − 1 outputs. The term is a fixed effect that accounts for different fixed costs among our sample universities. The random error term is denoted by z. Our quadratic cost function does not include interaction terms between the factor price S and the outputs to preserve the linear homogeneity in the factor price S. Linear homogeneity is confirmed in our model if the estimate of is not significantly different from one, but that may not be the case if there exist excluded factor prices that we cannot observe (such as administrative and support staff salaries, variable equipment and supply prices, and so on).
Our outputs include annual undergraduate FTE’s (), annual graduate FTE’s (), and annual research output () measured by the total number of faculty publications. Agasisti (2016) could not find scale economies for a sample of Italian universities when using FTE’s but did find scale economies when using the number of graduating students. Our dataset did not include the number of graduating students. In our opinion, including only graduating students could overestimate both the average and marginal cost to service students. While many other papers justify the use of research funding as a measure of research output, the fact remains that research funding is an input into a research production process that has an unknown output elasticity. It is likely the case that some research funding results in few to no publications while a lot of research is published without any explicit research funding. Publication counts are now available for Canadian universities, and we view them as a superior and ultimate measure of research output. Unfortunately, a measure of the quality of the publications is not available. This would be useful in weighing the publication counts; however, it is not clear that university costs would be a function of publication quality, although it could be the case that very high-quality researchers earn higher salaries that increase costs. This would be a valuable addition for future research if a measure of university-specific research quality could be obtained. We use the median faculty university salary as the factor price since faculty salaries contribute a large share of university costs. This is a standard practice in previous studies.
Several standard measures of multi-product returns to scale are used in the literature that were initially suggested by Baumol et al. (1982). The first step is to calculate the marginal cost of each output, , , and . In the case of undergraduate FTE’s, the calculation of marginal cost is given below. The log-linear form of the cost function requires an adjustment to each estimated coefficient to estimate the marginal cost in levels.
In (3) we choose to use the median value of each output, which is indicated by a bar over the variable, due to the heavy skewness in the observed outputs in our sample. The marginal costs and are symmetric to the calculation in (3). Marginal costs that lie below average costs confirm increasing returns to scale for the relevant output, but these must be taken in context with the other measures in a multi-product university. The average increment cost for measures the increase in average cost by having the observed number of undergraduate FTE’s versus having none. As such, it is the vertical shift in the average cost when producing versus .
Marginal costs can be increasing but still be below average costs. Returns to scale are evaluated by taking the ratio of average incremental costs to marginal cost, , for each of the outputs. Increasing returns to scale are said to exist for each output if > 1, meaning that average incremental cost lies above marginal cost at the median level of output. This measure is calculated at varying levels of output in the results to follow to detect changes in scale economies.
Ray economies of scale measure how total average cost behaves as all outputs increase by the same proportion. Panzar and Willig (1978) proved that ray economies of scale can be measured by taking the ratio of total cost to the revenue obtained from marginal cost pricing evaluated at the median outputs.
Ray economies of scale are said to exist if .
Economies of scope only exist when multiple outputs are produced. In our case, if the total cost of producing all the outputs is less than the sum of the cost of producing each output individually, global economies of scope (GES) are present. Again, the outputs take on their median values initially.
Global economies of scope exist if , suggesting that there are efficiencies to be gained in joint production. This can be the case in universities, for example, if more research output improves undergraduate and graduate teaching, resulting in higher enrollments and lower average costs. However, this complementarity of producing outputs need not hold for each output individually. Product-specific economies of scope (PES) measure scope economies when only one of the outputs is produced separately from the other outputs that are produced together. If undergraduate enrollments are produced separately from graduate enrollments and research, PES is as measured below:
The PES for graduates and research are calculated symmetrically to (7). Product-specific economies of scope for producing undergraduate students exist if . This may be the case if there exist a number of universities that produce only undergraduate students with little to no research expectations of faculty and universities that produce more graduate students than undergraduates with faculty research (such as the University of Chicago). The former could be the case for smaller universities in Canada, but the latter would not seem to exist in Canada.
Calculating the measures in (3)–(7) required the estimation of (2) using a sample of 48 Canadian universities out of a total of 103 universities operated in Canada’s ten provinces in 2019. Excluded institutions had very small enrollments with many omissions in their financial data. The 48 included institutions comprised just over 85% (C$35.5 billion) of the total expenditures for all Canadian universities in 2019 (C$41.19 billion), with total enrollments at about the same percentage. These include all the top-tier universities in the country. A full list is provided in Appendix A (Table A1). The next section describes the sample data used in our panel regression of (2).
2.2. Materials
Estimation of the cost function in (2) required data for university costs, undergraduate and graduate student enrollments, research publications, and faculty salaries. Our panel dataset included observations for 48 Canadian universities over the period 2011–2019. More recent years were excluded from consideration due to the COVID-19 pandemic that distorted the cost and enrollment data. Observations were missing for faculty salaries for some of the years, resulting in an unbalanced panel of 365 observations. University cost includes all relevant operating costs excluding expenses for land and buildings as these were deemed as capital assets that are depreciated and yield a productive return over their lifetime. Costs included in relevant operating costs include salaries and wages, benefits, travel, library acquisitions, printing and duplicating, materials and supplies, communications, other operational expenditures, utilities, scholarships, bursaries, prizes, externally contracted services, professional fees, costs of goods sold, and interest.
Cost data was obtained from the CAUBO (Canadian Association of University Business Officers) university financial database that is available upon request (https://www.caubo.ca, accessed on 5 October 2023). Undergraduate and graduate enrollments were converted to FTE’s by weighing part-time students with a weight of 0.5, and they included students from all programs including professional schools (medical, legal, engineering, etc.). The enrollment data were obtained from Table 37-10-0234-03 maintained by Statistics Canada (https://www.statcan.gc.ca/en/start, accessed on 5 October 2023). Actual credit hours taken by part-time students are not available so the weight of 0.5 is an estimate but one we deem reasonable. Total annual research publications were obtained by searching the Scopus database that covered some 34,377 scholarly titles. Scopus is maintained by Elsevier, Inc. (https://www.elsevier.com/products/scopus, accessed on 28 February 2024). The number of titles is as of 28 February 2024 when the data was taken. Multiple authors of a publication who are housed in the same institution were counted as one publication for that particular institution. Median faculty salaries were obtained from Table 37-10-0108-01 maintained by Statistics Canada (https://www.statcan.gc.ca/en/start, accessed on 5 October 2023). Median salaries were used instead of average salaries to account for any skewness in the salary data that could inflate the average salary, although the coefficient of skewness for salaries in Table 1 suggests this might not be an issue. Both university cost and median faculty salary were deflated to obtain real costs using a provincial consumer price index (CPI, 2002 = 100) for all items obtained from Table 18-10-0005-01 maintained by Statistics Canada.

Table 1.
Descriptive statistics for variables in cost function (2), 2011–2019. Note that C, S, and (research funds) are measured in Canadian Dollars (C$) and deflated by the provincial CPI (2002 = 100).
To assess the effects of using research grant funding as a measure of research output, Equation (2) was also estimated using deflated grant funding in place of total publications. Grant funding is composed of several sources, including Social Sciences and Humanities Research Council (SSHRC), Natural Sciences and Engineering Research Council (NSERC), Canadian Institutes of Health Research (CIHR), and Canada Foundation for Innovation (CFI), and were obtained from the CAUBO database. Canada Research Chair (CRC) funding was omitted as it is used to pay faculty salaries and benefits for those chosen through a national competition that allocates the number of CRCs to each university. This funding is not used to fund research activities directly. The descriptive statistics for the complete dataset are provided in Table 1.
3. Results
3.1. Cost Function Estimates
We address the issue of the preferred measure of research output before estimating the cost function in (2). A panel regression using fixed effects and a correction for heteroskedasticity was used to investigate the association between publications per faculty member and real research funding. The number of faculty members (excluding session contracts) was obtained from Table 37-10-0108-01 maintained by Statistics Canada, denoted as faculty. A quadratic term was included to accommodate the possibility of diminishing returns to real research funding. The t-statistic for each coefficient appears in parentheses.
Equation (8) fits very well with an adjusted R2 equal to 0.971 with statistically significant fixed effects (p = 0.000 for an F test excluding fixed effects). The intercept suggests that each faculty member publishes about two publications each year with no research funding (p = 0.000) for the average Canadian university. Publications per faculty member increase with research funding at a diminishing rate (p = 0.000 for both coefficients). At the median level of research funding per faculty member ($19,760), the marginal effect of research funding is 1.15 × 10⁻⁵. To increase the publication/faculty ratio by one publication will require an additional $87,050 per faculty member in research funding. Put another way, the value of the two publications per faculty member with no research funding is $174,100 in research funding per faculty member—a significant saving in research funding. The fitted regression model in (8) is plotted in Figure 1. A linear model is appropriate up to the median level of research funding per faculty member, but at higher values diminishing returns enter. We prefer to use publications as the measure of research output for this reason.
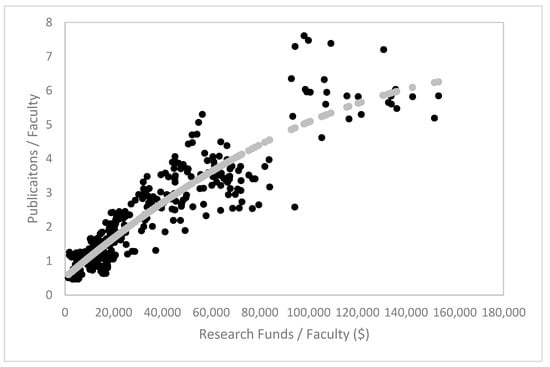
Figure 1.
Publications per faculty member against research funding per faculty member obtained from the estimate of Equation (8).
The quadratic cost function in (2) was estimated using a weighted least squares procedure. An LM test for cross-section heteroskedasticity rejected the null hypothesis of no heteroskedasticity at a high level of confidence. As a result, (2) was re-estimated calculating the panel-corrected standard errors developed by Beck and Katz (1995) that corrects the slope standard errors for heteroskedasticity and serial correlation. Time-wise fixed effects for each institution were included in the estimation of (2) but were found to be very small and statistically significant. Cross-section fixed effects were not included due to the inclusion of the dummy variables for the institutional categories described below. The estimated coefficients appear in column (2) of Table 2, and all have the expected sign except the negative sign of the cross-product of undergraduate and graduate enrollments, suggesting a complementarity in cost. All coefficients are statistically significant at 95% confidence, except for the quadratic term for graduate enrollments. The restriction that salary elasticity was equal to one could not be rejected (p = 0.351), confirming the desirable property that the cost function is homogeneous of degree one in the factor price.
Table 2.
Estimates of the log-linear cost function in Equation (2), 2011–2019 unbalanced panel. Columns (2) and (4) use publication counts as research output. Columns (3) and (5) use real research funding as research output. T-statistics appear in parentheses. * Denotes statistical significance at 95% confidence.
To test the consistency of our model with previous work that relied on research funds as a measure of research output, Equation (2) was re-estimated using real research funds in place of publications. The results appear in column (3) of Table 2. The coefficient for real research funds is positive but not statistically significant (p = 0.153), although the quadratic term is, albeit very small. The restriction for homogeneity of degree one in the real salary was rejected (p = 0.0335), suggesting that the cost function is mis-specified. It could be the case that the use of research funding as a proxy for research output is appropriate in other countries, but the results suggest that this is not the case for Canada.
It is likely the case that fixed costs differ when universities offer different programs. We used two dummy variables to test for differences in fixed costs: for universities that feature medical schools, a variety of professional schools and Ph.D programs; for universities that feature Ph.D programs but no medical school and few to no professional schools; and the third category is primarily undergraduate universities when . The results are summarized in columns (4) and (5) in Table 2 (publications and research funds, respectively, as the measure of research output). Our suspicions proved correct: the coefficients for the dummy variables are both positive and statistically significant at 95% confidence with and both greater than primarily undergraduate universities. The slope coefficients for the other independent variables in (2) showed only marginal changes with the addition of the dummy variables. The advantage of using publications over research funding as the measure of research output is less apparent.
3.2. Economies of Scale and Scope
The marginal cost of producing each output was calculated using (3) and inserting the relevant estimated coefficients in Table 2. These appear in Table 3 for increasing levels of output relative to their median values in the sample that ranges from 50% to 350% to account for skewness in output levels. The marginal cost for graduate enrollments is higher than undergraduate enrollments, consistent with previous studies for other countries. The marginal cost of research is higher than either type of enrollment, except at 50% of the median output, and increases throughout all levels of output. This result cannot be directly compared with previous studies that use research funding as the measure of research output. The marginal cost of research is not unreasonable given the discussion of high research costs in the previous section. Average incremental cost is increasing for all three outputs. Economies of scale could not be found at any level of output. Ray economies of scale were found for output sizes up to 60% of the median outputs but not at higher output levels. These results suggest that there are few opportunities for Canadian universities to expand their outputs to take advantage of economies of scale except for the smallest institutions with approximately fewer than 11,000 students. It is not necessary to repeat the calculations for economies of scale and scope utilizing the differences in fixed cost for each university category since they do not affect the calculations. The economies of scale and scope are only marginally different if the slope coefficients in column (4) of Table 3 are used, hence they are not reported.
Table 3.
Marginal cost, average incremental cost, returns to scale, and ray economies of scale using research publications for a sample of 48 Canadian universities, 2011–2019.
Global economies of scale exist up to the largest institutions with sizes of 1.2 times the median output levels, but not at larger sizes. The calculations are summarized in Table 4. Cost advantages can be exploited for these smaller to median-sized Canadian universities by offering comprehensive programs with undergraduate and graduate students and incentivizing greater research output. The larger a university becomes after this size, the greater the cost advantage of breaking it into smaller specialized institutions. Institutions with approximately 25,000 students or more fell into this category.
Table 4.
Product-specific economies of scope and global economies of scope for a sample of 48 Canadian universities, 2011–2019.
Product-specific economies of scope provide a deeper understanding of the cost efficiencies in producing multiple outputs. These are also summarized in Table 4. The economies of scope for undergraduate students are exhausted when an institution reaches approximately 0.95 times the median levels of all outputs, while they are somewhat greater at 0.99 times for graduate students and even slightly greater than that at 1.1 times for research output. Breaking up an institution into smaller component institutions is preferable for larger universities whose student body has a higher undergraduate component.
Economies of scale and scope are summarized in Table 5 and Table 6 using research funding as the measure of research output. The results are qualitatively the same as Table 3 and Table 4 that use publication counts. The values for the product-specific and global economies of scope are somewhat larger using research funding. This moves the university size as a percentage of the median size slightly higher to find these economies of scope, but only modestly.
Table 5.
Marginal cost, average incremental cost, returns to scale, and ray economies of scale using research funding for a sample of 48 Canadian universities, 2011–2019.
Table 6.
Product-specific economies of scope and global economies of scope using research funding for a sample of 48 Canadian universities, 2011–2019.
4. Discussion
Our results agree with some key results from previous studies. The marginal cost of graduate students is higher than undergraduate students and both increase as enrollments increase. The same results were found in Koshal and Koshal (1995, 1999), Hashimoto and Cohn (1997), Laband and Lentz (2003), and Longlong et al. (2009) for U.S., Japanese, and Chinese universities, respectively. The marginal cost of research output is larger in our study than for either undergraduate or graduate outputs and increases as more research output (publications) is produced; however, our results cannot be compared to other studies that used research funding as the measure of research output due to the differences in units. More recent studies for U.S. institutions do not report estimates of marginal costs so there is no basis for comparison We do not find a significant advantage to using publications over research funding when differences in fixed costs are accounted for, although the cost function is closer to displaying homogeneity of degree one in the input price with publications. Average incremental costs are increasing with undergraduate, graduate, and research output and fall below marginal costs in each case in our study, suggesting that there are no economies of scale in producing any of the three outputs. This result is contrary to the cited previous studies that found economies of scale in at least one of the outputs for larger institutions in Japan (Hashimoto and Cohn (2014) and the U.K. (Johnes and Johnes (2016)), but consistent with more recent studies (Sav, 2007, 2011). All is not lost as we did find ray economies of scale for Canada’s smaller universities, consistent with Vamosiu et al. (2018) for U.S. public institutions, suggesting that there are opportunities for them to achieve cost efficiencies by expanding graduate programs and research output.
Our results found product-specific economies of scope for undergraduate, graduate, and research outputs up to the median university size, but none at larger sizes. The same result was held for global economies of scope. Each of the previously cited studies found the same results concerning scope economies, albeit at somewhat higher levels of output than the median size.
Both of our results concerning economies of scale and scope suggest that the opportunities for achieving cost efficiencies lie with the smaller Canadian universities. Small institutions that cater to different outputs could be merged into comprehensive institutions. Russell (2021) found that such mergers resulted in tuition increases that exceeded those of non-merging institutions using U.S. data, suggesting a greater ability for merged institutions to price discriminate. This might not be an issue for Canadian universities since their tuitions are regulated by provincial governments. The lack of economies of scope for Canada’s larger universities suggests that they could be broken up into smaller specialized institutions if cost efficiencies are a priority. However, Canada’s universities are not for-profit institutions. Instead, they rely heavily on provincial governments that provide operating grants and at the same time impose tuition and enrollment constraints. Operating grants as a percentage of total government revenue vary significantly across provinces over 2011–2019, ranging from an average of 2.59% for Prince Edward Island to 5.89% for Newfoundland, with an average provincial value of 3.44% (computed from data compiled from the CAUBO database and Kneebone and Wilkins (2016)) However, there is little variation over time in these percentages, suggesting that they are rather unresponsive to changes in economic conditions (Rockerbie & Easton, 2024). Easton and Rockerbie (2008) demonstrate that determining the cost-efficient size of an operating grant is a tricky task for a government, particularly in the face of increasing demand. The optimal operating grant is a function of the tuition elasticity of demand, excess demand for enrollment spots, elasticity of average cost, and government-regulated tuition increases. A sub-optimal grant size will not allow a university to achieve constant returns to scale in its outputs—a problem that does not exist with private universities who are free to charge a market-clearing tuition rate.
While our results for Canadian universities are unique and offer valuable insights for policy makers, there do exist several shortcomings that could provide avenues for future research using Canadian data. The post COVID-19 years have witnessed significant reductions in the share of total university revenues contributed by provincial operating grants, resulting in significant changes to their cost structures and policies. With the addition of more time-series data each year, an analysis of scale and scope economies becomes more feasible. Spatial dependence of university costs was a concern addressed by Vamosiu et al. (2024) using recently developed econometric techniques that could be utilized with more extensive Canadian data.
Author Contributions
Conceptualization, S.E. and D.W.R.; methodology, D.W.R.; software, D.W.R.; formal analysis, D.W.R.; data curation, S.E. and D.W.R.; writing—original draft preparation, S.E. and D.W.R.; writing—review and editing, D.W.R. All authors have read and agreed to the published version of the manuscript.
Funding
This research received no external funding.
Data Availability Statement
The MS Excel dataset to estimate Equation (2) can be found on the author’s ResearchGate site.
Acknowledgments
The author wishes to acknowledge the assistance of Stephen Easton (Simon Fraser University) in acquiring the research publications data.
Conflicts of Interest
The author declares no conflicts of interest.
Appendix A
Table A1.
Details of 48 Canadian universities ranked by total enrollment, 2019.
Table A1.
Details of 48 Canadian universities ranked by total enrollment, 2019.
| University | Publications | Faculty | Ugrads | Grads | Total | Category |
|---|---|---|---|---|---|---|
| Toronto | 17,567 | 2778 | 89,967 | 20,127 | 110,094 | MD |
| Montreal | 4969 | 1434 | 62,277 | 17,133 | 79,410 | MD |
| British Columbia | 10,224 | 2940 | 59,388 | 9723 | 69,111 | MD |
| York | 2533 | 1440 | 53,847 | 6105 | 59,952 | CMP |
| Laval | 3613 | 1398 | 38,583 | 11,139 | 49,722 | MD |
| Ryerson | 1657 | 1200 | 46,704 | 2928 | 49,632 | CMP |
| Ottawa | 5627 | 1251 | 42,024 | 7431 | 49,455 | MD |
| Alberta | 8483 | 1599 | 39,168 | 8187 | 47,355 | MD |
| McGill | 7860 | 1341 | 36,138 | 9885 | 46,023 | MD |
| Western | 4903 | 1206 | 38,991 | 6753 | 45,744 | MD |
| Waterloo | 5325 | 1365 | 38,844 | 6195 | 45,039 | CMP |
| Concordia | 2250 | 930 | 36,504 | 7512 | 44,016 | CMP |
| Calgary | 6414 | 1815 | 35,052 | 6786 | 41,838 | MD |
| Quebec at Montreal | 1414 | 1107 | 32,592 | 7806 | 40,398 | CMP |
| McMaster | 5581 | 765 | 34,170 | 4959 | 39,129 | MD |
| Simon Fraser | 2732 | 1017 | 30,453 | 4905 | 35,358 | CMP |
| Carleton | 2343 | 954 | 30,942 | 4215 | 35,157 | CMP |
| Manitoba | 3469 | 1146 | 29,433 | 3864 | 33,297 | MD |
| Guelph | 2730 | 822 | 29,979 | 3039 | 33,018 | CMP |
| Queens | 3273 | 837 | 27,087 | 5451 | 32,538 | MD |
| Sherbrooke | 1533 | 1167 | 18,471 | 10,344 | 28,815 | MD |
| Saskatchewan | 2684 | 981 | 21,477 | 3288 | 24,765 | MD |
| Victoria | 2325 | 741 | 21,357 | 2967 | 24,324 | CMP |
| Wilfred Laurier | 674 | 552 | 19,902 | 1986 | 21,888 | CMP |
| Memorial | 1789 | 975 | 17,526 | 3981 | 21,507 | MD |
| Dalhousie | 2575 | 648 | 17,622 | 3747 | 21,369 | MD |
| Brock | 783 | 576 | 18,873 | 1923 | 20,796 | CMP |
| Windsor | 1054 | 525 | 16,323 | 4122 | 20,445 | CMP |
| Regina | 743 | 486 | 15,075 | 1812 | 16,887 | CMP |
| Trois Rivier | 497 | 459 | 12,888 | 3042 | 15,930 | PU |
| Trent | 384 | 270 | 10,845 | 684 | 11,529 | PU |
| Athabasca | 211 | 189 | 8868 | 2634 | 11,502 | PU |
| New Brunswick | 1037 | 561 | 8805 | 1638 | 10,443 | CMP |
| Winnipeg | 286 | 339 | 10,068 | 213 | 10,281 | PU |
| Laurentian | 389 | 363 | 8709 | 987 | 9696 | PU |
| Lakehead | 554 | 333 | 8196 | 1452 | 9648 | PU |
| Lethbridge | 442 | 420 | 8748 | 624 | 9372 | PU |
| Rimouski | 217 | 204 | 5922 | 1140 | 7062 | PU |
| Saint Mary’s | 330 | 273 | 6231 | 633 | 6864 | PU |
| Moncton | 210 | 4584 | 600 | 5184 | PU | |
| Cape Breton | 97 | 171 | 4698 | 441 | 5139 | PU |
| Nippissing | 86 | 177 | 4935 | 165 | 5100 | PU |
| Prince Edward Island | 263 | 243 | 4584 | 489 | 5073 | MD |
| Saint Francis Xavier | 277 | 219 | 4344 | 468 | 4812 | PU |
| Acadia | 211 | 201 | 3723 | 516 | 4239 | PU |
| Mount Saint Vincent | 123 | 51 | 2907 | 789 | 3696 | PU |
| Brandon | 152 | 186 | 3336 | 318 | 3654 | PU |
| Bishops | 80 | 123 | 2754 | 267 | 3021 | PU |
| Mount Allison | 118 | 135 | 2175 | 15 | 2190 | PU |
Note: Categories are denoted by MD for universities with medical and dental schools and a full set of undergraduate and graduate programs, CMP for comprehensive universities that feature a full set of undergraduate and graduate degrees, and PU for universities that feature a full set of undergraduate degrees with only small graduate programs.
References
- Agasisti, T. (2016). Cost structure, productivity and efficiency of the Italian public higher education industry 2001–2011. International Review of Applied Economics, 30(1), 48–68. [Google Scholar] [CrossRef]
- Baumol, W., Panzer, J., & Willig, R. (1982). Contestable markets and the theory of industry structure. Harcourt, Brace Jovanovich. [Google Scholar]
- Beck, N., & Katz, J. (1995). What to do (and not to do) with time-series cross-section data. American Political Science Review, 89(3), 634–647. [Google Scholar] [CrossRef]
- Cohn, E., Rhine, S., & Santos, M. (1989). Institutions of higher education as multi-product firms: Economies of scale and scope. Review of Economics and Statistics, 71(2), 284–290. [Google Scholar] [CrossRef]
- de Groot, H., McMahon, W., & Volkwein, J. (1991). The cost structure of American research universities. Review of Economics and Statistics, 73(3), 424–431. [Google Scholar] [CrossRef]
- Dickson, V. (1994). Cost determinants in Canadian universities. Canadian Journal of Higher Education, 24(1), 88–99. [Google Scholar] [CrossRef]
- Easton, S., & Rockerbie, D. (2008). Optimal government subsidies to universities in the face of tuition and enrollment constraints. Education Economics, 16(2), 191–201. [Google Scholar] [CrossRef]
- Gralka, S., Wohlrabe, K., & Bornmann, L. (2019). How to measure research efficiency in higher education? Research grants vs. publication output. Education Economics, 41(3), 322–341. [Google Scholar]
- Greer, M. (2012). Cost models. In M. Greer (Ed.), Electricity marginal cost pricing: Applications in eliciting demand responses. Elsevier Inc. Chapter 5. [Google Scholar]
- Hashimoto, K., & Cohn, E. (1997). Economies of scale and scope in Japanese private universities. Education Economics, 5(2), 107–115. [Google Scholar] [CrossRef]
- Hashimoto, K., & Cohn, E. (2014). Scale and scope economies of Japanese private universities revisited with an input distance function approach. Journal of Productivity Analysis, 41(2), 213–226. [Google Scholar]
- Izadi, H., Johnes, G., Oskrochi, R., & Crouchley, R. (2002). Stochastic frontier estimation of a CES cost function: The case of higher education in Britain. Economics of Education Review, 21(1), 63–71. [Google Scholar] [CrossRef]
- Johnes, G. (1996). Multi-product cost functions and the funding of tuition in UK universities. Applied Economics Letters, 3(9), 557–561. [Google Scholar] [CrossRef]
- Johnes, G. (1997). Costs and industrial structure in contemporary British higher education. Economic Journal, 107(442), 727–737. [Google Scholar] [CrossRef]
- Johnes, G., & Johnes, J. (2016). Costs, efficiency and economies of scale and scope in the English higher education sector. Oxford Review of Economic Policy, 32(4), 596–614. [Google Scholar] [CrossRef]
- Kneebone, R., & Wilkins, M. (2016). Canadian provincial government budget data, 1980/81 to 2013/14. Canadian Public Policy, 42, 1–19. [Google Scholar] [CrossRef]
- Koshal, R., & Koshal, M. (1995). Quality and economies of scale in higher education. Applied Economics, 27, 773–778. [Google Scholar] [CrossRef]
- Koshal, R., & Koshal, M. (1999). Economies of scale and scope in higher education: A case of comprehensive universities. Economics of Education Review, 18, 269–277. [Google Scholar] [CrossRef]
- Koshal, R., & Koshal, M. (2000). Do liberal arts colleges exhibit economies of scale and scope? Education Economics, 8(3), 209–220. [Google Scholar] [CrossRef]
- Laband, D., & Lentz, B. (2003). New estimates of economies of scale and scope in higher education. Southern Economic Journal, 70(1), 172–183. [Google Scholar]
- Longlong, H., Fengliang, L., & Weifang, M. (2009). Multi-product total cost functions for higher education: The case of Chinese research universities. Economics of Education Review, 28(2), 505–511. [Google Scholar] [CrossRef]
- Mizutani, F., Tanaka, T., & Nakayama, N. (2024). Economies of scale and scope, merger effects, and ownership difference: An empirical analysis of universities in Japan. Education Economics, 32(6), 882–905. [Google Scholar] [CrossRef]
- Panzar, J., & Willig, R. (1978). Economies of scale in multi-output production. Quarterly Journal of Economics, 91(3), 481–493. [Google Scholar] [CrossRef]
- Rockerbie, D., & Easton, S. (2024). Government funding allocations to universities and the business cycle: An analysis of Canada’s provincial governments. Economies, 12(4), 94. [Google Scholar] [CrossRef]
- Russell, L. (2021). Price effects of nonprofit college and university mergers. Review of Economics and Statistics, 103(1), 88–101. [Google Scholar] [CrossRef]
- Sav, G. T. (2007). Higher education costs and scale and scope economies. Applied Economics, 36(6), 607–614. [Google Scholar] [CrossRef]
- Sav, G. T. (2011). Panel data estimates of public higher education scale and scope economies. Atlantic Economic Journal, 39, 143–153. [Google Scholar] [CrossRef]
- Toutkoushian, R., & Lee, J. (2018). Revisiting economies of scale and scope in higher education. In M. Paulsen (Ed.), Higher education: Handbook of theory and research (pp. 371–416). Springer Nature. [Google Scholar]
- Vamosiu, A., McClure, K., & Titus, M. (2018). Economies of scale and scope at public master’s institutions: Evidence accounting for spatial independency. Education Economics, 26(5), 516–533. [Google Scholar] [CrossRef]
- Vamosiu, A., Titus, M., & Sandy, J. (2024). Neighbor-Effects and Economies of Scale and Scope at Public Community Colleges. Higher Education Policy, 37, 138–166. [Google Scholar] [CrossRef]
- Zhang, L.-C., & Worthington, A. (2018). Explaining estimated economies of scale and scope in higher education: A meta-regression analysis. Research in Higher Education, 59(2), 156–173. [Google Scholar] [CrossRef]
Disclaimer/Publisher’s Note: The statements, opinions and data contained in all publications are solely those of the individual author(s) and contributor(s) and not of MDPI and/or the editor(s). MDPI and/or the editor(s) disclaim responsibility for any injury to people or property resulting from any ideas, methods, instructions or products referred to in the content. |
© 2025 by the authors. Licensee MDPI, Basel, Switzerland. This article is an open access article distributed under the terms and conditions of the Creative Commons Attribution (CC BY) license (https://creativecommons.org/licenses/by/4.0/).