Abstract
One of the most difficult problems analysts and decision-makers may face is how to improve the forecasting and predicting of financial time series. However, several efforts were made to develop more accurate and reliable forecasting methods. The main purpose of this study is to use technical analysis methods to forecast Jordanian insurance companies and accordingly examine their performance during the COVID-19 pandemic. Several experiments were conducted on the daily stock prices of ten insurance companies, collected by the Amman Stock Exchange, to evaluate the selected technical analysis methods. The experimental results show that the non-parametric Exponential Decay Weighted Average (EDWA) has higher forecasting capabilities than some of the more popular forecasting strategies, such as Simple Moving Average, Weighted Moving Average, and Exponential Smoothing. As a result, we show that using EDWA to forecast the share price of insurance companies in Jordan is good practice. From a technical analysis perspective, our research also shows that the pandemic had different effects on different Jordanian insurance companies.
1. Introduction
According to the Amman Stock Exchange (ASE), Jordan now has 20 insurance businesses listed, as well as several companies that have been liquidated owing to financial problems. This is a huge number for a small country such as Jordan, whose insurance market is relatively small compared to many of its regional peers, contributing to around 3% of the MENA region’s gross written premiums. In particular, this is seen when compared to a much larger country such as Egypt, which only has 32 insurance companies, some of which are among the region’s oldest (Oxford Business Group 2017). Only the Arab Orient Insurance Company (with a 16.5% share of gross premiums), Jordan Insurance (10.14%), and Middle East Insurance (7.35%) exceeded the 5% market share threshold in the first half of 2013, according to data from the Jordan Insurance Federation (JOIF), along with First Insurance claiming a share of 4.9% of the Jordanian market (Oxford Business Group 2017).
Despite the potential need for consolidation, the business has been devoid of mergers and acquisitions for more than two decades. Because the majority of the market is concentrated on third-party vehicle insurance, whose premiums are set by the government, merging two motor-focused companies to form a larger one makes no sense.
Furthermore, some companies have lacked the solvency margin since 2015, and they have neither been warned nor taken legal action to rectify the situation. Another big issue arises in the vehicle insurance market by bypassing or evading the concept of compulsory insurance; the victim is the citizen, who falls into the trap of some insurance brokers, while the reputation of the sector suffers as a result. Furthermore, the increase in the market share of some compulsory insurance companies in violation or circumvention of the instructions represents an increase in the number of insured citizens who will become potential victims of these companies’ inability to fulfill their obligations to them, even if they have a solvency margin equal to or exceeding the minimum. It generates enough profit from its operations to offset losses resulting from compulsory insurance.
The challenge for insurers stems from the regulatory requirement that, in order to sell comprehensive coverage, companies must also provide third-party liability (TPL) coverage at a government-determined rate. TPL premiums are now low, according to the industry, and many insurers accept losses on this line of business, which they try to offset with more profitable comprehensive offers. As a result, technical outcomes are under pressure, which will persist if the industry faces structural challenges (Oxford Business Group 2020).
These challenges, among other things, resulted in financial losses and caused some insurance companies to be hesitant to pay claims, as well as harming the industry’s reputation. After the COVID-19 pandemic in early 2020, the financial status of this industry will deteriorate much further. We will use technical analysis tools to forecast the share price of a randomly selected Jordan insurance company in order to shed light on their performance and determine which technical analysis tool is the best suited for forecasting.
Due to the instable and complex nature of such markets, data amount, high degree of ambiguity, noise, and the fact that they are always affected by numerous factors, forecasting the stock market and other traded financial instruments has always been a challenging task (Khan 2014; Agrawal et al. 2013; Ghatasheh et al. 2020). Stock market forecasting refers to the actions made to provide interested parties, such as investors and customers, with a predictable picture of the future direction and variation of the object price. Investors could make successful decisions or prevent losses if they could accurately forecast future stock prices (Singh et al. 2019, 2021; Sunny et al. 2020; Lin et al. 2020; Shynkevich et al. 2017; Mehta et al. 2021; Zhuo et al. 2021).
We argue that the choice of a technical analysis tool is governed by the ambiguity and subjectivity that surrounds determining the optimal time range for a predictor to consider when making a valid estimate. This is because there is no optimal time range and no consensus among analysts on what number of days, months, or years from a time series the forecaster should choose in order to make an acceptable and accurate forecasting. Choosing different periods may have an impact on the accuracy of forecasting and result in various outcomes. For example, we choose different periods of data for both well-known simple moving average (SMA), and weighted moving average (WMA) to forecast the price share of one of the insurance companies, namely Middle East Insurance. We evaluate the forecasting outcome using different error measures such as mean absolute error (MAE), mean percentage error (MPE), mean square error (MSE), tracking signal (TS), and mean absolute percent error (MAPE). Table 1 shows these pilot results.

Table 1.
The performance of SMA and WMA using the daily closing prices of Middle East Insurance inc. in 2020. Data obtained from Amman stock exchange (https://www.ase.com.jo/en/company_historical/MEIN, accessed on 1 November 2021). STD: standard deviation.
As can be seen in Table 1, which shows that depending on the time range used (5, 10, 15 and 20 days), SMA and WMA showed different results. As a result, this could lead to incorrect stock price forecasts and thus poor investment decisions. For example, the errors in the results are higher when using 20 days than when using a period of 10 days. Accordingly, the significance of the time frame chosen, which is heavily dependent on personal experience, determines the stock’s price prediction and accuracy. On the contrary, our EDWA will consider all available data points in a time series dataset.
As can be seen in Table 1, which shows that depending on the time range used (5, 10, 15, and 20 days), SMA and WMA showed different results. As a result, this could lead to incorrect stock price forecasts and thus poor investment decisions. For example, the errors in the results are higher when using 20 days than when using a period of 10 days. Accordingly, the significance of the time frame chosen, which is heavily dependent on personal experience, determines the stock’s price prediction and accuracy. On the contrary, our EDWA will consider all available data points in a time series dataset.
To avoid the time parameter, we contemplate our earlier nonparametric forecasting method (Altarawneh 2019; Hassanat et al. 2021), known as the Exponential Decay Weighted Average (EDWA), comparing it with other technical analysis tools, to predict the share price of Jordanian insurance companies, especially during the COVID-19 period, and see which is a viable tool for forecasting stock prices.
Basically, WMA and exponential smoothing approaches (ES) are both used to create the EDWA forecasting method. This method considers the entire time series as we argue that a technical analysis method that takes into account all data, not just some historical data points, is beneficial for forecasting in general, and for forecasting stock price of Jordanian insurance companies in particular, as these companies’ challenges and problems have persisted for a long time.
Since the most recent share price is more relevant and important than previous prices, EDWA also weights it more heavily. However, this allows other factors to affect stock prices as we dig deeper into a time series. Therefore, we weight the current prices higher, which are influenced by current factors, such as the COVID-19 pandemic, while also giving lower weights to the older prices, which are influenced by older factors that are still influencing the stock price. It is worth noting that the literature confirms that no single method or model can 100% accurately assess and anticipate complex data patterns; in addition, a wide variety of economic and non-economic factors also influence stock markets (Agrawal et al. 2013; Santos 2011; Fikru 2019).
2. Related Literature
The random walk theory (Fama et al. 1969; Fama 1995), and the Efficient Market Hypothesis (Fama 1965) were used as primary models on which a variety of stock market prediction methodologies were built. On the other hand, investigations based on these models revealed that the price of a stock cannot be accurately forecast. Although the financial market is difficult, chaotic, unstable, nonlinear, and dynamic in nature, it can be anticipated with an accuracy of more than 50%, according to some empirical studies (Malkiel 2003; Prechter and Parker 2007; Bollen et al. 2011), and it does not follow the random walk model (Lo and MacKinlay 1988).
To forecast the stock’s trend, a plethora of methodologies have been employed in the literature. Technical analysis, Fundamental analysis, and Machine learning methods are the three primary themes of prediction methodologies used.
Technical analysis is an approach employed to forecast the direction and movement of future stocks price and other traded securities, using solely the company’s historical stock prices and trading volumes. In technical analysis, we look at the price data patterns that demonstrate continuations or setbacks in a stock market trend. Technical analysis encompasses numerous techniques, such as the simple moving average (SMA), exponential smoothing (ES), weighted moving average (WMA), Candlestick Agent, and others. In the financial field, most of the traditional techniques of stock price prediction use statistical methods, which were generated from historical data.
The approach of technical analysis is used extensively for predicting future stock prices based purely on the company’s previous trading volumes and stock prices (Turner 2007; Chourmouziadis and Chatzoglou 2016). In technical analysis, we look at price data patterns to see if the stock market trend is continuing or reversing. SMA, ES, WMA, Candlestick Agent, and other approaches are all used in technical analysis. Most classic stock price prediction strategies in the financial world rely on statistical methodologies derived from past data (Park and Irwin 2007; Edwards et al. 2012; Nti et al. 2020).
The fundamental analysis approach, on the other hand, evaluates the company’s intrinsic values based on an examination of its financial statements and economic indicators in order to forecast future stock prices, examples of such approach include (Chen and Chen 2013; Drakopoulou 2016; Chen et al. 2017; Abarbanell and Bushee 1997; Muhammad 2018).
Artificial neural networks and Genetic Algorithms among others are examples of tools and methodologies used in artificial intelligence research field to anticipate stock market movements. Many studies have looked into the benefits of using such approaches including and are not limited to (Nevasalmi 2020; Patel et al. 2015; Khan et al. 2020; Nabipour et al. 2020; Zhong and Enke 2019; Singh 2018; Chowdhury et al. 2020; Valencia et al. 2019). In addition to a slew of other studies attempting to build and discover new machine learning approaches, including (Qiu and Yu 2016; Narloch et al. 2019; Khashei and Hajirahimi 2018; Samer et al. 2018; Abadleh et al. 2021; Chi 2018). Artificial intelligence and Machine learning in particular are not just for prediction and forecasting; they are also employed in a variety of other areas such as Natural Language Processing (Alghamdi and Teahan 2017; Hassanat and Altarawneh 2014; Hassanat and Jassim 2010; Al-Shamaileh et al. 2019; Hassanat et al. 2015b, 2015c; Tarawneh et al. 2020a; Hassanat and Tarawneh 2016), Software engineering (Salman et al. 2018; Eyal Salman 2017; Eyal Salman et al. 2015), Internet of things (Mnasri et al. 2014, 2015, 2017a, 2017b, 2018a, 2018b, 2019, 2020; Abdallah et al. 2020a, 2020b; Tlili et al. 2021), Computer vision (AlTarawneh et al. 2017; Alqatawneh et al. 2019; Tarawneh et al. 2018, 2019a, 2019b, 2020b; Al-Btoush et al. 2019; Hassanat et al. 2015a, 2017a, 2017b, 2018a; Hassanat and Tarawneh 2016; Hassanat 2018e), Game theory (De Voogt et al. 2017; Hassanat et al. 2018b), Big data classification (Hassanat 2018a, 2018b, 2018c, 2018d, 2018e), Security Network and Anomaly Detection (Al-kasassbeh and Khairallah 2019; Al-Naymat et al. 2018; Zuraiq and Alkasassbeh 2019; Almseidin et al. 2019a, 2019b, 2019c; Abuzuraiq et al. 2020; Al-Kasassbeh et al. 2019; Almseidin et al. 2019c; Alothman et al. 2020; Rawashdeh et al. 2018; Alkasassbeh 2018; Hassanat et al. 2022). Security is a field that can benefit from machine learning techniques. Using a biometric key derived from machine learning models, it is possible to maintain a communication link between senders and receivers (Hamadaqa et al. 2019; Mulhem et al. 2019; Mars et al. 2019). Moreover, the use of machine learning can be applied to indoor localization and distance estimation (Alabadleh et al. 2018; Aljaafreh et al. 2017; Abadleh et al. 2016, 2017).
Forecasting practitioners, on the other hand, demonstrate the utility and application of technical analysis. This is particularly evident on financial websites and in newspapers that process financial and statistical data using technical analysis. Furthermore, in recent years, study on the profitability of technical analysis has expanded. For example, (Park and Irwin 2007) reviewed studies that investigated the potential profits provided by technical analysis. They discovered that technical analysis consistently generates profit in a variety of markets, including the stock and foreign currency markets.
According to (Mitra 2011), most technical trading techniques may reasonably capture the direction of market moves and provide considerable positive returns in both long and short positions. In another interesting study (Vasiliou et al. 2006), the Athens Stock Exchange was used to see how well simple technical analysis can forecast stock price fluctuations. This study looked into these consequences for the Athens market’s most important index, the Athens General Index. Standard tests and bootstrap are among the approaches used for the evaluation. The findings support the technical analysis methods investigated.
Brock et al. (1992) conducted a seminal empirical study to prove technical analysis profitability. The same work was extended by (Ma 2022), comparing the profitabilities of using the official closing price vs. the last tick price, based on data from Hong Kong from 2011 to 2018, and the results suggest that using the last tick price rather than the official closing price improves profitability significantly using technical analysis methods.
Ausloos and Ivanova (2002) recalled the traditional technical analysis methods of stock evolution. Momentum indicators are used to predict the direction of a market trend and so provide signals before the trend changes. As a result, a typical technical analysis investing plan is sketched.
In his study, (Zulkarnain 2014) sought to see whether SMA technical analysis can be used to forecast top gainers’ stock prices on the Indonesia Stock Exchange (IDX). He concluded that the difference between forecasted and actual prices is not significant. As a result, technical analysis is still a valuable tool for financial forecasting. (Wong et al. 2010) focused on the importance of technical analysis in determining when to enter and exit the stock market. The results show that the indicators used can achieve a high positive return. Singapore Stock Exchange (SES) member firms have been found to rely heavily on technical analysis, which has resulted in big profits. Hence, technical analysis seems to be an ideal approach to select some of its techniques and try to propose a new model based on it in order to improve the investor’s predictive potential. Our EDWA falls into this forecast category.
3. Materials and Methods
The EDWA forecasting method is a mix of WMA and ES, but differs in the weighting and time period used. There is no specific time period here, as the method uses all available data starting with the current value up to day 1 and it gives a higher weight to the current value and the next value; this is similar to WMA but goes back to day 1. However, to emphasize the importance of the most recent values, we propose assigning a weight that is weighted twice as much as the previous value, so the method becomes almost similar to ES in terms of the weighting system.
EDWA usually assigns a certain initial weight to the final price, which is set to 2 by default, and this weight is reduced in half (exponential decrease) with each subsequent price. In other words, the current price is weighted with 2, the previous day weighted with 2/2, the previous day with 1/2 and so on up to day 1. This is why it is known as the exponentially decaying weighted average.
It is worth noting that if the time series is lengthy, the decaying weight may approach 0 due to the precision of floating point on today’s computers. To get around this issue, EDWA applies the lowest weight possible to all deeper prices in the time series. The EDWA formula is as follows:
where , n is the number of days or prices in the time series, pt is the current price, pt−1 is the previous price, and pt−n+1 is the oldest price.
The SMA is defined by
WMA is defined by
ES is defined by
where is the forecasted value, is the actual price of the share at time (day) , is the number of concerned days, is the weighting factors and is a smoothing constant.
To obtain the general trend of the share price of our sample study, we propose the use of the average of the averages of all periods, starting with the current price and going back by one day each time to obtain n averages, where n is the size of the time series, then we divide the sum of these averages by n, as formulated by
where Avgavg(n + 1) is the forecasted price of a time series of size = n based on the average of the averages of all previous prices.
The chosen technical analysis methods, namely EDWA, SMA, WMA, and ES, were applied to the time series datasets of the Jordanian insurance companies for forecasting. These methods were compared based on their forecasting results. To measure the forecasting error of each method we opt for some of the well-known error indicators, namely MAE, MSE, MPE, MAPE, and TS (Lei 2017; Haji Rahimi and Khashei 2018).
Since all of these indicators are based on the forecasting error, we define the forecast error as
where E(t) is the forecasting error at time t (on our case day), P(t) is the actual share price, and F(t) is the forecasted price at the same t. Consequently, the Absolute forecasting error (AE) is defined by
the Percent Error (PE) is defined by
and the Absolute Percent Error (APE) is defined by
Accordingly, we can define the error measures of forecasting as
and
where n is the number of forecasted prices, in this work, it is equal to the size of the time series minus 1, since we are going to forecast all prices from day 1 through day n (the current price) in order to be able to use a ground-Compare truth price to calculate forecast error.
To forecast the stock price of Jordanian insurance companies during COVID-19, we collected the daily closing prices of 10 Jordanian insurance companies, out of 20 insurance companies, because there was not enough publicly available data for the rest of the other 10 companies. The data were collected from the official website of the Amman Stock Exchange (https://www.ase.com.jo/, accessed on 1 November 2021). Such online systems’ data sources are typically historical stock prices and/or technical indicators derived from a time series examination of stock prices (Chourmouziadis and Chatzoglou 2016; Kimoto et al. 1990; Qian and Rasheed 2007). The period of the prices of each company starts from January 2018 to November 2021. Thus, we covered two distinct periods: the COVID-19 pandemic period (2020–2021), and the non-pandemic period (2018–2019).
For the sake of simplicity, we restricted the data to the daily closing prices. Each time series consists of 51 to 220 closing prices, this is all available data retrieved from the official Amman Stock Exchange website for the past four years. Table 2 shows the 10 Jordanian insurance companies investigated in this study. Table 3 shows some basic statistics of the insurance companies chosen.
Table 2.
Description of the study sample.
Table 3.
Basic statistics of the study sample. All prices in Jordan Dinar.
4. Results and Discussion
For the forecast, the chosen technical analysis methods EDWA, SMA, WMA, and ES were first applied to one of the time series datasets of the Jordanian insurance companies, namely MEIN. Figure 1, Figure 2, Figure 3 and Figure 4 illustrate the forecast results for each method.
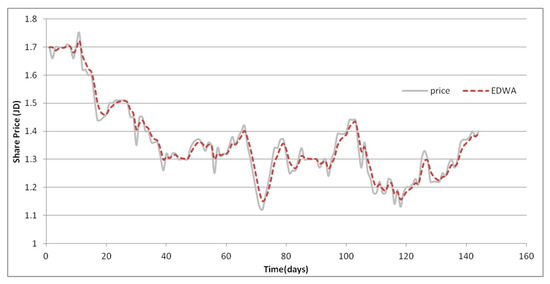
Figure 1.
Forecasting results of MEIN using EDWA.
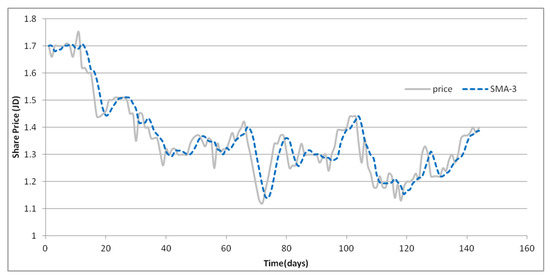
Figure 2.
Forecasting results of MEIN using SMA on 3 days period.
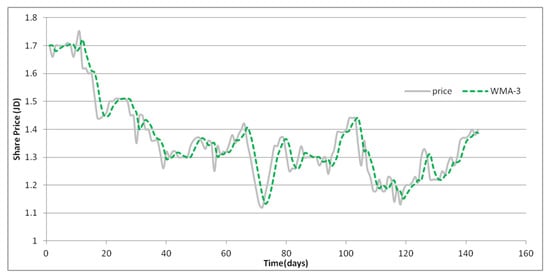
Figure 3.
Forecasting results of MEIN using WMA on 3 days period.
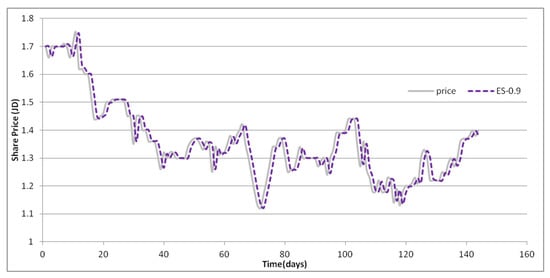
Figure 4.
Forecasting results of MEIN using ES, with alpha = 0.9.
If we examine the curves in Figure 1, Figure 2, Figure 3 and Figure 4, we can see that both EDWA and ES have significantly higher forecasting performance than SMA and WMA. Perhaps such a solid performance is due to the inclusion of all prices in the time series that both EDWA and ES enable. Although both SMA and WMA used only three days more, the outcomes were not comparable. However, to support this conclusion, we need to apply these approaches to of the all Jordanian insurance companies’ datasets, gather measures of error for a fair comparison, and determine which technical analysis methods are most suited to our data. Table 4, Table 5 and Table 6 show the measures of error after forecasting all 10 datasets using the four technical analysis methods.
Table 4.
Forecast errors of technical analysis methods on MEIN, AAIN, JOIN, and AICJ. Bold values signify the minimum error.
Table 5.
Forecast errors of technical analysis methods on DICL, JOFR, JERY and UNIN. Bold values signify the minimum error.
Table 6.
Forecast errors of technical analysis methods on ARSI and AOIC. Bold values signify the minimum error.
Interestingly, EDWMA scored the fewest errors of the most commonly used error indicators, followed by ES when a = 0.09 was used, as can be seen in Table 4, Table 5 and Table 6. Even when SMA and WMA were used at various time intervals, both EDWMA and ES methods perform much better in terms of few errors and highly accurate forecasting. If the TS error indicator is major concern, the ES outperforms almost all methods, although the error difference is not significant when compared to EDWMA. These findings confirm our contention that it is better to incorporate all historical data when using a technical analysis tool.
ES appears to favor a certain value (a = 0.9) (Chopra and Meindl 2013; Paul 2011), and hence requires parameter adjustment before being used in practice, whereas EDWMA is a non-parametric technique that does not require parameter input prior to the forecasting process. The EDWMA provides good forecasting for Jordanian insurance companies because it is a non-parametric method that outperforms all other methods on all datasets as shown by most error measures used.
We looked at the use of EDWMA and ES for forecasting share prices before and after the pandemic because they were the top forecasters. Table 7 and Table 8 show the forecasting results.
Table 7 and Table 8 show that both EDWMA and ES have good forecasting performance on insurance company price shares both before and after the pandemic. This demonstrates that technical analysis approaches are a suitable fit for such scenarios, and this finding is consistent with earlier research (Wong et al. 2010; Taylor and Allen 1992; Mitra 2011; Ausloos and Ivanova 2002; Vasiliou et al. 2006; Ma 2022), for example.
It is worth noticing that the EDWMA performed better before and after the epidemic on most datasets. Another interesting observation is the forecasting error before and after the pandemic. We can see that forecasting errors for some companies, such as JERY, ARSI, AICJ, UNIN, and MEIN decreased after the pandemic. This could be due to the nature of stock prices being more predictable after the major effect of the pandemic.
Other companies, such as DICL, AAIN, and AOIC, on the other hand, have marginally better forecasting outcomes prior to the pandemic. Additionally, two companies, JOIN and JOFR, demonstrate no substantial difference in forecasting performance before and after the pandemic. As a result, we cannot generalize the impact of the COVID-19 pandemic on Jordan’s insurance business in terms of forecasting results (before and after) because each company has its own set of conditions.
To investigate the trend of the share prices of the selected Jordanian insurance companies, we applied the proposed Avgavg equation. The results of the trends are shown in Figure 5.
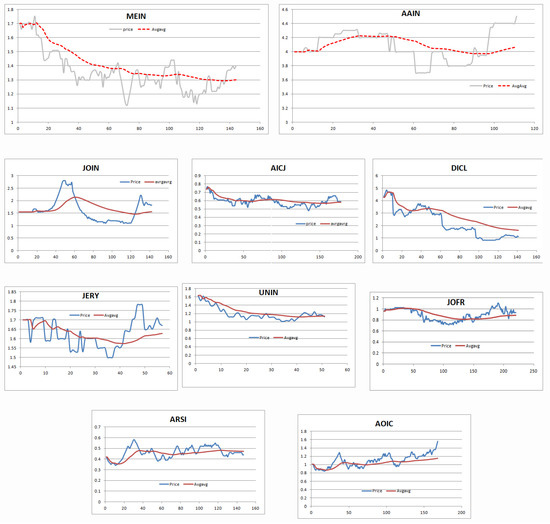
Figure 5.
Avgavg trends approximation of share prices.
As shown in Figure 5, the Avgavg closely approximates share price trends. Most insurance companies started with a higher share price before the pandemic, which means that the pandemic partially hit the majority of the insurance companies surveyed. AOIC, on the other hand, is on a steady upward trajectory. Perhaps they found solutions to deal with the pandemic, or even profited from it. Additionally, if not increasing them, most companies stopped their share prices from falling, as they weathered the pandemic.
5. Conclusions
In this study, we used several technical analysis tools to forecast the share prices of a random sample of Jordanian insurance companies and examine their performance during the COVID-19 pandemic. The technical analysis tools used include parametric methods, namely SMA, WMA, ES, and one non-parametric method, our EDWMA, in addition to our trend approximation method, the Avgavg.
The experiments, which were conducted on the share prices of 10 Jordanian insurance companies, evaluated the forecasting performance against a range of error measures, including MAE, MAPE, MPE, MSE, and TS. The forecast results show that our EDWMA, followed by ES, are the best performers because of their reliance on all the historical prices. In contrast to EDWMA, the results show that the parametric methods must first be tuned before they can be used. This makes EDWMA the best choice for forecasting the datasets used. Moreover, the Avgavg interestingly exhibits the trends of the share prices of the analyzed companies and shows their performance in relation to the share prices before and after the COVID-19 pandemic.
The study has two limitations. First, due to a lack of publicly available data, the number of insurance companies tested was limited to ten, which represents half of the current insurance companies in Jordan. Second, we only employed a few common technical analysis approaches, ignoring a vast number of cutting-edge machine learning methods, such as deep learning forecasting methods. Our future research will concentrate on overcoming both limitations, particularly by integrating EDWMA with deep learning, as well as looking into more financial sectors.
Author Contributions
Conceptualization, G.A.A. and A.B.H.; methodology, G.A.A.; software, A.B.H.; validation, A.S.T., A.B.H. and A.A.; formal analysis, A.S.T.; investigation, A.A.; resources, A.A., M.A. (Malek Alrashidi), M.A. (Mansoor Alghamdi); data curation, A.A.; writing—original draft preparation, G.A.A., A.B.H., A.S.T., M.A. (Malek Alrashidi), M.A. (Mansoor Alghamdi) and A.A.; writing—review and editing, G.A.A., A.B.H., A.S.T., M.A. (Malek Alrashidi), M.A. (Mansoor Alghamdi) and A.A.; visualization, A.S.T.; supervision, A.B.H.; project administration, A.B.H. All authors have read and agreed to the published version of the manuscript.
Funding
This research received no external funding.
Institutional Review Board Statement
Not applicable.
Informed Consent Statement
Not applicable.
Data Availability Statement
All data used for the purpose of this study is available online at Amman stock exchange: https://www.ase.com.jo, accessed on 1 November 2021.
Conflicts of Interest
The authors declare no conflict of interest.
References
- Abadleh, Ahmad, Bassam M. Al-Mahadeen, Rami M. AlNaimat, and Omar Lasassmeh. 2021. Noise segmentation for step detection and distance estimation using smartphone sensor data. Wireless Networks 27: 2337–46. [Google Scholar] [CrossRef]
- Abadleh, Ahmad, Eshraaq Al-Hawari, Esra’a Alkafaween, and Hamad Al-Sawalqah. 2017. Step detection algorithm for accurate distance estimation using dynamic step length. Paper presented at the 2017 18th IEEE International Conference on Mobile Data Management (MDM), Daejeon, Korea, May 29–June 1. [Google Scholar]
- Abadleh, Ahmad, Sangyup Han, Soon Joo Hyun, Ben Lee, and Myungchul Kim. 2016. Construction of indoor floor plan and localization. Wireless Networks 22: 175–91. [Google Scholar] [CrossRef]
- Abarbanell, Jeffrey, and Brian J. Bushee. 1997. Fundamental Analysis, Future Earnings, and Stock Prices. Journal of Accounting Research 35: 1–24. [Google Scholar] [CrossRef]
- Abdallah, Wajih, Sami Mnasri, and Thierry Val. 2020a. Genetic-Voronoi algorithm for coverage of IoT data collection networks. Paper presented at the 30th International Conference on Computer Theory and Applications, ICCTA 2020, Alexandria, Egypt, December 2–14. [Google Scholar]
- Abdallah, Wajih, Sami Mnasri, Nejah Nasri, and Thierry Val. 2020b. Emergent IoT Wireless Technologies beyond the year 2020: A Comprehensive Comparative Analysis. Paper presented at the 2020 International Conference on Computing and Information Technology (ICCIT-1441), Tabuk, Saudi Arabia, September 9–10. [Google Scholar]
- Abuzuraiq, AlMaha, Mouhammd Alkasassbeh, and Muhammad Almseidin. 2020. Intelligent Methods for Accurately Detecting Phishing Websites. Paper presented at the 2020 11th International Conference on Information and Communication Systems, ICICS 2020, Irbid, Jordan, April 7–9. [Google Scholar]
- Agrawal, J. G., V. S. Chourasia, and A. K. Mittra. 2013. State-of-the-Art in Stock Prediction Techniques. International Journal of Advanced Research in Electrical, Electronics and Instrumentation Engineering 2: 1360–66. [Google Scholar]
- Alabadleh, Ahmad, Saqer Aljaafreh, Ahmad Aljaafreh, and Khaled Alawasa. 2018. A RSS-based localization method using HMM-based error correction. Journal of Location Based Services 12: 273–85. [Google Scholar] [CrossRef]
- Al-Btoush, Audi I., Mohammad A. Abbadi, Ahmad B. Hassanat, Ahmad S. Tarawneh, Asad Hasanat, and V. B. Surya Prasath. 2019. New Features for Eye-Tracking Systems: Preliminary Results. Paper presented at the 2019 10th International Conference on Information and Communication Systems (ICICS), Irbid, Jordan, June 11–13. [Google Scholar]
- Alghamdi, Mansoor, and William Teahan. 2017. Experimental evaluation of Arabic OCR systems. PSU Research Review 1: 229–41. [Google Scholar] [CrossRef]
- Aljaafreh, Ahmad, Khaled Alawasa, Saqer Alja’afreh, and Ahmad Abadleh. 2017. Fuzzy inference system for speed bumps detection using smart phone accelerometer sensor. Journal of Telecommunication, Electronic and Computer Engineering 9: 133–36. [Google Scholar]
- Al-kasassbeh, Mouhammd, and Tarek Khairallah. 2019. Winning tactics with DNS tunneling. Network Security 2019: 12–19. [Google Scholar] [CrossRef]
- Al-Kasassbeh, Mouhammd, Safaa Mohammed, Mohammad Alauthman, and Ammar Almomani. 2019. Feature selection using a machine learning to classify a malware. In Handbook of Computer Networks and Cyber Security. Cham: Springer, pp. 889–904. [Google Scholar]
- Alkasassbeh, Mouhammd. 2018. A novel hybrid method for network anomaly detection based on traffic prediction and change point detection. Journal of Computer Science 14: 1–11. [Google Scholar] [CrossRef][Green Version]
- Almseidin, Mohammad, Imre Piller, Mouhammd Al-Kasassbeh, and Szilveszter Kovacs. 2019a. Fuzzy automaton as a detection mechanism for the multi-step attack. International Journal on Advanced Science, Engineering and Information Technology 9: 575–86. [Google Scholar] [CrossRef]
- Almseidin, Muhammad, AlMaha Abu Zuraiq, Mouhammd Al-kasassbeh, and Nidal Alnidami. 2019b. Phishing detection based on machine learning and feature selection methods. International Journal of Interactive Mobile Technologies 13: 171–83. [Google Scholar] [CrossRef]
- Almseidin, Muhammad, Mouhammd Al-Kasassbeh, and Szilveszter Kovacs. 2019c. Detecting Slow Port Scan Using Fuzzy Rule Interpolation. Paper presented at the 2019 2nd International Conference on New Trends in Computing Sciences, ICTCS 2019, Amman, Jordan, October 9–11. [Google Scholar]
- Al-Naymat, Ghazi, Mouhammd Al-Kasassbeh, and Eshraq Al-Hawari. 2018. Using machine learning methods for detecting network anomalies within SNMP-MIB dataset. International Journal of Wireless and Mobile Computing 15: 67–76. [Google Scholar] [CrossRef]
- Alothman, Zainab, Mouhammd Alkasassbeh, and Sherenaz Al-Haj Baddar. 2020. An efficient approach to detect IoT botnet attacks using machine learning. Journal of High Speed Networks 26: 1–14. [Google Scholar] [CrossRef]
- Alqatawneh, Alaa, Rania Alhalaseh, Ahmad Hassanat, and Mohammad Abbadi. 2019. Statistical-Hypothesis-Aided Tests for Epilepsy Classification. Computers 8: 84. [Google Scholar] [CrossRef]
- Al-Shamaileh, Mohammad Z., Ahmad B. Hassanat, Ahmad. S. Tarawneh, MD Sohel Rahman, Ceyhun Celik, and Moohanad Jawthari. 2019. New Online/Offline text-dependent Arabic Handwriting dataset for Writer Authentication and Identification. Paper presented at the 2019 10th International Conference on Information and Communication Systems (ICICS), Irbid, Jordan, June 11–13; pp. 116–21. [Google Scholar]
- Altarawneh, Ghada. 2019. Prediction of Stock Price Using A Hybrid Technical Analysis Method. Science International Lahore 31: 391–96. [Google Scholar]
- AlTarawneh, Ragaad, Manal AlKhoshrman, Yousef Nabeel, Shah Rukh Humayoun, and Ahmad Hassanat. 2017. The Story of Designing an Educational Mobile Application for Children in South of Jordan. Paper presented at the 31st International BCS Human Computer Interaction Conference (HCI 2017), London, UK, July 3–6. [Google Scholar]
- Ausloos, Maecel, and Katrin Ivanova. 2002. Mechanistic approach to generalized technical analysis of share prices and stock market indices. The European Physical Journal B-Condensed Matter and Complex Systems 27: 177–87. [Google Scholar] [CrossRef][Green Version]
- Bollen, Johan, Huina Mao, and Xiaojun Zeng. 2011. Twitter mood predicts the stock market. Journal of Computational Science 2: 1–8. [Google Scholar] [CrossRef]
- Brock, William, Josef Lakonishok, and Blake LeBaron. 1992. Simple technical trading rules and the stochastic properties of stock returns. The Journal of Finance 47: 1731–64. [Google Scholar] [CrossRef]
- Chen, Yuh-Jen, and Yuh-Min Chen. 2013. A fundamental analysis-based method for stock market forecasting. Paper presented at the 2013 International Conference on Intelligent Control and Information Processing, ICICIP 2013, Dali, China, June 9–11. [Google Scholar]
- Chen, Yuh-Jen, Yuh-Min Chen, and Chang Lin Lu. 2017. Enhancement of stock market forecasting using an improved fundamental analysis-based approach. Soft Computing 21: 3735–57. [Google Scholar] [CrossRef]
- Chi, Wan Le. 2018. Stock price forecasting based on time series analysis. In AIP Conference Proceedings. New York: AIP Publishing LLC. [Google Scholar]
- Chopra, Sunil, and Peter Meindl. 2013. Supply Chain Management: Strategy, Planning, and Operation, 5th ed. Hoboken: Prentice Hall, p. 195. [Google Scholar]
- Chourmouziadis, Konstandinos, and Prodromos D. Chatzoglou. 2016. An intelligent short term stock trading fuzzy system for assisting investors in portfolio management. Expert Systems with Applications 43: 298–311. [Google Scholar] [CrossRef]
- Chowdhury, Reaz, M. R. Mahdy, Tanisha N. Alam, Golam D. Al Quaderi, and M. Arifur Rahman. 2020. Predicting the stock price of frontier markets using machine learning and modified Black–Scholes Option pricing model. Physica A: Statistical Mechanics and Its Applications 555: 124444. [Google Scholar] [CrossRef]
- De Voogt, Alex, Ahmad Hassanat, and Mahmoud Alhasanat. 2017. The history and distribution of tab: A survey of Petra’s gaming boards. Journal of Near Eastern Studies 76: 93–101. [Google Scholar] [CrossRef]
- Drakopoulou, Veliota. 2016. A Review of Fundamental and Technical Stock Analysis Techniques. Journal of Stock & Forex Trading 5: 1–8. [Google Scholar]
- Edwards, Robert, John Magee, and W. H. Bassetti. 2012. Technical Analysis of Stock Trends. Boca Raton: CRC Press. [Google Scholar]
- Eyal Salman, Hamzeh, Abdelhak-Djamel Seriai, and Christophe Dony. 2015. Feature-level change impact analysis using formal concept analysis. International Journal of Software Engineering and Knowledge Engineering 25: 69–92. [Google Scholar] [CrossRef]
- Eyal Salman, Hamzeh. 2017. Identification multi-level frequent usage patterns from APIs. Journal of Systems and Software 130: 42–56. [Google Scholar] [CrossRef]
- Fama, Eugene, Lawrence Fisher, Michael Jensen, and Richard Roll. 1969. The adjustment of stock prices to new information. Nternational Economic Review 10: 1–21. [Google Scholar] [CrossRef]
- Fama, Eugene. 1965. The behavior of stock-market prices. The Journal of Business 38: 34–105. [Google Scholar] [CrossRef]
- Fama, Eugene. 1995. Random walks in stock market prices. Financial Analysts Journal 51: 75–80. [Google Scholar] [CrossRef]
- Fikru, Mahelet. 2019. Estimated electricity bill savings for residential solar photovoltaic system owners: Are they accurate enough? Applied Energy 253: 113501. [Google Scholar] [CrossRef]
- Ghatasheh, Nazeeh, Hossam Faris, Ruba Abukhurma, Pedro Castillo, Nailah Al-Madi, Antonio Mora, Ala Al-Zoubi, and Ahmad Hassanat. 2020. Cost-sensitive ensemble methods for bankruptcy prediction in a highly imbalanced data distribution: A real case from the Spanish market. Progress in Artificial Intelligence 9: 361–75. [Google Scholar] [CrossRef]
- Haji Rahimi, Zahra, and Mehdi Khashei. 2018. A least squares-based parallel hybridization of statistical and intelligent models for time series forecasting. Computers & Industrial Engineering 118: 44–53. [Google Scholar]
- Hamadaqa, Emad, Ahmad Abadleh, Ayoub Mars, and Wael Adi. 2019. Highly Secured Implantable Medical Devices. Paper presented at the International Conference on Innovations in Information Technology (IIT), Al Ain, United Arab Emiratespp, November 7–12. [Google Scholar]
- Hassanat, Aahmad B., and Ahmad Tarawneh. 2016. Fusion of color and statistic features for enhancing content-based image retrieval systems. Journal of Theoretical and Applied Information Technology 88: 644–55. [Google Scholar]
- Hassanat, Ahmad B. 2018a. Furthest-Pair-Based Binary Search Tree for Speeding Big Data Classification Using K-Nearest Neighbors. Big Data 6: 225–35. [Google Scholar] [CrossRef]
- Hassanat, Ahmad B. 2018b. Furthest-Pair-Based Decision Trees: Experimental Results on Big Data Classification. Information 9: 284. [Google Scholar] [CrossRef]
- Hassanat, Ahmad B. 2018c. Norm-Based Binary Search Trees for Speeding Up KNN Big Data Classification. Computers 7: 54. [Google Scholar] [CrossRef]
- Hassanat, Ahmad B. 2018d. Two-point-based binary search trees for accelerating big data classification using KNN. PLoS ONE 13: e0207772. [Google Scholar] [CrossRef]
- Hassanat, Ahmad B. 2018e. On Identifying Terrorists Using Their Victory Signs. Data Science Journal 17: 27. [Google Scholar] [CrossRef]
- Hassanat, Ahmad B., Ahmad S. Tarawneh, Samer Subhi Abed, Ghada Awad Altarawneh, Malek Alrashidi, and Mansoor Alghamdi. 2022. RDPVR: Random Data Partitioning with Voting Rule for Machine Learning from Class-Imbalanced Datasets. Electronics 11: 228. [Google Scholar] [CrossRef]
- Hassanat, Ahmad B., and Ghada Altarawneh. 2014. Rule-and dictionary-based solution for variations in written Arabic names in social networks, big data, accounting systems and large databases. Research Journal of Applied Sciences, Engineering and Technology 8: 1630–38. [Google Scholar] [CrossRef]
- Hassanat, Ahmad B., and Sabah Jassim. 2010. Visual words for lip-reading. In Proceedings of SPIE. Bellingham: The International Society for Optical Engineering, vol. 7708. [Google Scholar]
- Hassanat, Ahmad B., Ghada Altarawneh, Ahmad S. Tarawneh, Hossam Faris, Mahmoud B. Alhasanat, Alex de Voogt, Bakir Al-Rawashdeh, Muhammad Alshamaileh, and Surya V. B. Prasath. 2018a. On Computerizing the Ancient Game of Ṭāb. International Journal of Gaming and Computer-Mediated Simulations 10: 20–40. [Google Scholar] [CrossRef]
- Hassanat, Ahmad B., Mouhammd Alkasassbeh, Mouhammd Al-awadi, and Esra’a Alhasanat. 2015a. Color-based object segmentation method using artificial neural network. Simulation Modelling Practice and Theory 64: 3–17. [Google Scholar] [CrossRef]
- Hassanat, Ahmad B., Mouhammd Alkasassbeh, Mouhammd Al-Awadi, and Esra’a Alhasanat. 2015b. Colour-based lips segmentation method using artificial neural networks. Paper presented at the 2015 6th International Conference on Information and Communication Systems (ICICS), Irbid, Jordan, April 7–9. [Google Scholar]
- Hassanat, Ahmad B., Muhammad Al-Awadi, Eman Btoush, Amani Al-Btoush, Esraa Alhasanat, and Ghada Altarawneh. 2015c. New mobile phone and webcam hand images databases for personal authentication and identification. Procedia Manufacturing 3: 4060–67. [Google Scholar] [CrossRef]
- Hassanat, Ahmad B., Sami Mnasri, Mohammed Aseeri, Khaled Alhazmi, Omar Cheikhrouhou, Ghada Altarawneh, Malek Alrashidi, Ahmad S. Tarawneh, Khalid Almohammadi, and Hani Almoamari. 2021. A simulation model for forecasting covid-19 pandemic spread: Analytical results based on the current Saudi covid-19 data. Sustainability 13: 4888. [Google Scholar] [CrossRef]
- Hassanat, Ahmad B., V. S. Prasath, Bassam M. A. Mahadeen, and Samaher M. M. Alhasanat. 2017a. Classification and gender recognition from veiled-faces. International Journal of Biometrics 9: 347. [Google Scholar] [CrossRef]
- Hassanat, Ahmad B., V. S. Prasath, Khalil Mseidein, Muhammad Al-Awadi, and Awni Hammouri. 2017b. A hybrid wavelet-shearlet approach to robust digital image watermarking. Informatica 41: 1–13. [Google Scholar]
- Hassanat, Ahmad B., V. S. Prasath, Mouhammd Al-kasassbeh, Ahmad Tarawneh, and Ahmad Al-shamailh. 2018b. Magnetic energy-based feature extraction for low-quality fingerprint images. Signal, Image and Video Processing 12: 1471–78. [Google Scholar] [CrossRef]
- Sunny, Md Arif Istiake, Mirza Maswood, and Abdullah Alharbi. 2020. Deep Learning-Based Stock Price Prediction Using LSTM and Bi-Directional LSTM Model. Paper presented at the 2nd Novel Intelligent and Leading Emerging Sciences Conference, NILES 2020, Giza, Egypt, October 24–26. [Google Scholar]
- Khan, Ayaz. 2014. How does stock prices respond to various macroeconomic factors? A case study of Pakistan. Journal of Management Info 4: 75–95. [Google Scholar] [CrossRef]
- Khan, Wasiat, Usman Malik, Mustansar A. Ghazanfar, Muhammad Azam, Khaled Alyoubi, and Ahmed S. Alfakeeh. 2020. Predicting stock market trends using machine learning algorithms via public sentiment and political situation analysis. Soft Computing 24: 11019–43. [Google Scholar] [CrossRef]
- Khashei, Mehdi, and Zahra Hajirahimi. 2018. A comparative study of series arima/mlp hybrid models for stock price forecasting. Communications in Statistics-Simulation and Computation 48: 2625–40. [Google Scholar] [CrossRef]
- Kimoto, Takashi, Kazuo Asakawa, Morio Yoda, and Masakazu Takeoka. 1990. Stock market prediction system with modular neural networks. Paper presented at the 1990 IJCNN International Joint Conference on Neural Networks, San Diego, CA, USA, June 17–21; pp. 1–6. [Google Scholar]
- Lei, L. 2017. Wavelet Neural Network Prediction Method of Stock Price Trend Based on Rough Set Attribute Reduction. Applied Soft Computing Journal 62: 923–32. [Google Scholar] [CrossRef]
- Lin, Yu-Fei, Tzu-Ming Huang, Wei-Ho Chung, and Yeong-Luh Ueng. 2020. Forecasting Fluctuations in the Financial Index Using a Recurrent Neural Network Based on Price Features. IEEE Transactions on Emerging Topics in Computational Intelligence 5: 780–91. [Google Scholar] [CrossRef]
- Lo, Andrew, and A. Craig MacKinlay. 1988. Stock market prices do not follow random walks: Evidence from a simple specification test. The Review of Financial Studies 1: 41–66. [Google Scholar] [CrossRef]
- Ma, Alfred. 2022. Profitability of technical trading strategies under market manipulation. Financial Innovation 8: 1–9. [Google Scholar] [CrossRef]
- Malkiel, Burton. 2003. The efficient market hypothesis and its critics. Journal of Economic Perspectives 17: 59–82. [Google Scholar] [CrossRef]
- Mars, Ayoub, Ahmad Abadleh, and Wael Adi. 2019. Operator and Manufacturer Independent D2D Private Link for Future 5G Networks. Paper presented at the INFOCOM 2019—IEEE Conference on Computer Communications Workshops, INFOCOM WKSHPS 2019, Paris, France, April 29–May 2. [Google Scholar]
- Mehta, Pooja, Sharnil Pandya, and Ketan Kotecha. 2021. Harvesting social media sentiment analysis to enhance stock market prediction using deep learning. PeerJ Computer Science 7: e476. [Google Scholar] [CrossRef] [PubMed]
- Mitra, Subrata Kumar. 2011. How rewarding is technical analysis in the Indian stock market? Quantitative Finance 11: 287–97. [Google Scholar] [CrossRef]
- Mnasri, Sami, Adrien Van Den Bossche, Nejah Narsi, and Thierry Val. 2015. The 3D Deployment Multi-objective Problem in Mobile WSN: Optimizing Coverage and Localization. International Research Journal of Innovative Engineering—IRJIE 1: 1–15. [Google Scholar]
- Mnasri, Sami, Fatma Abbes, Kamel Zidi, and Khaled Ghedira. 2014. A multi-objective hybrid BCRC-NSGAII algorithm to solve the VRPTW. Paper presented at the 13th International Conference on Hybrid Intelligent Systems, HIS 2013, Gammarth, Tunisia, December 4–6. [Google Scholar]
- Mnasri, Sami, Adrien Van Den Bossche, Nejah Nasri, and Thierry Val. 2017a. The 3D Redeployment of Nodes in Wireless Sensor Networks with Real Testbed Prototyping. In Lecture Notes in Computer Science (including subseries Lecture Notes in Artificial Intelligence and Lecture Notes in Bioinformatics). Cham: Springer, vol. 10517 LNCS. [Google Scholar]
- Mnasri, Sami, Nejah Nasri, Adrien Van Den Bossche, and Thierry Val. 2017b. A hybrid ant-genetic algorithm to solve a real deployment problem: A case study with experimental validation. In Lecture Notes in Computer Science (including subseries Lecture Notes in Artificial Intelligence and Lecture Notes in Bioinformatics). Cham: Springer, vol. 10517 LNCS. [Google Scholar]
- Mnasri, Sami, Nejah Nasri, Adrien Van Den Bossche, and Thierry Val. 2018a. A comparative analysis with validation of NSGA-III and MOEA/D in resolving the 3D indoor redeployment problem in DL-IoT. Paper presented at the 2017 International Conference on Internet of Things, Embedded Systems and Communications, IINTEC 2017, Gafsa, Tunisia, October 20–22. [Google Scholar]
- Mnasri, Sami, Nejah Nasri, Adrien van den Bossche, and Thierry Val. 2019. A new multi-agent particle swarm algorithm based on birds accents for the 3D indoor deployment problem. ISA Transactions 91: 262–80. [Google Scholar] [CrossRef] [PubMed]
- Mnasri, Sami, Nejah Nasri, and Thierry Val. 2018b. The 3D indoor deployment in DL-IoT with experimental validation using a particle swarm algorithm based on the dialects of songs. Paper presented at the 2018 14th International Wireless Communications and Mobile Computing Conference, IWCMC 2018, Limassol, Cyprus, June 25–29. [Google Scholar]
- Mnasri, Sami, Nejah Nasri, Malek Alrashidi, Adrien van den Bossche, and Thierry Val. 2020. IoT networks 3D deployment using hybrid many-objective optimization algorithms. Journal of Heuristics 26: 663–709. [Google Scholar] [CrossRef]
- Muhammad, Shakeel. 2018. The Relationship Between Fundamental Analysis and Stock Returns Based on the Panel Data Analysis; Evidence from Karachi Stock exchange (KSE). Research Journal of Finance and Accounting 9: 84–96. [Google Scholar]
- Mulhem, Saleh, Ahmad Abadleh, and Wael Adi. 2019. Accelerometer-Based Joint User-Device Clone-Resistant Identity. Paper presented at the Second World Conference on Smart Trends in Systems, Security and Sustainability (WorldS4), London, UK, October 30–31; pp. 230–37. [Google Scholar]
- Nabipour, Mojtaba, Pooyan Nayyeri, Hamed Jabani, S. Shahab, and Amir Mosavi. 2020. Predicting Stock Market Trends Using Machine Learning and Deep Learning Algorithms Via Continuous and Binary Data; A Comparative Analysis. IEEE Access 8: 150199–212. [Google Scholar] [CrossRef]
- Narloch, Piotr, Ahmad Hassanat, Ahmad S. Tarawneh, Hubert Anysz, Jakub Kotowski, and Khalid Almohammadi. 2019. Predicting Compressive Strength of Cement-Stabilized Rammed Earth Based on SEM Images Using Computer Vision and Deep Learning. Applied Sciences 9: 5131. [Google Scholar] [CrossRef]
- Nevasalmi, Lauri. 2020. Forecasting multinomial stock returns using machine learning methods. Journal of Finance and Data Science 6: 86–106. [Google Scholar] [CrossRef]
- Nti, Isaac Kofi, Adebayo Felix Adekoya, and Benjamin Asubam Weyori. 2020. A systematic review of fundamental and technical analysis of stock market predictions. Artificial Intelligence Review 53: 3007–57. [Google Scholar] [CrossRef]
- Oxford Business Group. 2017. Egypt’s Insurance Sector Posts Strong Growth in Tough Economic Context. Available online: https://oxfordbusinessgroup.com/overview/catching-sector-posts-strong-growth-tough-economic-context (accessed on 1 November 2021).
- Oxford Business Group. 2020. Increased Competition and New Regulations Transform the Sector. Available online: https://oxfordbusinessgroup.com/overview/increased-competition-and-new-regulations-transform-sector (accessed on 1 November 2021).
- Park, Cheol-Ho, and Scott Irwin. 2007. What do we know about the profitability of technical analysis? Journal of Economic Surveys 21: 786–826. [Google Scholar] [CrossRef]
- Patel, Jigar, Sahil Shah, Priyank Thakkar, and Ketan Kotecha. 2015. Predicting stock market index using fusion of machine learning techniques. Expert Systems with Applications 42: 2162–72. [Google Scholar] [CrossRef]
- Paul, Sanjoy Kumar. 2011. Determination of Exponential Smoothing Constant to Minimize Mean Square Error and Mean Absolute Deviation. Global Journal of Research in Engineering 11: 20–31. [Google Scholar]
- Prechter, Robert R., Jr., and Wayne D. Parker. 2007. The financial/economic dichotomy in social behavioral dynamics: The socionomic perspective. The Journal of Behavioral Finance 8: 84–108. [Google Scholar] [CrossRef]
- Qian, Bo, and Khaled Rasheed. 2007. Stock market prediction with multiple classifiers. Applied Intelligence 26: 25–33. [Google Scholar] [CrossRef]
- Qiu, Mingyue, and Song Yu. 2016. Predicting the Direction of Stock Market Index Movement Using an Optimized Artificial Neural Network Model. PLoS ONE 11: e0155133. [Google Scholar] [CrossRef]
- Rawashdeh, Adnan, Mouhammd Alkasassbeh, and Muna Al-Hawawreh. 2018. An anomaly-based approach for DDoS attack detection in cloud environment. International Journal of Computer Applications in Technology 57: 312–24. [Google Scholar]
- Salman, Hamzeh E., Mustafa Hammad, Abdelhak-Djamel Seriai, and Ahed Al-Sbou. 2018. Semantic clustering of functional requirements using agglomerative hierarchical clustering. Information 9: 222. [Google Scholar] [CrossRef]
- Samer, A., M. Rawan, and L. Omar. 2018. The Role of Corporate Social Responsibility in Local Community Development: A study of the Jordan Ahli Bank. International Journal of Academic Research in Business and Social Sciences 8: 199–214. [Google Scholar] [CrossRef]
- Santos, B. M. 2011. Selecting the right nutrient rate: Basis for managing fertilization programs. HortTechnology 21: 683–85. [Google Scholar] [CrossRef]
- Shynkevich, Yauheniya, T. Martin McGinnity, Sonya Coleman, Ammar Belatreche, and Yuhua Li. 2017. Forecasting price movements using technical indicators: Investigating the impact of varying input window length. Neurocomputing 264: 71–88. [Google Scholar] [CrossRef]
- Singh, Aishwarya. 2018. Predicting the Stock Market Using Machine Learning and Deep Learning. Electronic Research Journal of Engineering, Computer and Applied Sciences 2: 1–10. [Google Scholar]
- Singh, Aryendra, Priyanshi Gupta, and Narina Thakur. 2021. An empirical research and comprehensive analysis of stock market prediction using machine learning and deep learning techniques. IOP Conference Series: Materials Science and Engineering 1022: 012098. [Google Scholar] [CrossRef]
- Singh, Shashank, Maaz Ahmad, Aditya Bhattacharya, and M. Azhagiri. 2019. Predicting stock market trends using hybrid SVM model and LSTM with sentiment determination using natural language processing. International Journal of Engineering and Advanced Technology 9: 2870–75. [Google Scholar] [CrossRef]
- Tarawneh, Ahmad S., Ahmad B. Hassanat, Ceyhun Celik, Dmitry Chetverikov, MD S. Rahman, and Chaman Verma. 2019a. Deep Face Image Retrieval: A Comparative Study with Dictionary Learning. Paper presented at the 2019 10th International Conference on Information and Communication Systems (ICICS), Irbid, Jordan, June 11–13. [Google Scholar]
- Tarawneh, Ahmad S., Ahmad B. Hassanat, Dmitry Chetverikov, I. Lendak, and Chaman Verma. 2019b. Invoice Classification Using Deep Features and Machine Learning Techniques. Paper presented at the 2019 IEEE Jordan International Joint Conference on Electrical Engineering and Information Technology (JEEIT), Irbid, Jordan, April 9–11. [Google Scholar]
- Tarawneh, Ahmad S., Ahmad B. Hassanat, I. Elkhadiri, Dmitry Chetverikov, and Khaled Almohammadi. 2020a. Automatic Gamma Correction Based on Root-Mean-Square-Error Maximization. Paper presented at the 2020 International Conference on Computing and Information Technology (ICCIT-1441), Tabuk, Saudi Arabia, September 9–10. [Google Scholar]
- Tarawneh, Ahmad S., Ceyhun Celik, Ahmad B. Hassanat, and Dmitry Chetverikov. 2020b. Detailed investigation of deep features with sparse representation and dimensionality reduction in CBIR: A comparative study. Intelligent Data Analysis 24: 47–68. [Google Scholar] [CrossRef]
- Tarawneh, Ahmad S., Dmitry Chetverikov, Chaman Verma, and Ahmad Hassanat. 2018. Stability and reduction of statistical features for image classification and retrieval: Preliminary results. Paper presented at the 2018 9th International Conference on Information and Communication Systems (ICICS), Irbid, Jordan, April 3–5. [Google Scholar]
- Taylor, Mark P., and Helen Allen. 1992. The use of technical analysis in the foreign exchange market. Journal of international Money and Finance 11: 304–14. [Google Scholar] [CrossRef]
- Tlili, Sihem, Sami Mnasri, and Thierry Val. 2021. A multi-objective Gray Wolf algorithm for routing in IoT Collection Networks with real experiments. Paper presented at the 2021 IEEE 4th National Computing Colleges Conference, NCCC 2021, Taif, Saudi Arabia, March 27–28. [Google Scholar]
- Turner, Toni. 2007. A Beginner’s Guide to Day Trading Online, 2nd ed. Avon: Adams Media. [Google Scholar]
- Valencia, Franco, Alfonso Gómez-Espinosa, and Benjamín Valdés-Aguirre. 2019. Price movement prediction of cryptocurrencies using sentiment analysis and machine learning. Entropy 21: 589. [Google Scholar] [CrossRef] [PubMed]
- Vasiliou, Dimitrios, Nikolaos Eriotis, and Spyros Papathanasiou. 2006. How rewarding is technical analysis? Evidence from Athens Stock Exchange. Operational Research 6: 85–102. [Google Scholar] [CrossRef]
- Wong, Wing-Keung, Meher Manzur, and Boon-Kiat Chew. 2010. How rewarding is technical analysis? Evidence from Singapore stock. Applied Financial Economics 13: 543–51. [Google Scholar] [CrossRef]
- Zhong, Xiao, and David Enke. 2019. Predicting the daily return direction of the stock market using hybrid machine learning algorithms. Financial Innovation 5: 1–20. [Google Scholar] [CrossRef]
- Zhuo, Jinwu, Xinmiao Li, and Changrui Yu. 2021. Parameter behavioral finance model of investor groups based on statistical approaches. Quarterly Review of Economics and Finance 80: 74–79. [Google Scholar] [CrossRef]
- Zulkarnain, Iskandar. 2014. Research on The Simple Moving Average (SMAs)Technical Analysis Effectiveness: A Test of Conformity with the Earning Per Share of Top Gainers at IDX. Paper presented at the ICE-ISM, Palembang, Indonesia, October 17–18. [Google Scholar]
- Zuraiq, AlMaha A., and Mouhammd Alkasassbeh. 2019. Review: Phishing Detection Approaches. Paper presented at the 2019 2nd International Conference on New Trends in Computing Sciences, ICTCS 2019, Amman, Jordan, October 9–11. [Google Scholar]
Publisher’s Note: MDPI stays neutral with regard to jurisdictional claims in published maps and institutional affiliations. |
© 2022 by the authors. Licensee MDPI, Basel, Switzerland. This article is an open access article distributed under the terms and conditions of the Creative Commons Attribution (CC BY) license (https://creativecommons.org/licenses/by/4.0/).