
Article

Association of Daily Temperature on Non-Accidental and Specific-Cause Mortality in Northern Malaysia: A Time-Series Study


by
Hadita Sapari
1,2,*,
Rohaida Ismail
1,
Wan Rozita Wan Mahiyudin
1,
Mohamad Ikhsan Selamat
2 and
Mohamad Rodi Isa
2
1
Environmental Health Research Centre, Institute for Medical Research, National Institutes of Health, Ministry of Health Malaysia, Shah Alam 40170, Malaysia
2
Department of Public Health Medicine, Faculty of Medicine, UiTM Selangor Campus, Sungai Buloh 47000, Malaysia
*
Author to whom correspondence should be addressed.
Climate 2026, 14(7), 139; https://doi.org/10.3390/cli14070139 (registering DOI)
Submission received: 30 April 2026 / Revised: 12 June 2026 / Accepted: 15 June 2026 / Published: 4 July 2026

Abstract

Extreme temperatures are an emerging public health concern due to their significant impact on humans, yet the evidence remains limited in tropical countries. This study examined the non-linear relationship between ambient temperature and non-accidental and cause-specific mortality in two northern parts of Peninsular Malaysia, from 2011 to 2019. Daily mortality and meteorological data were analyzed using a quasi-Poisson Generalized Linear Model with a Distributed Lag-Non-Linear model to estimate the relationship between temperature and mortality. A U-shaped and J-shaped relationship was observed for the cumulative effects of 21-day lag periods for Kedah and Penang, respectively. The minimum mortality temperature (MMT) at 27.4 °C in Kedah and 28.2 °C in Penang was observed. Extremely high temperatures were associated with an increased non-accidental mortality, with a 16% increase at cumulative lag days 0–3 in Kedah and a 21% increase at cumulative lag days 0–7 in Penang. Vulnerable groups included individuals with respiratory diseases, the elderly, both genders and those residing in both urban and rural areas. These findings highlight the acute impact of heat on mortality in Malaysia and underscore the need for targeted public health interventions. Strengthening heat-health warning systems, improving healthcare preparedness, and prioritizing vulnerable populations are essential to mitigate the health impacts of rising temperatures in tropical regions.

1. Introduction

Human activities, primarily through the emission of greenhouse gases (GHG), have triggered global warming. Consequently, climate change has emerged as one of the greatest global threats of the 21st century. As the climate shifts, the dynamics and intensity of these events change, placing vulnerable communities at greater risk [1]. According to the latest synthesis report by the Intergovernmental Panel on Climate Change (IPCC), the global mean surface temperature (GMST) increased by 1.09 °C (0.95 to 1.20 °C) between 2011 and 2020 compared to the pre-industrial levels (1850–1900), with recent warming averaging 0.2 °C (0.10 °C) per decade [2]. Southeast Asia has also experienced a rise in mean surface temperatures by approximately 0.1 °C to 0.3 °C per decade since the mid-twentieth century [3]. Furthermore, an exceptionally strong El Niño event in 2016 led to record-breaking temperatures across several Southeast Asian countries, including Peninsular Malaysia, Cambodia, Laos, Myanmar, Thailand, and Vietnam, where surface temperatures exceeded historical averages by more than 2.0 °C [4]. Such extreme temperature events are expected to become more frequent under future climate change scenarios.
Previous research has demonstrated that high and low temperatures increase morbidity and mortality risk [5]. Extended exposure to elevated day and nighttime temperatures directly imposes cumulative physiological stress on the human body and causes heat-related illnesses, such as dehydration, heat cramps, and heat stroke [6]. This stress subsequently exacerbates preexisting medical conditions such as cardiovascular, respiratory, mental and renal diseases [7], hence increasing the premature mortality [8]. Moreover, the mortality burden would further increase by 4.0–5.0% at the end of the century under high emissions of GHG and the absence of effective mitigation measures [9].
Generally, exposure to high temperatures produces immediate and acute effects, while low temperatures often demonstrate delayed effects up to weeks following exposures [10]. Every 1 °C rise in the temperature will raise the risk of morbidity and mortality by 3% [11]. Heatwaves have produced catastrophic consequences and substantial mortality globally, including in Europe (2003; 72,000 deaths) and Russia (2010; 56,000 deaths) [12]. Significant heat-related mortality has also been reported in Turkey (2015, 2016, and 2017; 419 deaths in total) [13] and Pakistan (2015; 1151 deaths) [14]. Vulnerable groups, including the elderly, children, females, pregnant women, and those with premorbid conditions such as cardiorespiratory disease, mental illness, and those on psychotropic medications [15], poor socioeconomic status, homeless, outdoor workers and urban dwellers [16], are at risk of morbidity and mortality during extreme temperature exposure.
Hence, understanding the temperature–mortality relationship is crucial so that the targeted intervention and adaptive capacity to the community can be optimized. Previous epidemiological research has demonstrated a complex, non-linear relationship between temperature and mortality, which is often characterized by a U-shaped, J-shaped or V-shaped curve [17]. Nevertheless, these studies have been concentrated in developed countries, which generally have better preparedness for extreme temperatures, including early warning systems, robust healthcare infrastructure and effective policies and governance [18,19]. Conversely, the evidence of temperature and mortality research in lower-middle-income countries remains scarce, making these countries more vulnerable to the negative impacts of extreme temperatures [20].
Malaysia is also experiencing global warming, with documented warming rates at 2.7 °C to 4.0 °C/100 years, and more frequent heatwave events have been reported in the last decade. Kedah and Penang, located in the northern part of Malaysia, are among the hottest states in the country and demonstrate a moderate to high heat exposure index [21]. These states are also frequently issued with level 1 and level 2 heat alerts by the Malaysian Meteorological Department [22]. Besides being influenced by the Southwest Monsoon (April to September), which is characterized by drier weather and reduced rainfall, the El Niño phenomenon further worsens the condition, leading to elevated temperatures and increased frequency of heatwaves [23]. Apart from climate change, urbanization may further exacerbate heat exposure through the urban heat island effect, which has been documented in Penang, especially from 11 am to 2 pm [24]. To date, studies on temperature and mortality in Malaysia are limited and focused on specific populations or geographical settings. Previous studies have examined temperature–mortality associations in the Klang Valley [25], among children under five in Malaysia [26], and in coastal regions of Kelantan and Kedah [27]. Unlike previous Malaysian studies, the present study incorporates both Kedah and Penang, enabling comparisons between a predominantly rural and a highly urbanized setting, while additionally accounting for multiple air pollutants as potential confounders. Evidence comparing urban and rural populations within northern Peninsular Malaysia remains scarce. Therefore, this study aimed to examine the relationship between daily temperature and non-accidental and specific cause of mortality in the northern part of Peninsular Malaysia, namely Penang and Kedah. Addressing this gap is essential to better understand population-level vulnerability and to inform locally relevant climate–health adaptation strategies, as variation in geographic and climatic conditions will yield different patterns in the relationship between temperature and mortality risk [28].

2. Materials and Methods

2.1. Study Area

Kedah is a state located in the northwest of Peninsular Malaysia, bordered by Perlis and Thailand to the north, Perak to the east and south, and the Straits of Malacca to the west. Geographically, it lies between latitudes 5°25′ N and 6°55′ N and longitudes 99°36′ E and 100°56′ E, covering an area of approximately 9402 km2. The state had an estimated population of 2.19 million in 2019 [29] and the economy is primarily driven by agriculture, particularly paddy fields, manufacturing, and tourism through Langkawi Island [30].
Penang is also a state situated in the northwest of Peninsular Malaysia, between latitudes 5°12′ N and 5°30′ N and longitudes 100°09′ E and 100°26′ E. It is divided into two distinct regions: Seberang Perai, bordering Kedah to the east and Perak to the south, and Penang Island itself. George Town, the capital city of Penang, is situated on the eastern coast of Penang Island and serves as the state’s principal administrative, commercial, and urban centre. Despite its small land surface area of 1049 km2, Penang boasts the nation’s highest population densities, experiencing significant development and a high urbanization rate, with an estimated population of 1.77 million in 2021 [31]. Over the past two decades, Penang Island has undergone rapid and drastic urban expansion, attributed to growth in both industrial and residential areas [21,24].

2.2. Mortality, Meteorological and Air Pollutant Data

Daily mortality records for Kedah and Penang were obtained from the Department of Statistics Malaysia (DOSM) and covered the period from 1 January 2011 to 31 December 2019. The dataset includes daily causes of death classified according to the ICD-10 coding system, comprising non-accidental mortality (A00–R99), cardiovascular mortality (I00I99), and respiratory mortality (J00J99). Mortality records were further stratified by age group, sex and rural–urban locality based on the Department of Statistics Malaysia’s definition [32].
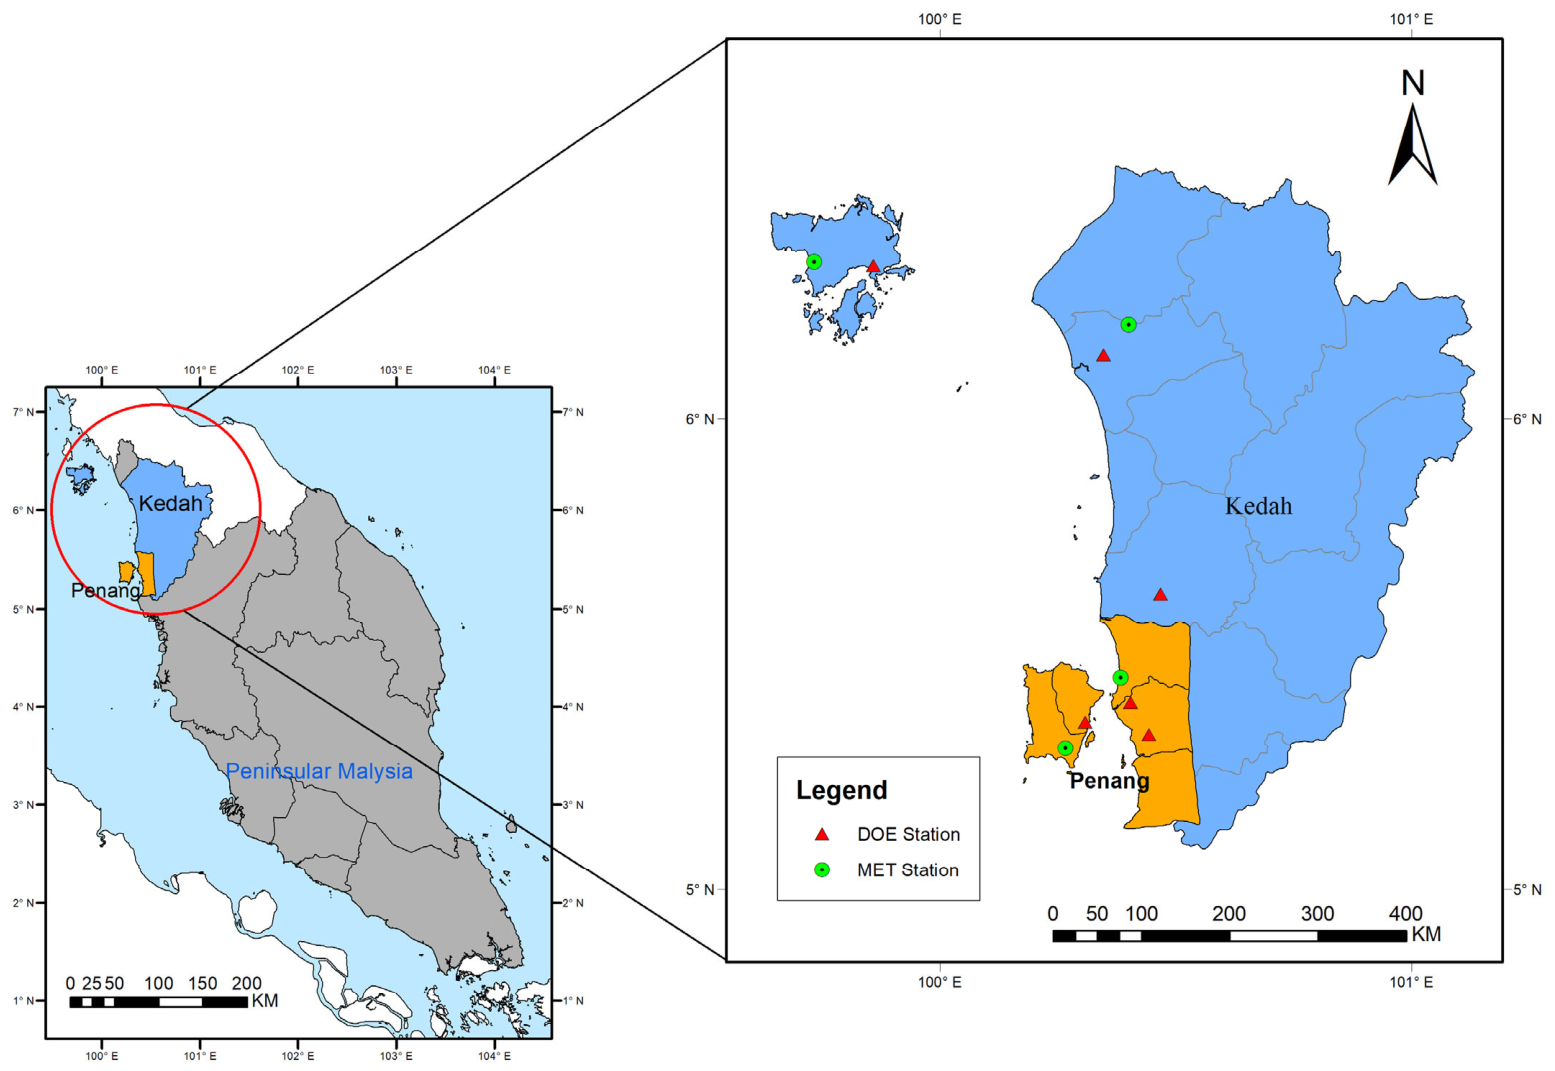
Daily meteorological data encompassing the daily averages of minimum, maximum, and mean temperatures, as well as daily averages of relative humidity, were procured from the Malaysian Meteorological Department (4 stations) for the same period (1 January 2011 to 31 December 2019). Due to the uneven spatial distribution of stations in Kedah, particularly in Sik and Baling, a proxy approach was applied. Meteorological data from Butterworth station were used to represent Kuala Muda, given their proximity (within 40 km). The Kuala Muda proxy station was subsequently used to represent Sik and Baling. This approach was consistent with previous environmental epidemiology studies [5,33] that utilized the nearest available monitoring station to represent areas without direct observations. Given the relatively small geographical scale and similar climatic conditions within Kedah, the use of proxy stations was considered a reasonable approach for exposure assessment. Nevertheless, potential exposure misclassification may still have occurred, particularly in areas without direct meteorological observations. Figure 1 shows the study area and the locations of meteorological and air quality monitoring stations.
To investigate confounders, daily averaged concentrations of air pollutants, including PM10, PM2.5, CO, SO2, NO2, and O3, were obtained from the Malaysian Department of Environment’s Continuous Air Quality Monitoring Stations for the same study period (1 January 2011 to 31 December 2019). Prior to analysis, the data were screened for duplicate records, outliers, and missing values. Outliers were identified using the boxplot interquartile range (IQR) method and reviewed before further processing. Before imputation, missing values ranged from 2.2% to 2.9% across the air pollutants except PM2.5. Missing values were addressed using Multiple Imputation implemented in IBM SPSS Statistics version 26 (IBM Corp., Armonk, NY, USA) with an iterative Markov Chain Monte Carlo (MCMC) procedure. A total of five imputed datasets were generated and pooled for subsequent analyses. PM2.5 has more than 70% of missing data; hence, it was excluded from the analysis [34,35].
Data management and preprocessing were conducted separately for Kedah and Penang throughout the study. Mortality, meteorological, and air pollution datasets were maintained as independent state-specific databases during data cleaning, quality assessment, and imputation procedures. Environmental exposure variables were linked only to the corresponding state-level mortality records using date-matched observations from designated monitoring stations. Following preprocessing, separate analytical datasets were generated for Kedah and Penang and subsequently analyzed independently. No pooling or merging of mortality or environmental data between states was performed at any stage of the analysis.

2.3. Statistical Analysis

Spearman’s correlation was first used to assess agreement between temperatures recorded at different meteorological stations within each state. Statistical significance was assessed at a threshold of p ≤ 0.05.
Subsequently, a quasi-Poisson regression in the Generalized Linear Model (GLM) was applied separately for each state and coupled with the Distributed Lag-Non-Linear model (DLNM) to examine the relationship between daily temperature and mortality [5,11]. DLNM is a framework that can simultaneously describe the non-linear effect on temperature (temperature–mortality dimension) and lag effect (lag–mortality dimension) through a cross-basis function [36]. Moreover, the quasi-Poisson approach was used to account for the overdispersion of the daily death count (Yt) due to its character that fits better to the overall variance-mean relationship as compared to negative binomial regression [37,38].
The general model used in this study was as follows:
Log E (Yt) = α + βTt,l + DOWt + ns (time, df = i/year) + ns (RHt, df = 3)
+ ns (air pollutants, df = 3)
where t is the day of observation, Yt is the number of daily deaths on day t, α is the intercept, β is the vector of regression coefficients for Tt,l. Tt,l refers to the matrix obtained by applying the ‘cross-basis’ DLNM functions to temperatures, and l refers to the lag days.
DOWt is a day-of-the-week variable for day t used to control for the effect of day of the week on daily mortality (e.g., the number of mortalities tends to be higher on weekends than on weekdays). Time is a continuous variable starting from the initial day of observation in this study until the last day of observation, which will be 3287 days (2011–2019). ns indicates the smoothing parameter set to the natural cubic spline. Based on previous research, natural cubic spline acts as a smoothing parameter in DLNM functions to control long-term trend and seasonality, as well as the confounders such as air pollutants, which also have an effect on mortality [25,39,40].
Model development was conducted in a stepwise manner in both states separately. The selection of lag periods, degrees of freedom, and spline specifications was guided by previous environmental epidemiological studies [25,40] and further evaluated using the Quasi-Akaike Information Criterion (Q-AIC). Models with the lowest Q-AIC values were selected as the final models.
First, a basic model was established to control for long-term trend and seasonality using a natural cubic spline smooth function for the time variable, with degrees of freedom (df) per year ranging from 2 to 14, and DOW was controlled as a categorical variable (Tables S1 and S2). Then, a cross-basis function to the temperature (Tt,l), maximum lag, and lag with df varies from 3 to 10 was performed with maximum lag values at 7, 14 and 21. The lag knots were placed at equally spaced intervals on the logarithmic scale, while temperature knots were specified at the 10th, 75th, and 90th percentiles of the temperature distribution (Tables S3 and S4).
Subsequently, potential confounders, namely relative humidity and air pollutants (PM10, CO, SO2, NO2, and O3), were incorporated into the model using natural cubic spline functions with df of 3 [25,41] (Table S5).
Previous studies have been using mean temperature as a mortality predictor while investigating the relationship between temperature and mortality due to its ability to represent the exposure throughout the day and night [42,43]. Moreover, this study used mean temperature because it yielded the smallest Q-AIC value among the mortality predictors (Table S6).
Subsequently, the minimum mortality temperature (MMT) value was derived using a function of ‘findmin’ in R, which has been used by Gasparrini and Armstrong [44]. The overall cumulative effect of mean temperature on non-accidental mortality over a 21-day lag was examined and subsequently extended to different lags (0–3, 0–7, 0–14, 0–28 days) to examine how the risk of mortality changed over time. In order to examine the hot and cold effects on non-accidental mortality, the relative risks at extremely low (defined as the 1st percentile of temperature) and extremely high (defined as the 99th percentile of temperature) were compared to the minimum mortality value (MMT) [25].
Finally, a sensitivity analysis was conducted to assess the robustness of the results by varying the lag lengths, the degree of freedom for time, and the inclusion of air pollutants, particularly ozone, SO2, NO2, and relative humidity.
The entire model selection process was guided by the Quasi-Akaike Information Criterion (Q-AIC), which has been extensively used in environmental epidemiology, and time-series regression was used to assess model fit. The model with the lowest Q-AIC value was selected as the final model [25,36,40,45]. All analyses were conducted using R Studio software version 2022.02.1 (Posit Software, PBC, Boston, MA, USA) with the packages ‘dlnm’ and ‘splines’ to estimate the association between mortality and the temperature for each state.

3. Results

3.1. Descriptive Statistics

A total of 57,463 and 47,826 non-accidental mortalities were recorded for Kedah and Penang, respectively, during the study period (3287 days). The majority of the mortality occurred in individuals aged ≥ 65 years old, males, and residents of urban areas in both states. Cardiovascular mortality accounted for 18,712 and 15,598 for Kedah and Penang, respectively, and was relatively higher compared to respiratory (13,746 mortality) (Table 1).
For meteorological and air pollutant variables, Kedah recorded a daily mean temperature of 28.0 °C (range: 24.6–30.9 °C), with minimum and maximum temperatures averaging 24.8 °C (19.4–27.3 °C) and 32.3 °C (25.9–37.0 °C), respectively. The 1st and 99th percentile temperatures were 25.4 °C and 30.2 °C, respectively. The mean relative humidity was high at 80.5% (56.0–94.4%). Mean daily concentrations of PM10, O3, SO2, NO2, and CO were 36.6 µg/m3, 35.25 µg/m3, 2.64 µg/m3, 11.73 µg/m3, and 0.64 mg/m3, respectively.
On the other hand, Penang recorded a daily mean temperature of 28.0 °C (range: 23.7–30.9 °C), with minimum and maximum temperatures averaging 24.8 °C (19.7–28.1 °C) and 31.9 °C (25.0–36.0 °C), respectively. The 1st and 99th percentiles were 25.6 °C and 30.2 °C, respectively. Mean relative humidity was 79.8% (54.3–95.2%). Overall, Penang recorded slightly higher air pollutant concentrations than Kedah, with mean PM10, O3, SO2, NO2, and CO levels of 40.6 µg/m3, 38.62 µg/m3, 4.70 µg/m3, 21.82 µg/m3, and 0.79 mg/m3, respectively (Table 2).

3.2. Temperature–Mortality Relationship

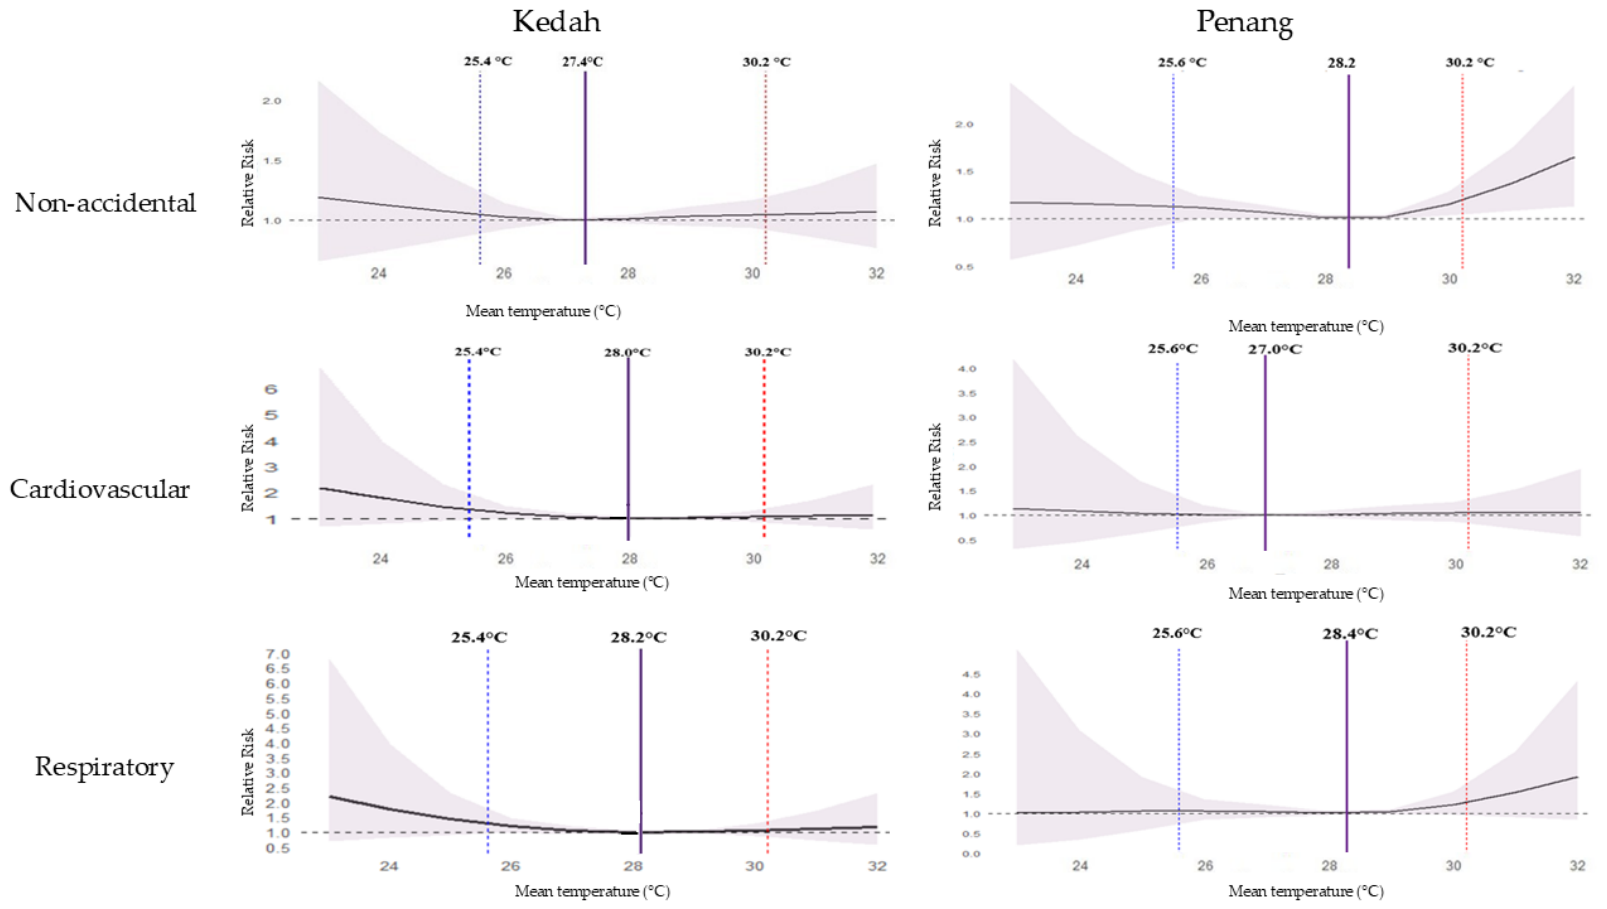
Figure 2 demonstrates the overall cumulative effect of daily mean temperature on the non-accidental and specific causes of mortality (cardiovascular and respiratory) over 21 lag days for Kedah and Penang. In Kedah, the minimum mortality temperature (MMT) was 27.4 °C (47th percentile), with a non-linear U-shaped relationship between temperature and mortality. Although these associations were not statistically significant, the relative risks (RRs) increased as daily mean temperatures deviated from the MMT. At extremely high temperatures (30.2 °C), the RR was 1.05 (95% CI: 0.92–1.19) for non-accidental mortality, RR = 1.05 (95% CI: 0.90–1.21) for cardiovascular mortality, and RR = 1.07 (95% CI: 0.80–1.37) for respiratory mortality. At extremely low temperatures (25.4 °C), the RR was 1.06 (95% CI: 0.87–1.28), RR = 1.03 (95% CI: 0.89–1.30), and RR = 1.35 (95% CI: 0.94–1.94) for non-accidental, cardiovascular, and respiratory mortality, respectively.
In Penang, the MMT was higher at 28.2 °C. A J-shaped temperature–mortality relationship was observed for non-accidental and respiratory mortality. Compared with the MMT, exposure to extremely high temperatures (30.2 °C) was associated with a significantly increased risk of non-accidental mortality (RR = 1.19, 95% CI: 1.04–1.36). An elevated risk of respiratory mortality was also observed (RR = 1.27, 95% CI: 0.95–1.70); however, this association did not reach statistical significance. In contrast, exposure to extremely low temperatures (25.6 °C) was associated with weaker and non-significant effects across all mortality outcomes. We also observed evidence of potential mortality displacement (harvesting effect) following extreme heat exposure in both states. In Kedah, this effect was evident at lag days 5–13, while in Penang it was observed at lag days 9–13 (Figure S1).

3.3. Lag Effects

The effects of daily mean temperature on mortality varied across lag periods. Therefore, we performed further analysis across different lag intervals (0–3, 0–7, 0–14, 0–21, and 0–28 days) to understand how this effect changes over time. Relative risks were estimated by comparing extremely low temperatures (1st percentile) and extremely high temperatures (99th percentile) with the minimum mortality temperature (MMT).
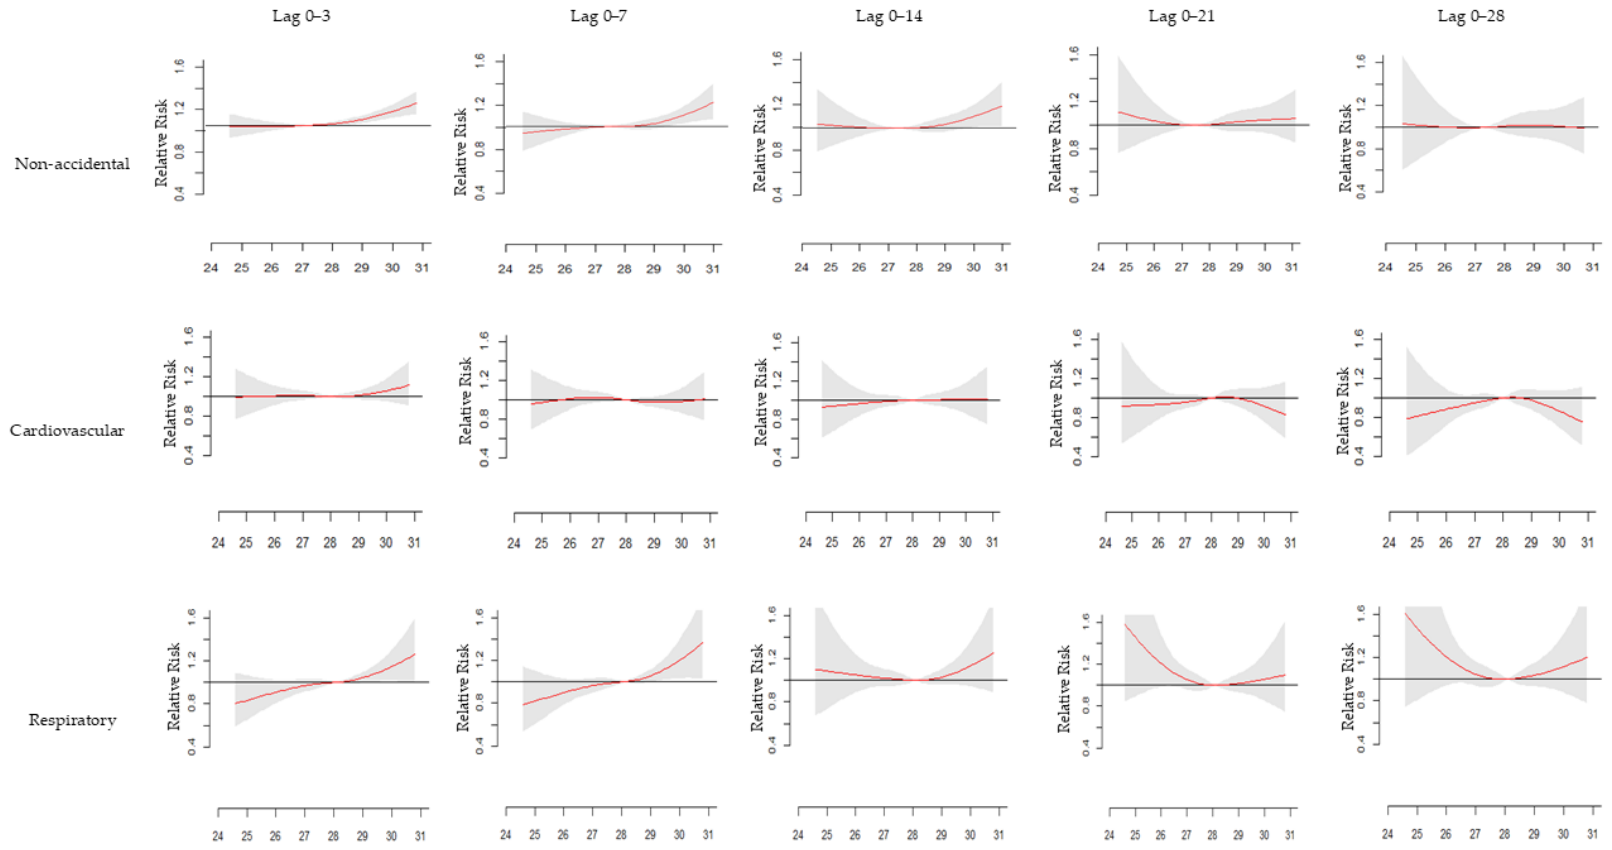
Figure 3 illustrates the J-shaped lag-response patterns for non-accidental, cardiovascular, and respiratory mortality in Kedah. A pronounced heat-related lag-response pattern was observed for non-accidental and respiratory mortality, whereas cardiovascular mortality demonstrated weaker and non-significant associations across the lag periods. The highest risk for non-accidental mortality was observed at lag 0–3 days (RR = 1.16, 95% CI: 1.08–1.26) and remain significant until lag 0–14 days, whereas respiratory mortality demonstrated the increase risk of mortality from lag 0–3 days, and peaking at lag 0–7 days (RR = 1.17, 95% CI: 1.01–1.36).
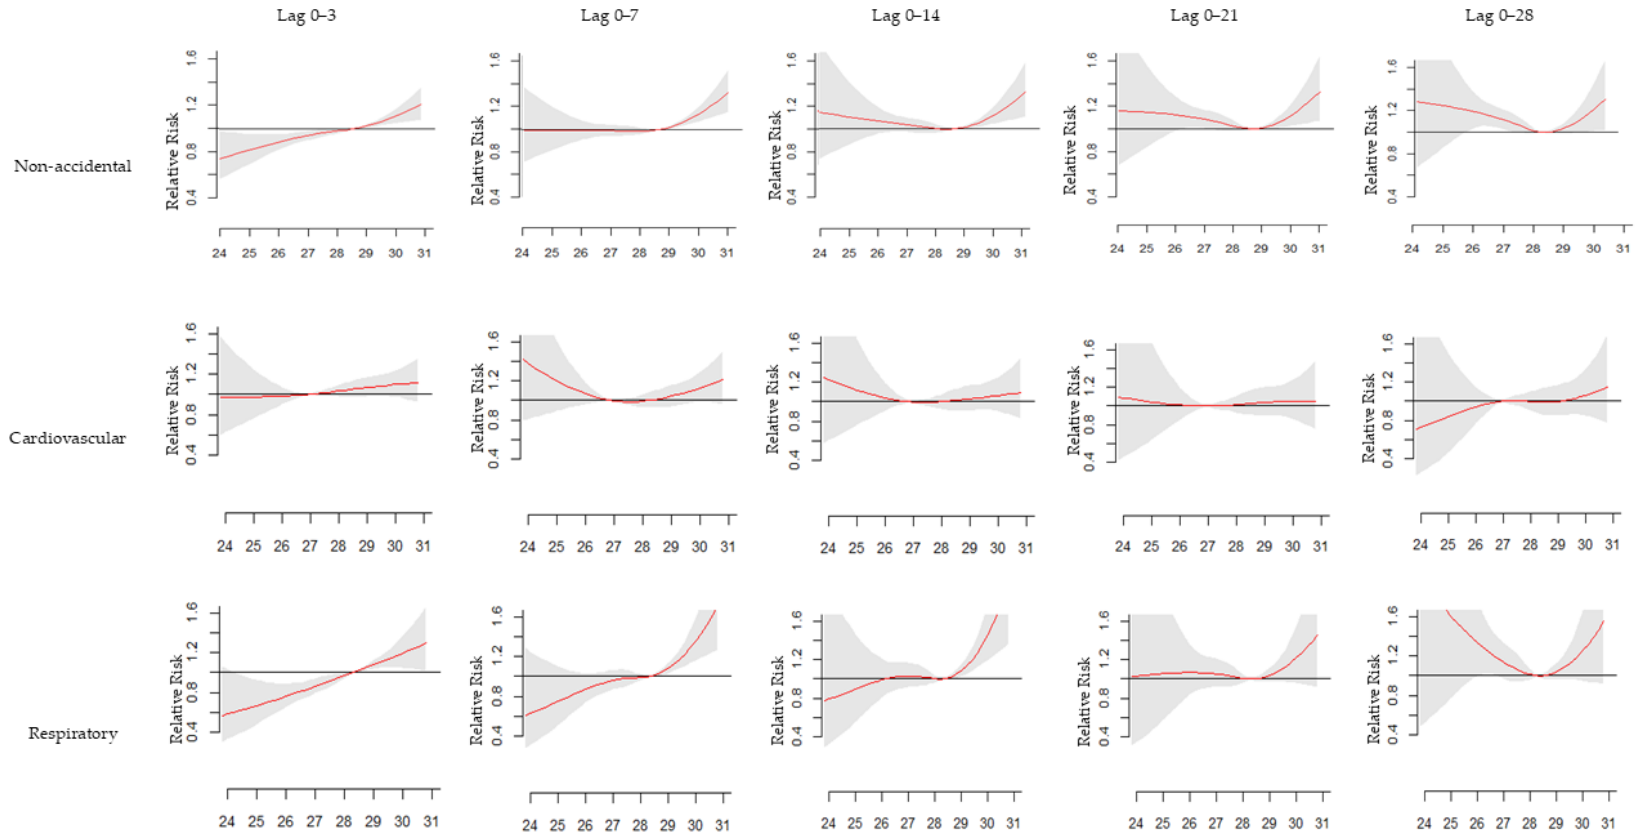
Figure 4 illustrates the J-shaped lag-response patterns for non-accidental, cardiovascular, and respiratory mortality in Penang. Following exposure to extremely high temperatures, the risk of non-accidental mortality increased at lag 0–3 days and remained statistically significant until lag 0–21 days, with the highest risk observed at lag 0–7 days (RR = 1.21, 95% CI: 1.11–1.33). Penang demonstrated a higher risk of respiratory mortality than Kedah, with significant effects observed from lag 0–3 days onwards and peaking at lag 0–14 days (RR = 1.57, 95% CI: 1.24–1.99).
These findings in Kedah and Penang suggest that the adverse effects following high-temperature exposure occurred immediately and diminished over subsequent lag periods. No significant effects of extremely low-temperature exposure on cardiovascular mortality were observed across all lag periods in either state.

3.4. Vulnerable Groups

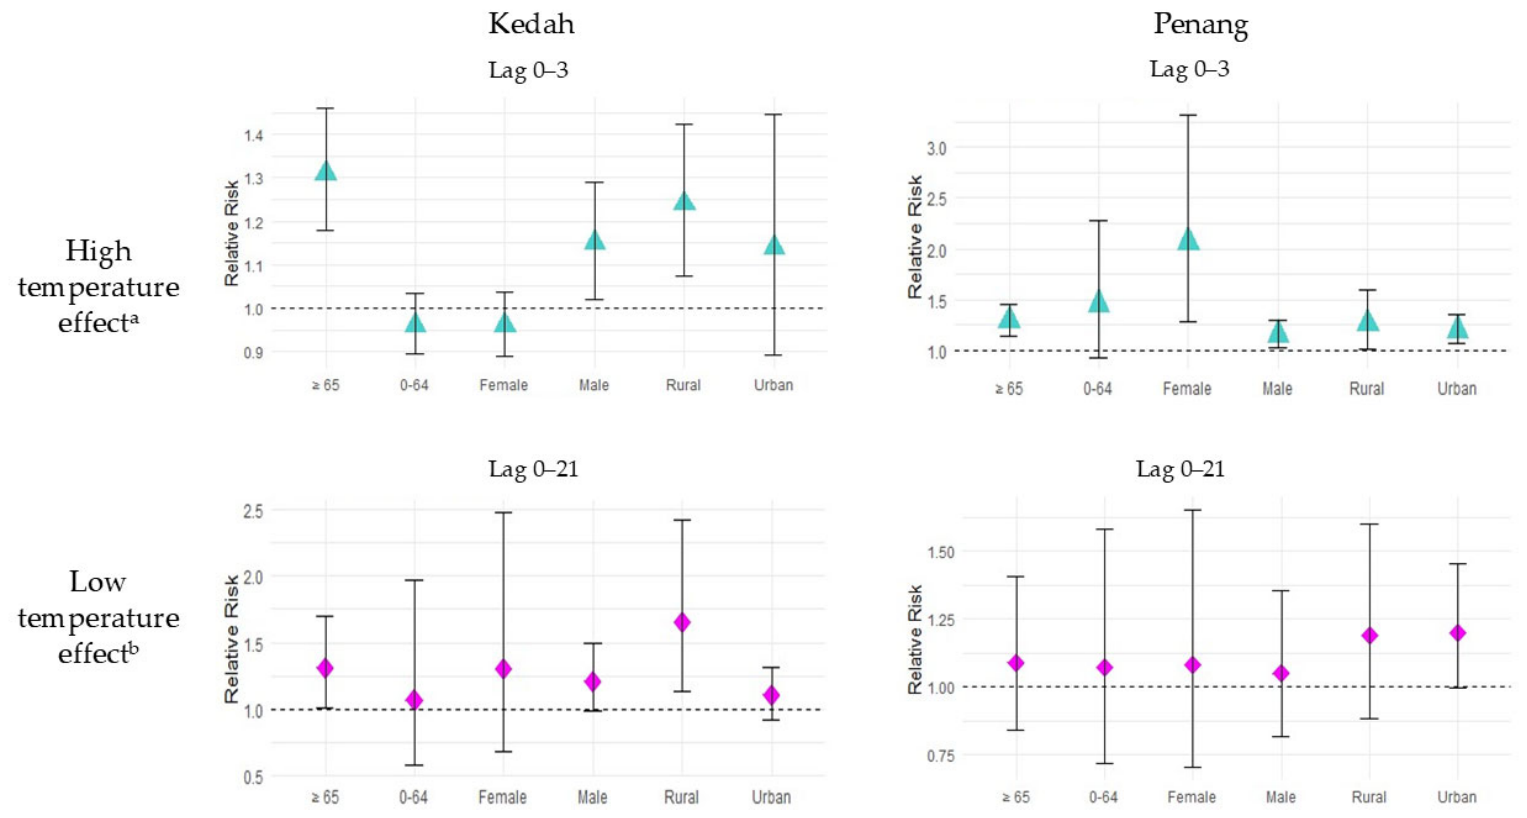
Figure 5 illustrates the cumulative relative risk of non-accidental mortality following exposure to extremely low and high temperatures at lags 0–3 and 0–21, respectively, for both states. Exposure to extremely high temperatures exerted a significant effect on non-accidental mortality, particularly among the elderly in both states, with a 31% higher risk observed in Penang (RR = 1.31, 95% CI: 1.18–1.46) and a 29% higher risk observed in Kedah (RR = 1.29, 95% CI: 1.14–1.45).
Besides that, we found male (RR = 1.15, 95% CI: 1.02–1.29) and those residing in rural (RR = 1.24, 95% CI: 1.07–1.42) had increased mortality risk in Kedah; while Penang demonstrated broader vulnerability, with female (RR = 2.07, 95% CI: 1.29–3.32) exhibited higher risk than male (RR = 1.15, 95% CI: 1.03–1.30), residing in rural (RR = 1.26, 95% CI: 1.01–1.589) had higher risk than residing in urban (RR = 1.20, 95% CI: 1.06–1.35).
Notably, the elderly (RR = 1.31, 95% CI: 1.01–1.70) and those residing in rural areas (RR = 1.65, 95% CI: 1.13–2.42) had a high risk of mortality following exposure to extremely low temperatures in Penang. No significant association was observed following exposure to extremely low temperatures in Kedah.

3.5. Sensitivity Analysis

Sensitivity analyses showed that the estimated relative risks remained largely unchanged following modifications to lag periods, degrees of freedom for time, and adjustment for air pollutants (O3, SO2, and NO2) and relative humidity. These findings indicate that the observed temperature–mortality associations were robust across alternative model specifications.

4. Discussion

This study examines the association between daily temperature and non-accidental and cause-specific mortality in the northern part of Peninsular Malaysia, namely Kedah and Penang. Overall, the findings demonstrated a nonlinear temperature–mortality relationship, with stronger, statistically significant heat effects in Penang than in Kedah. The MMT value for non-accidental mortality for Kedah was 27.4 °C (47th percentile), and Penang was 28.2 °C (59th percentile). This finding was in line with previous local studies in Klang Valley (28 °C, 68th percentile) [25] and Kelantan (27.3 °C, 50th percentile) [27]. Other neighbouring tropical countries, such as Vietnam, Thailand, and the Philippines, found about the same MMT value, ranging from 27 to 30 °C [46,47,48]. Consistent with previous multi-country studies, the MMT values tend to be higher in low-latitude regions, including Malaysia and gradually decrease with increasing latitude [19]. Urban areas, such as in Penang, will usually have higher MMT values compared to rural areas by 1–3 °C due to better adaptation to high baseline temperature [5] as well as better infrastructure and healthcare accessibility [49,50].
We found that the risk of mortality following exposure to higher temperatures supersedes the risk of mortality following low-temperature exposure at shorter lag periods. The relatively small variability of temperature with infrequent cold spells in this country possibly explains the non-significant association between low temperature and mortality relationship. The high-temperature effects on non-accidental mortality were immediate, peaking at lag 0–3 in Kedah and lag 0–7 in Penang. Similar short-term effect of extremely high temperature on mortality was observed in Wuhan, Chansha, Guilin in China at lag 0–3 [51], Wuhan at lag 0–7 [38] and a multicounty country at lag 0–14 [52]. Notably, the effect of high temperature on non-accidental mortality lasted up to 0–21 days in Penang, which differs from the predominantly short-term effects reported in previous studies. A comparable prolonged effect was observed in a study conducted across 65 provinces in Thailand, where heat-related mortality persisted up to 21 days [48]. Hence, this complex relationship should be interpreted cautiously and needs further investigation, as different modelling approaches and parameter used in each study [52]. Factors that influence the pattern of temperature–mortality relationships include the difference in the geographical location, climatic characteristics, physiological acclimatization, behavioural changes, adaptation facilities, socioeconomic status, region’s development, economic performance and urbanization rate [49,51,53]. Apart from that, the longer lag effect in Penang is likely due to the urban heat island (UHI) effect, which results in warmer days and nights and less green coverage, exacerbating the impact of high temperatures [54].
In terms of the magnitude of mortality, Penang exhibited a higher relative risk of non-accidental mortality (ranging from 14 to 21%, at lag 0–3 until 0–21) compared to Kedah (13–16%, at lag 0–3 until lag 0–14). This discrepancy could be attributed to Penang’s denser population compared to Kedah (the 3rd most densely populated in Malaysia) [55] and the presence of UHI [56]. An increase in population density has been identified as a sensitivity factor that increases the vulnerability to the negative impact of high temperatures [50].
In addition, Malaysia is moving towards an ageing population, which possibly explains the harvesting effect observed in this study. This finding was expected as more than 50% of the mortality recorded throughout the study period was among the elderly. Moreover, a survey by the National Health Institute in 2019 revealed that Kedah demonstrated a high percentage of chronic diseases such as hyperlipidaemia (48.9%), diabetes (24.9%) and hypertension (28.3%), while 12.5% of the Penang population were inactive [57]. These factors ultimately increase the risk of chronic illnesses, hence making them vulnerable to the short-term effects of extreme heat. A high proportion of frail and elderly individuals, coupled with a high prevalence of chronic diseases in the population, contributed to this phenomenon [40], which was also observed in previous studies, including the United Kingdom, South Korea and Japan [18].
For cause-specific mortality analysis, we observed a significantly higher risk for respiratory mortality, as compared to cardiovascular mortality following extremely high temperature exposure. The risk of mortality for respiratory causes peaked at lag 0–7 for Kedah and lag 0–14 for Penang. Similar findings were observed in 14 Chinese cities, which found the effects of high temperature on respiratory mortality persisted up to lag 0–14 days [58]. Exposure to high temperature causes activation of the inflammatory response, which disrupts the normal oxygen–carbon dioxide exchange process and leads to adult respiratory distress syndrome (ARDS) [59,60]. Studies conducted in European countries have found that extreme temperatures have a significant adverse effect on respiratory disease, particularly chronic obstructive pulmonary disease (COPD) and asthma [5,61]. Another study in Korea found that the risk of pneumonia increased by 89% (RR: 1.89 (95% CI: 1.37–2.61) when the temperature increased by 1 °C above the threshold [62]. This finding highlights the need for targeted intervention, especially for individuals with chronic respiratory diseases.
This study did not find any significant relationship between temperature and cardiovascular mortality for both states; hence, it was inconsistent with the previous finding, which reported the presence of a link between low and high temperature with cardiovascular mortality [40,51]. This could be due to the differences in the time scale and type of data used by different countries/regions for the examination of the temperature and mortality relationship, which also contributed to the different findings. For instance, Xuan et al. (2014) used monthly aggregated data for the temperature and mortality relationship in Hanoi instead of daily mortality data, which has been widely used in other studies [63]. In addition, Malaysia experiences relatively stable temperatures throughout the year, with a narrower temperature range than in temperate regions. Such climatic conditions may facilitate long-term physiological acclimatization and behavioural adaptation to heat. Behavioural modification to heat, including the use of light clothes, good housing ventilation, use of an electric fan and air-conditioning [64,65], may reduce heat-related cardiovascular stress and could partly explain the observed findings, although these factors were not directly measured in the present study.
The elderly have emerged as a high-risk group following exposure to both extremely high temperatures (peaking at lags 0–3 and persisting up to lag 0–14) in both states and extremely low temperatures (lag 0–21 until lag 0–28) in Penang. This study’s findings align with numerous others that have emphasized the vulnerability of the elderly population towards extreme temperatures [66,67]. A study in Chengdu, China, demonstrated that for every 1 °C increase in temperature above a certain threshold, mortality rates increased significantly by 2–5% during extremely high temperatures and 1–2% during extremely cold temperatures among this group [68]. Besides that, a recent systematic review reported that heatwaves are associated with increased morbidity among the elderly, evidenced by increased hospitalizations, visits to emergency departments and outpatient clinics [69]. The elderly are often associated with diminished capacity to regulate body core temperature [70] due to reduced cardiac output, reduced skin blood flow and impaired sweat gland function, which limit the body’s ability to dissipate heat effectively [71]. Drug dependency, such as diuretics and anticholinergics [72], would also impair thermoregulatory processes and further increase susceptibility among this group. In addition, experimental evidence suggests exposure to extremely high temperatures activates heat-sensitive transient receptor potential (TRP) ion channels, namely TRPV1, TRPM3, TRPA1 and initiates thermoregulatory, inflammatory, and physiological stress responses. These mechanisms may contribute to increased susceptibility to adverse health outcomes among older individuals with reduced physiological reserve [73]. High temperatures also might worsen diabetes due to a greater insulin peak in the body, hence increasing the hypoglycaemic episode [74]. Besides that, living alone, limited access to information [75], food insecurity, malnutrition, and reduced mobility play a role in increased morbidity and mortality among the elderly [2].
Although both sexes were vulnerable to heat-related mortality, the magnitude of risk was higher among females than males, particularly in Penang. Female residents in Penang demonstrated the highest heat-related mortality risk (RR = 2.07, 95% CI: 1.29–3.32). Although the association was statistically significant, the confidence interval was wider than those observed for most other subgroups, indicating lower precision in the estimated effect size. This may be attributable to the relatively limited number of observations contributing to the estimation of mortality risk at extreme temperatures and the inherent variability associated with subgroup-specific analyses. Nevertheless, this finding is consistent with previous studies conducted in Malaysia and other settings that reported greater heat-related vulnerability among females than males [25,75,76]. Several mechanisms have been proposed to explain this observation, including lower acclimatization capability, lower fitness level and different skin conductance among females could contribute to reduce capacity to sweat and release heat, therefore contributing to higher mortality risk during high-temperature exposures compared to males [77].
This study demonstrated that Penang experienced a higher magnitude of heat-related mortality compared to Kedah for non-accidental and respiratory causes. As the third most densely populated area in Malaysia, with approximately 1659 persons/km2, with 92.5% of its population living in urban areas [32], Penang may be more susceptible to urban heat island (UHI) effects and heat retention within the built environment. Previous studies conducted in Penang reported a 17% decrease in forest cover, coupled with a 7.63 °C increase in land surface temperature, reflecting the influence of rapid urban development on local thermal conditions [32]. Moreover, rapid urbanization contributes to the UHI effect, driven by diminished vegetation, extensive building development, and anthropogenic heat from vehicles. Collectively, these factors may intensify population exposure to elevated temperatures and partly explain the stronger and more prolonged heat-related mortality effects observed in Penang, which persisted for up to 21 lag days. Following that, there is a need for targeted adaptation strategies in highly urbanized areas. Sustainable urban planning, including promoting green infrastructure and developing energy-efficient buildings, is crucial as a mitigation strategy to reduce the impact of climate change [78].
Conversely, rural populations may experience different socioeconomic and demographic characteristics. According to the Kedah Socioeconomic Report 2019, the state has a substantial agricultural sector and a lower average household income compared with the national average [79]. Greater engagement in outdoor occupations, particularly agriculture-related activities, may increase exposure to ambient temperatures and potentially contribute to the higher mortality risk observed among rural residents in Kedah. However, these factors were not directly assessed in the present study and should therefore be interpreted with caution.
This study has several strengths. First, this study utilized a nine-year dataset, characterized by high quality and devoid of missingness in mortality data. Second, the use of the quasi-Poisson regression with DLNM analysis, adjusted for pollutants, enables the exploration of the intricate relationship between temperature and mortality at different lag periods. Third, stratified analyses by age, gender and rural–urban locations further enrich the understanding of the temperature–mortality relationship in the northern part of Peninsular Malaysia, hence adding a novel dimension to the research landscape.
Several limitations should be acknowledged. The uneven distribution of meteorological stations in both states could introduce misclassification, especially in areas far from the meteorological stations. Nevertheless, Tangang et al. (2012) highlighted that the daily temperatures between meteorological stations in Malaysia were highly correlated with low spatial variability, hence can be used for the exposure measurement [80]. Secondly, the use of aggregated data, hence careful interpretation of the result is needed, and not to infer the individual effect, to avoid ecological fallacy bias [81]. In addition, the air pollutants data were collected from fixed monitoring stations, which might not accurately represent the individual exposure and might introduce a measurement error of the Berkson type [82]. In addition, the exclusion of PM2.5 from the analyses may have resulted in residual confounding, potentially leading to an overestimation or underestimation bias in the temperature–mortality relationship. However, sensitivity analyses revealed that the main findings were robust and the final model was not being influenced by air pollutants, hence minimized the error. Future works should consider the integration of AI tools, such as machine learning-based mortality prediction, into the analysis of hospitalized data during extreme temperature events. This could potentially help forecast surges in healthcare demand, which would ultimately allow for better resource allocation and preparedness [83].

5. Conclusions

In conclusion, this study demonstrated a significant non-linear association between temperature and mortality, with immediate effects of high temperatures observed in both states, peaking at lag 0–3 days in Kedah and lag 0–7 days in Penang. The identified vulnerable groups included the elderly population and individuals with respiratory diseases, while both males and females, as well as residents of urban and rural areas, were found to be at increased risk of mortality following exposure to extreme temperatures. These findings provide important evidence for policymakers to support the development of heat-health warning systems, strengthen healthcare system preparedness and resiliency, improve urban planning, and enhance community adaptation strategies in Malaysia.

Supplementary Materials

The following supporting information can be downloaded at: https://www.mdpi.com/article/10.3390/cli14070139/s1, Table S1. Comparison of Quasi-Akaike Information Criterion (Q-AIC) scores for the basic model of DLNM for temperature and mortality with different df for the time variable for Kedah. Table S2. Comparison of Quasi-Akaike Information Criterion (Q-AIC) scores for the basic model of DLNM for temperature and mortality with different df for the time variable for Penang. Table S3. Comparison of Quasi-Akaike Information Criterion (Q-AIC) scores for the updated model of DLNM for temperature and mortality with different df for temperature, lag, and maximum lag for Kedah. Table S4. Comparison of Quasi-Akaike Information Criterion (Q-AIC) scores for the updated model of DLNM for temperature and mortality with different df for temperature, lag, and maximum lag for Penang. Table S5. Comparison of Quasi-Akaike Information Criterion (Q-AIC) scores after inclusion of confounders for Kedah and Penang. Table S6. Comparison of Quasi-Akaike Information Criterion (Q-AIC) scores after inclusion of temperature indicators for Kedah and Penang. Figure S1. The pooled lag–response relationship of extremely low and extremely high temperatures compared with the minimum mortality temperature (MMT) along lags 0–21 days for non-accidental mortality in Kedah and Penang.

Author Contributions

Conceptualization, H.S., M.I.S., M.R.I., R.I. and W.R.W.M.; methodology, H.S. and W.R.W.M.; software H.S.; validation, M.I.S., M.R.I. and R.I.; formal analysis, H.S.; investigation, H.S.; resources, H.S. and R.I.; data curation, H.S.; writing—original draft preparation, H.S.; writing—review and editing, M.I.S. and R.I.; visualization, H.S.; supervision, M.I.S. and M.R.I.; project administration, H.S.; funding acquisition, H.S. and M.I.S. All authors have read and agreed to the published version of the manuscript.

Funding

This work was supported by Geran Pembudayaan Penyelidikan Dana UiTM Cawangan Selangor (DUCS-P) from Universiti Teknologi MARA (UiTM), with project code 600-UiTMSEL (P.15/4) (080/2022). The funders had no role in the study design, data collection and analysis, publication decisions, or manuscript preparation.

Data Availability Statement

The data used in this study were obtained from the Ministry of Health Malaysia and other relevant agencies. Restrictions apply to the availability of these data due to privacy and confidentiality requirements. Data are available from the corresponding author upon reasonable request and with permission from the respective data custodians.

Acknowledgments

This review is part of extensive research by Universiti Teknologi MARA (UiTM) under the Ministry of Higher Education Malaysia (MOHE) in collaboration with the National Institutes of Health Malaysia. The authors would like to thank the Director General of Health Malaysia for the permission to publish this paper. The authors also acknowledge the manuscript’s reviewers for all their contributions in giving constructive feedback in this review. During the preparation of this manuscript/study, the author used ChatGPT-5.5 (OpenAI) for language editing and to improve clarity. The authors have reviewed and edited the output and take full responsibility for the content of this publication.

Conflicts of Interest

The authors declare no conflicts of interest. The funders had no role in the design of the study; in the collection, analyses, or interpretation of data; in the writing of the manuscript; or in the decision to publish the results.

Abbreviations

The following abbreviations are used in this manuscript:
GHGGreenhouse gases
IPCCIntergovernmental Panel on Climate Change
DOEDepartment of Environment
METMeteorological Department of Malaysia
GLMGeneralized Linear Model
DLNMDistributed Lag-Non-Linear
MMTMinimum Mortality Temperature
UHIUrban Heat Island
DOWDay of the week

References

  1. Bowen, K.J.; Ebi, K.L. Health risks of climate change in the World Health Organization South-East Asia Region. WHO South East Asia J. Public Health 2017, 6, 3–8. [Google Scholar] [CrossRef] [PubMed]
  2. IPCC. Climate Change 2023: Synthesis Report; IPCC: Geneva, Switzerland, 2023. [Google Scholar]
  3. IPCC. Climate Change 2021: The Physical Science Basis. Contribution of Working Group I to the Sixth Assessment Report of the Intergovernmental Panel on Climate Change; Cambridge University Press: Cambridge, UK, 2021. [Google Scholar]
  4. Thirumalai, K.; DiNezio, P.N.; Okumura, Y.; Deser, C. Extreme temperatures in Southeast Asia caused by El Niño and worsened by global warming. Nat. Commun. 2017, 8, 15531. [Google Scholar] [CrossRef] [PubMed]
  5. Gasparrini, A.; Guo, Y.; Hashizume, M.; Lavigne, E.; Zanobetti, A.; Schwartz, J.; Tobias, A.; Tong, S.; Rocklöv, J.; Forsberg, B.; et al. Mortality risk attributable to high and low ambient temperature: A multicountry observational study. Lancet 2015, 386, 369–375. [Google Scholar] [CrossRef] [PubMed]
  6. Mansor, Z.; Rosnah, I.; Ismail, N.H.; Hashim, J.H. Effects of hydration practices on the severity of heat-related illness among municipal workers during a heat wave phenomenon. Med. J. Malays. 2019, 74, 275–280. [Google Scholar]
  7. Anita, A.R.; Tan, H.S.; Fatimah, A.F.; Netto, E.; Juni, M.H. Public Health Impacts of Heat Waves: A Review. Int. J. Public Health Clin. Sci. 2018, 5, 68–85. [Google Scholar]
  8. Anenberg, S.C.; Haines, S.; Wang, E.; Nassikas, N.; Kinney, P.L. Synergistic health effects of air pollution, temperature, and pollen exposure: A systematic review of epidemiological evidence. Environ. Health 2020, 19, 130. [Google Scholar] [CrossRef] [PubMed]
  9. Bressler, R.D.; Moore, F.C.; Rennert, K.; Anthoff, D. Estimates of country level temperature-related mortality damage functions. Sci. Rep. 2021, 11, 20282. [Google Scholar] [CrossRef] [PubMed]
  10. Pascal, M.; Wagner, V.; Corso, M.; Laaidi, K.; Ung, A.; Beaudeau, P. Heat and cold related-mortality in 18 French cities. Environ. Int. 2018, 121, 189–198. [Google Scholar] [CrossRef] [PubMed]
  11. Guo, Y.; Gasparrini, A.; Armstrong, B.G.; Tawatsupa, B.; Tobias, A.; Lavigne, E.; Coelho, M.; Pan, X.; Kim, H.; Hashizume, M.; et al. Heat Wave and Mortality: A Multicountry, Multicommunity Study. Environ. Health Perspect. 2017, 125, 087006. [Google Scholar] [CrossRef] [PubMed]
  12. UNDRR. Human Cost of Disasters. An Overwiew of the Last 20 Years 2000–2019; UN: New York, NY, USA, 2019. [Google Scholar]
  13. Can, G.; Şahin, Ü.; Sayılı, U.; Dubé, M.; Kara, B.; Acar, H.C.; İnan, B.; Aksu Sayman, Ö.; Lebel, G.; Bustinza, R.; et al. Excess Mortality in Istanbul during Extreme Heat Waves between 2013 and 2017. Int. J. Environ. Res. Public Health 2019, 16, 4348. [Google Scholar] [CrossRef] [PubMed]
  14. Ghumman, U.; Horney, J. Characterizing the Impact of Extreme Heat on Mortality, Karachi, Pakistan, June 2015. Prehospital Disaster Med. 2016, 31, 263–266. [Google Scholar] [CrossRef] [PubMed]
  15. Paterson, S.K.; Godsmark, C.N. Heat-health vulnerability in temperate climates: Lessons and response options from Ireland. Glob. Health 2020, 16, 29. [Google Scholar] [CrossRef] [PubMed]
  16. United Nations. Considerations Regarding Vulnerable Groups, Communities and Ecosystems in the Context of the National Adaptation Plans; United Nations: Bonn, Germany, 2018. [Google Scholar]
  17. Hajat, S.; Kosatky, T. Heat-related mortality: A review and exploration of heterogeneity. J. Epidemiol. Community Health 2010, 64, 753–760. [Google Scholar] [CrossRef] [PubMed]
  18. Guo, Y.; Gasparrini, A.; Armstrong, B.; Li, S.; Tawatsupa, B.; Tobias, A.; Lavigne, E.; de Sousa Zanotti Stagliorio Coelho, M.; Leone, M.; Pan, X.; et al. Global variation in the effects of ambient temperature on mortality: A systematic evaluation. Epidemiology 2014, 25, 781–789. [Google Scholar] [CrossRef] [PubMed]
  19. Yin, Q.; Wang, J.; Ren, Z.; Li, J.; Guo, Y. Mapping the increased minimum mortality temperatures in the context of global climate change. Nat. Commun. 2019, 10, 4640. [Google Scholar] [CrossRef] [PubMed]
  20. Dimitrova, A.; Ingole, V.; Basagaña, X.; Ranzani, O.; Milà, C.; Ballester, J.; Tonne, C. Association between ambient temperature and heat waves with mortality in South Asia: Systematic review and meta-analysis. Environ. Int. 2021, 146, 106170. [Google Scholar] [CrossRef] [PubMed]
  21. Ahmad Kamal, N.I.; Ashaari, Z.; Abdullah, A. Spatio-temporal Variability of Heat Exposure in Peninsular Malaysia using Land Surface Temperature. Disaster Adv. 2019, 12, 1–9. [Google Scholar] [CrossRef]
  22. Bernama. Perlis, empat daerah di Kedah catat gelombang haba Tahap 2—MetMalaysia. AstroAwani, 26 March 2026.
  23. Malaysian Meteorological Department Fenomena Cuaca. Available online: https://www.met.gov.my/pendidikan/fenomena-cuaca/ (accessed on 18 November 2021).
  24. Hanafiah, N.A.H. Urban Heat Island Phenomenon in Penang Island, Malaysia. J. Adv. Appl. Sci. Res. 2019, 6, 1–9. [Google Scholar] [CrossRef]
  25. Yatim, A.N.M.; Latif, M.T.; Sofwan, N.M.; Ahamad, F.; Khan, M.F.; Mahiyuddin, W.R.W.; Sahani, M. The association between temperature and cause-specific mortality in the Klang Valley, Malaysia. Environ. Sci. Pollut. Res. 2021, 28, 60209–60220. [Google Scholar] [CrossRef] [PubMed]
  26. Phung, V.; Oka, K.; Honda, Y.; Hijioka, Y.; Ueda, K.; Seposo, X.; Sahani, M.; Wan Mahiyuddin, W.R.; Kim, Y. Daily temperature effects on under-five mortality in a tropical climate country and the role of local characteristics. Environ. Res. 2022, 218, 114988. [Google Scholar] [CrossRef] [PubMed]
  27. Arsad, F.; Ahmad, N.; Ismail, R.; Mohamed, N.; Mohd Radi, M.F.; Osman, Y.; Baharom, M.; Tangang, F. Temperature Related Mortality in A Tropical Climate Country: A Time Series Analysis. Med. Health 2025, 20, 723–739. [Google Scholar]
  28. Moghadamnia, M.T.; Ardalan, A.; Mesdaghinia, A.; Keshtkar, A.; Naddafi, K.; Yekaninejad, M.S. Ambient temperature and cardiovascular mortality: A systematic review and meta-analysis. PeerJ 2017, 5, e3574. [Google Scholar] [CrossRef] [PubMed]
  29. DOSM. Malaysia at a Glance. Available online: https://www.dosm.gov.my/v1/index.php?r=column/cone&menu_id=UDZaUXd2N2k2L2orK2FpdDJ1UjVtZz09 (accessed on 2 January 2026).
  30. Penny Wong. Kedah. Available online: http://www.malaysia-hotels.net/kedah/ (accessed on 2 January 2026).
  31. Mok, O. Massive projects in place to alleviate urbanisation in Penang. Malay Mail, 29 October 2016.
  32. DOSM. Population and Housing Census; DOSM: Putrajaya, Malaysia, 2021. [Google Scholar]
  33. Armstrong, B.G.; Chalabi, Z.; Fenn, B.; Hajat, S.; Kovats, S.; Milojevic, A.; Wilkinson, P. Association of mortality with high temperatures in a temperate climate: England and Wales. J. Epidemiol. Community Health 2011, 65, 340–345. [Google Scholar] [CrossRef] [PubMed]
  34. Jea, K.F.; Hsu, C.-W.; Tang, L.-Y. A Missing Data Imputation Method with Distance Function. In Proceedings of the 2018 International Conference on Machine Learning and Cybernetics (ICMLC), Chengdu, China, 15–18 July 2018; pp. 450–455. [Google Scholar]
  35. Kelley, R.R.; Mattingly, W.A.; Wiemken, T.L.; Khan, M.; Coats, D.; Curran, D.; Chariker, J.H.; Ramirez, J. Visual grids for managing data completeness in clinical research datasets. J. Biomed. Inform. 2015, 54, 337–344. [Google Scholar] [CrossRef] [PubMed]
  36. Gasparrini, A. Distributed Lag Linear and Non-Linear Models in R: The Package dlnm. J. Stat. Softw. 2011, 43, 1–20. [Google Scholar] [CrossRef] [PubMed]
  37. Gasparrini, A.; Armstrong, B.; Kenward, M.G. Distributed lag non-linear models. Stat. Med. 2010, 29, 2224–2234. [Google Scholar] [CrossRef] [PubMed]
  38. Zhang, Y.; Li, C.; Feng, R.; Zhu, Y.; Wu, K.; Tan, X.; Ma, L. The Short-Term Effect of Ambient Temperature on Mortality in Wuhan, China: A Time-Series Study Using a Distributed Lag Non-Linear Model. Int. J. Environ. Res. Public Health 2016, 13, 722. [Google Scholar] [CrossRef] [PubMed]
  39. Cheng, J.; Xu, Z.; Bambrick, H.; Su, H.; Tong, S.; Hu, W. Heatwave and elderly mortality: An evaluation of death burden and health costs considering short-term mortality displacement. Environ. Int. 2018, 115, 334–342. [Google Scholar] [CrossRef] [PubMed]
  40. Dang, T.N.; Seposo, X.T.; Duc, N.H.; Thang, T.B.; An, D.D.; Hang, L.T.; Long, T.T.; Loan, B.T.; Honda, Y. Characterizing the relationship between temperature and mortality in tropical and subtropical cities: A distributed lag non-linear model analysis in Hue, Viet Nam, 2009–2013. Glob. Health Action 2016, 9, 28738. [Google Scholar] [CrossRef] [PubMed]
  41. Chen, K.; Wolf, K.; Breitner, S.; Gasparrini, A.; Stafoggia, M.; Samoli, E.; Andersen, Z.J.; Bero-Bedada, G.; Bellander, T.; Hennig, F.; et al. Two-way effect modifications of air pollution and air temperature on total natural and cardiovascular mortality in eight European urban areas. Environ. Int. 2018, 116, 186–196. [Google Scholar] [CrossRef] [PubMed]
  42. Gasparrini, A.; Guo, Y.; Sera, F.; Vicedo-Cabrera, A.M.; Huber, V.; Tong, S.; de Sousa Zanotti Stagliorio Coelho, M.; Nascimento Saldiva, P.H.; Lavigne, E.; Matus Correa, P.; et al. Projections of temperature-related excess mortality under climate change scenarios. Lancet Planet Health 2017, 1, e360–e367. [Google Scholar] [CrossRef] [PubMed]
  43. López-Bueno, J.A.; Díaz, J.; Linares, C. Differences in the impact of heat waves according to urban and peri-urban factors in Madrid. Int. J. Biometeorol. 2019, 63, 371–380. [Google Scholar] [CrossRef] [PubMed]
  44. Gasparrini, A.; Armstrong, B. Reducing and meta-analysing estimates from distributed lag non-linear models. BMC Med. Res. Methodol. 2013, 13, 1. [Google Scholar] [CrossRef] [PubMed]
  45. Armstrong, B. Models for the relationship between ambient temperature and daily mortality. Epidemiology 2006, 17, 624–631. [Google Scholar] [CrossRef] [PubMed]
  46. Tran, N.D.; Honda, Y.; Do, D.; Pham, A.; Chu, C.; Huang, C.; Phung, D. Effects of Extreme Temperatures on Mortality and Hospitalization in Ho Chi Minh City, Vietnam. Int. J. Environ. Res. Public Health 2019, 16, 432. [Google Scholar] [CrossRef] [PubMed]
  47. Seposo, X.T.; Dang, T.N.; Honda, Y. Evaluating the Effects of Temperature on Mortality in Manila City (Philippines) from 2006–2010 Using a Distributed Lag Nonlinear Model. Int. J. Environ. Res. Public Health 2015, 12, 6842–6857. [Google Scholar] [CrossRef] [PubMed]
  48. Denpetkul, T.; Phosri, A. Daily ambient temperature and mortality in Thailand: Estimated effects, attributable risks, and effect modifications by greenness. Sci. Total Environ. 2021, 791, 148373. [Google Scholar] [CrossRef] [PubMed]
  49. Zeng, Q.; Li, G.; Cui, Y.; Jiang, G.; Pan, X. Estimating Temperature-Mortality Exposure-Response Relationships and Optimum Ambient Temperature at the Multi-City Level of China. Int. J. Environ. Res. Public Health 2016, 13, 279. [Google Scholar] [CrossRef] [PubMed]
  50. Kamal, N.I.A.; Ash’aari, Z.H.; Abdullah, A.M.; Kusin, F.M.; Mohamat Yusuff, F.; Sharaai, A.H.; Muharam, F.M.; Mohd Ariffin, N.A. Extreme heat vulnerability assessment in tropical region: A case study in Malaysia. Clim. Dev. 2022, 14, 472–486. [Google Scholar] [CrossRef]
  51. Bao, J.; Wang, Z.; Yu, C.; Li, X. The influence of temperature on mortality and its Lag effect: A study in four Chinese cities with different latitudes. BMC Public Health 2016, 16, 375. [Google Scholar] [CrossRef] [PubMed]
  52. Guo, Y.; Gasparrini, A.; Armstrong, B.G.; Tawatsupa, B.; Tobias, A.; Lavigne, E.; Coelho, M.d.S.Z.S.; Pan, X.; Kim, H.; Hashizume, M.; et al. Temperature Variability and Mortality: A Multi-Country Study. Environ. Health Perspect. 2016, 124, 1554–1559. [Google Scholar] [CrossRef] [PubMed]
  53. Zhang, Y.; Yu, C.; Bao, J.; Li, X. Impact of temperature variation on mortality: An observational study from 12 counties across Hubei Province in China. Sci. Total Environ. 2017, 587–588, 196–203. [Google Scholar] [CrossRef] [PubMed]
  54. Akomolafe, G.F.; Rosazlina, R. Land use and land cover changes influence the land surface temperature and vegetation in Penang Island, Peninsular Malaysia. Sci. Rep. 2022, 12, 21250. [Google Scholar] [CrossRef] [PubMed]
  55. DOSM. Key Findings of Population and Housing Census of Malaysia 2020: Urban and Rural; DOSM: Putrajaya, Malaysia, 2026. [Google Scholar]
  56. Rahaman, Z.A.; Kafy, A.A.; Saha, M.; Rahim, A.A.; Almulhim, A.I.; Rahaman, S.N.; Fattah, M.A.; Rahman, M.T.; Al Rakib, A. Assessing the impacts of vegetation cover loss on surface temperature, urban heat island and carbon emission in Penang city, Malaysia. Build. Environ. 2022, 222, 109335. [Google Scholar] [CrossRef]
  57. NIH. National Health and Morbidity Survey 2019; NIH: Bethesda, MD, USA, 2019. [Google Scholar]
  58. Li, M.; Zhou, M.; Yang, J.; Yin, P.; Wang, B.; Liu, Q. Temperature, temperature extremes, and cause-specific respiratory mortality in China: A multi-city time series analysis. Air Qual. Atmos. Health 2019, 12, 539–548. [Google Scholar] [CrossRef]
  59. El-Kassimi, F.A.; Al-Mashhadani, S.; Abdullah, A.K.; Akhtar, J. Adult Respiratory Distress Syndrome and Disseminated Intravascular Coagulation Complicating Heat Stroke. Chest 1986, 90, 571–574. [Google Scholar] [CrossRef] [PubMed]
  60. Mora, C.; Counsell, C.W.W.; Bielecki, C.R.; Louis, L.V. Twenty-Seven Ways a Heat Wave Can Kill You. Circ. Cardiovasc. Qual. Outcomes 2017, 10, e004233. [Google Scholar] [CrossRef] [PubMed]
  61. Rodrigues, M.; Santana, P.; Rocha, A. Modelling of Temperature-Attributable Mortality among the Elderly in Lisbon Metropolitan Area, Portugal: A Contribution to Local Strategy for Effective Prevention Plans. J. Urban Health 2021, 98, 516–531. [Google Scholar] [CrossRef] [PubMed]
  62. Lee, H.; Yoon, H.-Y. Impact of ambient temperature on respiratory disease: A case-crossover study in Seoul. Respir. Res. 2024, 25, 73. [Google Scholar] [CrossRef] [PubMed]
  63. Xuan, L.T.T.; Egondi, T.; Ngoan, L.T.; Toan, D.T.T.; Huong, L.T. Seasonality in mortality and its relationship to temperature among the older population in Hanoi, Vietnam. Glob. Health Action 2014, 7, 23115. [Google Scholar] [CrossRef] [PubMed]
  64. Das, J.K.; Kumari, B.; Rahman, A.R.; Azhar, M.; Khan, S.; Masood, U.; Karan, D.; Yasin, R.; Burman, C.; Augustin, J.L.; et al. Evaluation of community-based heat adaptation interventions: A systematic review. BMJ Public Health 2025, 3, e002332. [Google Scholar] [CrossRef] [PubMed]
  65. Son, J.Y.; Liu, J.C.; Bell, M.L. Temperature-related mortality: A systematic review and investigation of effect modifiers. Environ. Res. Lett. 2019, 14, 073004. [Google Scholar] [CrossRef] [PubMed]
  66. Zeng, W.; Lao, X.; Rutherford, S.; Xu, Y.; Xu, X.; Lin, H.; Liu, T.; Luo, Y.; Xiao, J.; Hu, M.; et al. The effect of heat waves on mortality and effect modifiers in four communities of Guangdong Province, China. Sci. Total Environ. 2014, 482–483, 214–221. [Google Scholar] [CrossRef] [PubMed]
  67. Rocklöv, J.; Forsberg, B.; Ebi, K.; Bellander, T. Susceptibility to mortality related to temperature and heat and cold wave duration in the population of Stockholm County, Sweden. Glob. Health Action 2014, 7, 22737. [Google Scholar] [CrossRef] [PubMed]
  68. Xia, Y.; Shi, C.; Li, Y.; Jiang, X.; Ruan, S.; Gao, X.; Chen, Y.; Huang, W.; Li, M.; Xue, R.; et al. Effects of ambient temperature on mortality among elderly residents of Chengdu city in Southwest China, 2016–2020: A distributed-lag non-linear time series analysis. BMC Public Health 2023, 23, 149. [Google Scholar] [CrossRef] [PubMed]
  69. Pinto, A.; Pennisi, F.; Borlini, S.; De Ponti, E.; Signorelli, C.; Cozza, A.; Baldo, V.; Gianfredi, V. Effects of Heat Waves on Hospitalizations, Emergency Department Visits, and Outpatient Care in Frail Older Adults: A Systematic Review and Meta-Analysis. Diseases 2026, 14, 176. [Google Scholar] [CrossRef] [PubMed]
  70. Kenny, G.P.; Yardley, J.; Brown, C.; Sigal, R.J.; Jay, O. Heat stress in older individuals and patients with common chronic diseases. Can. Med. Assoc. J. 2010, 182, 1053–1060. [Google Scholar] [CrossRef] [PubMed]
  71. Basu, R. High ambient temperature and mortality: A review of epidemiologic studies from 2001 to 2008. Environ. Health 2009, 8, 40. [Google Scholar] [CrossRef] [PubMed]
  72. Layton, J.B.; Li, W.; Yuan, J.; Gilman, J.P.; Horton, D.B.; Setoguchi, S. Heatwaves, medications, and heat-related hospitalization in older Medicare beneficiaries with chronic conditions. PLoS ONE 2020, 15, e0243665. [Google Scholar] [CrossRef] [PubMed]
  73. Vandewauw, I.; De Clercq, K.; Mulier, M.; Held, K.; Pinto, S.; Van Ranst, N.; Segal, A.; Voet, T.; Vennekens, R.; Zimmermann, K.; et al. A TRP channel trio mediates acute noxious heat sensing. Nature 2018, 555, 662–666. [Google Scholar] [CrossRef] [PubMed]
  74. Xu, R.; Zhao, Q.; Coelho, M.S.Z.S.; Saldiva, P.H.N.; Zoungas, S.; Huxley, R.R.; Abramson, M.J.; Guo, Y.; Li, S. Association between Heat Exposure and Hospitalization for Diabetes in Brazil during 2000-2015: A Nationwide Case-Crossover Study. Environ. Health Perspect. 2019, 127, 117005. [Google Scholar] [CrossRef] [PubMed]
  75. van Steen, Y.; Ntarladima, A.M.; Grobbee, R.; Karssenberg, D.; Vaartjes, I. Sex differences in mortality after heat waves: Are elderly women at higher risk? Int. Arch. Occup. Environ. Health 2019, 92, 37–48. [Google Scholar] [CrossRef] [PubMed]
  76. Liu, J.; Hansen, A.; Varghese, B.; Liu, Z.; Tong, M.; Qiu, H.; Tian, L.; Lau, K.K.-L.; Ng, E.; Ren, C.; et al. Cause-specific mortality attributable to cold and hot ambient temperatures in Hong Kong: A time-series study, 2006–2016. Sustain. Cities Soc. 2020, 57, 102131. [Google Scholar] [CrossRef]
  77. Kenney, W.L. A review of comparative responses of men and women to heat stress. Environ. Res. 1985, 37, 1–11. [Google Scholar] [CrossRef] [PubMed]
  78. Yadav, N.; Rajendra, K.; Awasthi, A.; Singh, C.; Bhushan, B. Systematic exploration of heat wave impact on mortality and urban heat island: A review from 2000 to 2022. Urban Clim. 2023, 51, 101622. [Google Scholar] [CrossRef]
  79. DOSM. Laporan Sosioekonomi Negeri Kedah, Tahun 2019; DOSM: Putrajaya, Malaysia, 2020. [Google Scholar]
  80. Tangang, F.; Juneng, L.; Salimun, E.; Sei, K.; Loh, J.L.; Muhamad, H. Climate Change and Variability over Malaysia: Gaps in Science and Research Information. Sains Malays. 2012, 41, 1355–1366. [Google Scholar]
  81. Idrovo, A. Three Criteria for Ecological Fallacy. Environ. Health Perspect. 2011, 119, A332. [Google Scholar] [CrossRef] [PubMed]
  82. Armstrong, B.G. Effect of measurement error on epidemiological studies of environmental and occupational exposures. Occup. Environ. Med. 1998, 55, 651. [Google Scholar] [CrossRef] [PubMed]
  83. Hirano, Y.; Kondo, Y.; Hifumi, T.; Yokobori, S.; Kanda, J.; Shimazaki, J.; Hayashida, K.; Moriya, T.; Yagi, M.; Takauji, S.; et al. Machine learning-based mortality prediction model for heat-related illness. Sci. Rep. 2021, 11, 9501. [Google Scholar] [CrossRef] [PubMed]
Figure 1. Location of the study areas with meteorological and air pollution stations.
Climate 14 00139 g001
Figure 2. Cumulative exposure-response association of daily mean temperature with non-accidental mortality, and cause-specific mortality in Kedah and Penang. The blue dashed line refers to the extremely low temperature at the 1st percentile, the red dashed line refers to the extremely high temperature at the 99th percentile, and the purple solid line refers to the minimum mortality temperature (MMT). The 95% CI is illustrated in a light purple shaded area. Models were adjusted for relative humidity, seasonality and days of the week.
Climate 14 00139 g002
Figure 3. Relative risks of mean temperature (°C) on non-accidental and cause-specific mortality over lags 0–3, 0–7, 0–14, 0–21, and 0–28 for Kedah. The reference value was the minimum mortality temperature. The red lines show the cumulative relative risks, while the grey shaded areas show the 95% confidence intervals. Models were adjusted for relative humidity, seasonality and days of the week.
Climate 14 00139 g003
Figure 4. Relative risks of mean temperature (°C) on non-accidental and cause-specific mortality over lags 0–3, 0–7, 0–14, 0–21, and 0–28 for Penang. The reference value was the minimum mortality temperature. The red lines show the cumulative relative risks, while the grey shaded areas show the 95% confidence intervals. Models were adjusted for relative humidity, seasonality and days of the week.
Climate 14 00139 g004
Figure 5. The cumulative relative risks of daily mean temperature (°C) on non-accidental mortality at lag 0–3 and 0–21, stratified by age, gender, and location in Kedah and Penang. a High-temperature effect is the cumulative relative risk comparing the 1st percentile (extremely low temperature) and MMT. b Low-temperature effect is the cumulative relative risk comparing the 99th percentile (extremely high temperature) and MMT.
Climate 14 00139 g005
Table 1. Descriptive statistics of mortality data from 2011 to 2019.
VariablesKedahPenang
Non-accidental mortality
   Total (n)57,46347,826
   Mean ± SD17 ± 615 ± 5
   Min42
   Max4436
Age (years)
   <6528,526 (49.6%)21,923 (45.8%)
   ≥6528,937 (50.4%)25,903 (54.2%)
Gender
   Male33,931 (59.0%)28,371 (59.3%)
   Female23,532 (41.0%)19,455 (40.7%)
Location
   Urban33,245 (57.9%)42,107 (88.1%)
   Rural23,823 (42.1%)5719 (11.9%)
Cause-specific mortality
   Cardiovascular18,712 (32.6%)15,598 (32.6%)
   Respiratory13,746 (23.9%)9760 (20.4%)
Note: Total non-accidental mortality = ICD-10 (A00–R99), cardiovascular mortality = ICD-10 (I00–I99), respiratory mortality = ICD-10 (J00–J99).
Table 2. Descriptive statistics of daily temperature and air pollutants.
KedahPenang
Mean ± SDMinimumMaximumMean ± SDMinimumMaximum
Temperature
  Minimum24.8 ± 1.019.427.324.8 ± 0.9719.728.1
  Maximum32.3 ± 1.625.937.031.9 ± 1.3125.036.0
  Mean28.0 ± 1.124.630.928.0 ± 1.0323.730.9
Percentile for temperature
  1st25.425.6
  10th26.726.7
  50th28.028.0
  90th29.229.2
  99th30.230.2
Relative Humidity (%) 80.5± 6.9 55.9794.3779.8 ± 2.9654.395.2
Air pollutants
  PM10 (μg/m3) 36.58 ± 21.306.80225.1440.56± 21.354.785315.71
  Ozone (μg/m3) a35.25 ± 14.496.5493.5938.62 ± 16.095.24119.30
  SO2 (μg/m3) 2.64 ± 1.530.0012.234.70 ± 2.080.8116.58
  NO2 (μg/m3) 11.73 ± 2.783.1423.2021.82 ± 5.003.7643.85
  CO (mg/m3) a0.64 ± 0.180.202.590.79 ± 0.210.302.87
Note a: a maximum of 8 h moving average.
Disclaimer/Publisher’s Note: The statements, opinions and data contained in all publications are solely those of the individual author(s) and contributor(s) and not of MDPI and/or the editor(s). MDPI and/or the editor(s) disclaim responsibility for any injury to people or property resulting from any ideas, methods, instructions or products referred to in the content.