Next Issue
Volume 12, May
Previous Issue
Volume 12, March


Climate, Volume 12, Issue 4 (April 2024) – 10 articles

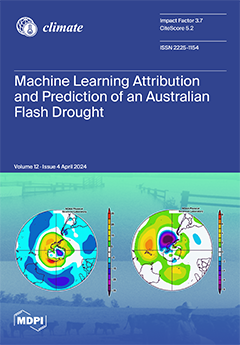
Cover Story (view full-size image): Flash droughts occur suddenly and intensify rapidly. Their impact on affected regions is disastrous. They are becoming more frequent in Australia and worldwide. Machine learning techniques were applied to a flash drought in the Upper Hunter region of eastern Australia that occurred in 2023. The six most prominent climate drivers, and likely predictors, of the flash drought over the period 1963–2022 were markedly different when the time period was split between 1963–1992 and 1993–2022. The 1990s are representative of the early and accelerating global warming periods, respectively. The differences are readily explained by the impacts of global warming on hemispheric and synoptic-scale atmospheric circulations. View this paper
  • Issues are regarded as officially published after their release is announced to the table of contents alert mailing list.
  • You may sign up for e-mail alerts to receive table of contents of newly released issues.
  • PDF is the official format for papers published in both, html and pdf forms. To view the papers in pdf format, click on the "PDF Full-text" link, and use the free Adobe Reader to open them.
Order results
Result details
Section
Select all
Export citation of selected articles as:
15 pages, 7440 KiB  
Article
Characteristics of Foehn Wind in Urumqi, China, and Their Relationship with EI Niño and Extreme Heat Events in the Last 15 Years
by Maoling Ayitikan, Xia Li, Yusufu Musha, Qing He, Shuting Li, Yuting Zhong and Kai Cheng
Climate 2024, 12(4), 56; https://doi.org/10.3390/cli12040056 - 19 Apr 2024
Viewed by 1414
Abstract
Dry and hot Foehn wind weather often occurs in Urumqi, China, due to its canyon terrain. This directly impacts the lives and health of local people. Using surface meteorological variables (including the hourly wind, temperature, humidity, and pressure) measured in situ at the [...] Read more.
Dry and hot Foehn wind weather often occurs in Urumqi, China, due to its canyon terrain. This directly impacts the lives and health of local people. Using surface meteorological variables (including the hourly wind, temperature, humidity, and pressure) measured in situ at the Urumqi Meteorological Station and ERA5 reanalysis from the European Centre for Medium-Range Weather Forecasts in the past 15 years (2008–2022), the characteristics of Foehn wind and their relationship with EI Niño and extreme high-temperature events in Urumqi are analyzed. The results show that the annual distributions of Foehn wind present a fluctuating pattern, and the highest frequency occurred in 2015. Compared to the summer (July) and winter (February) seasons, Foehn wind occurs most frequently in spring (March, April, May) and autumn (September, October, and November). Daily variations in Foehn wind occur most frequently from 9:00 a.m. to 14:00 p.m. In particular, high levels are found at 10:00 a.m. and 11:00 a.m. in April and May. In 2011, 2012, and 2014, the average wind speed of FW exceeded 6 m/s, and the lowest average wind speed was 3.8 m/s in 2021. The temperature and relative humidity changes (ΔT and ΔRH) caused by Foehn wind are the most significant in winter and when Foehn wind begins to occur. The high-temperature hours related to Foehn wind weather in Urumqi represented 25% of the total in the past 15 years. During the EI Niño period, the amount of Foehn wind in Urumqi significantly increased; The correlation coefficient beteewn slide anomaly of Foehn days and the Oceanic Niño Index is as high as 0.71. Specifically, Foehn wind activity aggravates extreme high-temperature events. This study provides indications for Foehn wind weather forecasting in Urumqi. Full article
Show Figures

Figure 1

23 pages, 55173 KiB  
Article
Visualising the Complexity of Drought: A Network Analysis Based on the Water Resilience Assessment Framework and the Actor-Relational Approach
by Joachim Vercruysse, Greet Deruyter, Renaat De Sutter and Luuk Boelens
Climate 2024, 12(4), 55; https://doi.org/10.3390/cli12040055 - 18 Apr 2024
Viewed by 1868
Abstract
This paper discusses the increasing severity of droughts due to climate change. It emphasises the complexity of defining drought and the diverse perspectives among stakeholders. Lots of stakeholders with unclear responsibilities are involved, which can lead to uncertainty and indecisiveness in addressing the [...] Read more.
This paper discusses the increasing severity of droughts due to climate change. It emphasises the complexity of defining drought and the diverse perspectives among stakeholders. Lots of stakeholders with unclear responsibilities are involved, which can lead to uncertainty and indecisiveness in addressing the issue. To tackle this, the present paper proposes a methodology to dissect drought systems and reveal the intricate relationships between their components. This approach combines a comprehensive definition of drought with the “Water Resilience Assessment Framework” and an “Actor-Relational Approach”, visualised through network analysis. The methodology was applied to a case study situated in the Leie Basin of Flanders, Belgium. By employing this strategy, policymakers and mediators can gain a deeper understanding of drought, identify its root causes, and prioritise necessary changes for more effective drought and water management. Full article
(This article belongs to the Special Issue Coping with Flooding and Drought)
Show Figures

Figure 1

19 pages, 3276 KiB  
Article
Using Calibrated Rainfall Forecasts and Observed Rainfall to Produce Probabilistic Meteorological Drought Forecasts
by Zhi-Weng Chua, Yuriy Kuleshov and Jessica Bhardwaj
Climate 2024, 12(4), 54; https://doi.org/10.3390/cli12040054 - 10 Apr 2024
Viewed by 1459
Abstract
Most existing drought forecast systems rely only on observed or forecast rainfall, losing valuable context gained from considering both. The lack of a direct link between observed and forecast rainfall reduces the physical consistency of a system, motivating the development of a methodology [...] Read more.
Most existing drought forecast systems rely only on observed or forecast rainfall, losing valuable context gained from considering both. The lack of a direct link between observed and forecast rainfall reduces the physical consistency of a system, motivating the development of a methodology that can directly link the two. The methodology developed in this study allows the comparison of the calibrated ensemble forecasts of rainfall totals from a dynamical climate model to observed rainfall deficiencies from a gridded rainfall analysis. The methodology is used to create a probabilistic product that forecasts the chance of entering meteorological drought, with lead times of one month (monthly forecast) and three months (seasonal forecast). Existing deficiency areas are included to facilitate analysis of how these areas are forecast to change. The performance of the developed methodology was verified using Percent Correct (PC), Brier Score (BS), and Relative Operating Characteristic (ROC) statistics. Analysis of the forecast plots was also completed visually. Forecast performance for areas with existing deficiencies as well as for non-deficiency areas was promising (PC rates of >79% and >97%, respectively). Although PC rates for observed deficiencies were low across most months, the mean forecast probability for these areas was 36%, indicating the system had value and outperformed climatology. A calibrated, coupled product like the one scoped in this study has not been explored and we note that it could be an invaluable tool for quantifying meteorological drought onset and persistence in Australia. Full article
Show Figures

Figure 1

23 pages, 1140 KiB  
Review
Key Innovations in Financing Nature-Based Solutions for Coastal Adaptation
by Fausto Favero and Jochen Hinkel
Climate 2024, 12(4), 53; https://doi.org/10.3390/cli12040053 - 9 Apr 2024
Cited by 2 | Viewed by 3612
Abstract
The implementation of nature-based solutions (NBSs) for coastal adaptation to climate change is limited by a well-documented lack of finance. Scholars agree that financial innovation represents a solution to this problem, particularly due to its potential for mobilising private investments. It remains unclear [...] Read more.
The implementation of nature-based solutions (NBSs) for coastal adaptation to climate change is limited by a well-documented lack of finance. Scholars agree that financial innovation represents a solution to this problem, particularly due to its potential for mobilising private investments. It remains unclear however how exactly innovative solutions address the specific barriers found in NBS implementation and, given the distinctive local characteristics of NBSs, to what extent successful innovations can be replicated in other locations. This study addresses this issue by reviewing the literature and case studies of innovative financial solutions currently implemented in NBS projects, highlighting which financial barriers these arrangements address and which contextual conditions affect their applicability. We find that there is no “low-hanging fruit” in upscaling finance in NBSs through financial innovation. Innovative solutions are nevertheless expected to become more accessible with the increase in NBS project sizes, the increased availability of data on NBS performance, and the establishment of supportive policy frameworks. The flow of finance into NBS projects can be further enhanced through the external support of both public (de-risking and regulation) and private actors (financial expertise). Full article
(This article belongs to the Special Issue Climate Change Adaptation Costs and Finance)
Show Figures

Figure 1

18 pages, 6582 KiB  
Article
Unlocking Weather Observations at Puerto Madryn-Patagonia, Argentina, 1902–1915
by Susan Gabriela Lakkis, Pablo O. Canziani and Adrián E. Yuchechen
Climate 2024, 12(4), 52; https://doi.org/10.3390/cli12040052 - 9 Apr 2024
Cited by 1 | Viewed by 1586
Abstract
The recovery of early records of maximum, minimum, and mean temperatures; pressure; and relative humidity measurements in Puerto Madryn for the period 1902–1915 is presented. A careful evaluation of the quality of the data was performed using internal coherence, tolerance, and temporal consistency [...] Read more.
The recovery of early records of maximum, minimum, and mean temperatures; pressure; and relative humidity measurements in Puerto Madryn for the period 1902–1915 is presented. A careful evaluation of the quality of the data was performed using internal coherence, tolerance, and temporal consistency tests. The monthly mean series of all the variables, constructed from daily raw data, were subject to several homogeneity tests, and only discontinuities in pressure and relative humidity were found. The homogenized monthly mean series were compared with the Twentieth Century Reanalysis series in annual and seasonal time steps. In addition, the trends of each variable were assessed using the Mann–Kendall procedure, and correlations between relative humidity and the other variables were examined. The results show a remarkably good agreement between the temperature measurements and reanalysis values with a Spearman correlation coefficient of 0.94. The raw data for minimum and maximum temperatures represent a very good upper and lower bound for the mean temperature values of both observational and reanalysis data. Agreement was found to be lower for relative humidity and pressure with the correlation coefficients being close to 0.6 in both cases. No trends were found for the variables. The correlation analysis of the humidity measurements with the other variables shows an inverse dependence of the temperatures and no relatedness with the pressure values. Full article
(This article belongs to the Special Issue The Importance of Long Climate Records)
Show Figures

Figure 1

26 pages, 7472 KiB  
Article
Unlocking Weather Observations at the End of the World: Late-XIX and Early-XX Century Monthly Mean Temperature Climatology for Southern Patagonia
by Pablo O. Canziani, S. Gabriela Lakkis, Adrián E. Yuchechen and Oscar Bonfilli
Climate 2024, 12(4), 51; https://doi.org/10.3390/cli12040051 - 9 Apr 2024
Viewed by 1658
Abstract
A climate analysis of the monthly mean temperatures of Southern Patagonia during the late-XIXth and early-XXth centuries was carried out as part of the international data rescue Atmospheric Circulation Reconstructions over the Earth (ACRE) program partnership in Argentina, together with other data sources [...] Read more.
A climate analysis of the monthly mean temperatures of Southern Patagonia during the late-XIXth and early-XXth centuries was carried out as part of the international data rescue Atmospheric Circulation Reconstructions over the Earth (ACRE) program partnership in Argentina, together with other data sources with regional and global records. The data from these diverse sources were combined to carry out a study in the coastal region of Patagonia, including Tierra del Fuego, between 42° S and 55° S for 11 locations. Furthermore, HadSST monthly/seasonal fields during the period 1880–1920 were also used. Both mean monthly and seasonal temperature values and timeseries variability were considered. Their analysis shows consistent behavior within the study region and compared to Southern Hemisphere mean results, which are characterized by a warm late-XIX century and a cooler early-XX century. This is also in agreement with SST variability along the coasts of Patagonia and hemispheric records. A comparison with present-day observations, where available, also yields consistent behavior. Low-frequency variability, i.e., in periods longer than 3 years, during the study period is consistent with present variability. Trend estimates at Trelew and Rio Gallegos for the period 1901–2020 yield significant trends, consistent with hemispheric warming at their latitudes. Full article
(This article belongs to the Special Issue The Importance of Long Climate Records)
Show Figures

Figure 1

50 pages, 1122 KiB  
Article
Meta-Analysis and Ranking of the Most Effective Methane Reduction Strategies for Australia’s Beef and Dairy Sector
by Merideth Kelliher, Diana Bogueva and Dora Marinova
Climate 2024, 12(4), 50; https://doi.org/10.3390/cli12040050 - 8 Apr 2024
Viewed by 4112
Abstract
Although Australia remains committed to the Paris Agreement and to reducing its greenhouse gas emissions, it was late in joining the 2021 Global Methane Pledge. Finding suitable methane (CH4) mitigation solutions for Australia’s livestock industry should be part of this journey. [...] Read more.
Although Australia remains committed to the Paris Agreement and to reducing its greenhouse gas emissions, it was late in joining the 2021 Global Methane Pledge. Finding suitable methane (CH4) mitigation solutions for Australia’s livestock industry should be part of this journey. Based on a 2020–2023 systematic literature review and multicriteria decision approach, this study analyses the available strategies for the Australian beef and dairy sector under three scenarios: baseline, where all assessment criteria are equally weighted; climate emergency, with a significant emphasis on CH4 reduction for cattle in pasture and feedlot systems; and conservative, where priority is given to reducing costs. In total, 46 strategies from 27 academic publications were identified and classified as ‘Avoid’, ‘Shift’, or ‘Improve’ with respect to their impact on current CH4 emissions. The findings indicate that ‘Avoid’ strategies of conversion of agricultural land to wetlands, salt marshes, and tidal forest are most efficient in the climate emergency scenario, while the ‘Improve’ strategy of including CH4 production in the cattle breeding goals is the best for the conservative and baseline scenarios. A policy mix that encourages a wide range of strategies is required to ensure CH4 emission reductions and make Australia’s livestock industry more sustainable. Full article
(This article belongs to the Special Issue Recent Climate Change Impacts in Australia)
Show Figures

Figure 1

14 pages, 3263 KiB  
Article
Machine Learning Identification of Attributes and Predictors for a Flash Drought in Eastern Australia
by Milton Speer, Joshua Hartigan and Lance M. Leslie
Climate 2024, 12(4), 49; https://doi.org/10.3390/cli12040049 - 8 Apr 2024
Cited by 2 | Viewed by 5680
Abstract
Flash droughts (FDs) are natural disasters that strike suddenly and intensify quickly. They occur almost anywhere, anytime of the year, and can have severe socio-economic, health and environmental impacts. This study focuses on a recent FD that began in the cool season of [...] Read more.
Flash droughts (FDs) are natural disasters that strike suddenly and intensify quickly. They occur almost anywhere, anytime of the year, and can have severe socio-economic, health and environmental impacts. This study focuses on a recent FD that began in the cool season of the Upper Hunter region of Eastern Australia, an important energy and agricultural local and global exporter that is both flood- and drought-prone. Here, the authors investigate the FD that started abruptly in May 2023 and extended to October 2023. The FD followed floods in November 2021 and much above-average May–October 2022 rainfall. Eight machine learning (ML) regression techniques were applied to the 60 May–October periods from 1963–2022, using a rolling windows attribution search from 45 possible climate drivers, both individually and in combination. The six most prominent climate drivers, and likely predictors, provide an understanding of the major contributors to the FD. Next, the 1963–2022 data were divided into two shorter timespans, 1963–1992 and 1993–2022, generally accepted as representing the early and accelerated global warming periods, respectively. The key attributes were markedly different for the two timespans. These differences are readily explained by the impacts of global warming on hemispheric and synoptic-scale atmospheric circulations. Full article
(This article belongs to the Special Issue Addressing Climate Change with Artificial Intelligence Methods)
Show Figures

Figure 1

17 pages, 2090 KiB  
Article
Spatiotemporal Assessment of Surface Solar Dimming in India: Impacts of Multi-Level Clouds and Atmospheric Aerosols
by Ashwin Vijay Jadhav, P. R. C. Rahul, Vinay Kumar, Umesh Chandra Dumka and Rohini L. Bhawar
Climate 2024, 12(4), 48; https://doi.org/10.3390/cli12040048 - 30 Mar 2024
Cited by 2 | Viewed by 2535
Abstract
Surface solar radiation (SSR) is a fundamental energy source for an equitable and sustainable future. Meteorology-induced variability increases uncertainty in SSR, thereby limiting its reliability due to its intermittent nature. This variability depends on several meteorological factors, including clouds, atmospheric gases, and aerosol [...] Read more.
Surface solar radiation (SSR) is a fundamental energy source for an equitable and sustainable future. Meteorology-induced variability increases uncertainty in SSR, thereby limiting its reliability due to its intermittent nature. This variability depends on several meteorological factors, including clouds, atmospheric gases, and aerosol concentrations. This research investigates the detailed impact of different levels of clouds and aerosols on SSR across India. Utilizing satellite data with reanalysis retrievals, the research covers a span of three decades (30 years), from 1993 to 2022. Aerosols contributed to an average attenuation of ~13.33% on SSR, while high, mid, and low cloud conditions showed much stronger impacts, with an attenuation of ~30.80%, ~40.10%, and ~44.30%, respectively. This study reveals an alarming pattern of increasing cloud impact (Cimpact) on SSR in the recent decade, with a significant increasing rate of ~0.22% year−1 for high cloud (HCimpact) and ~0.13% year−1 for mid cloud (MCimpact) impact, while low cloud impact (LCimpact) showed minimal change. The trend of aerosol impact (Aimpact) also showed an average increase of ~0.14% year−1 across all regions. The findings underscore the imperative of considering climatic variables while studying the growing solar dimming. Our findings also will assist policymakers and planners in better evaluating the solar energy resources across India. Full article
Show Figures

Figure 1

17 pages, 570 KiB  
Article
Adaptation Attitudes Are Guided by “Lived Experience” Rather than Electoral Interests: Evidence from a Survey Experiment in Bangladesh
by Todd A. Eisenstadt, Sk Tawfique M. Haque, Michael A. Toman and Matthew Wright
Climate 2024, 12(4), 47; https://doi.org/10.3390/cli12040047 - 26 Mar 2024
Viewed by 1692
Abstract
After decades of presuming that climate adaptation is a private good benefitting only those receiving resources to reduce individual climate risks, respondents in a survey experiment among the climate-vulnerable in Bangladesh chose less-particularistic adaptation projects than “electoral connection” disaster relief theories predict and [...] Read more.
After decades of presuming that climate adaptation is a private good benefitting only those receiving resources to reduce individual climate risks, respondents in a survey experiment among the climate-vulnerable in Bangladesh chose less-particularistic adaptation projects than “electoral connection” disaster relief theories predict and more “short-sighted” projects than international diplomats anticipate. This article reports on the experiment, which asked a representative national sample of Bangladeshis whether they favor spending funds on short-term particularistic solutions (disaster relief stockpiles), medium-term inclusionary and non-excludable solutions (ocean embankments), or long-term, public goods solutions (the development of flood-resistant rice seeds). More respondents chose “middle ground” embankment spending, and a statistically significant change in respondent propensities was tied to their lived experience with climate vulnerability rather than electoral incentives. The logic of their choices contradicts existing explanations, implying that a reconsideration of vulnerable community preferences, and how to address them, may be needed. Full article
(This article belongs to the Section Policy, Governance, and Social Equity)
Show Figures

Figure 1

Previous Issue
Next Issue
Back to TopTop