1. Introduction
Climate change manifests itself in the form of increasingly frequent and severe hazards, posing significant challenges across diverse sectors [
1,
2,
3,
4,
5,
6,
7]. As a result, significant changes in the climate system have transformed the global environment since 1950 [
3,
4,
8]. These changes lead to a range of effects, highlighting the vulnerability of both natural and human systems to climate change [
2,
3,
4,
9,
10,
11]. Droughts, in particular, exhibit distinct characteristics that distinguish them from other hazards. Unlike isolated events, droughts unfold over extended periods, gradually accumulating impacts over a prolonged timeframe and persisting for considerable durations [
1,
5,
6,
7,
12,
13]. Furthermore, droughts often engender non-structural repercussions across large geographical areas and are influenced by human activities [
1,
5,
6,
7,
8,
12,
13]. As water management entails conserving water through efficient resource allocation, infrastructure development, and resilience strategies, it directly plays a pivotal role in adapting to drought impacts and ensuring resilient water use during periods of water scarcity. Therefore, the structure and responsibilities among organisations active in water management must be clear. However, this clarity is often lacking, complicating the formulation of an interdisciplinary drought definition and subsequent approaches to this phenomenon.
A literature review conducted by Slette et al. in 2019 revealed that researchers in the field of ecology employ diverse approaches to characterise droughts, including reduced precipitation, low soil moisture, and reduced streamflow. Simultaneously, some papers equate “dry conditions” with “drought” without distinction [
14]. Moreover, various research disciplines adopt their own perspectives to assess drought occurrences, incorporating diverse physical, biological, and socioeconomic factors in their definitions. [
5,
13,
14,
15,
16,
17] Commonly defined types of droughts include “meteorological”, “agricultural”, “hydrological”, and “socioeconomic” drought [
5,
13,
16,
18,
19,
20]. The definition of meteorological drought is based on precipitation deficits. If a meteorological drought persists, soil water deficiency can occur, leading to agricultural drought. This link between meteorological and agricultural droughts centres on factors such as precipitation shortages, disparities between actual and potential evapotranspiration, and soil water deficits, all critical for vegetation. Hydrological droughts typically occur out of phase or lag behind the onset of meteorological and agricultural droughts, as more time elapses before precipitation deficiencies manifest in other components of the hydrological system. Socioeconomic drought incorporates the effects of meteorological, agricultural, and hydrological droughts, associating them with the supply and demand of certain economic goods. Consequently, the incidence of drought could increase due to changes in the frequency of the physical event, societal vulnerability to water shortages, or both [
5,
13,
16,
18,
19,
20]. More recently, additional terms have emerged, such as “human-modified drought” [
21] and “ecological drought” [
1,
14]. The term “human-modified drought” refers to a drought that is enhanced or alleviated as a result of anthropogenic processes, as human activities influence the water availability and can modify the occurrence of drought. While in the classic perspective, drought definitions are traditionally based on natural processes, Van Loon stated that the definition should be complemented with human processes in the hydrological cycle [
21]. In 2017, Crausbay et al. argued that previous perspectives on drought often fail to evaluate its impact on ecosystems and human communities. The definition of ecological drought, therefore, includes the understanding that changes in human and natural behaviour can trigger vulnerability, feeding back into impacts on human communities and ecosystems [
1,
14]. These distinct findings underscore the complex nature of the drought concept [
22], where complexity originates from the intricacy and the presence of numerous interconnected elements that interact in ways that are not always predictable [
22,
23,
24].
The absence of a clear and exhaustive definition leads to fragmentation and impedes understanding within a range of involved actors, subsequently leading to indecisiveness and inaction among managers, policy makers, and other stakeholders [
13]. Therefore, first and foremost, a more common and versatile definition must be established to deal with this issue more comprehensively. Although previous classifications of droughts provide valuable insights into the consequences, these traditional definitions lack the necessary complexity to comprehend the interrelationships among various elements. In general, drought is treated as a product rather than a dynamic process, leading to definitions that primarily quantify water deficits over a specified time period and thus fail to consider the reciprocal interaction between human activities [
12], evolving environmental circumstances [
1], management practices [
25], and legislative factors. Therefore, the definition adopted in this study follows AghaKouchak et al. (2021), in which anthropogenic drought is defined as a process that ends up in water stress (societal or environmental) due to feedbacks between human activities and/or nature [
12]. In this way, the definition does not focus on only one aspect of drought, but is open to a broader perspective and thus its complexity.
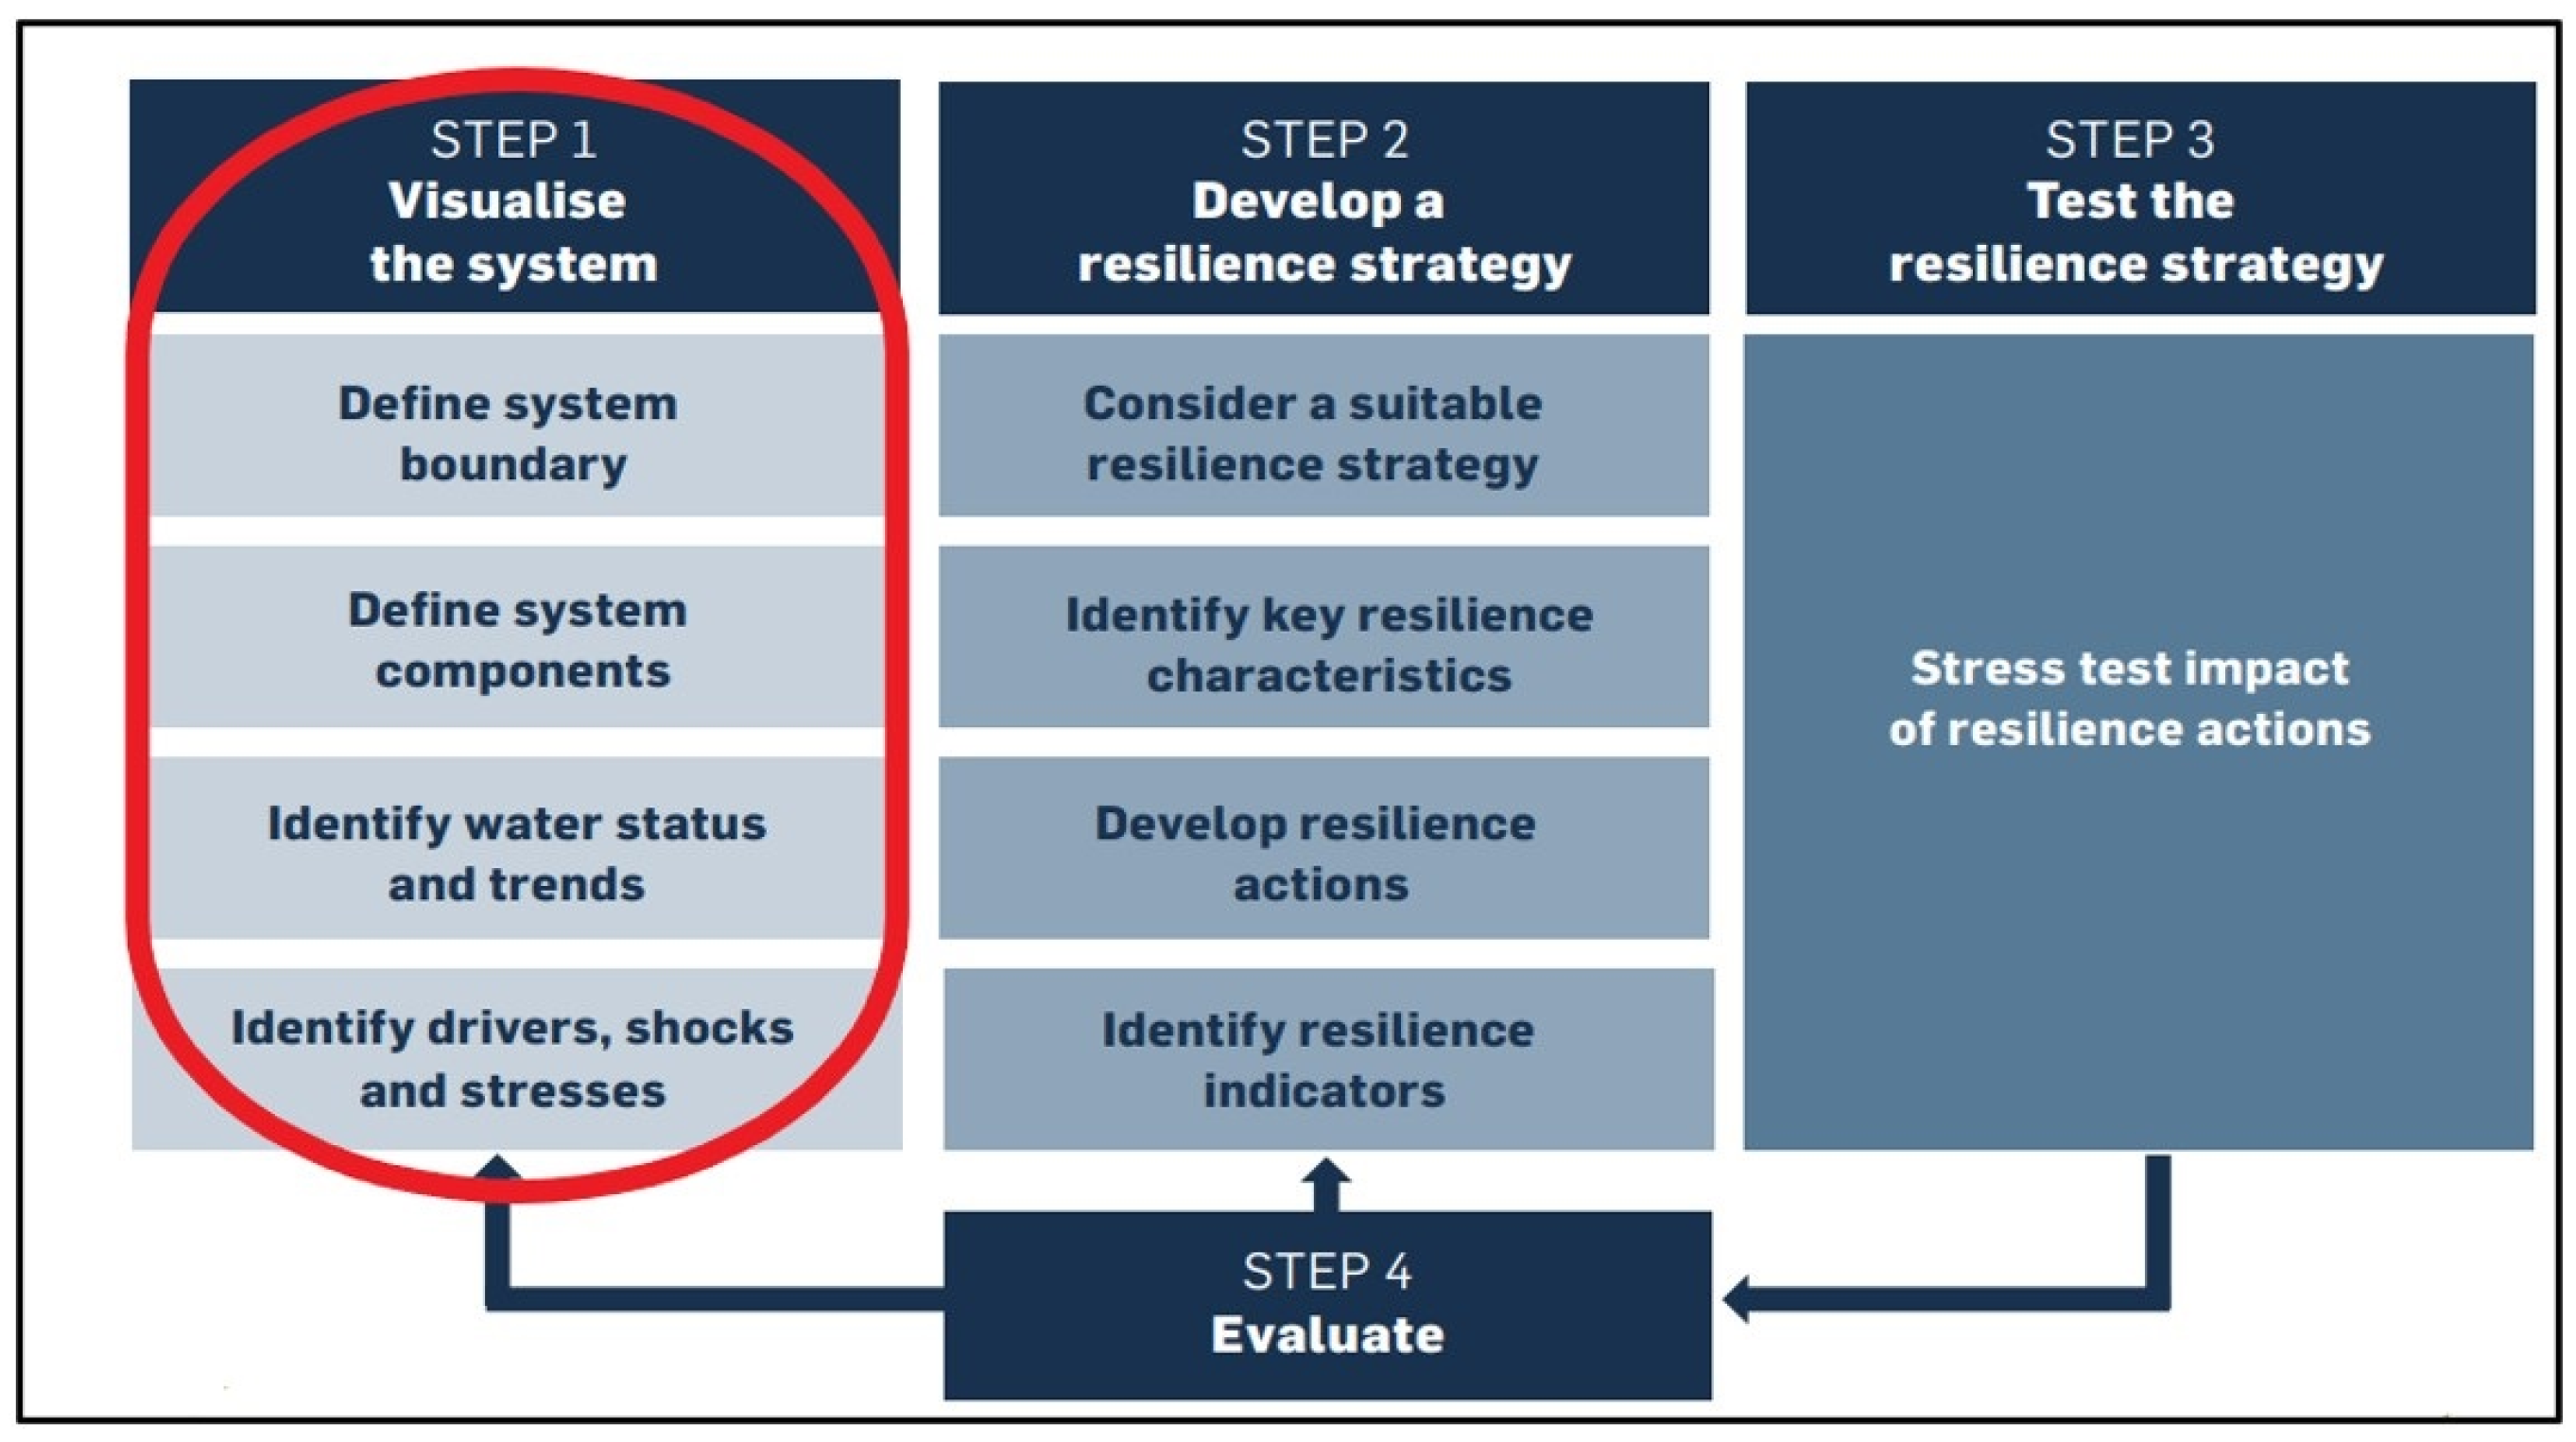
Given the increasing occurrence and severity of droughts, it is crucial to obtain an understanding of the components and their interactions. Therefore, the purpose of the current study is to present an operational methodology to visualise a drought system within its complexity based on the first step of the “Water Resilience Assessment Framework” (WRAF), as shown in
Figure 1. The WRAF is a practical framework to systematically assess the different components of a water management system and identify vulnerabilities and opportunities for improvement as a stepping stone to evolve towards resilience at all water management levels. The four main steps of the WRAF are as follows: (1) visualisation of the system, (2) development of a resilience strategy, (3) testing the resilience strategy, and (4) evaluation [
8].
As visualisation inherently means the identification of the components, two additional frameworks were used: the “Actor-Relational Approach” (ARA) and a network analysis. The ARA was used to unravel, structure, and simplify the complexity of drought systems and to detect and define the system components. ARA is based on Luhmann’s theory, in which he argues that society, as a system, is too complex to comprehend. To address this complexity, he divides it into different subsystems. A (sub)system can be viewed as a set of interconnected components that function as a whole, with the context shaping its identity and elements. Therefore, each system can evolve under particular circumstances and affect neighbouring systems [
26,
27]. In this research, the whole water system is seen as “the system”, with the drought problem being a subsystem. Floods, for instance, are another subsystem within the water system, affecting (and being affected by) the drought (sub)system. After applying the ARA, a network analysis was used to visualise the complex interrelations within a drought system. In this way, a better understanding is obtained.
2. Materials and Methods
The outline of the methodology is based on the first step of the WRAF; however, it was used as a guide and not followed to the letter. The visualisation of the system consists of four steps: (1) defining the system boundary, (2) defining the system components, (3) network analysis, and (4) trends and status.
2.1. Defining the System Boundary
Setting the boundary of a drought system is a first step in reducing its complexity. The system boundary may be relatively small or extremely large, depending on its anticipated complexity [
8]. Nevertheless, all systems, small or large, may be connected to, and influenced by, other adjacent systems [
26,
27]. It is essential that these influences, both positive and negative, are incorporated in the drought system. It is also important to regularly assess or reassess the characteristics of the systems since, over time, system components can evolve and change [
8,
26,
27].
Many countries are divided into regions, provinces, and municipalities. However, these administrative boundaries only marginally impact a drought system. Other delineations, such as groundwater and surface water systems, are more determinative in setting the systems’ boundary. Hence, due to the complexity involved, these delineations alone are not sufficient. Therefore, the boundary containing the most relevant elements is chosen as system boundary, while the other delineations are added as input/output to the system.
2.2. Defining the System Components
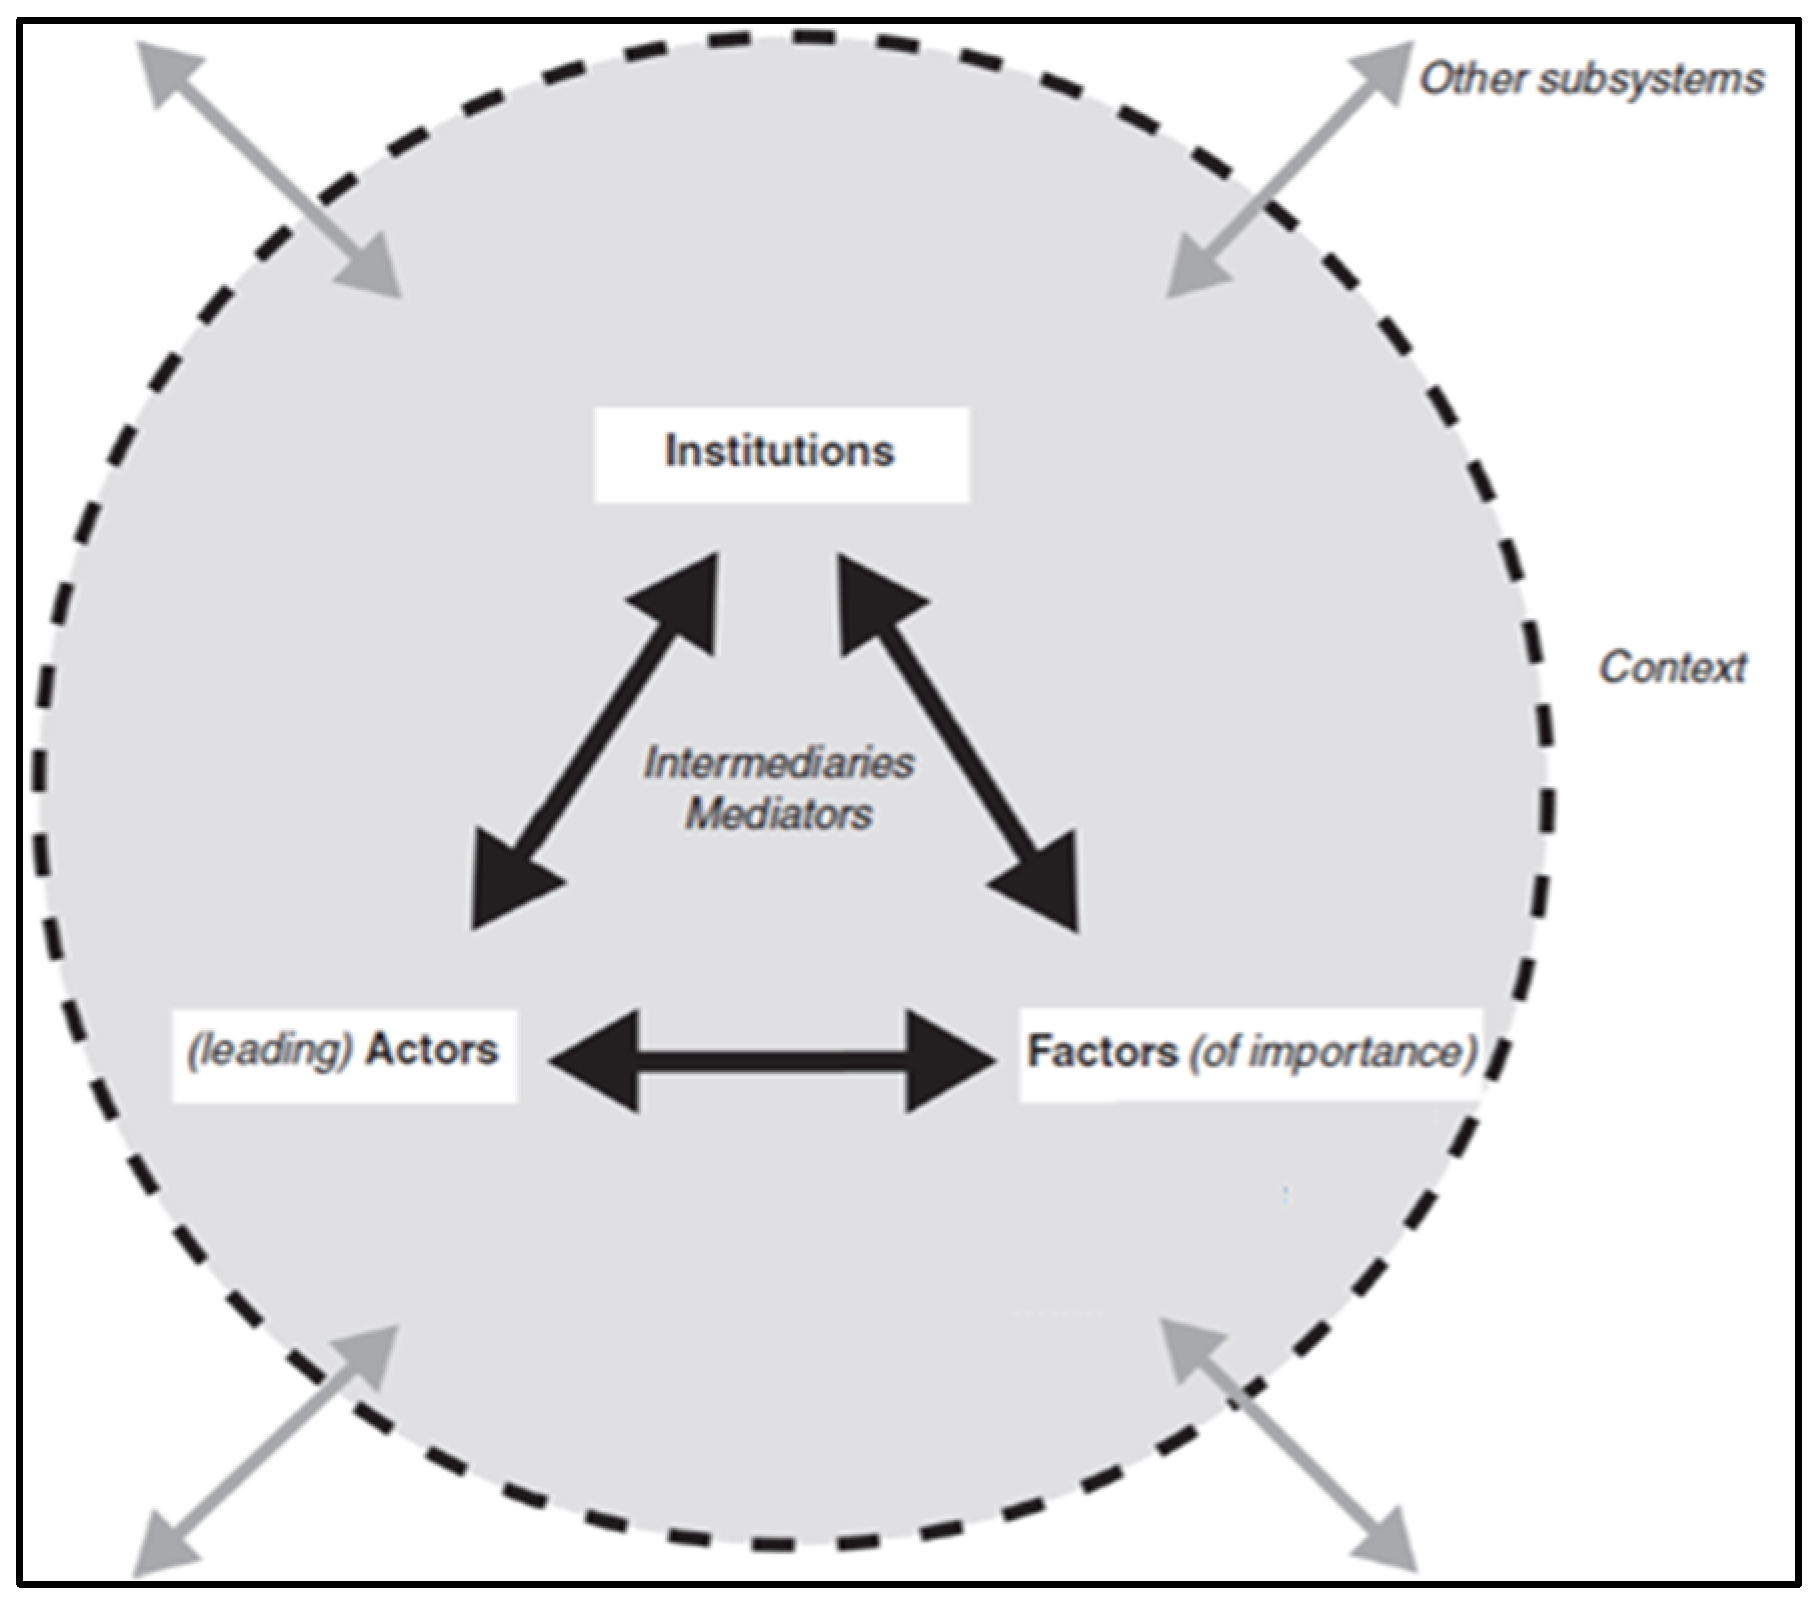
To define the system components, the ARA was used to classify the elements of the drought system into actors, factors, institutions, and intermediaries/mediators (
Figure 2) based on following definitions.
Actors engage in action and typically involve a sender and a receiver. These actors possess unique intentions that may undergo changes or variations depending on the contextual factors. It is also possible for additional actors to enter the context and assume actions or contribute to its development. On the other hand, actors may also leave the system during the process. Hence, the system is seen as a dynamic area [
26,
27].
The context is crucial in understanding the actions of these actors. Some elements or problems urge actors to act, while others constrain them. These elements are referred to as the factors [
26,
27].
Moreover, the consequences of an action, when influenced by various factors, can lead to a mutual agreement among actors to act cooperatively in the future. Such agreements can be viewed as institutions, which encompass the rules of engagement, whether they are formal or informal in nature [
26,
27].
For the system to function effectively, the presence of mediators and intermediaries is crucial in connecting actors, factors, and institutions. Intermediaries facilitate the transfer of information without altering its content. Conversely, mediators mould information in order to bring actors, factors, or institutions together or separate them. These intermediaries/mediators should endeavour to enhance the resilience of the system [
26,
27].
When exploring the complex issue of drought, it is essential to recognise the inherent complexity of the world, which defies complete understanding. Institutions can undergo changes in response to various circumstances (factors) or the influence of actors [
26,
27]. Actors, factors, and institutions mutually shape one another within their respective environments over time and location. Through co-evolution, actions from one component can have indirect effects on another component within the system. This means that there is an interaction between the components themselves, which continuously change and thus influence the system. These influences originate from actions and reactions from components and can therefore have positive or negative outcomes [
26,
27], which implies that co-evolution can tend in a positive way (in a drought system to create more resilience to water scarcity) or in a negative way (worsening the drought issue). This intricate interplay renders a system as a complex and multidisciplinary entity that is perpetually incomplete and unstable [
26]. Consequently, it necessitates continuous reanalysis. Therefore, this approach accommodates the implementation of resilience-building strategies.
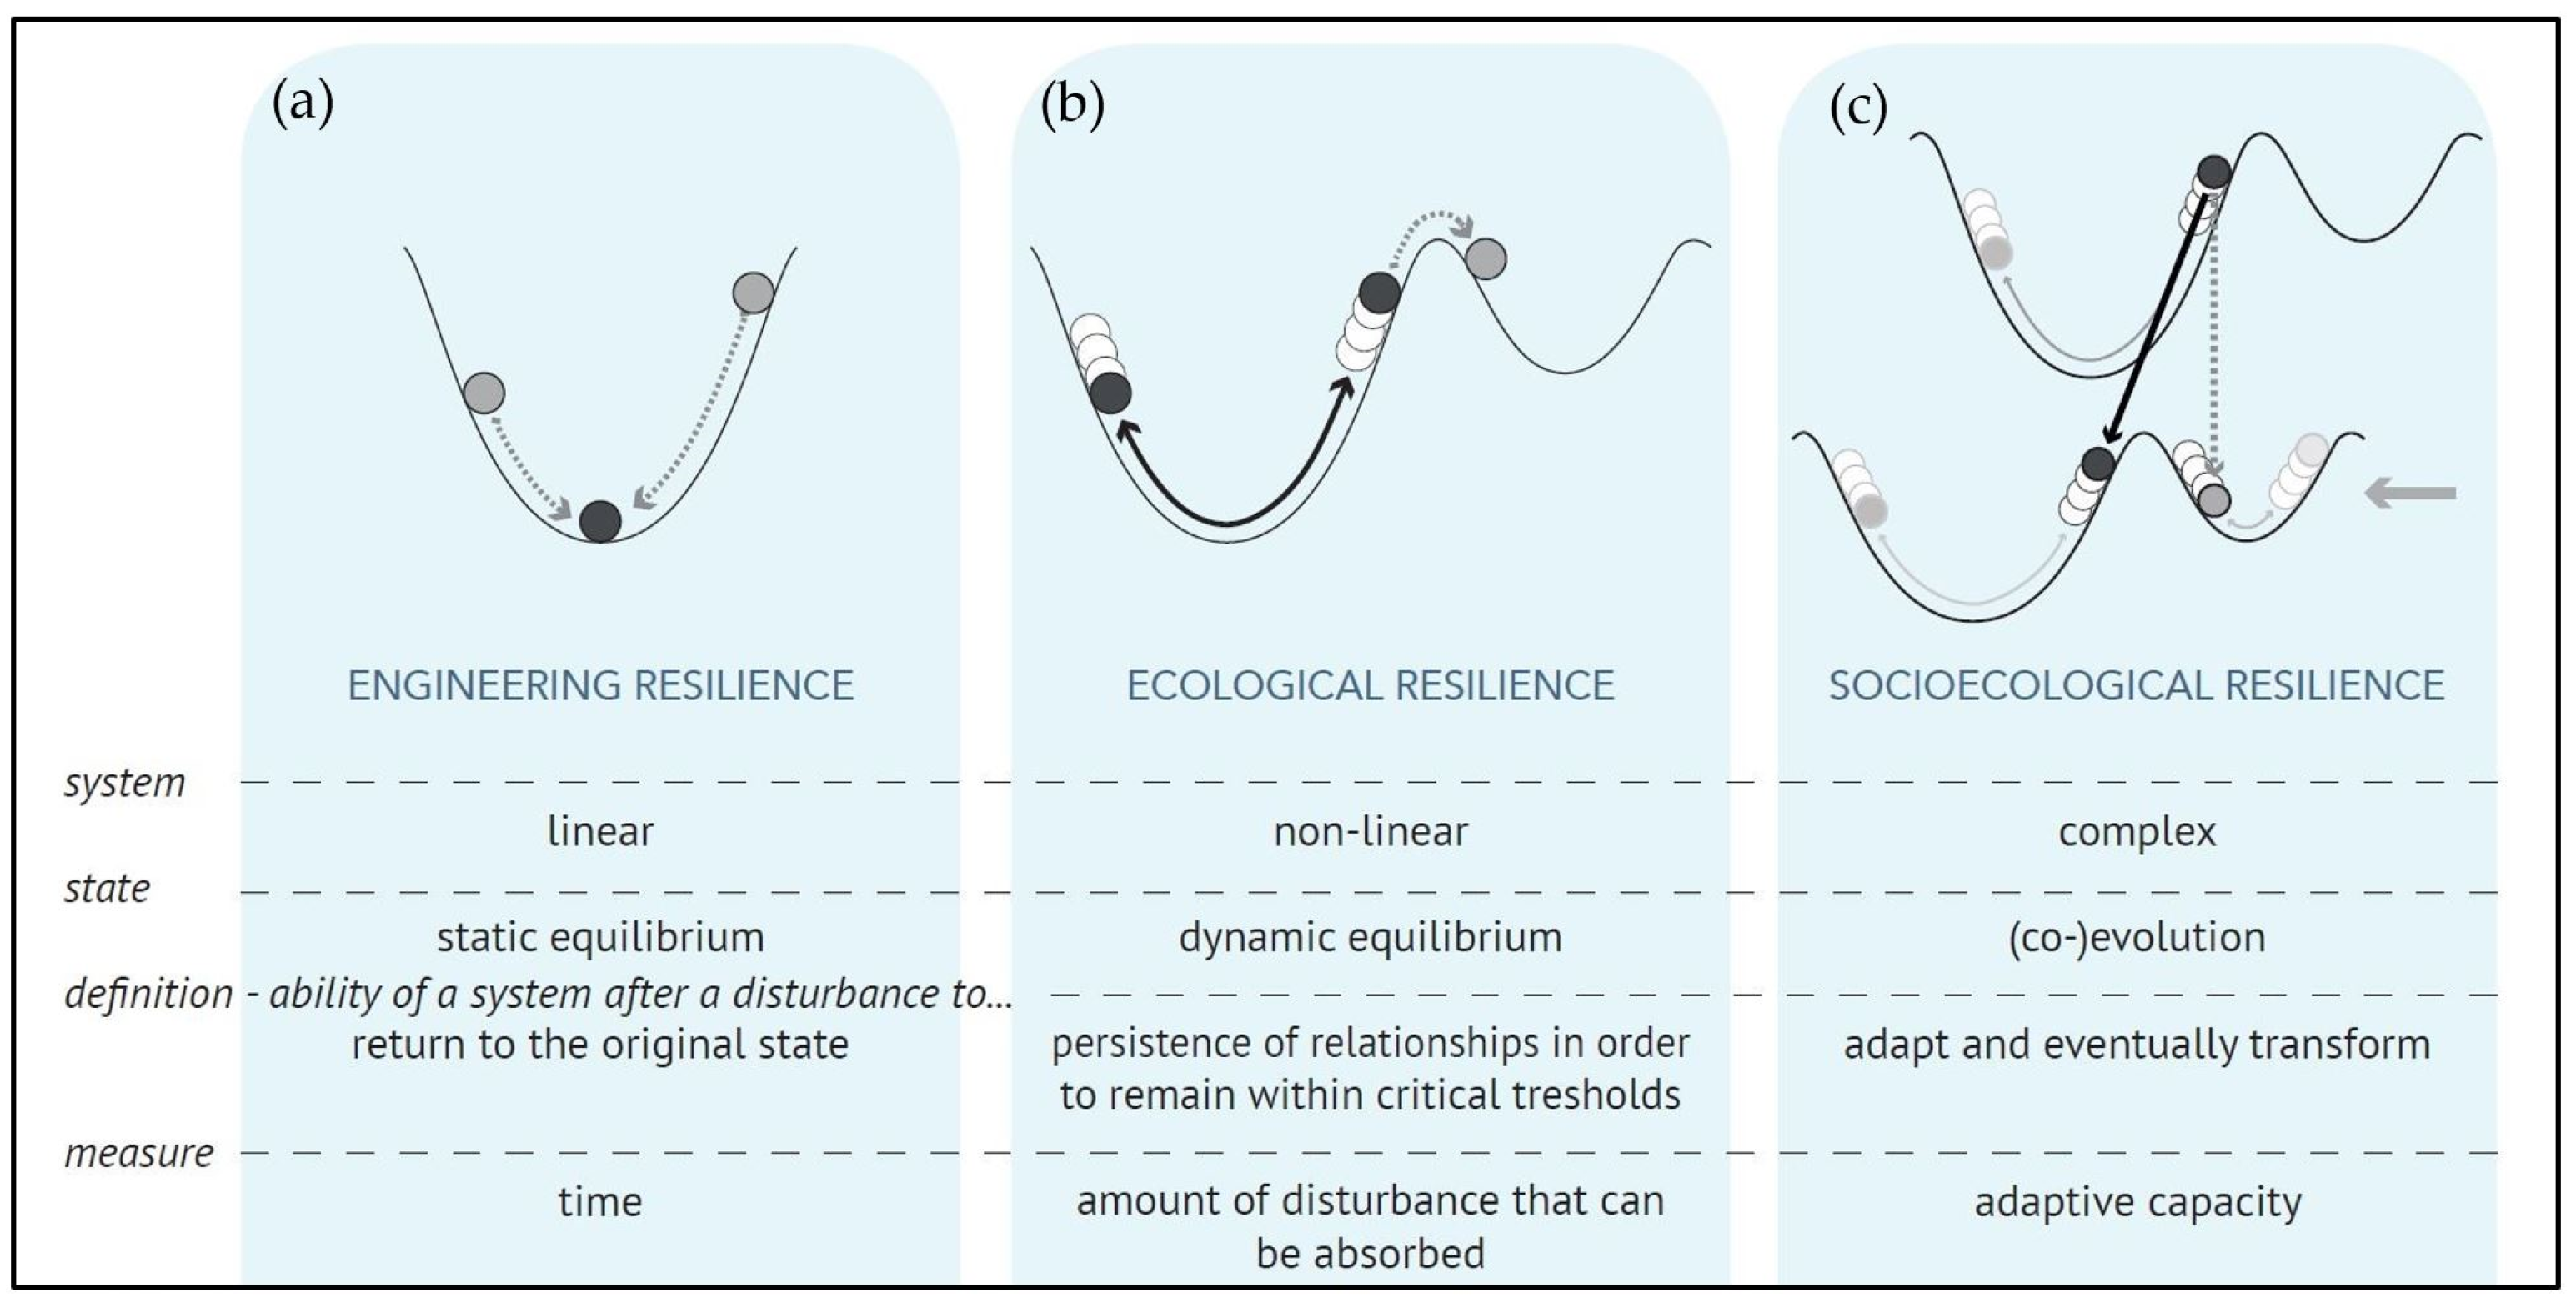
Tempels introduced three different concepts of resilience: engineering resilience, ecological resilience, and socio-ecological resilience [
28]. Engineering resilience (
Figure 3a) is linked to the time needed to stabilise the system back to its original form after a disruption. From this point of view, returning quickly to the original state is considered to be a resilient system [
28,
29]. The ecological interpretation (
Figure 3b) denies the sole existence of one state. Instead, it acknowledges the existence of different states since, after a disturbance, a system can change, and therefore, the state of stability can change as well [
28,
29,
30]. The socio-ecological conceptualization of resilience (
Figure 3c) is based on different systems that can influence each other and the co-evolution between them that causes additional complexity [
28,
31,
32]. It acknowledges the imperfect knowledge of the future and underscores that resilience is not solely defined by the state of the system but also by the relationships among its components, both within and outside the system, leading to instances of bounce back or bounce forward [
8,
28,
33]. This third concept fits to the definition of drought in combination with the ARA since resilience seeks persistence and stability by enabling adaptation and transformation through effective decision making within a co-evolving system.
The ARA facilitates identification and examination of the different elements within the chosen boundary of the drought system. Since actors, factors, institutions, and mediators/intermediaries are interconnected elements, which co-evolve with each other (negative or positive), it remains unpredictable and complex. Assigning the components of ARA to contributing elements of the drought system creates more insights. This can help in building resilience and thus create a more stable system. In this way, the conceptualisation of anthropogenic drought, the ARA, and resilience can be combined to better comprehend the relationships within a drought system. In order to ascertain the constituent elements of this context, a comprehensive analysis is required. Furthermore, throughout the process of data acquisition, it is important to ensure that the level of detail aligns with the appropriate scale of the given context. This initial research, to define the components, must be conducted with expertise in the field of the system. The expert endeavours to include all concerned parties and maintains neutrality to ensure the accuracy and validity of the components.
2.3. Network Analysis
Once the drought system has been defined and the components determined, it is still difficult to distinguish and understand the relationships between the various elements as the information consists merely of a summary of names and connections. Therefore, network analysis tools can be used to visualise the relationships between different actors, factors, institutions, and intermediaries/mediators in the context of drought.
In the present study, the software “Gephi version 0.10.1” was employed to create a visual representation of the interconnectedness of these entities in the form of a network graph. Gephi is an open-source software for the visual analyses of large networks [
34]. It allows an interactive representation to explore and understand graphs and reveal hidden connections. In the Gephi network, the nodes represent the components of the ARA, and the edges stand for the relationships between the nodes. Each attribute of an actor, factor, institution, and intermediary/mediator can be colour-coded for an easier identification and classification. When the network is imported, all nodes are randomly placed in the system. To unravel the system, layouts generated by algorithms are used. By using these layouts, the initial position may have an effect on the result. Therefore, it is important to first perform a rough unravelling using the Fruchterman–Reingold layout [
35,
36]. Then, the ForceAtlas2 layout can be used to distinguish the different communities more easily and effectively [
35]. Once the correct layout is obtained, statistical calculations can be performed on the network. These include degree [
35,
36], betweenness centrality [
37,
38], and eigenvector [
39,
40].
2.3.1. Layouts
The Fruchterman–Reingold algorithm unravels the random network and then applies a strong force-based algorithm to position the nodes in an attraction–repulsion manner, analogous to magnets. This force-directed algorithm simulates physical springs as edges, attracting connected nodes towards each other, while a repulsive force pushes all nodes away from each other, regardless of their connections. This process typically results in edges of similar lengths. Through an iterative process, the algorithm adjusts the node placements to minimise the overall “energy” of the system [
35,
36]. Employing this layout allows to disperse nodes so that the ForceAtlas2 layout can group communities more efficiently.
The subsequent step involves employing the ForceAtlas2 layout to disperse groups and create space around larger nodes. ForceAtlas2 is a force-directed layout algorithm that emulates a physical system to spatialise a network. Nodes repel each other like charged particles, while edges attract their connected nodes akin to springs. These forces generate movement that converges to a balanced state. This final configuration is expected to enhance the interpretability of the data [
36].
It is worth noting that this layout is characterised by positioning each node based on its connections with other nodes. Notably, it does not consider any specific attribute of the nodes, which implies certain limitations. The outcome of the layout can vary depending on the initial state, which is why the Fruchterman–Reingold layout was initially utilised. The position of a node cannot be interpreted in isolation; it must always be compared to other nodes. Despite these limitations, this technique offers the advantage of visually interpreting the network structure. Its fundamental purpose is to transform structural proximities into visual proximities, facilitating network analysis. Noack (2009) demonstrated that these proximities reflect communities, aligning with Newman’s intuitive approach, where entities have more connections within their community than outside, and communities consist of groups with denser connections [
36].
2.3.2. Statistics
Next, the degree of nodes is examined by a numerical variable that indicates the number of edges connected to a specific node. In directed networks, this measure is further divided into two distinct metrics known as in-degree centrality and out-degree centrality. In the context of undirect networks, degree centrality essentially captures the entities’ popularity [
35,
36]. Gephi automatically calculates the degree measure, eliminating the need for statistical calculations. However, the node with the most connections is not always the most important node. To identify the most important node, both betweenness centrality and eigenvector statistics are needed.
The concept of betweenness centrality is closely tied to the notion of the shortest path in a network. A path is defined as a sequence of nodes connected by edges, traversing from one neighbour to another. The shortest path between nodes is identified as the path with the fewest edges, resulting in the minimal number of hops required to navigate between nodes. Consequently, nodes exhibiting a high betweenness value possess the capacity to exert significant influence on the overall connectivity and flow within the network [
37,
38].
The previous measures provide valuable insights into the significance of nodes within the network. However, a limitation of betweenness centrality lies in its failure to account for the importance of neighbouring nodes. This aspect is crucial because connections to highly influential and well-connected individuals carry more weight than connections to isolated individuals. To address this limitation, eigenvector centrality incorporates the significance of neighbouring nodes, thereby providing information about a node’s influence within the network. Essentially, links originating from important and influential nodes hold greater value than links from less significant nodes. As a result, a node with a high eigenvector should be connected to numerous nodes, which in turn are connected to many other nodes, forming an interconnected web of relationships. The calculation of eigenvector centrality often involves random walkers, where nodes that frequently appear in random walks are deemed more important due to their connections to other frequently visited nodes. [
39,
40]
A variant of eigenvector centrality is PageRank, an algorithm utilised by Google to rank web pages in search results. One key distinction is that PageRank is primarily applied to directed networks, whereas eigenvector centrality is applicable to undirected networks. [
40,
41]
2.4. Trends and Status
Once the network model is created, the current status and trends of droughts can be identified based on the insights derived from the network model. The status refers to the historic and current state of the system, while the trends refer to the predicted future [
8]. In this way, the components of the drought system can be monitored. By looking at the components in a broad spectrum, indirect effects and changes in the system become visible and can be analysed, which allows for the determination of specific system components that require attention. This approach also allows for re-evaluation (of the system components) so that positive or negative co-evolution can be determined based on the trends. The results derived from this method can then be used to develop resilience-building strategies.
3. Results
This framework was validated by a case study in Flanders, Belgium, because droughts cause significant stress on the entire water system in the Flemish Region. This stress includes mismatches between the available water quantity and water demand in various sectors as well as impacts on the water quality and ecological systems. Given the diversity of influences, this presents a valuable scenario for testing the theoretical method.
3.1. Defining the System Boundary
In Flanders, there are groundwater and surface water systems, which have different physical boundaries. In this study, the borders of the surface water system, namely flow areas, were chosen since they represent the most elements involving drought. Flow areas are based on hydrological, geomorphological, ecological, and functional characteristics [
42,
43]. Therefore, a flow area is intrinsically linked with the water availability of an area. The groundwater can be added as an input/output for the chosen area, such as other contributing elements.
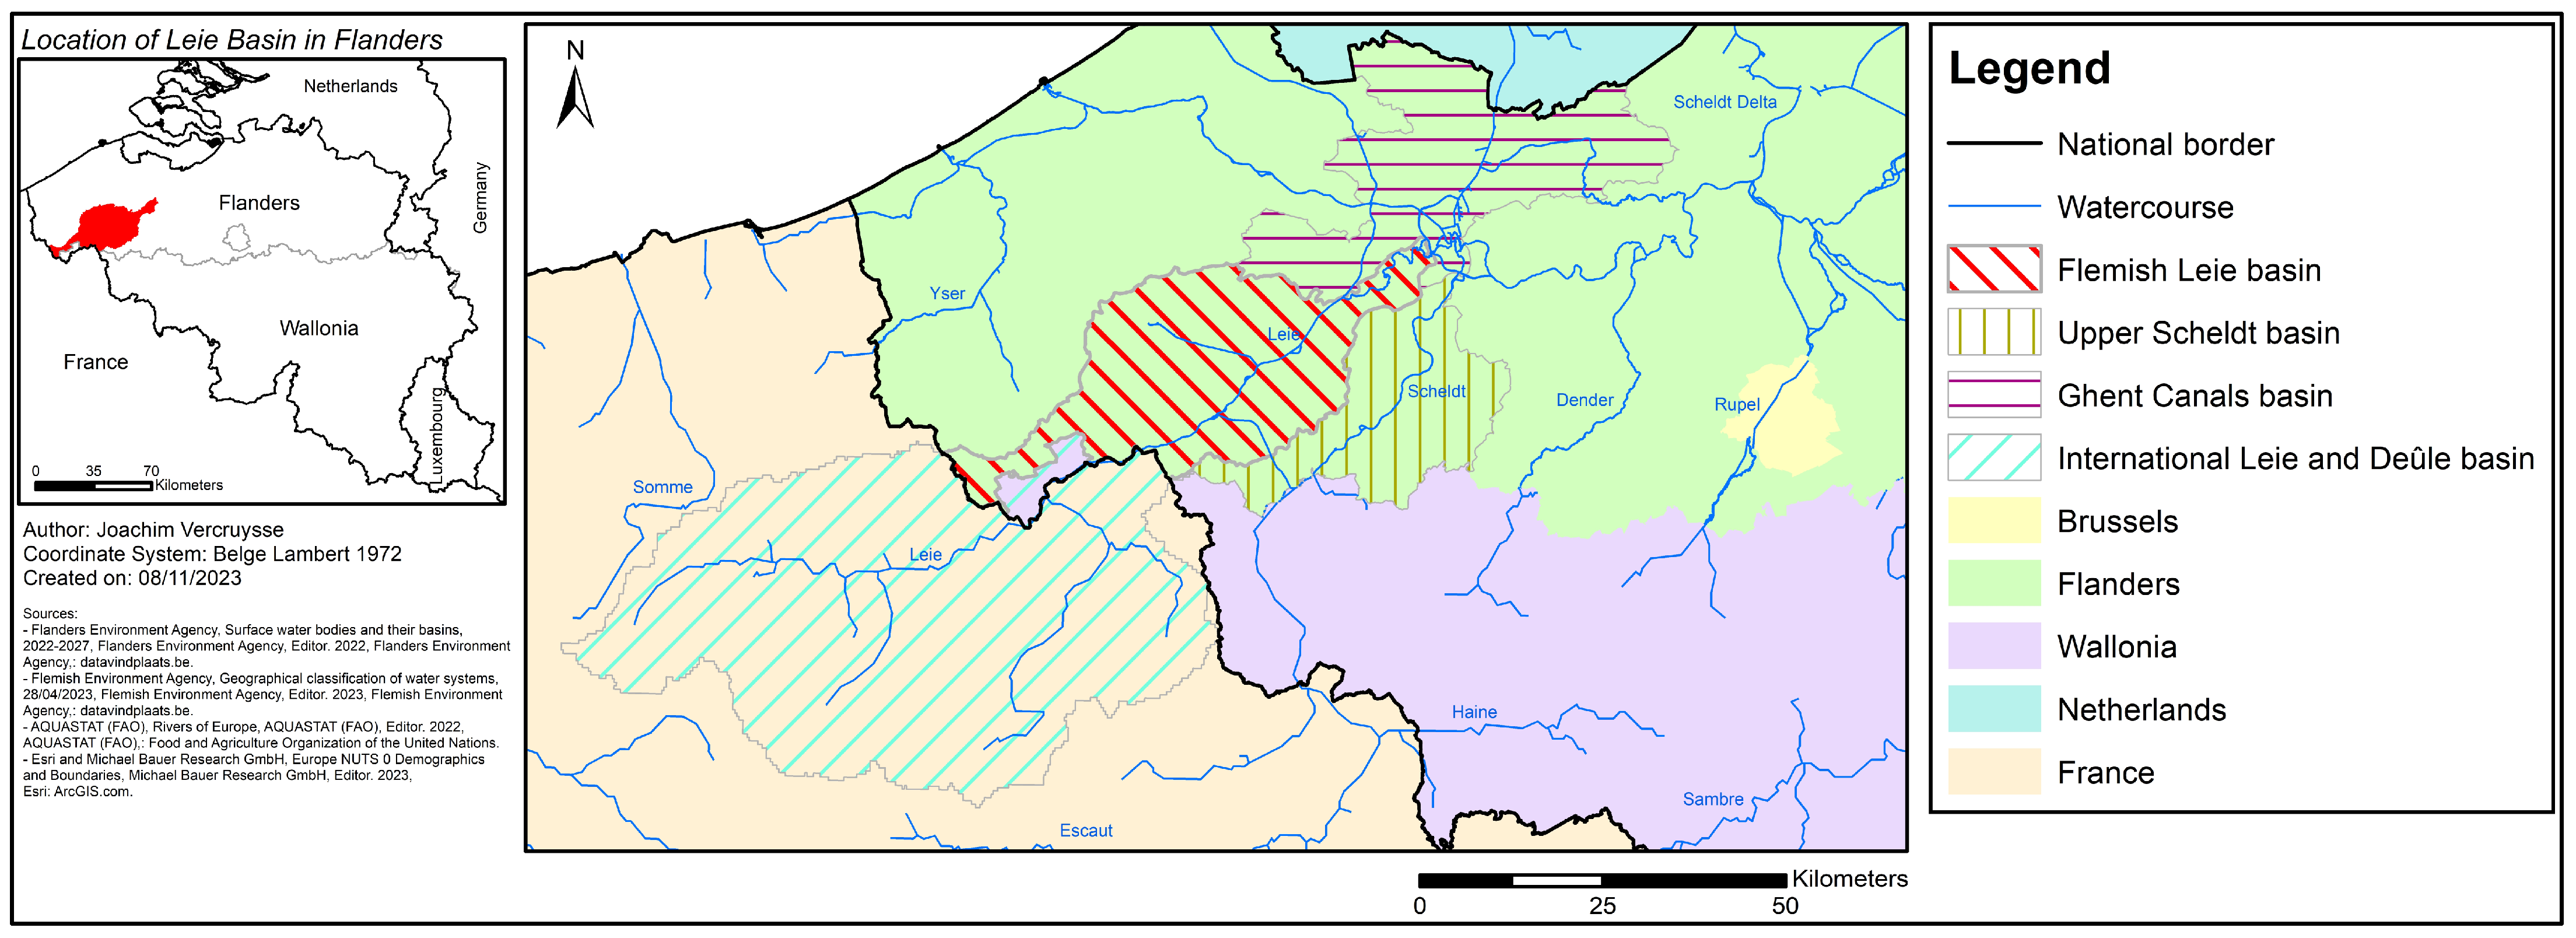
As case study, the Flemish Leie Basin (
Figure 4), which encompasses an area of 982 km
2, was chosen. It is part of the larger international Leie and Deûle Basin, which spans 3886 km
2 and is characterised by the presence of the Leie River as its primary watercourse. Geographically, the Leie Basin is connected with France (south), Wallonia (south-east), and other adjacent basins to the north and east. As a result, the Leie Basin is not a closed system and is influenced by water inflows from beyond its boundaries [
42,
44]. Those influences are seen as a certain input for the system.
The major part of the Leie Basin is located within the province of West Flanders, while the remaining part is situated in East Flanders. The basin also overlaps with the territory of 38 municipalities [
44].
3.2. Defining the System Components
Defining system components was primarily conducted through extensive desktop research, encompassing the analyses of databases, maps, governmental portals, official monitoring data, laws, measures, and other data sources readily available as open-source data.
3.2.1. Actors
At the scale of the basin, the primary actors associated with the ARA and their influence on drought were identified as belonging to the following categories: agriculture, households, industry (the energy sector and other industries), trades and services, and various levels of government [
44]. As expected, water managers, users, and consumers all play pivotal roles in shaping the water system and, consequently, impacting drought. However, when examining smaller scales, such as local communities, it becomes necessary to further disaggregate these actors, for instance, the actor “government” is closely intertwined with the ARA pillar “institution”, allowing it to exert substantial influence and drive significant changes.
The Leie Basin is characterised by the prominent presence of the agricultural sector, occupying approximately 55% (545 km
2) of the total basin area, which exceeds the average of other basins. The majority of agriculture in the Leie Basin consists of field and horticulture practices (43%) and livestock grazing (24%). It is important to note that the agricultural sector contributes significantly to the elevated levels of nutrients (such as nitrogen and phosphorus) and pesticides found in watercourses. Additionally, the agricultural sector represents a substantial water consumer within the basin, and during prolonged dry periods, water demand surpasses the available supply [
44].
In terms of residential aspects, the Leie Basin exhibits a relatively high population density, with 550 inhabitants per km
2. The central region of the basin hosts the highest concentration of population, while the outlying areas feature scattered residential centres with lower population densities. Households occupy approximately 14% of the basin area, which exceeds the average for other basins [
44].
The Leie Basin is characterised by diverse industrial activities dispersed across the area. The largest industrial clusters are situated near densely populated areas along the Leie River or the Roeselare-Leie Canal. The total area designated for industrial activities amounts to 140 km
2, accounting for 14% of the basin area. This percentage is considered average compared to other basins. Similarly, the number of enterprises operating within the Leie Basin is relatively average, with the predominant presence of the trade and services sub-sector [
44].
At the governmental level, the management of the basin involves various entities, including the basin board, basin council, basin secretariat, and additional thematic and area-based consultations [
44,
48].
The basin board serves as the coordinating body for water policy at the basin level and makes governance decisions. It comprises representatives from relevant Flemish policy areas as well as local administrations such as provinces, municipalities, polders, and water boards. The governors of the provinces of West Flanders and East Flanders hold the role of chairmen or co-chairmen of the basin council for the Leie Basin [
44,
48].
The basin council functions as the advisory body for the basin, representing social interest groups and sectors involved in water policy. It is responsible for engaging in consultations with civil society at the basin level. The day-to-day operations within the basin and the preparatory work for the basin board are handled by the basin secretariat. This includes organising meetings of the basin board and basin council as well as area-based and thematic consultations [
44,
48].
During area-oriented and thematic consultations, all water managers are officially represented. These consultations involve the preparation of documents for the basin board and basin council, discussing challenges, and if necessary, forwarding them to the basin board. The basin secretariat plays a crucial role in bringing together all stakeholders in specific areas within the basin to coordinate efforts based on a shared vision, aiming for long-term improvements [
44].
Within the basin authority, various actors have specific responsibilities. For example, the management of navigable watercourses, major streams, and rivers belongs to the jurisdiction of the Flemish Waterway. Unnavigable watercourses are managed differently based on their category. The Flemish Environment Agency oversees the management of first-category unnavigable watercourses, while the provinces are responsible for those in the second-category, and the municipalities handle the third-category. The polders and waterways manage the second- and third-category unnavigable watercourses within their respective operational areas. Additionally, the basin includes canals, which may be managed by municipalities, polders, waterings, or the Roads and Traffic Agency for ditches along regional roads [
44].
Groundwater management, considering both quality and quantity, is under the purview of the Flemish Environment Agency (VMM). Surface water quality management in Flanders is divided among several agencies, including the VMM, Nv Aquafin, and the municipalities. The VMM conducts measurements, inventories, modelling, and reporting on surface water and water–soil quality as well as monitoring drinking water supply, water treatment, and providing advice for environmental permit applications and wastewater discharges to municipalities through water testing [
44].
Aquafin is responsible for designing, constructing, and operating the supra-municipal water treatment infrastructure. Municipalities are tasked with the development and management of the municipal sewerage system. Water companies and sewerage authorities are responsible for the collection, transport, and treatment of wastewater [
44].
In addition to consultative organisations at the Flemish level, collaborations with Walloon actors are also established in the Leie Basin. These collaborations focus on the exchange of information and experiences related to integrated water management and water policy [
44].
3.2.2. Factors
Considerable research has been undertaken to investigate the intricate interplay and influences of various factors contributing to drought. These studies are valuable for the identification of key factors potentially contributing to the occurrence and severity of droughts. Notable factors in the Leie Basin include the following:
Weather conditions, soil conditions, and the topography of a region, which influence precipitation levels, distribution patterns, and the flow of both surface and groundwater [
49,
50,
51,
52,
53,
54,
55,
56,
57];
Climate change, which leads to more frequent and severe droughts as a result of alterations in precipitation patterns, elevated temperatures, and increased rates of evapotranspiration [
4,
12,
18,
50,
51,
52,
58];
Water quality and quantity, exerting an influence on the availability and suitability of water resources for various purposes [
4,
12,
49,
50,
51,
52,
53,
54];
Changes in land cover, encompassing urbanisation or deforestation, which can disturb the water balance within an area [
4,
12,
21,
52,
59];
Infrastructure, including roads, sewer systems, irrigation systems, and watercourses, impacting water availability and distribution [
4,
12,
21,
52,
59];
Socioeconomic factors, such as political choices, which can affect the vulnerability of communities and their capacity to cope with the impacts of drought [
4,
12,
21,
52,
60];
Population growth, exerting pressure on available water resources [
4,
12,
21,
52,
59].
These factors emphasise the intricate and multidimensional nature of drought in the study area. Their relative significance may vary depending on the specific context and location of the drought. Therefore, comprehending these contextual factors is of the utmost importance for effective drought management.
3.2.3. Institutions
The existing legislation primarily focuses on mitigating damage caused by floods since the establishment of comprehensive drought policies is still undergoing a transition. In the Flemish Region, actions and regulations pertaining to drought are predominantly reactive and implemented on an ad hoc basis, typically limited to periods of drought stress. Structural and preventive measures are scarce and inadequate.
An active policy in the study area is the Integral Water Policy Decree of 18 July 2003, which transposes the European Water Framework Directive (2000) and the Floods Directive (2007) into Flemish legislation [
43,
61]. It categorises water systems based on hydrological, geomorphological, ecological, and functional characteristics. This approach is logical and appropriate for addressing flood risks but results in overlapping authorities among different government levels. Consequently, the Flemish Government has established a comprehensive policy vision for integrated water management to effectively coordinate and organise water-related policies. This vision is outlined in the water policy note and offers guidance for the development of flow area management plans. These plans address issues that may lead to the deterioration of the water system or hinder its enhancement and recovery [
43,
61,
62]. Besides the institutions already mentioned, additional legislation and regulations are also in place to regulate water consumption and usage.
The following institutional regimes are currently included in the analysis: Leie Basin management plans, the Water Policy Note, flow area management plans, zoning plans, investments programmes for drinking water managers, investments programmes for water treatment plants, area-based and thematic consultations, area-specific measures, Integral Water Policy, enforcement decision “Watertoets”, Code of Good Practices, Well Water Action Plan, Water Scan—agreements between drinking water companies and the government, LAC decree, management agreement with NV Aquafin, Decision of the Flemish Government Tariff Regulation, Ministerial Decree Tariff Regulation, Eel Regulation ((EC) No 1100/2007), Habitat Directive (92/43/EEC), Benelux Decision on Fish Migration (M (2009) 1), general water sales regulations, Act on the Protection of Surface Waters from Pollution, rainwater ordinance, VLAREM, technical regulations for indoor installations, Swimming Water Directive, Decree on Environmental Quality Standards, Flemish Government decree reporting on remediation obligations, Flemish Government decree on discharge of industrial waste water to sewage treatment plant, Flemish Government decree on operating subsidies for operators of public water distribution networks, transmittal letter on the use of the municipal sanitation contribution and fee, transmittal letter on the scope of the municipal remediation fee, decree containing general provisions on environmental policy, technical regulations on water intended for human consumption, PRTR Protocol, Advices WaterRegulator, Flemish Government decision on unnavigable watercourses, Flemish Government decree on the regulation of the quality and supply of water intended for human consumption, drought measurements, groundwater extraction legislation, and the Blue Deal [
63].
The analysis of this list reveals that several legislations primarily focus on flood prevention or water usage for humans, making them outdated in terms of addressing the challenges related to drought. Although drought measures were added more recently, they are implemented as non-enforced and reactive measures, which is an important consideration when starting the transition towards a robust and resilient drought policy.
3.2.4. Intermediaries/Mediators
Intermediaries and mediators play a crucial role in bridging the various pillars of the ARA. They encompass various research institutions, universities, social media, reports on measurements, and predictions, as providing online portals with climate forecasts and scenarios.
In the region of Flanders, a substantial number of intermediaries and mediators actively engage in monitoring and reporting on environmental factors such as rainfall, groundwater levels, surface water levels, and temperature at diverse locations. These environmental parameters are continuously observed and readily available through online platforms. For instance, “Waterinfo.be” and “datavindplaats.be” offer a wide range of reports and time series data, overviewing various monitoring activities. The raw data are analysed and disseminated by research institutions such as the Flemish Environment Agency (VMM) and the Hydrologic Information Centre (HIC) through status reports, annual reports, flood-storm and drought reports, tide tables, etc., for the entire Flemish Region.
Every six years, a flow area management plan is made available for each basin, which describes the global steps to be taken to evolve to sustainable water management.
Furthermore, in 2021, the intermediary “reactive assessment framework” was developed to advise the provincial governor in taking the appropriate actions to prevent water scarcity [
52,
64]. However, this framework offers only limited insights into future trends. Consequently, the reactive nature of this tool (as the name suggests) does not promote long-term, resilient solutions for addressing water scarcity and remains constrained in its effectiveness.
Additionally, in 2023, the VMM conducted research on tools that assess the impact of various natural disasters and enable users to visualise the potential evolution of drought problems [
65]. This research aims to foster a shift towards resilient water management practices. However, it is important to note that these tools primarily focus on natural causes, paying limited attention to the impact of human actors. Consequently, while the tools propose actions that actors can undertake to improve the situation, they do not provide a comprehensive feedback of all causes.
Flanders’s extensive monitoring and its production of numerous reports generate valuable information. Yet, the key challenge lies in applying this knowledge within the existing legislative framework, with the focus on long-term resilience measures.
3.3. Network Analysis
Translation of the ARA results in the Gephi software resulted in a total of 142 nodes (or ARA components) and 1575 edges (or relations) for the Leie Basin. During this analysis, the labels of the nodes are not visualised since this would deteriorate the visuals. As an example, for nodes and edges, consider two nodes representing the entities “agriculture” and “groundwater”. The edge between them signifies the relationship, as agriculture utilises groundwater for crop irrigation. However, if the groundwater level drops too low, it can impact the water availability for irrigation, consequently affecting agriculture.
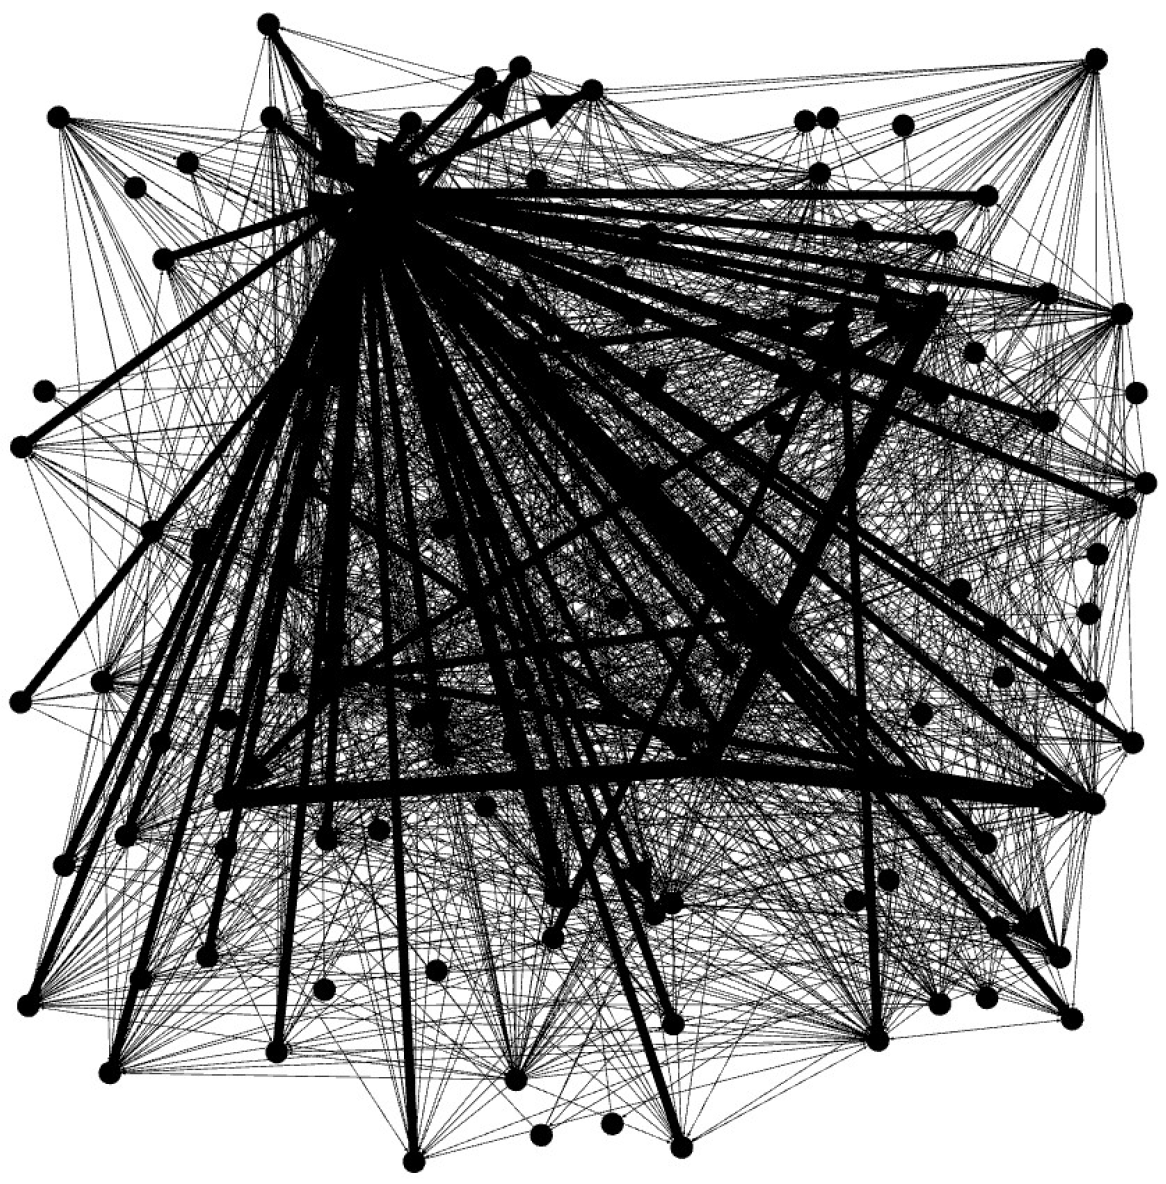
The software allows for different layouts, but importing the nodes and edges for the first time results in a random layout (
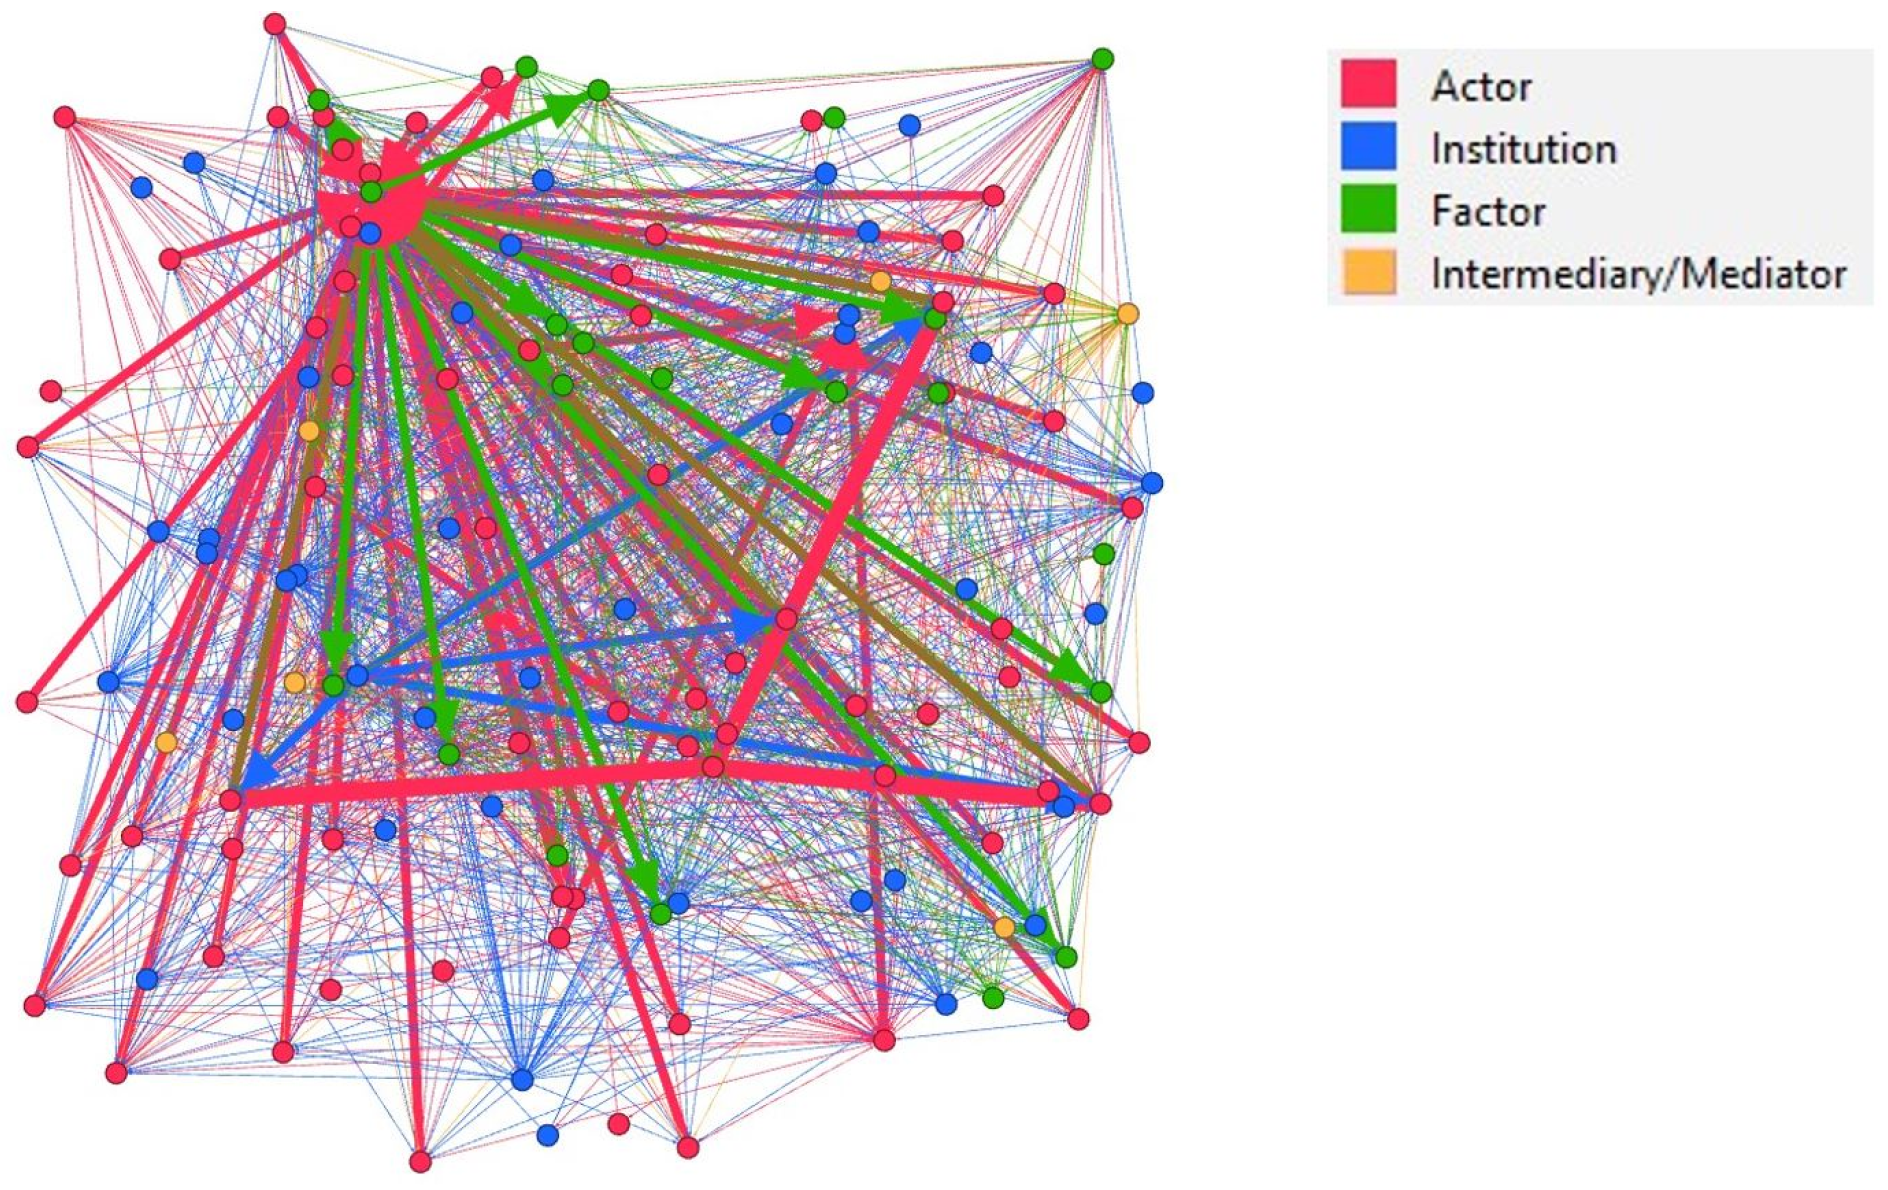
Figure 5). Colouring is helpful to recognise the different classes (
Figure 6): red refers to the actors, institutions are in blue, factors are green, and intermediaries/mediators are orange.
3.3.1. Layouts
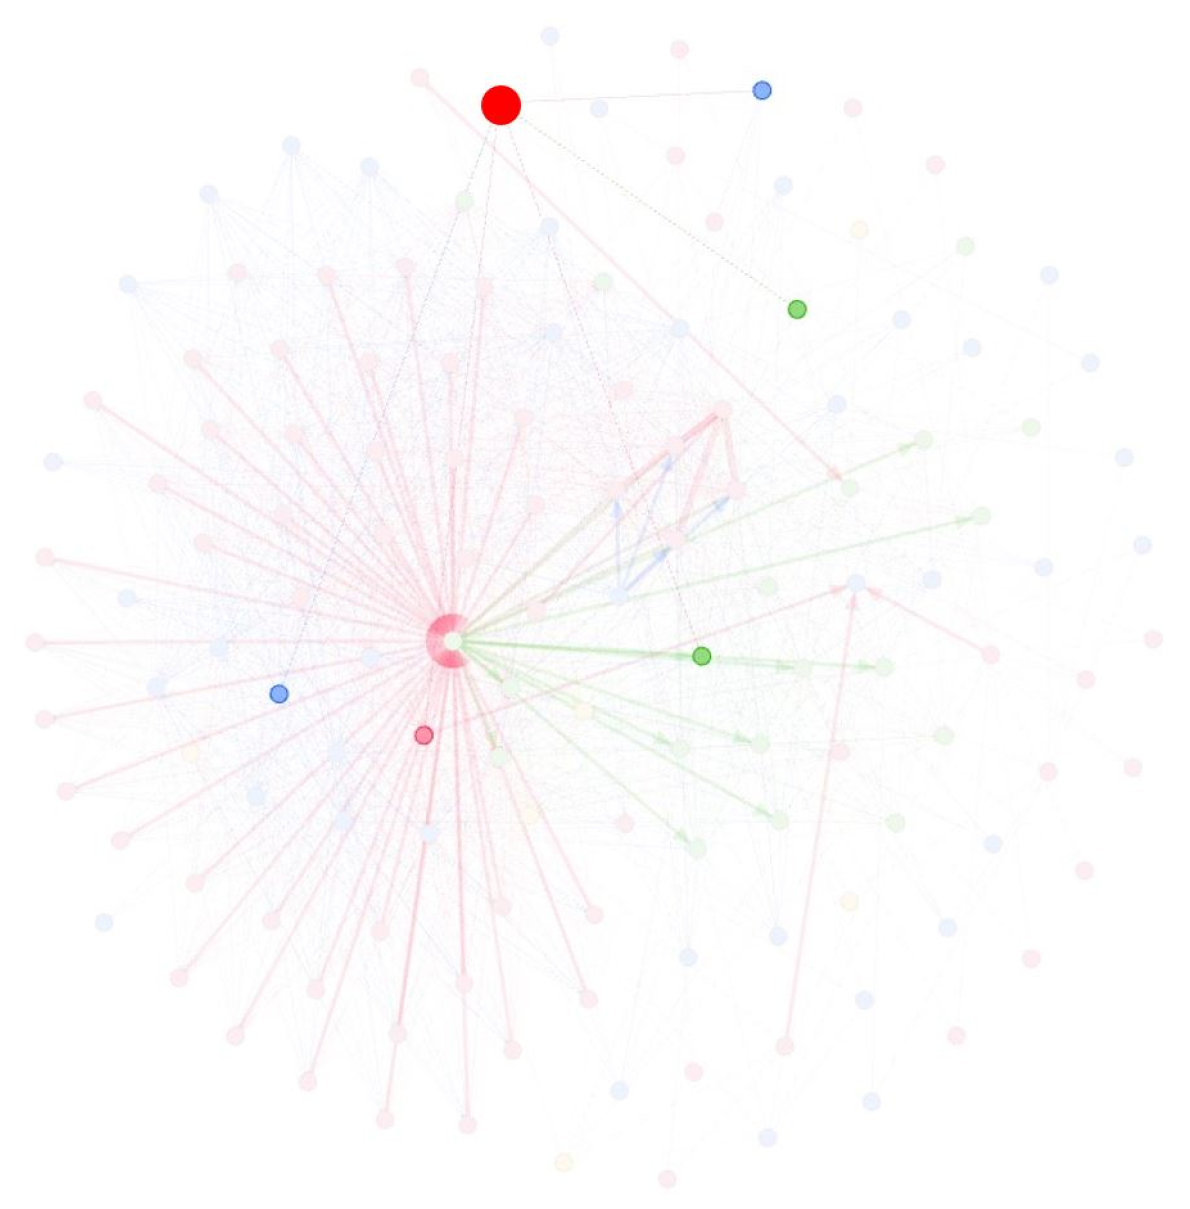
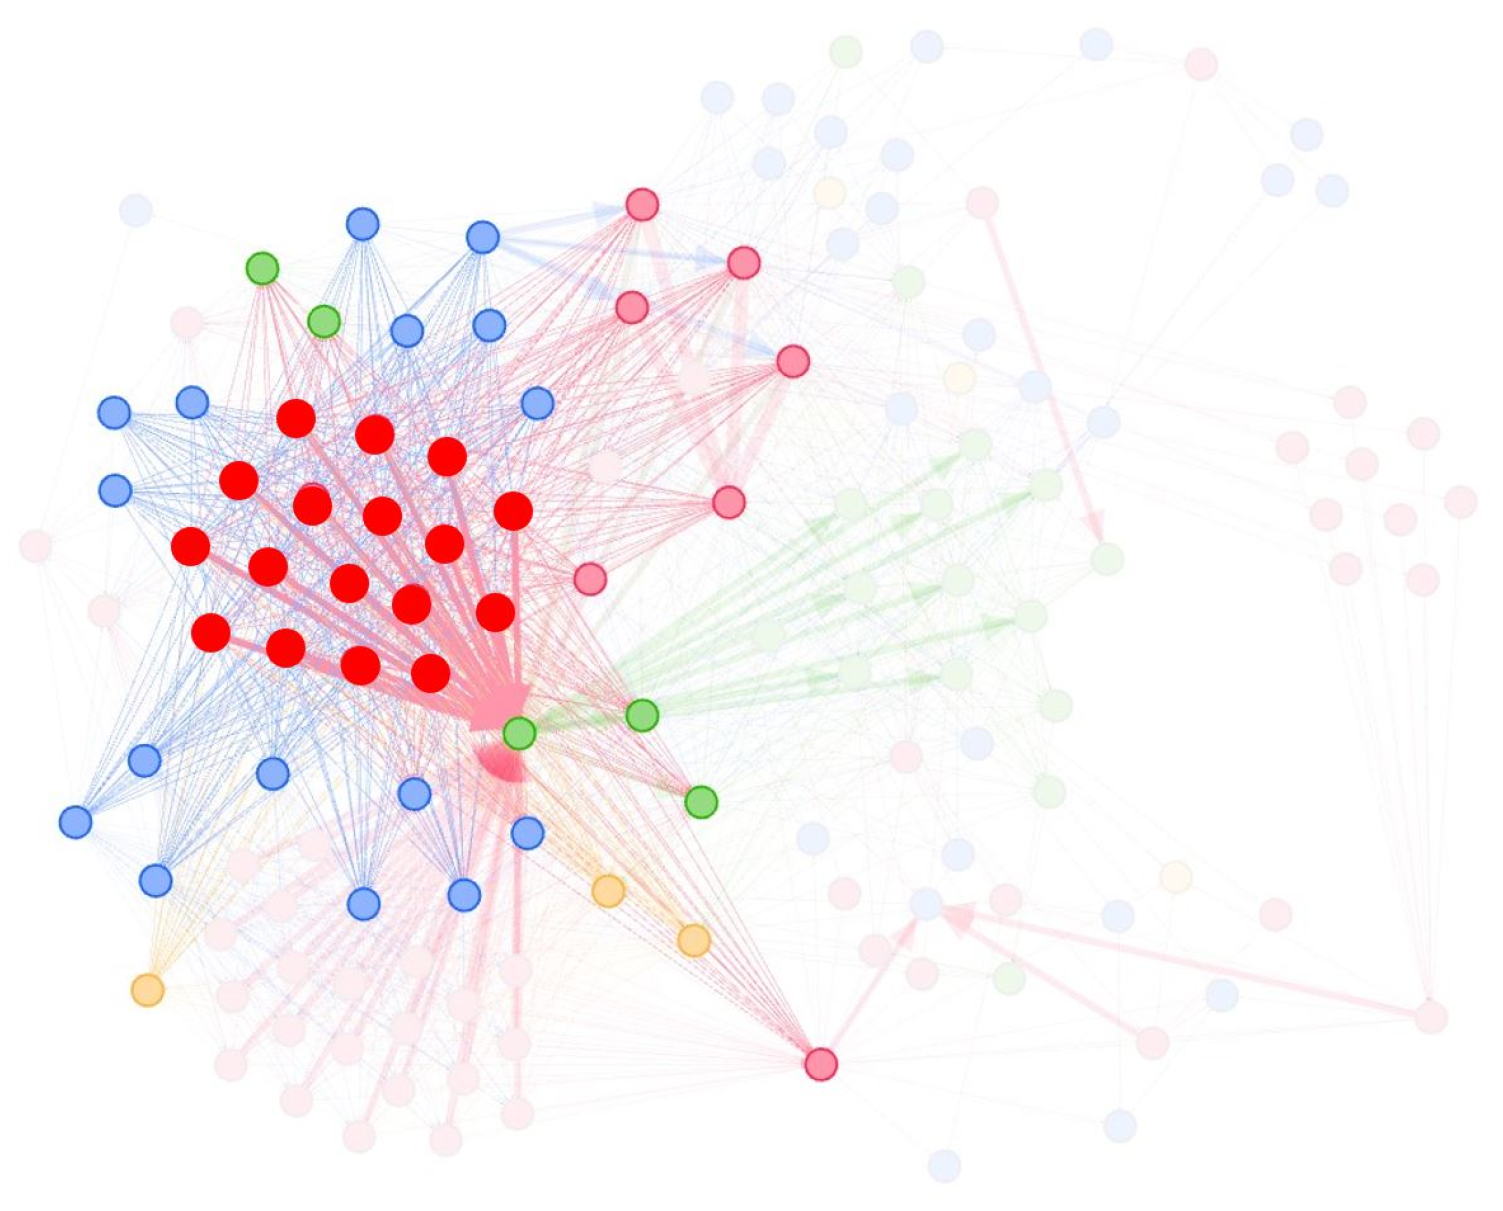
Figure 7 shows the results for the case study. In the case of the Leie Basin, the nodes are evenly distributed, but distinct groups can be recognised based on their connections. Moving from the external region at the top towards the centre, one can observe a hierarchy of actors, with higher-level actors making global decisions and lower-level actors, particularly municipalities, forming more precise connections. This visual representation of the graph demonstrates that the basin council (
Figure 8) and the province (
Figure 9) are positioned at the periphery of the system, while a municipality (
Figure 10) resides within, exhibiting a greater number of nodes due to its local-level importance.
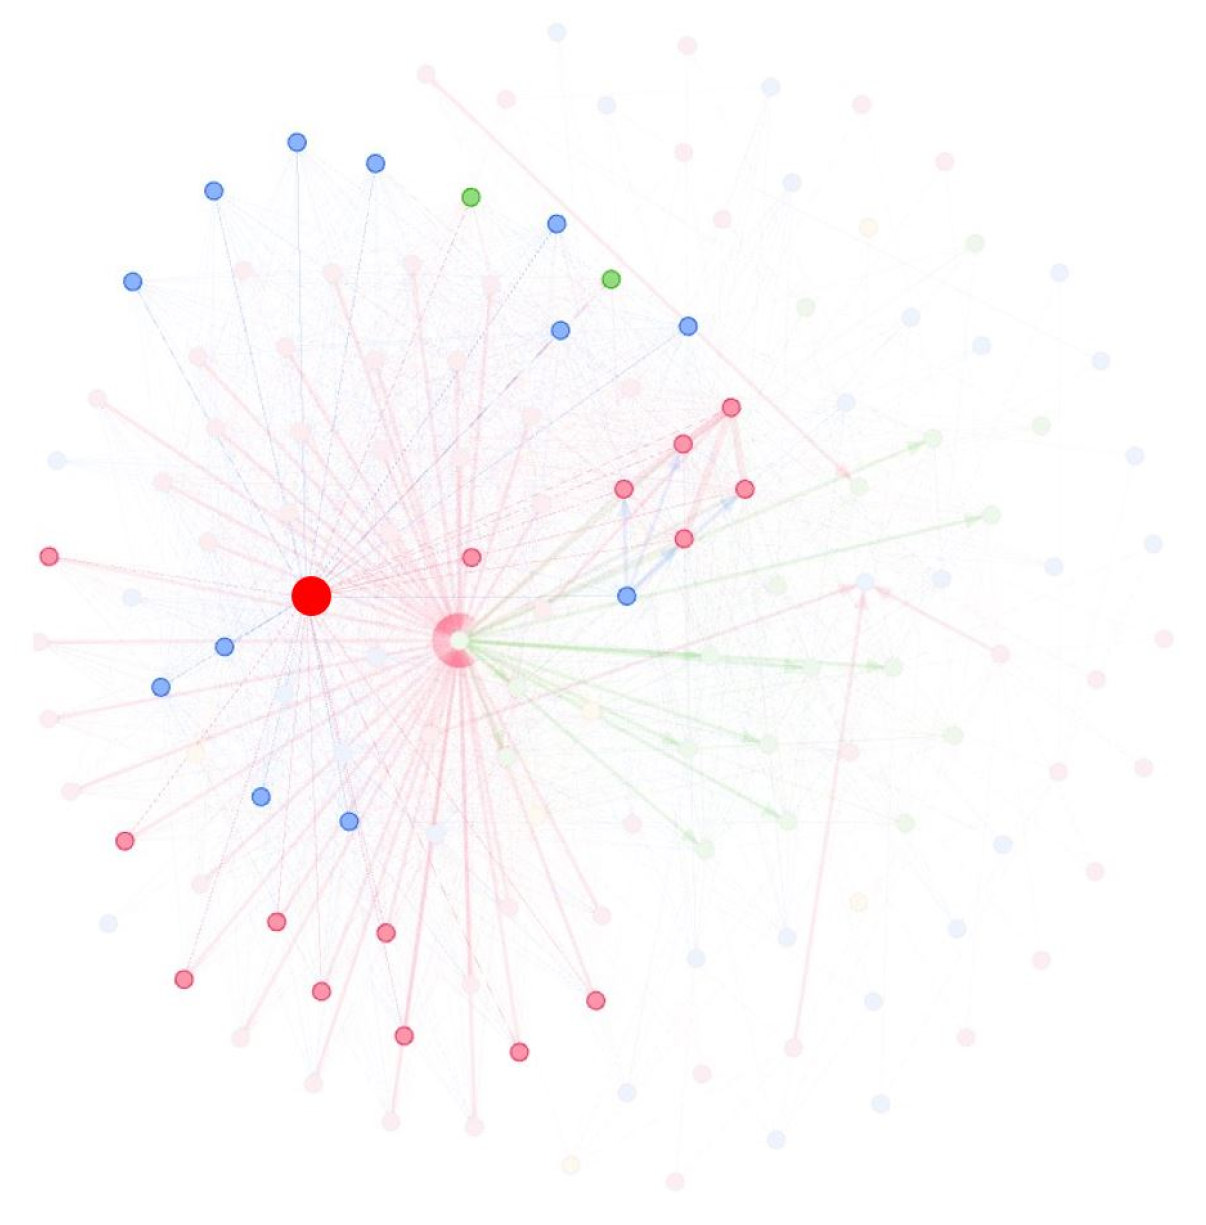
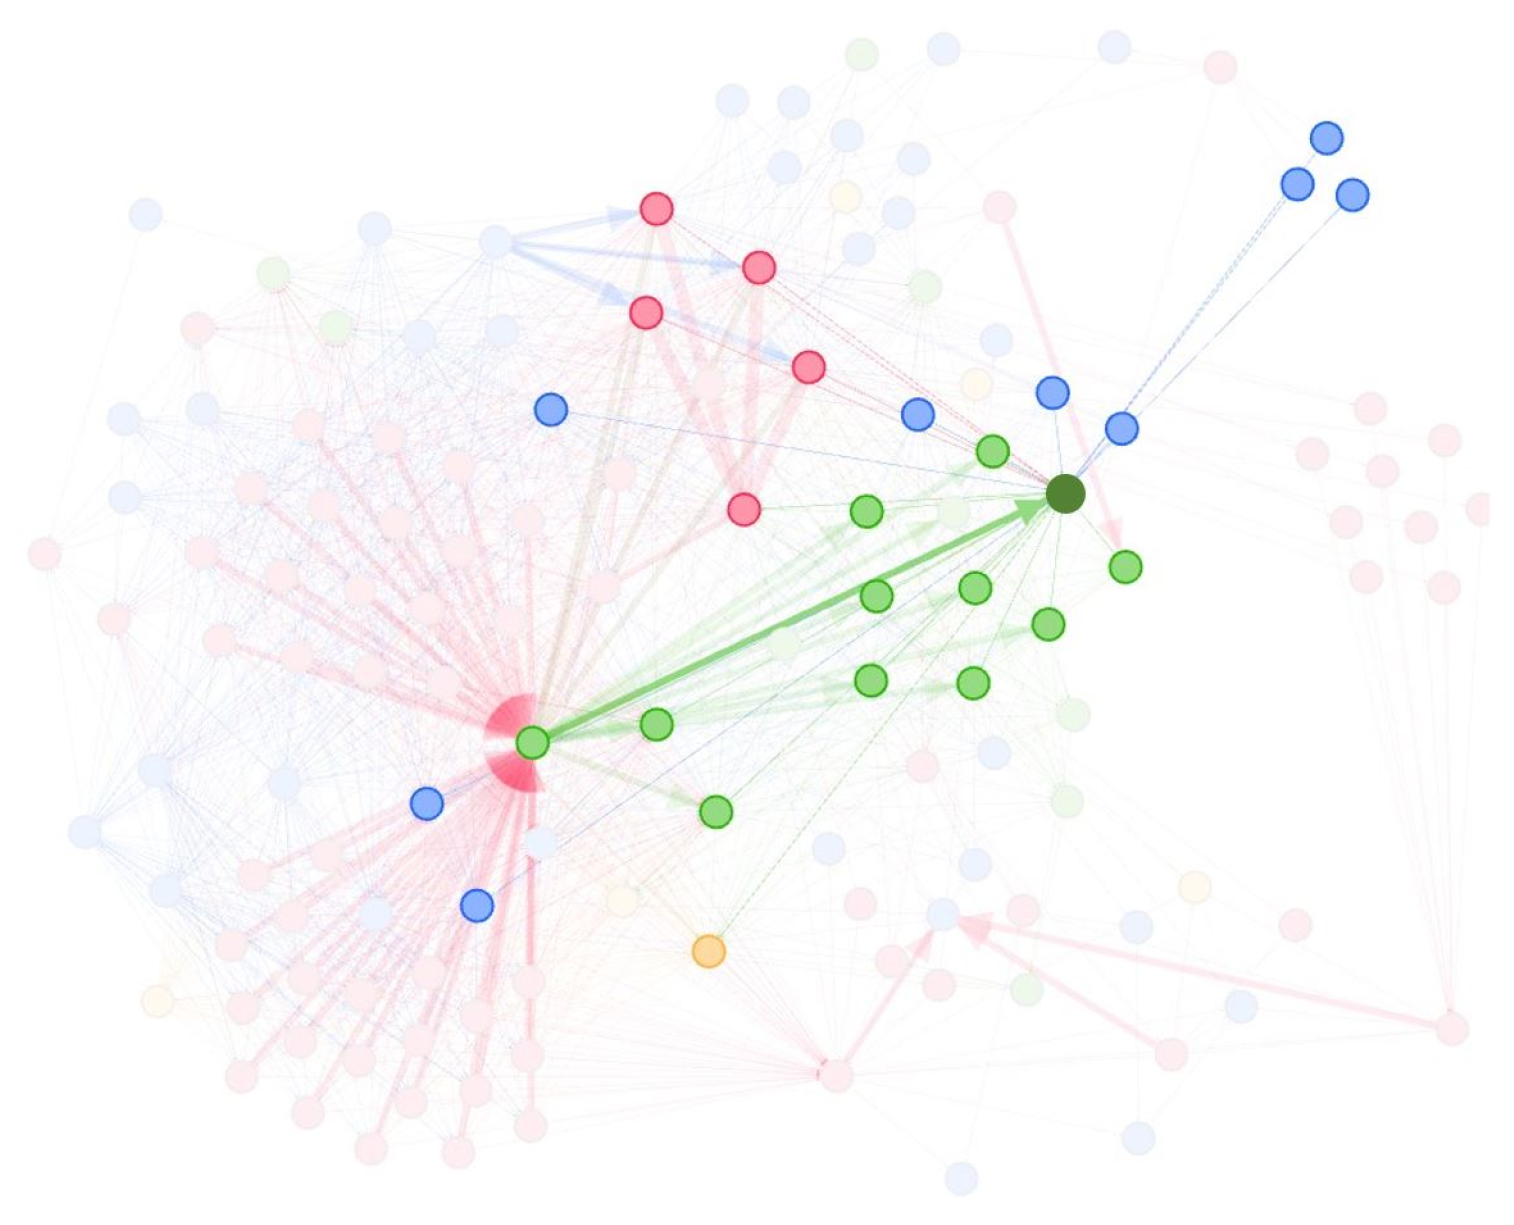
The implementation of the ForceAtlas2 layout is visualised in
Figure 11. When focusing on the nodes representing actors from the basin organisation (basin board, council, and secretariat), it becomes evident that most actors are directly or indirectly represented within this organisation, as illustrated in
Figure 12. The layout also provides a clear visualisation of which municipalities serve as sewer managers (
Figure 13) and which do not (
Figure 14). Acting as a sewer manager entails additional responsibilities, resulting in more connections with legislation and major sectors. Institutions are applicable to both categories, positioning them between the two.
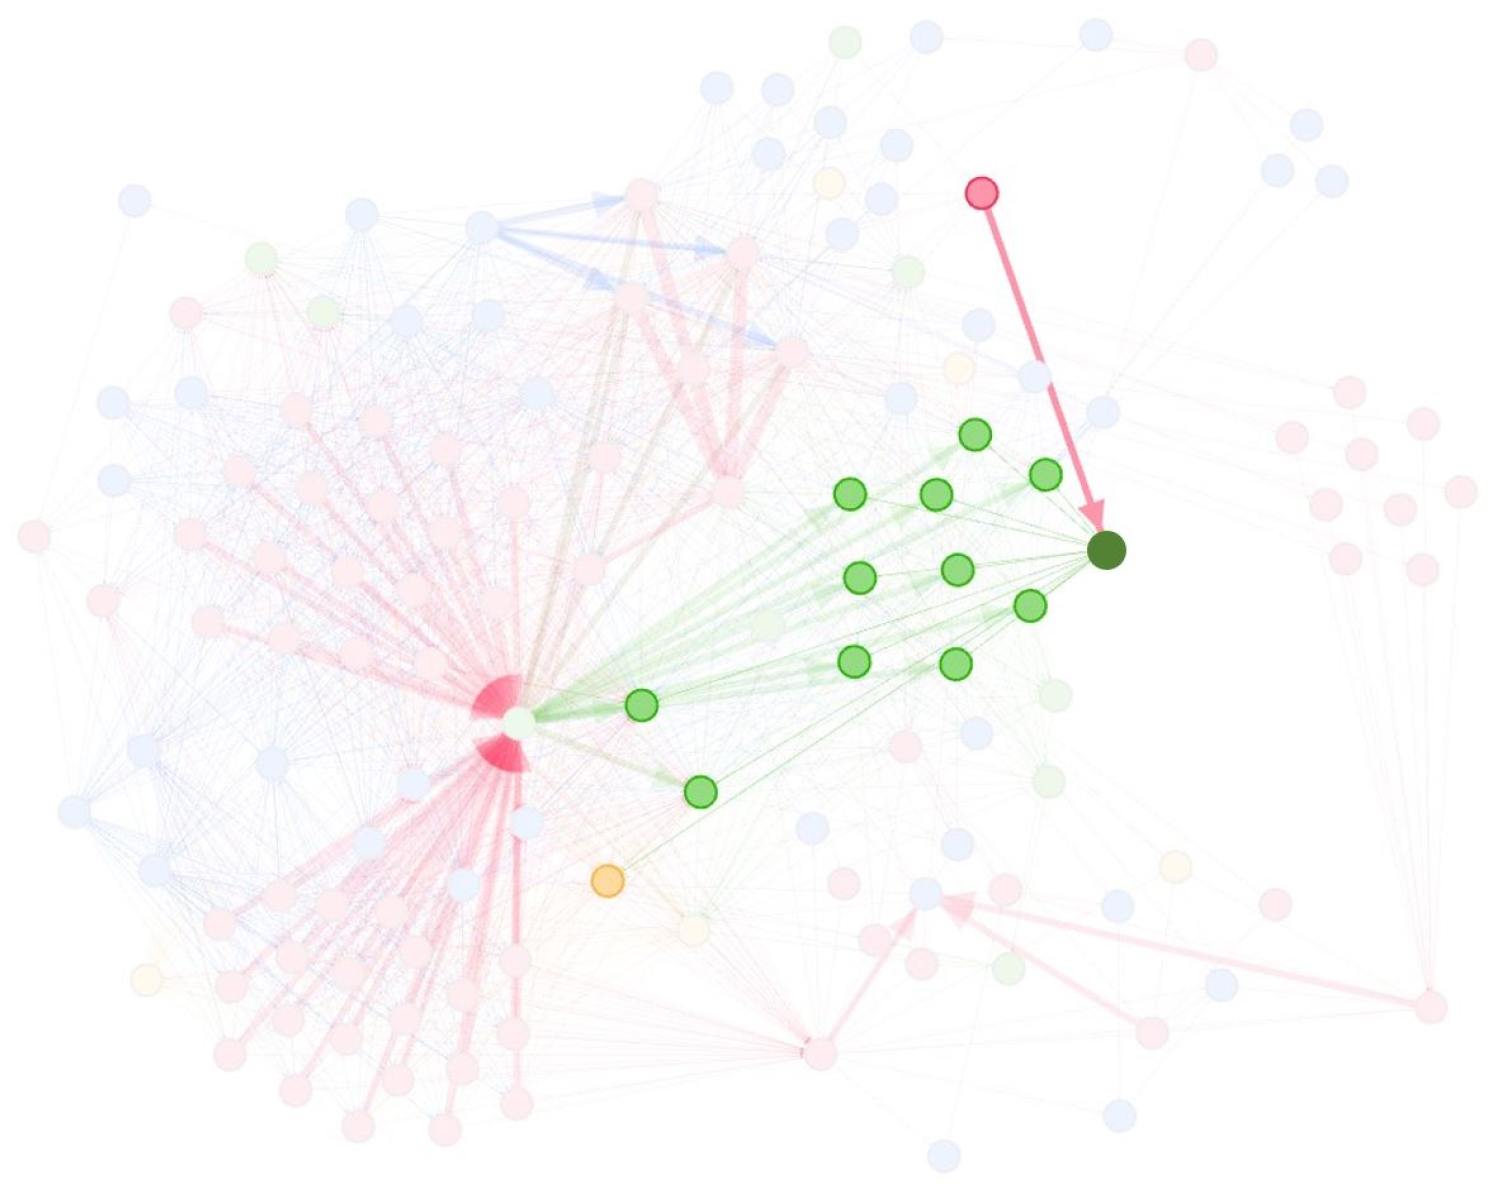
Similarly, this layout reveals that the node representing “plants and Wildlife” (
Figure 15) is spatially situated closer to institutions since it is influenced by legislation more than weather conditions (
Figure 16), e.g., water quality for species, plants, etc. Thus, this layout can be followed based on connections and spatial positioning, as the clusters draw closer to one another when common interests are present.
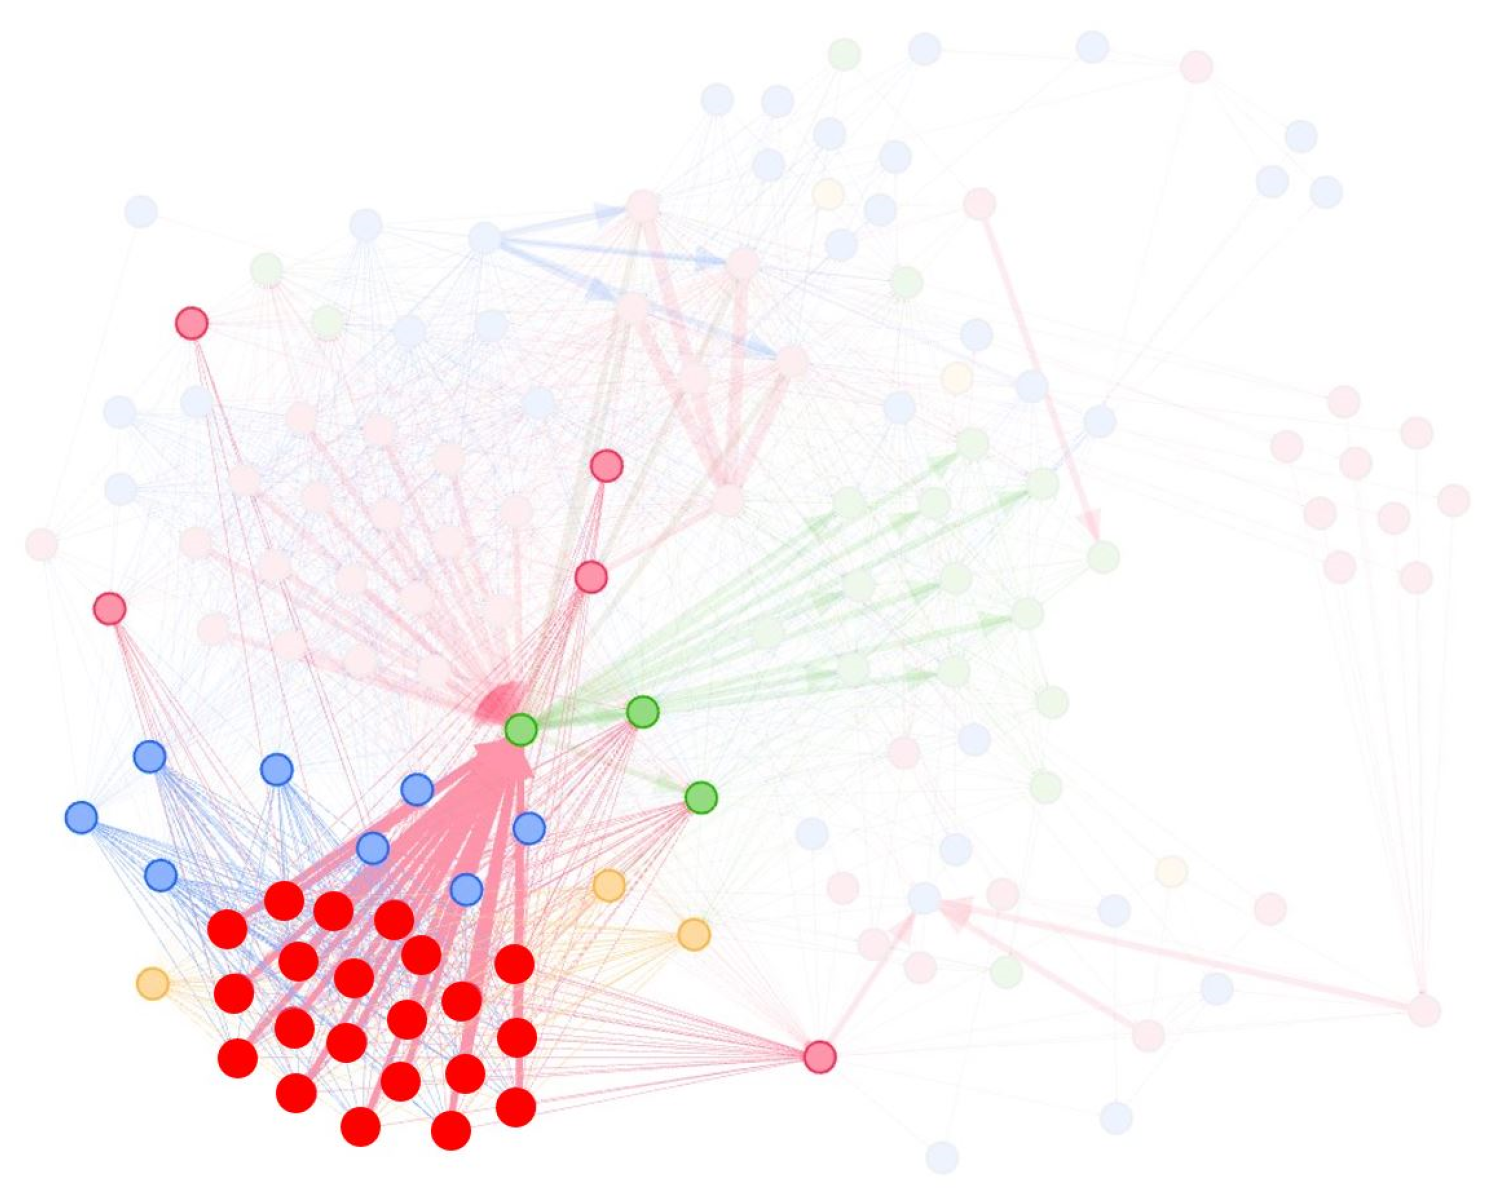
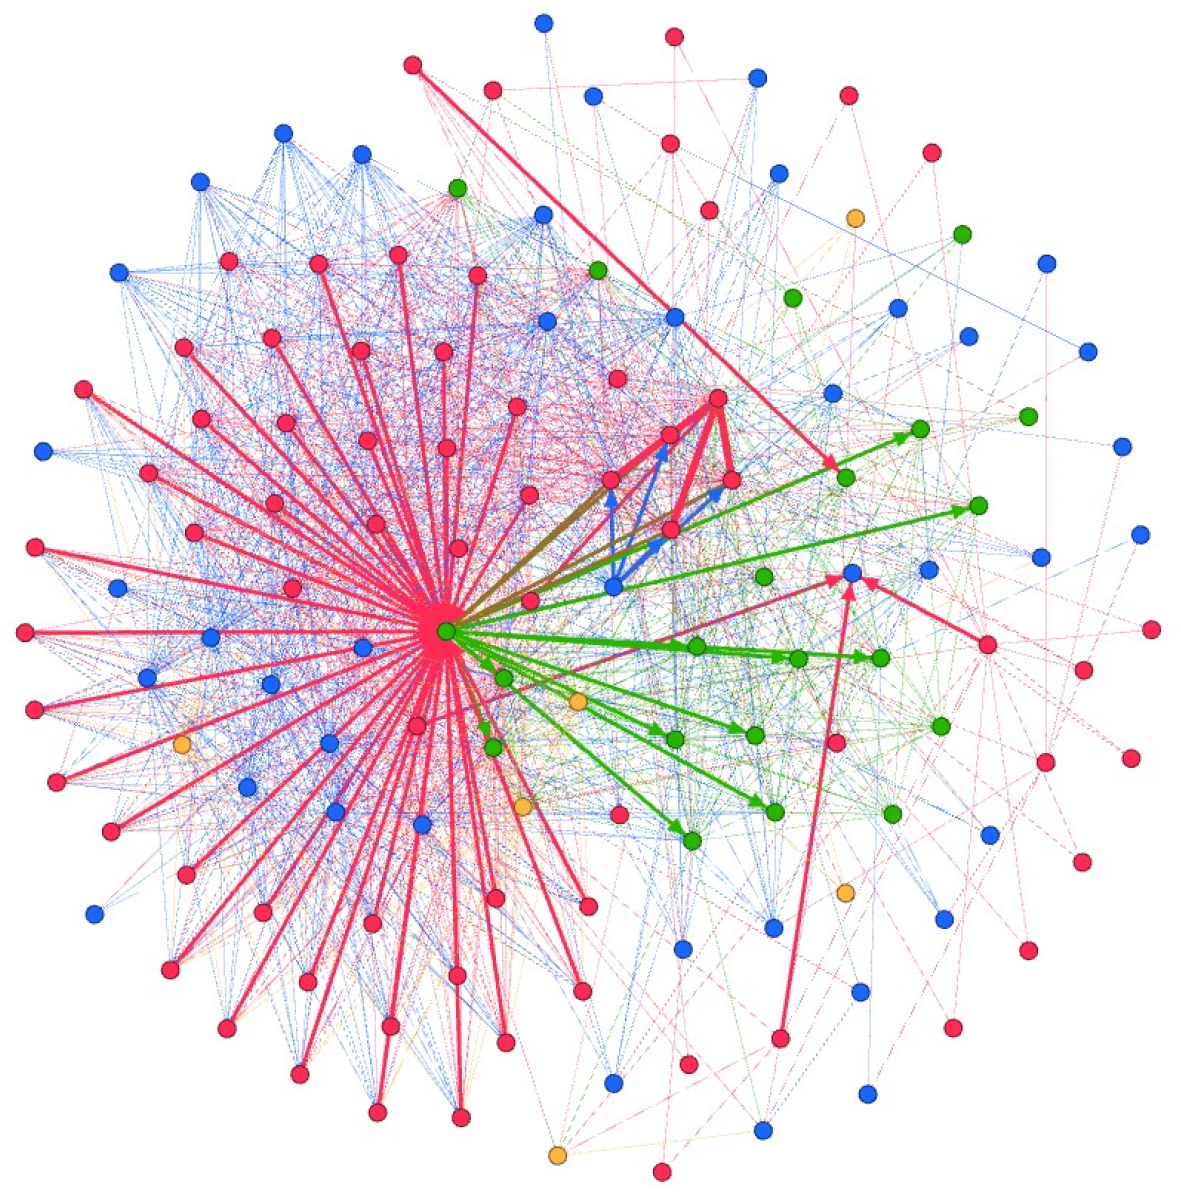
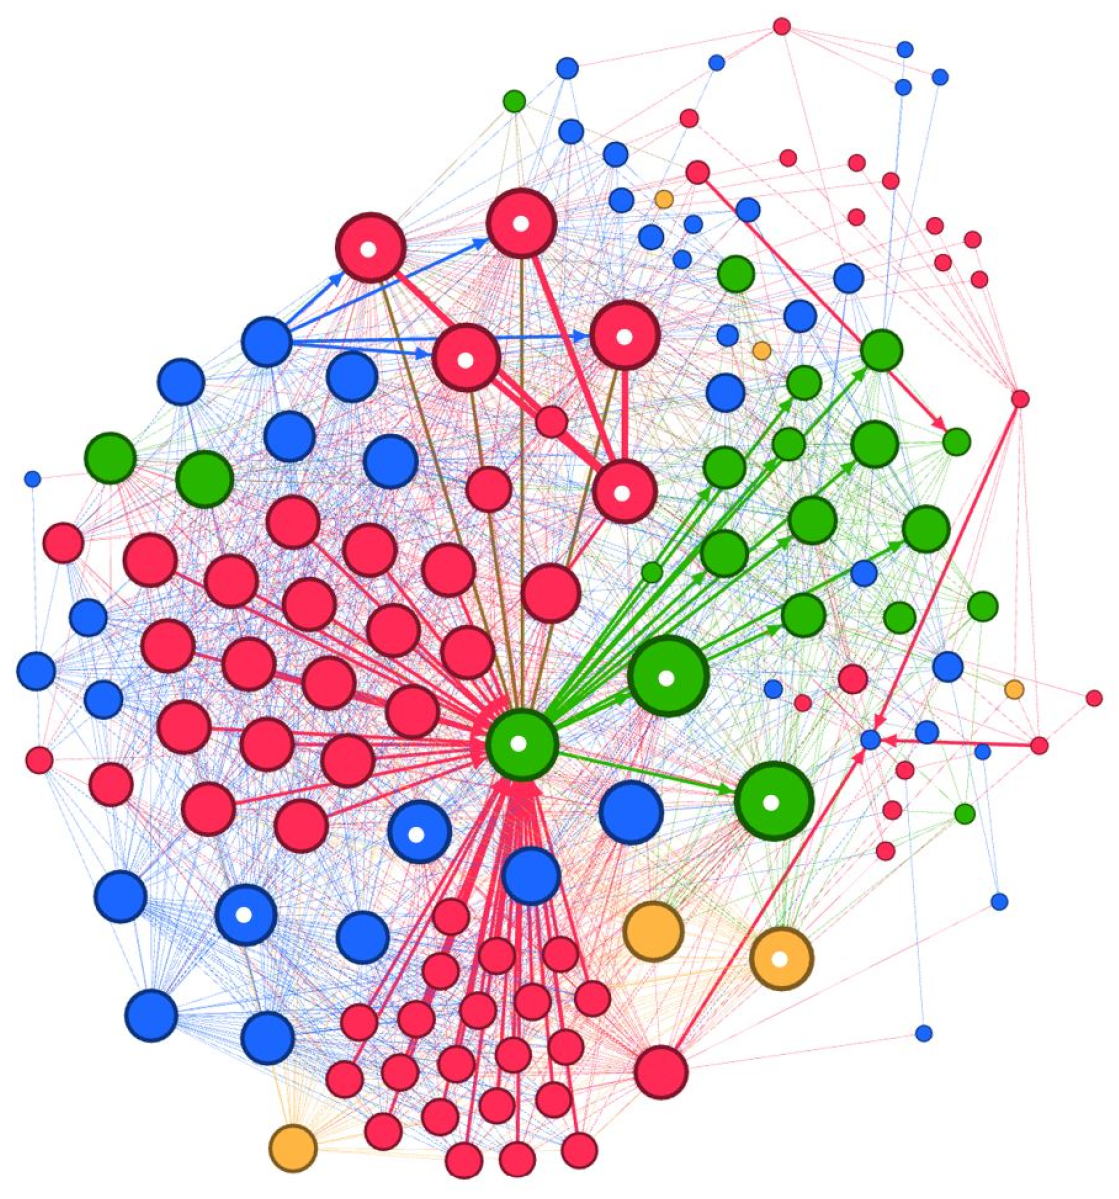
3.3.2. Statistics
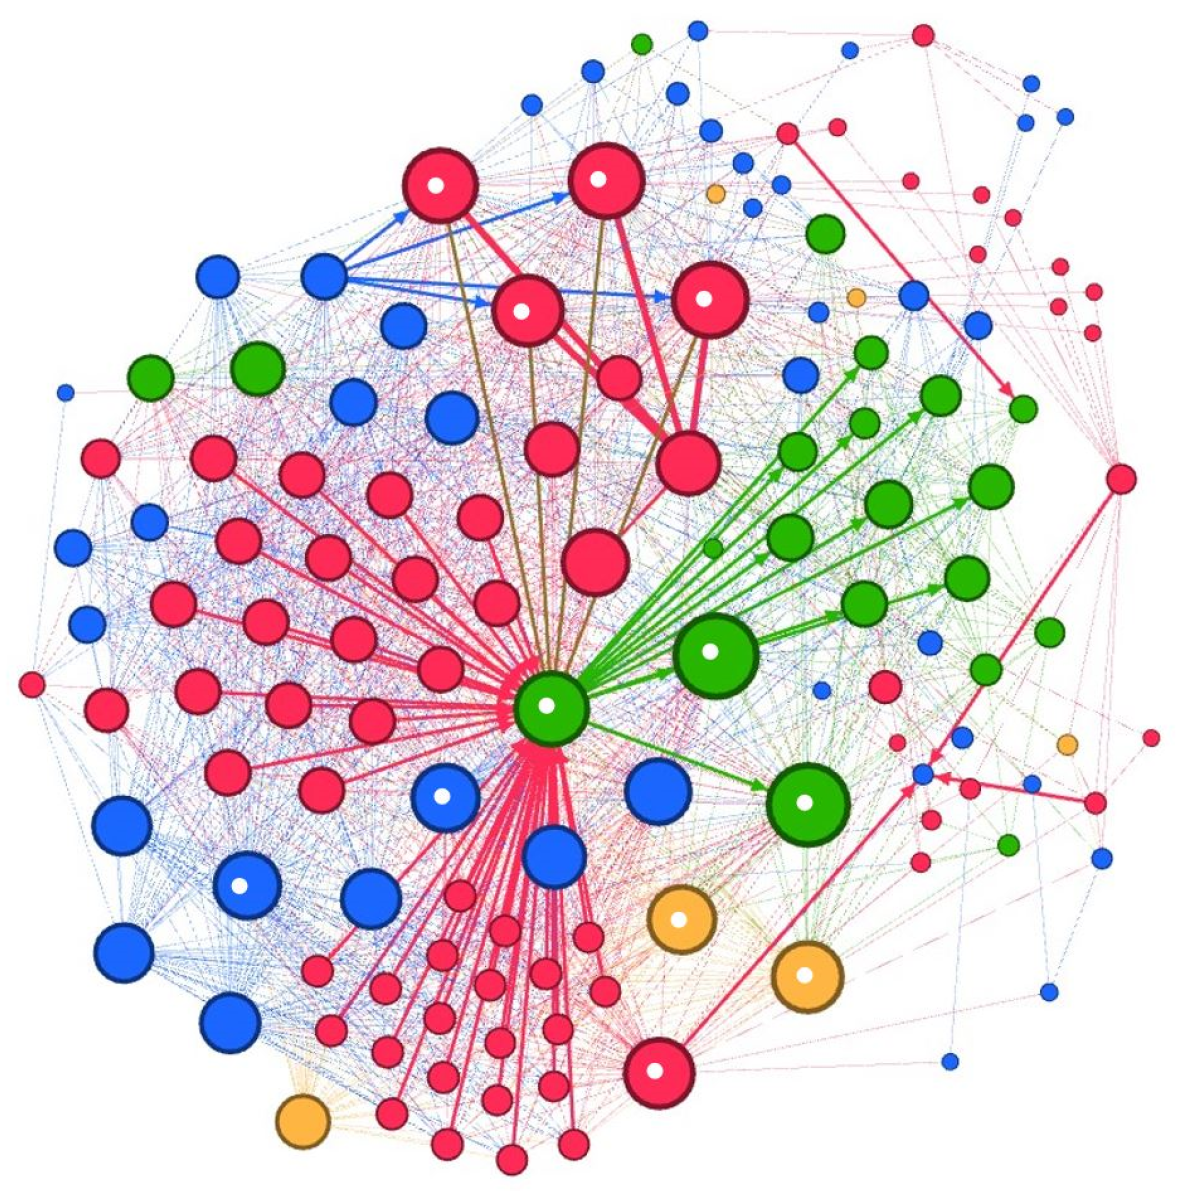
The observed range of connections in the system varies from a minimum of 2 to a maximum of 70. The nodes, with most connections in the system, are the unnavigable (70) or local (68) waterways, agriculture (61), industry (60), trades and services (59), households (56), the roads (60), the climate portal (56), the basin board (55), enforcement decision “Watertoets” (53), waterinfo.be (53), and the rainwater ordinance (51). They are the most “active” entities in the network. These high-degree components are visualised with a white dot in their node (
Figure 17).
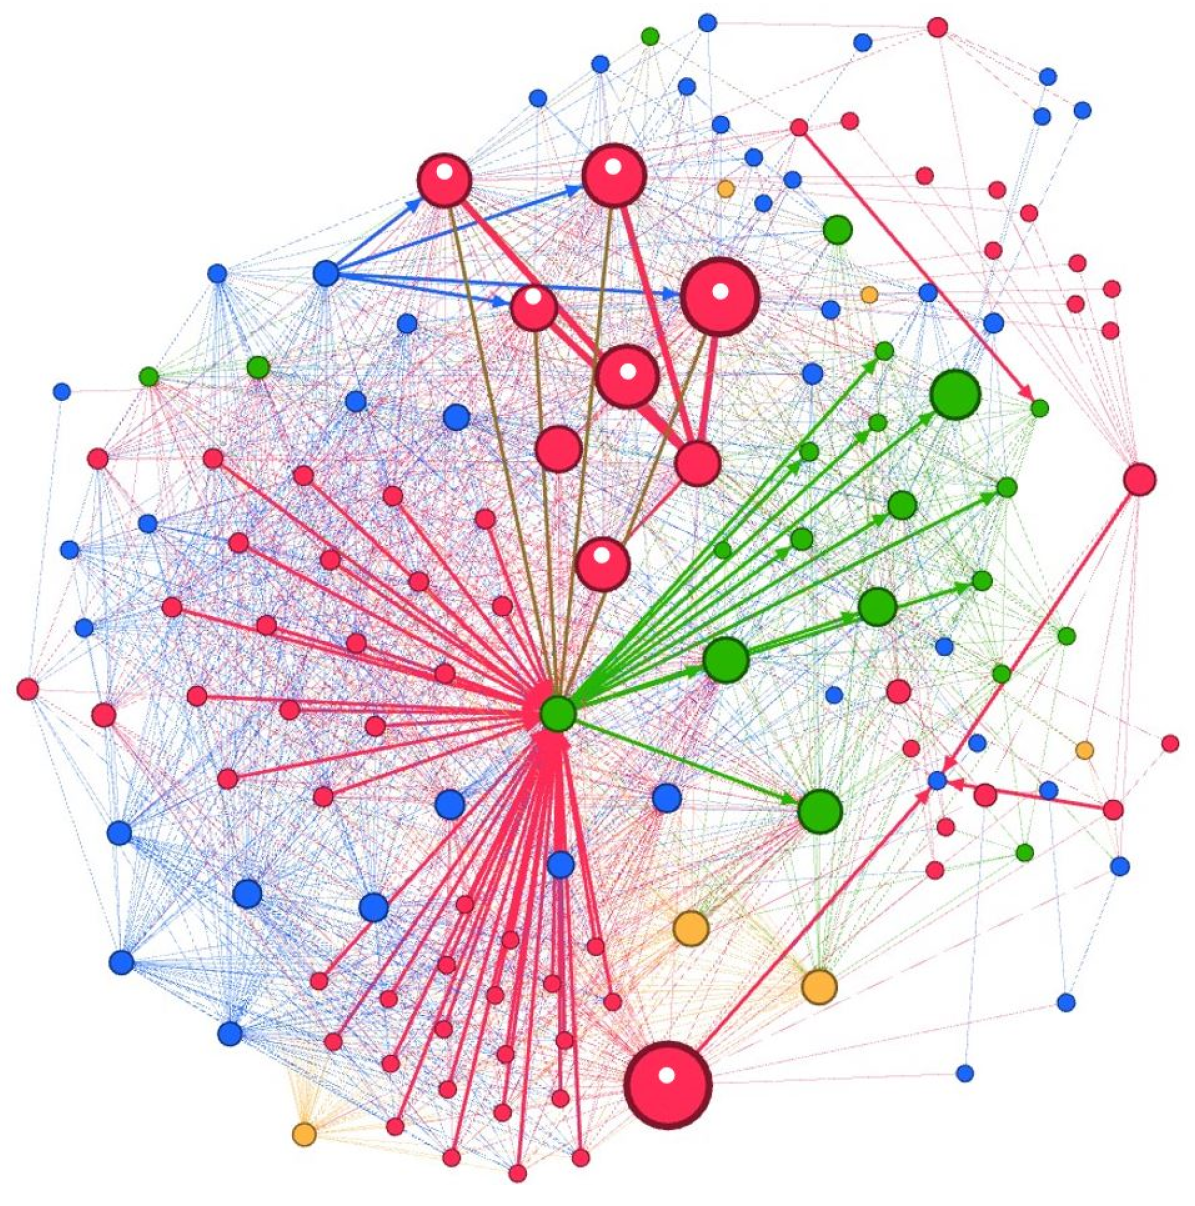
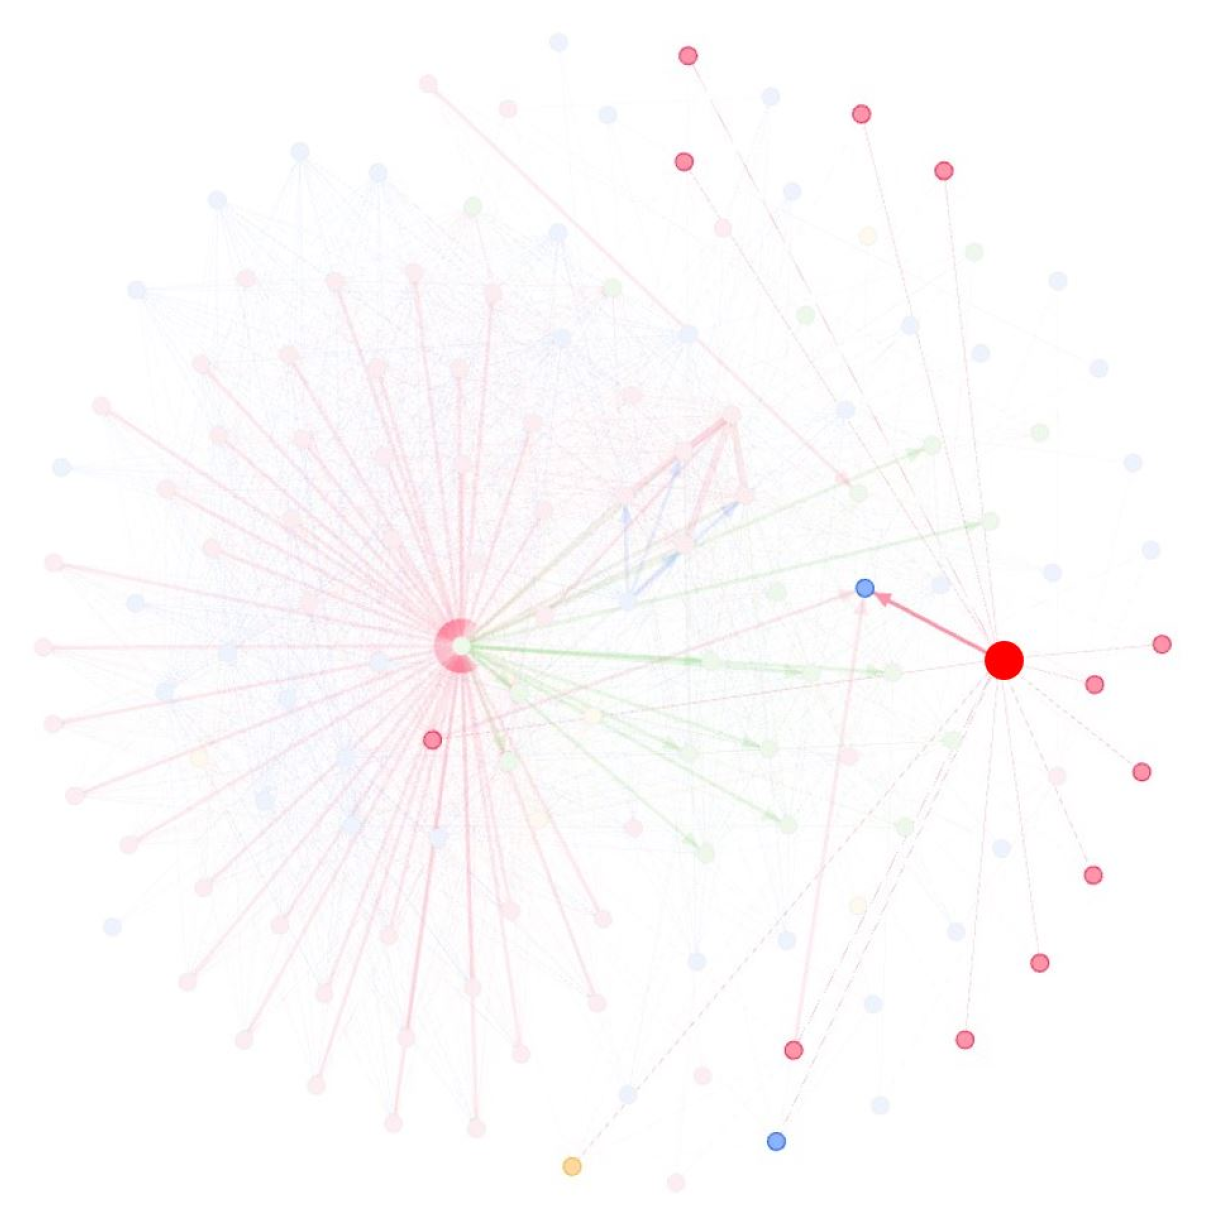
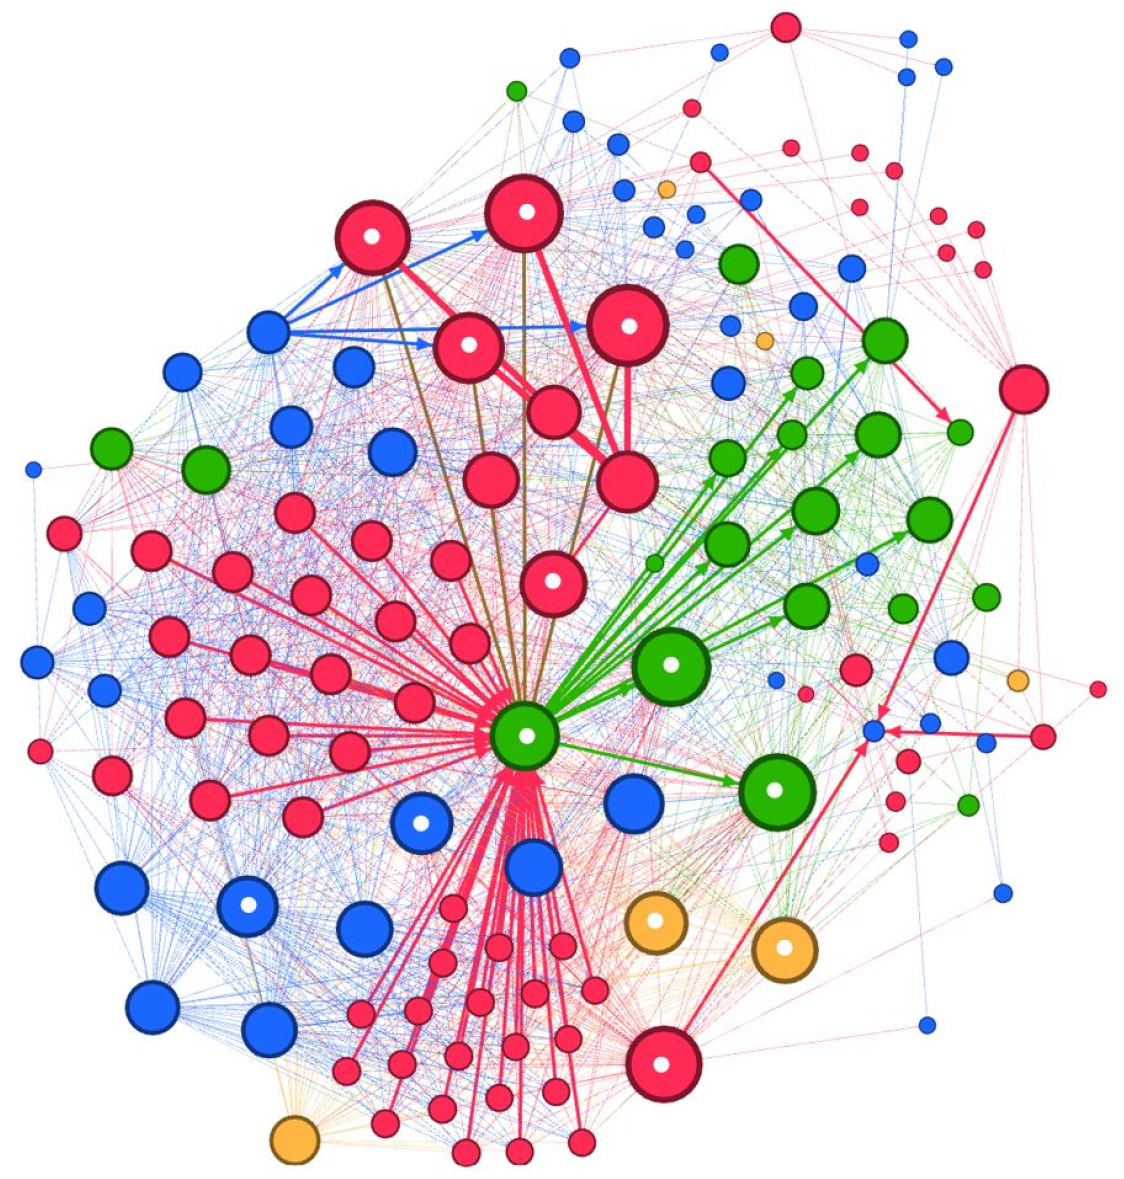
The lowest value for betweenness centrality (
Figure 18) in the Leie system was 0.4, and the highest was 734. Agriculture (697), industry (530), trades and services (417), households (340), the Flemish Government (530), drinking water companies (431), and the basin board (734) have the highest betweenness centrality. These components are again visualised with a white dot in their node, which means that they have a powerful location in the network due to their relatively short path and can significantly influence the overall connectivity and flow within the system. It is remarkable that these components all represent actors, meaning that actors who act, primarily humans in this system, rule and shape this network. While the actors of the Leie Basin have not yet recognised it as a drought-affected area, this may underscore the need for a shift in mentality or institutional change. If there is a shift in the actors’ mentality towards establishing a resilient drought system or the implementation of resilient institutional rules, then the actors may reduce their impact within the system.
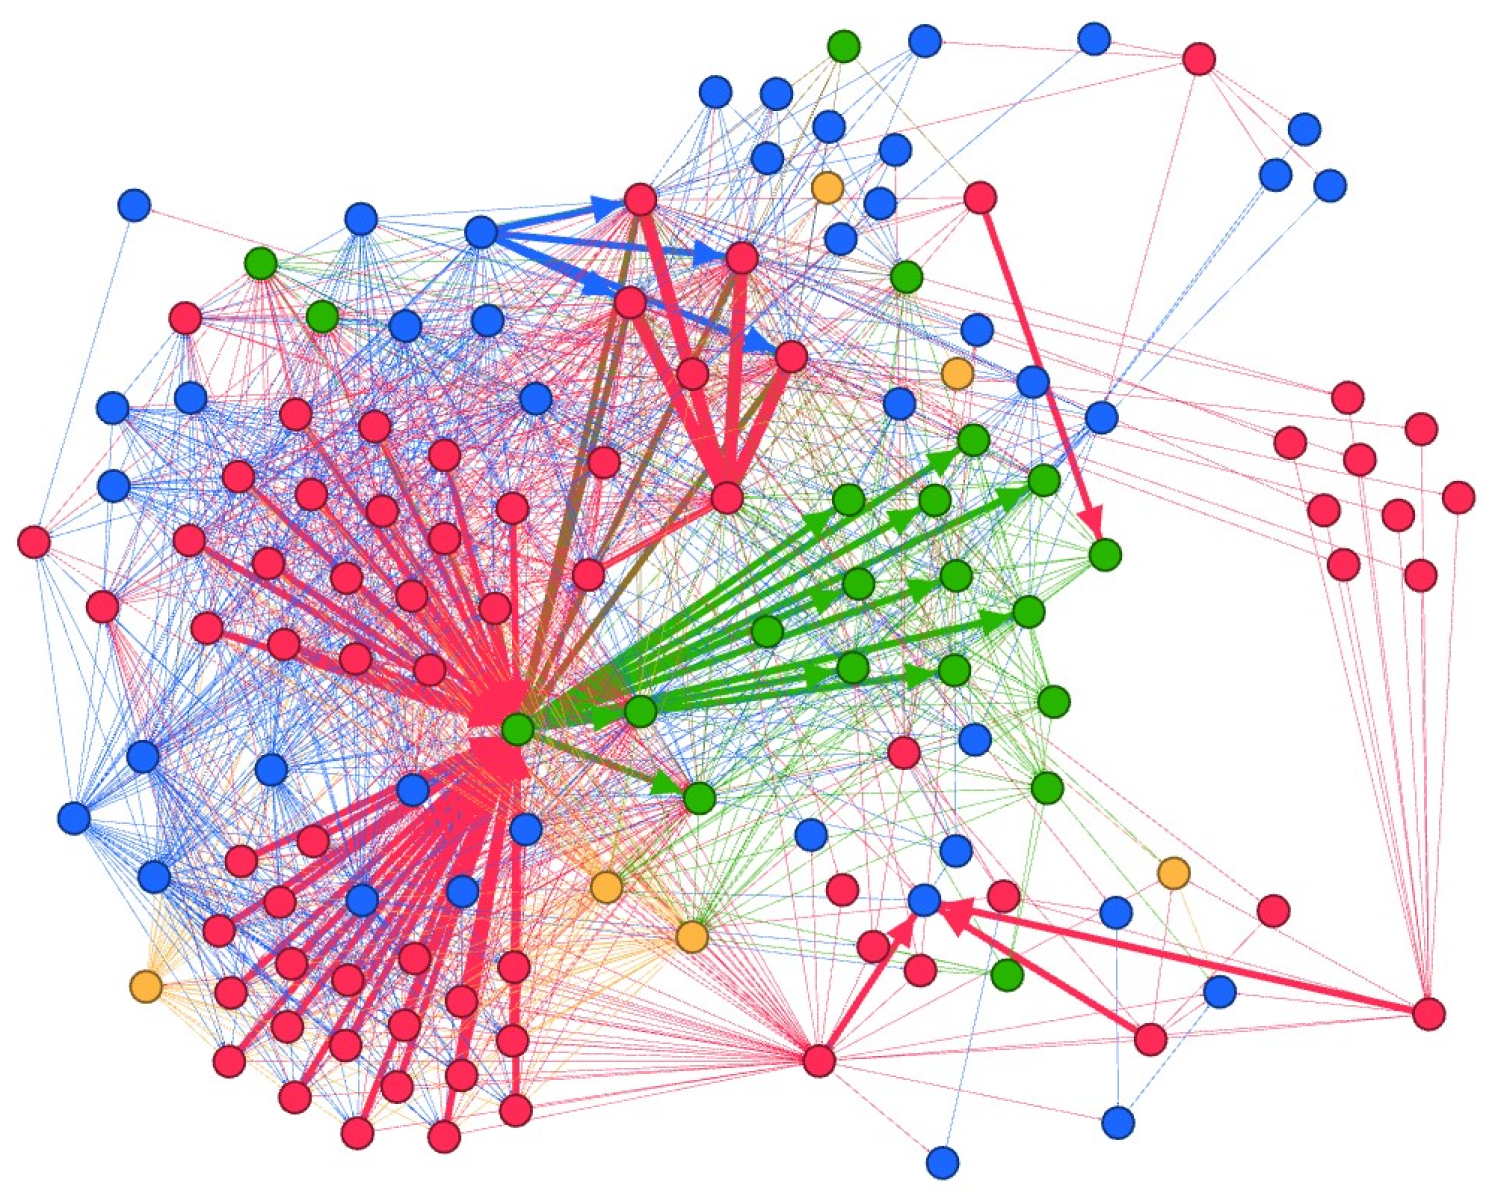
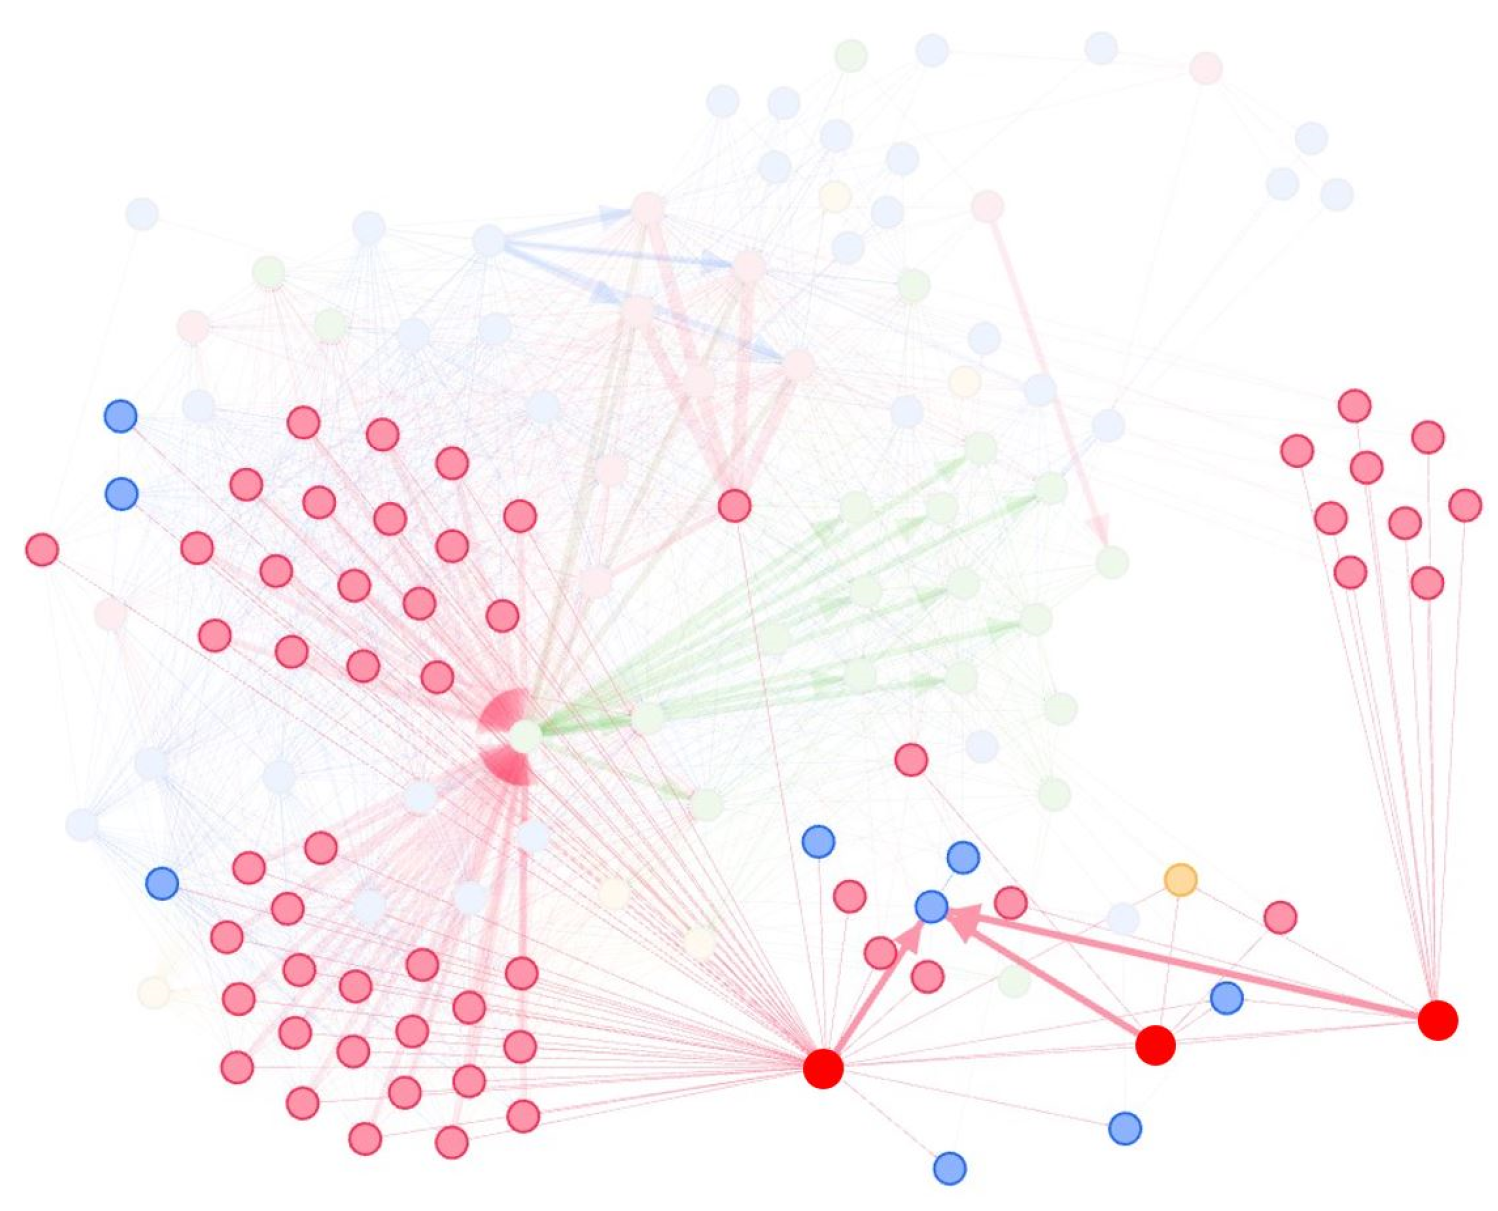
The drought system network created for the Leie Basin consists of directed (1336) and undirected (255) links. Therefore, both the eigenvector (
Figure 19) and PageRank (
Figure 20) were calculated and analysed to determine differences. Both were calculated with 1,000,000 random walks to improve the reliability of the result.
According to these visualisations, the key components are local waterways, roads, the basin board, agriculture, industry, trades and services, households, researchers, and drinking water companies. Additionally, the climate portal and waterinfo.be serve as strong and significant links within the given system. For the institutions, the rainwater ordinance and enforcement decision “Watertoets” are most important. However, it may not be insightful to only focus on the strongest and best connection within this current system since it does not meet the requirements, as the drought problem continues to worsen. Among the components of the ARA, there is one group that did not emerge as a good contestant, namely institutions. Institutions have a high data representation (30%) but express themselves less prominently compared to the actors, factors, and intermediaries/mediators. This implies that institutions have not used to their full potential at present.
3.4. Trends and Status
In the Flemish Region, a lot of data, offering valuable insights into the evolution and state of the basin areas, are readily available. However, such data will not always be available in every area, in which case an alternative approach could involve employing water accounting methods to address this particular aspect [
8].
During this study, it became clear that drought has only recently been addressed in the Leie Basin. Indeed, in the past, the main water-related risk was flooding, which was reduced by engineering solutions like the construction of dikes and drains in favour of the agricultural sector, which is of great importance in the region. However, these measures are contra-productive when facing drought problems.
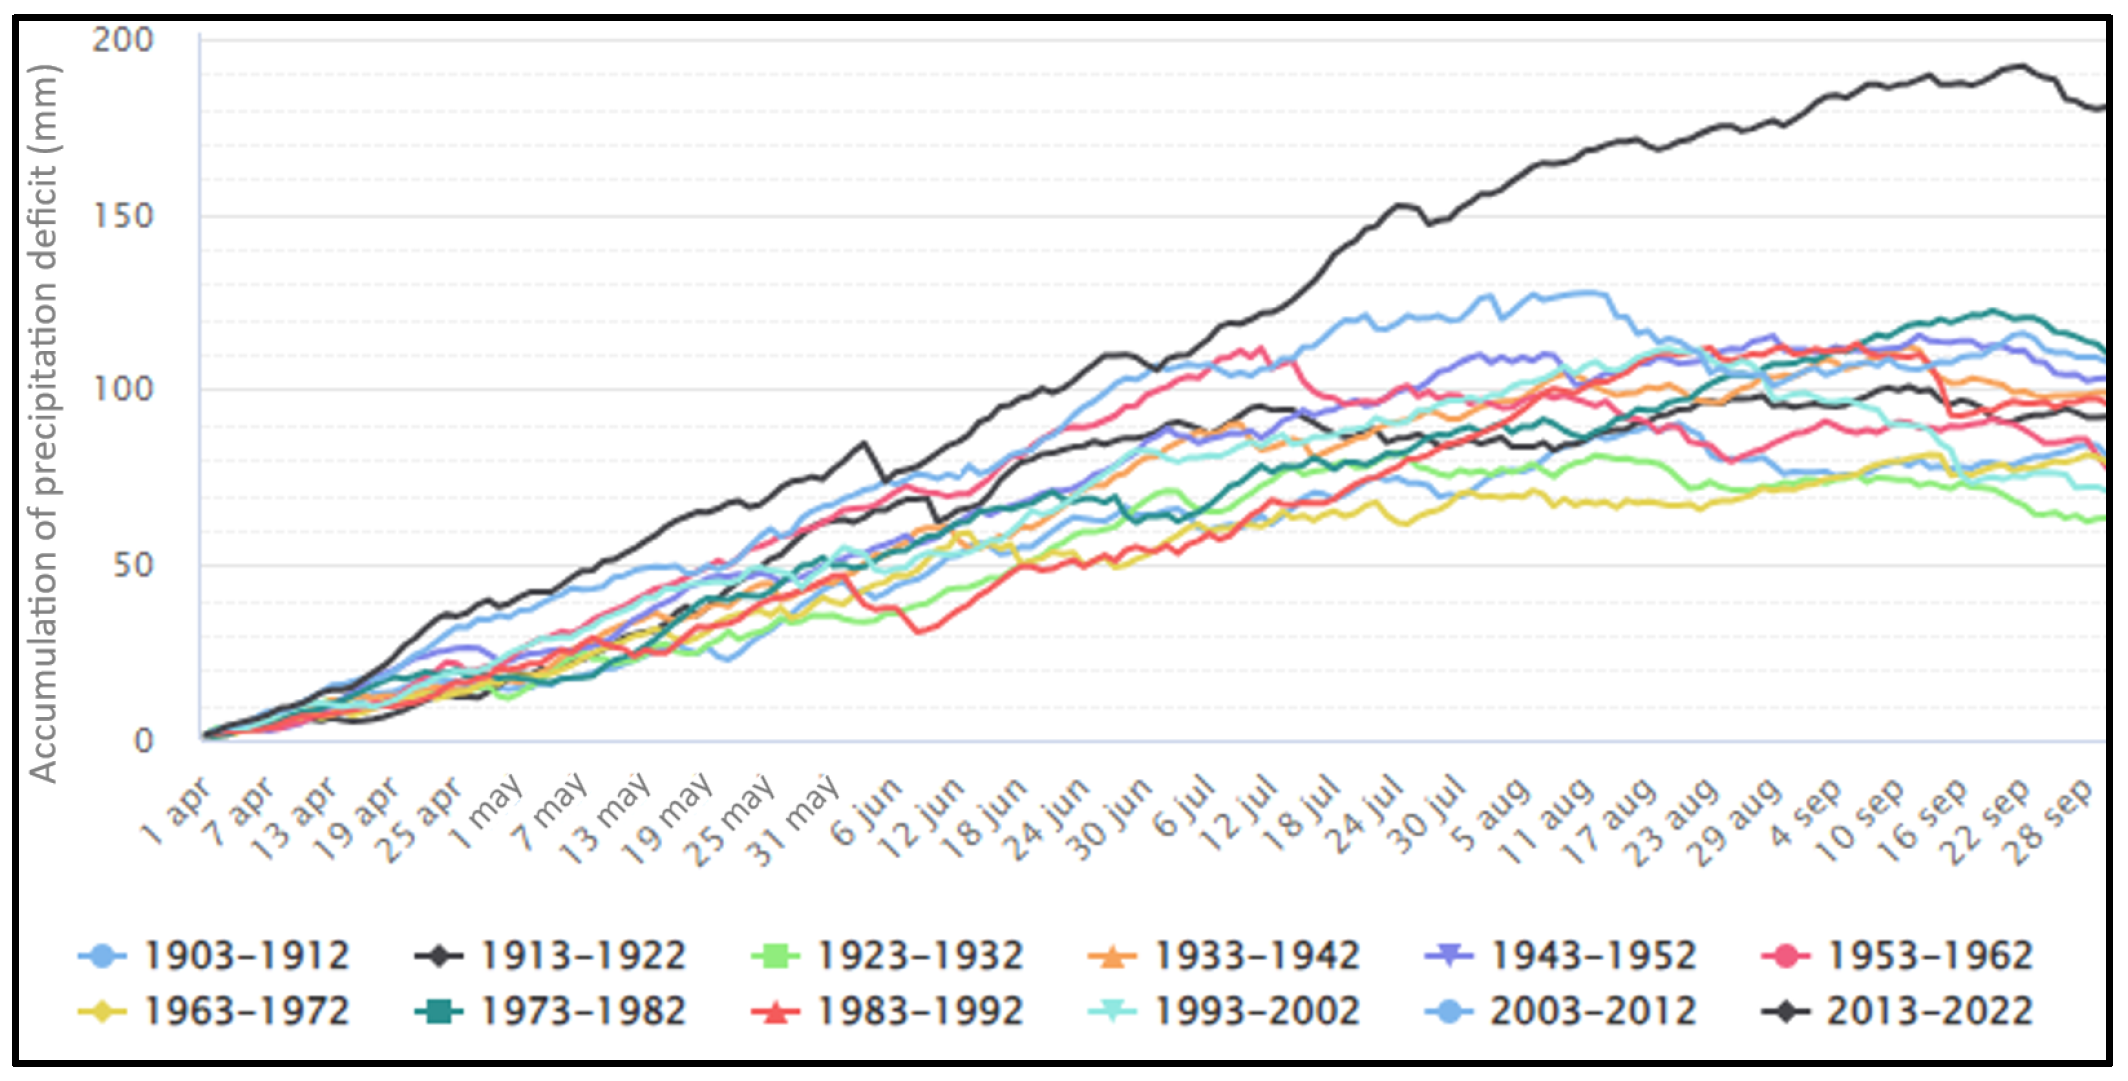
In Flanders, the precipitation deficit has increased in recent years (
Figure 21), which inextricably affects water availability [
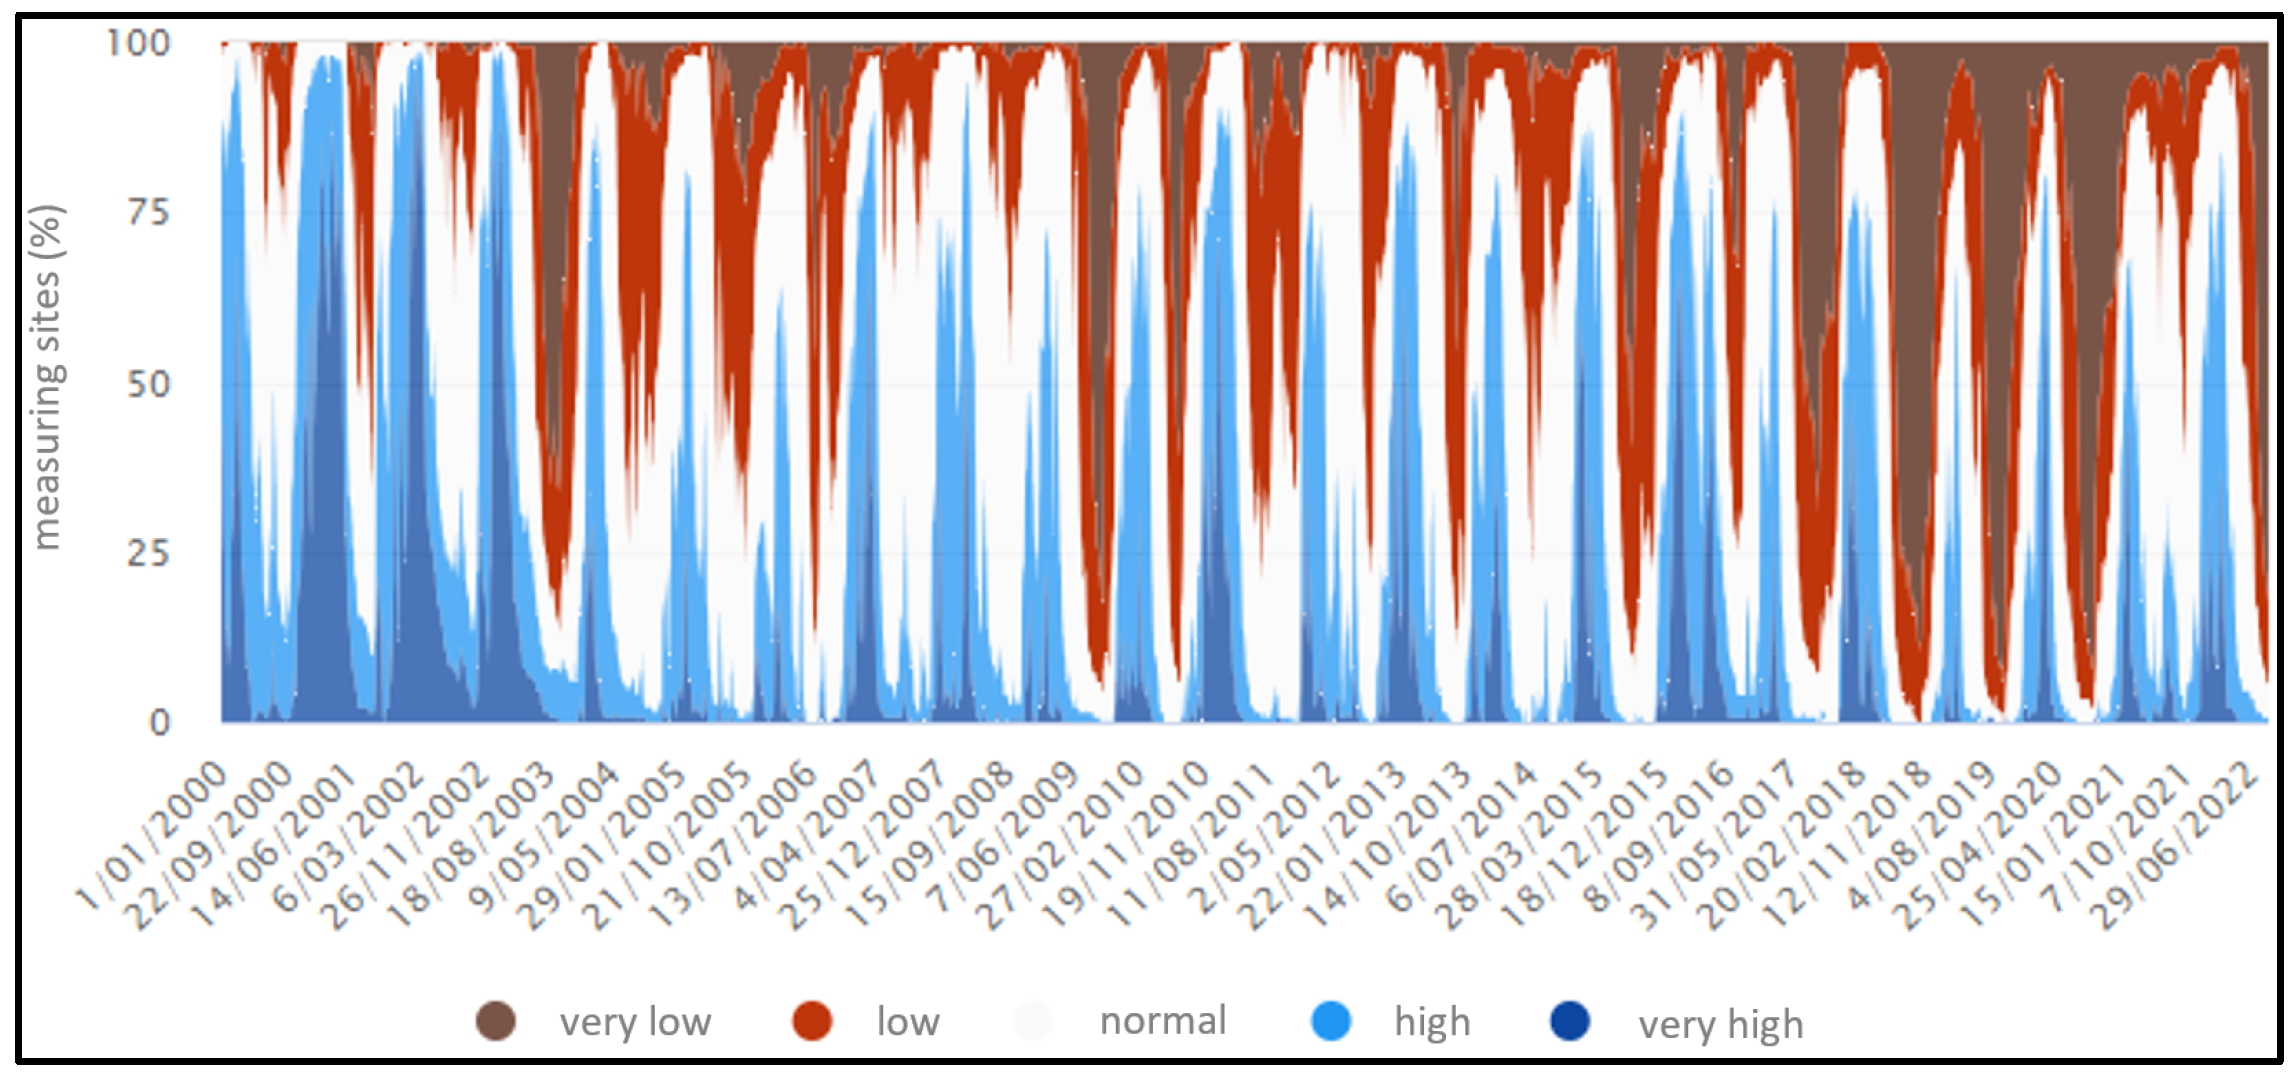
66]. This trend extends to the phreatic and confined groundwater, with
Figure 22 showing the blue/white colour changing to brown, thus representing a lower groundwater level [
67].
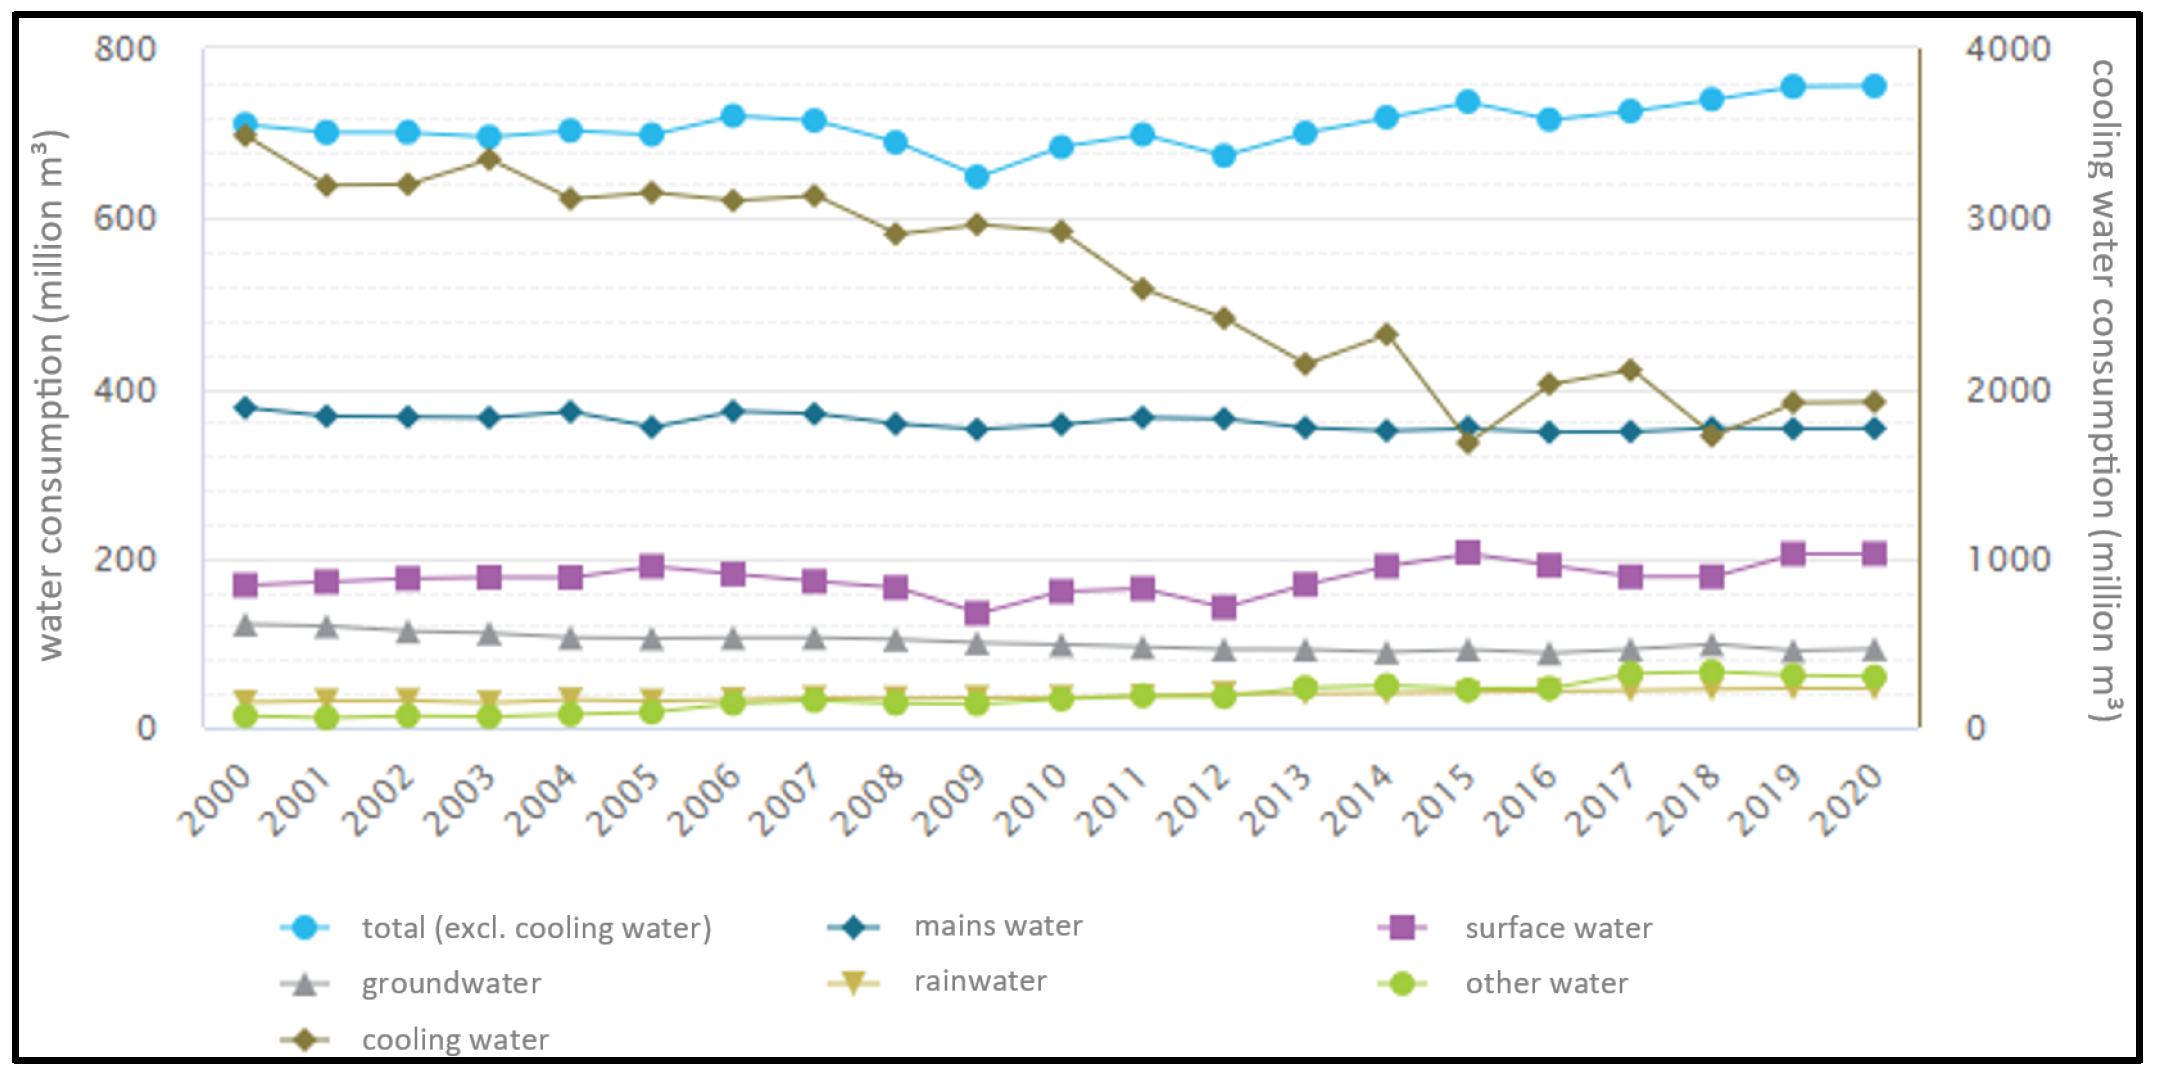
Water consumption by humans remains fairly stable (
Figure 23) [
68], which is good. However, if the population density increases while water availability decreases, water shortages will inevitably increase.
4. Discussion
This study aimed to translate the complex drought system into a comprehensive method for policymakers, mediators, and even the general public by applying the “Actor-Relational Approach” in combination with the “Water Resilience Assessment Framework” and a network model. While the ARA has previously demonstrated its effectiveness in flood scenarios [
27,
28], this paper demonstrates its relevance in understanding the complexities of drought within the Leie Basin in Flanders, Belgium. Nonetheless, this research represents just the initial phase of assessing the ARA’s suitability for drought systems. It is arguable that the case study simplified matters by treating the Flemish Leie Basin as a closed system. Given that the Leie Basin spans parts of French and Walloon territory, the factors, actors, and institutions specific to France and Wallonia must also be accounted for, either as integral components of the system or as interacting subsystems.
By the end of 2020, the Flemish Government introduced a series of initiatives and strategies aimed at promoting smart water use, nature-based solutions, and blue-green infrastructure. However, it is currently premature to gauge whether these measures will lead to a positive or negative co-evolution or if there will be changes in the roles of the involved actors or factors. It is essential to note that this analysis captures a specific moment in time and serves as a tool to comprehend the system. Since all components of the drought system evolve together, re-evaluation of this approach can enable co-evolution and thereby potentially contribute to the creation of resilience over time.
Recognising that various scales can produce distinct results is important. Local scales demand in-depth and detailed information to bridge knowledge gaps and establish connections. Although this research did not extensively explore the impact of different scales, conducting such an analysis could provide valuable insights into identifying the optimal scale for elucidating the drought issue. The perspectives and experiences of actors at the European level differ from those in small communities, yet discovering common ground may aid in fostering a collective understanding.
The analysis and interpretation of actors, factors, institutions, and intermediaries/mediators were conducted through desktop research. Striving for neutrality and ensuring the accuracy and validity of the information conveyed to policymakers, mediators, and the general public are critical. Desktop research primarily uncovers the formal relationships among various elements. To obtain the subtleties of informal connections, it is essential to complement the study with expert insights, field knowledge, interviews, etc., to enhance the depth and scope of the data collection [
27,
69,
70].
A limitation of this study Is the lack of “weight” assignment to the ARA components, reflecting their relative significance. Integrating this feature into the network analysis presents a challenge, especially in accurately allocating weights to each node. Future research could explore this complexity in more depth.
Additionally, the study employed eigenvector and PageRank measures to analyse undirected and directed networks, respectively. Given the mixed nature of the network in this case study, both metrics were utilised. Nonetheless, choosing either an undirected or directed network from the outset could prove more beneficial. Despite this, the analysis revealed that most conclusions drawn from the network analysis were consistent.
Finally, this study highlights that certain nodes seem more powerful than others, suggesting that nodes with more power could potentially have a greater impact within the system. It is therefore important to establish a positive evolution, in terms of resilience, involving these nodes. Nevertheless, the study did not conclusively determine the extent to which a node’s power influences the overall system. While powerful actors, for example, are somewhat influenced by regulatory measures, the institutional component seemed to have minimal impact. This raises the question of what is required to enforce measures more effectively and enhance the desired outcomes of the system.
5. Conclusions
Numerous studies have highlighted the importance of shifting towards a system resilient enough to effectively adapt to climate change impacts. Central to this shift is the creation of a structured approach. Drought, as an issue that spans multiple disciplines, often gets pigeonholed into narrow definitions concentrating on particular facets while overlooking the broader, more interconnected nature of drought and its root causes. To address this limitation, this research uses the holistic concept of the anthropogenic definition of drought, aiming for a deeper understanding of the issue. However, relying solely on this definition poses challenges in grasping the system’s full complexity. Integrating the anthropogenic drought concept within the “Actor-Relational Approach” (ARA), informed by the resilience principles of the “Water Resilience Assessment Framework” (WRAF), enables a more effective conceptualization. Drought systems are inherently complex, and the ARA has been successfully applied in the analysis of other complex systems such as flood management [
27,
28]. By dissecting the drought system into its constituent components using the ARA and combining this with a visualisation through a network analysis visualisation tool like “Gephi”, the complexity can be unravelled. This approach allows for a detailed examination of the complex interactions between human and natural components, aiding in the creation of a robust and resilient drought management strategy.
Following subsequent statistical analyses, including metrics such as degree, betweenness centrality, and eigenvector/PageRank, shed light on the quantity and importance of relationships, thereby identifying nodes with the potential to exert the greatest influence on the system. Across all aspects, actors consistently exhibit substantial influence, closely trailed by factors. Surprisingly, the intermediaries/mediators, constituting only 5% of the systems population, demonstrate significant potential. Therefore, the primary takeaways from the network analysis emphasise the substantial impact of major actors such as agriculture, households, industry, and government organisations. Given that actors are primarily guided by institutional frameworks within the system, and institutions can also facilitate positive changes regarding water availability (factors), it becomes crucial to determine the direct and indirect impacts of institutions on the system. However, compared to intermediaries/mediators, institutions, while representing a higher percentage, appear to lack influence within the system. This can be attributed to historical priorities placed on flood management, with droughts receiving attention only recently. Consequently, measures addressing droughts tend to be ad hoc and lacking in resilience, thus diminishing the impact of institutional efforts. Nevertheless, recent initiatives, such as the implementation of forward-looking measures, aim to bridge this gap.
In summary, this methodology offers a robust approach to understanding intricate interactions without relying on complex models that only capture a fraction of the drought system. By identifying the most and least influential elements within the system, planners, policymakers, and the general public can leverage these insights to navigate towards a more resilient system by adapting it and re-evaluating the outcome. In this way, effective decision making and resilient transitions can be fostered.


