Article

Analysis of Green Spaces by Utilizing Big Data to Support Smart Cities and Environment: A Case Study About the City Center of Shanghai

1
School of Communication & Information Engineering, Shanghai University, Shanghai 200444, China
2
School of Information Engineering, Huangshan University, Huangshan 245041, China
3
Institute of Smart City, Shanghai University, Shanghai 200444, China
*
Author to whom correspondence should be addressed.
ISPRS Int. J. Geo-Inf. 2020, 9(6), 360; https://doi.org/10.3390/ijgi9060360
Submission received: 1 April 2020 / Revised: 20 May 2020 / Accepted: 30 May 2020 / Published: 1 June 2020
(This article belongs to the Special Issue Geovisualization and Geo Visual Knowledge Discovery)

Abstract

:
Green areas or parks are the best way to encourage people to take part in physical exercise. Traditional techniques of researching the attractiveness of green parks, such as surveys and questionnaires, are naturally time consuming and expensive, with less transferable outcomes and only site-specific findings. This research provides a factfinding study by means of location-based social network (LBSN) data to gather spatial and temporal patterns of green park visits in the city center of Shanghai, China. During the period from July 2014 to June 2017, we examined the spatiotemporal behavior of visitors in 71 green parks in Shanghai. We conducted an empirical investigation through kernel density estimation (KDE) and relative difference methods on the effects of green spaces on public behavior in Shanghai, and our main categories of findings are as follows: (i) check-in distribution of visitors in different green spaces, (ii) users’ transition based on the hours of a day, (iii) famous parks in the study area based upon the number of check-ins, and (iv) gender difference among green park visitors. Furthermore, the purpose of obtaining these outcomes can be utilized in urban planning of a smart city for green environment according to the preferences of visitors.

1. Introduction

Urban areas are generally marked by downgraded ecosystems, rising environmental damage, higher temperature, and a decreasing number of green parks. Urban green spaces (UGS) are important for improving quality of life in metropolitan areas, balancing thermal comfort with thermal budget [1], and helping the public heal from the physical and emotional pressures of their daily lives [2]. Green spaces in an urban environment are vital for improving living conditions by improving air quality and aesthetics, which eventually lead to higher real-estate values and a reduction in energy use for cooling. Urban green spaces can also be applied as a cumulative resource for enhancing the sustainability of urban areas [3]. They also provide children with much-needed space to play, significant for their social, cognitive, and mental functions [4].
Urban green spaces—in general, parks—offer many advantages to people’s well-being, such as psychological and social well-being and physical health [5,6,7]. Visits to green parks provide an opportunity to experience the extra benefits of “natural” environments directly, especially for people with limited natural contact. Consequently, quantifying the visits of residents to urban green spaces and recognizing the factors that influence their visits are vital for urban park management and planning. It is important to measure visitation of parks and urban green spaces to recognize their recreational interests and define the factors that influence them. Visitor polls, on-site counters, and direct observation are traditional methods for estimating the number of visitors [8,9]. These methods of organized observation usually pick a representative sample of urban green spaces and collect information about green park use—for example, visitation numbers and features, activities, and behavior of green park visitors. However, these approaches are typically time-consuming and site-specific and, therefore, have restricted spatial coverage [10]. The advent of free social media data offers new methods of calculating urban green park visits. Data collected from social media and other “big data” reliable sources grow in size every year and can be utilized to research how the public interact with actual environments and to accurately assess individual preferences through time and space [11].
The World Health Organization (WHO) reports on the environment, urban planning, and health released in 2010–2016 reveals that green spaces can positively affect physical activity, social and psychological well-being, improve air quality, and reduce the exposure to noise [12,13]. Epidemiological research has used a wide range of methods to calculate the positive impact of green parks’ accessibility and availability on health. Due to the ability of urban green spaces to act as an environment for promoting health, it is essential to summarize available evidence, recognizing, where possible, the underlying mechanisms that contribute to positive and negative health outcomes of green spaces. Recent developments in social media analysis based on geographic information systems (GIS) provide an opportunity to examine spatial and temporal, and even affective dimensions of the behavior of users, including public spaces and visits to parks [14,15]. However, some of these analyses still have drawbacks, because only a relatively small number of social media posts are analyzed manually.
The kernel density estimation (KDE) method was used to model geolocation data spatially and offers an additional particular and comfortable structure for spatial estimation of density. The method was used for the assessment of environmental attributes—for example, healthcare properties [16], the diet environment [17], and green space advantages. It boosts access or measuring distance by transforming point data into something similar to a nonstop surface and allowing the density of the characteristic to be measured at any point on the map’s surface [18]. In this research, we expected to examine the effects on visitation rates of users’ check-in behaviors to green spaces. We utilized a sample of data to research green park-related check-in behaviors, including likes and dislikes, as a summary of the behavior or preferences of the general public in various activities while using park resources. Similarly, the aim of the study is to address the following questions: (i) Is using the social media network dataset feasible for this kind of environmental studies? (ii) How often does the time of day influence the behavior of the general public in green parks? (iii) Which district is the center of activities in the city center of Shanghai? To properly grasp the link between green parks and visitor behavior, we analyzed users’ spatiotemporal trends in urban green spaces using a large-scale dataset from July 2014 to June 2017, with almost 70,000 check-ins. Our main results indicate the user check-in distribution in different green parks and exciting behavioral changes based on the time of day in 24 hours and the day of the week. We also investigated the gender difference among districts and days by applying the relative difference formula. By examining these factors, we could analyze the use of urban green parks and its variance across a range of temporal scales. This method of capturing visitor activity in urban green spaces is an attempt to solve the drawbacks of previous studies. This method paves the way for socioecological research using crowdsourced and social network data instead of relying on the results of subjective coverage and observational data.

2. Materials

2.1. Study Area

Shanghai City is among the fastest-growing metropolises in the world, with a population of 22,125,000 in an area of 4015 km2 [19]. The overall number of green parks within the city of Shanghai is 366 [20]. As part of the alluvial plain, Shanghai and the Yangtze River Delta have an average elevation of around 4 m. From east to west, there is a slight terrain gradient. The land is plain, except for some southwesterly foothills. Shanghai is part of the climate zone for the north subtropical humid monsoon. There are four seasons with abundant sunshine and rainfall. Therefore, in such a metropolitan area, extreme events and urbanization have had a substantial influence on public health-promotion services and the country’s economy. Shanghai is indeed the world’s tenth-most prominent agglomeration region. It also states that the process of urbanization is relatively quick. The United Nations (UN), in its future forecasts of urbanization, stated that Shanghai’s urban population ranks as the world’s second-largest and China’s largest [21]. Figure 1 represents the study area.
In 2016, Shanghai was divided into 16 districts: 15 districts (Baoshan, Changning, Fengxian, Hongkou, Huangpu, Jiading, Jing’an, Jinshan, Minhang, Pudong New District, Putuo, Qingpu, Songjiang, Xuhui, and Yangpu) and 1 county (Chongming) [22]. Seven regions (Changning, Hongkou, Huangpu, Jing’an, Putuo, Xuhui, and Yangpu) are located in Puxi (literally Huangpu West) and are known as Shanghai’s downtown or city center [23,24].

2.2. Dataset

The dataset that we used to examine the number of visits to green parks comes from the Chinese popular microblog Weibo. Weibo is considered to be comparable to China’s Twitter and the major social media blog in China. The amount of Weibo customers is huge, representing the biggest dataset of obtainable geotags. According to its latest annual report, Weibo announced that more than 500 million active users registered on the platform in 2018 and reached 462 million monthly active users in December 2018 [25]. The demographics of Weibo users are inconsistent with the total population. It was decided to launch the public interface of the Weibo location-based service (LBS) on May 28, 2012. Weibo users have since been able to share their location on the internet in real-time. As a kind of scalable and available large-scale crowdsource data, Weibo sign-in data are the most appropriate dataset we could obtain to estimate the actual number of park visitors. However, an earlier study of 87 city parks situated in Shanghai, China showed that there was an important link between data from Jiepang social media platforms and official visit numbers [26].

2.3. Dataset Filtaration

In this part of the procedure, improper data were distinguished, filtered, and modified to avoid incorrect conclusions. Preprocessing consisted of cleaning out unrelated columns, eliminating duplicate rows, resolving discrepancies, and performing data management, allowing improved data interpretation in the analysis method. We also translated the data, because the dataset was written in the Chinese language, so it was necessary to first change it to English as can be seen in Table 1.
Weibo was created in August 2009 and is one of China’s largest social media sites and a popular microblogging platform that allows people to post and share their daily activities with their circle of friends. The term “check-in” shows that a user willingly wants to share or proves their location on the LBSN by publicizing it on a location-sensing smartphone or tablet while participating in certain activities [27]. Using the check-in data of Weibo [28], a new model was proposed that integrated the parameters of an urban environmental function network, thereby enriching the definition of the structure of urban networks. However, although using Weibo check-ins as a visit proxy is still uncommon, earlier research utilizing data from similar social media sites or platforms—for example, Facebook, Flickr, and Instagram—found important beneficial links between official visit stats and the amount of visitors reported on these sites. However, due to the unavailability of Facebook and the fact that Weibo is also considered the Chinese Facebook, we considered Weibo data to be the best source for this study [10,29].
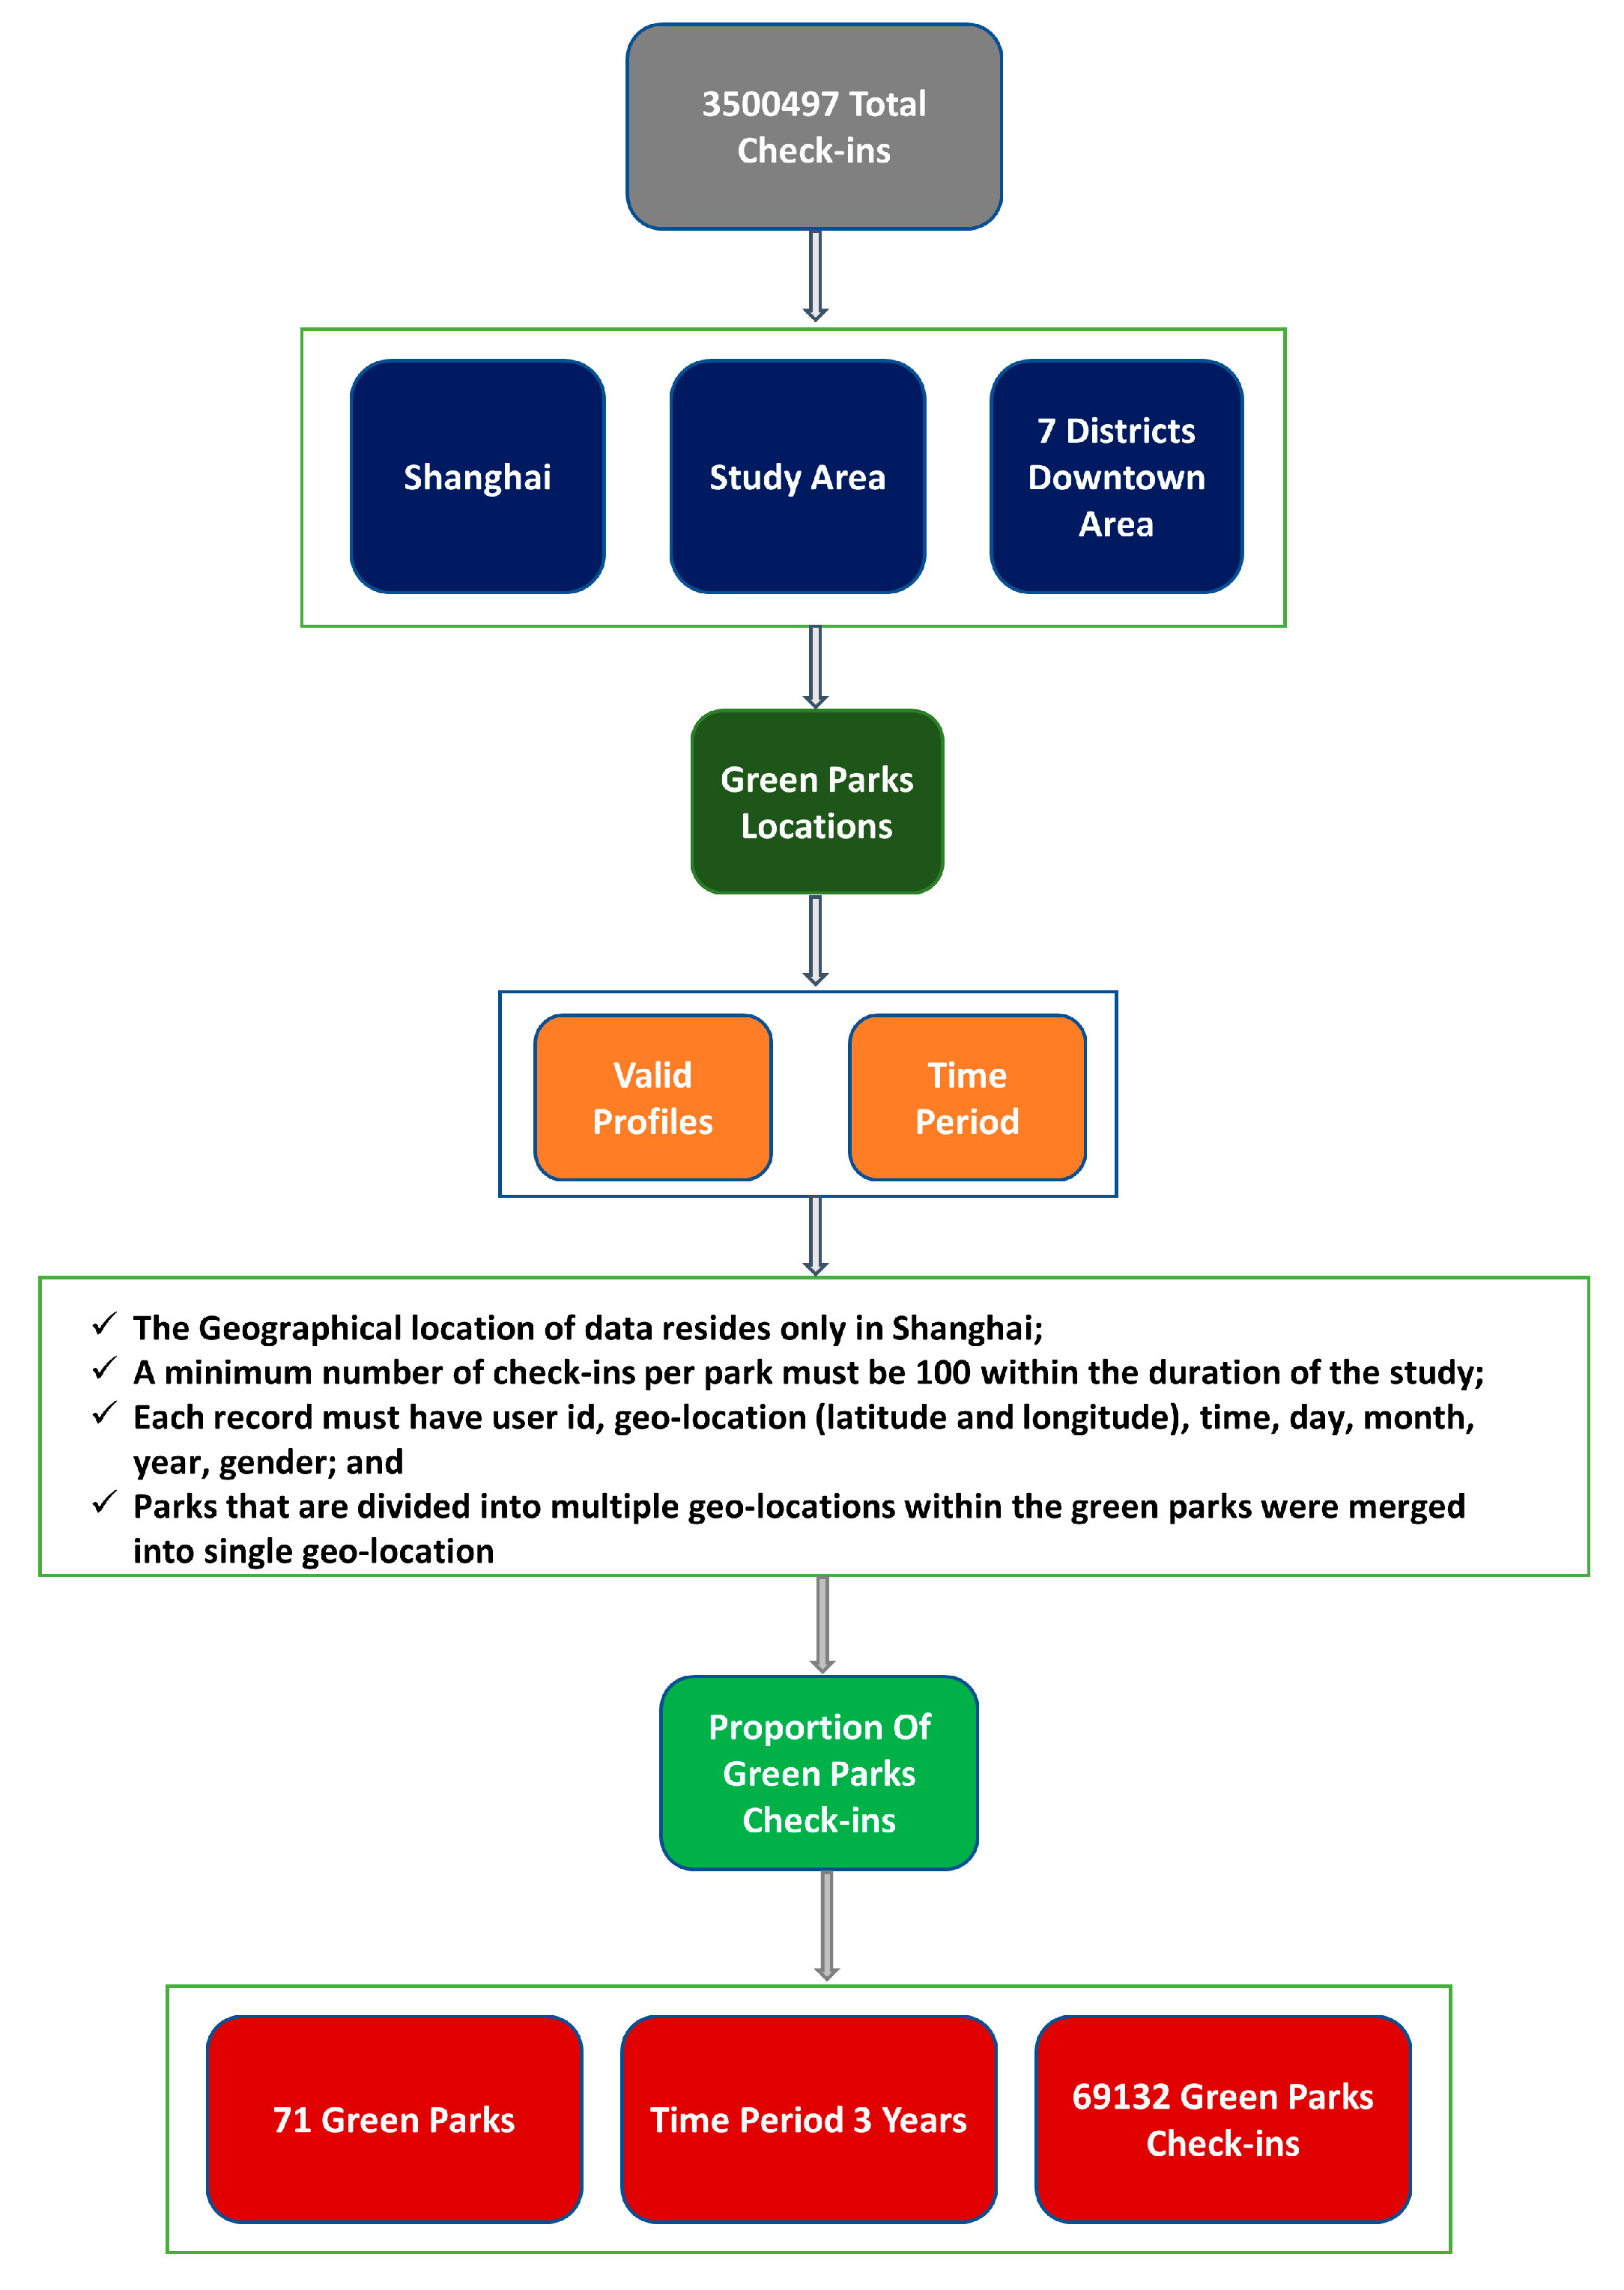
We also collected population data from the census of Shanghai [30] on the districts in the study area, as presented in Table 2. Figure 2 represents the criteria that we deployed for collecting the check-ins.
The Weibo application program interface (API) helps with data collection. After retrieving this location information, we found that some locations we added were not green parks (e.g., sidewalks, former homes of famous people, and sculptures). We checked these locations and removed those that were not in the green park category, but we still counted a part of the parking lot or park areas that were linked. Some larger parks have more than two location IDs—for example, a garden area, kids’ play area, and barbecue area combined into one location ID [31]. After preprocessing, filtration, and cleaning, a total of 69,132 geotagged visits to green parks in 7 districts of Shanghai were included. The data were collected with the help of Python (version 2.7.12).

3. Methodology

3.1. Data Preparation

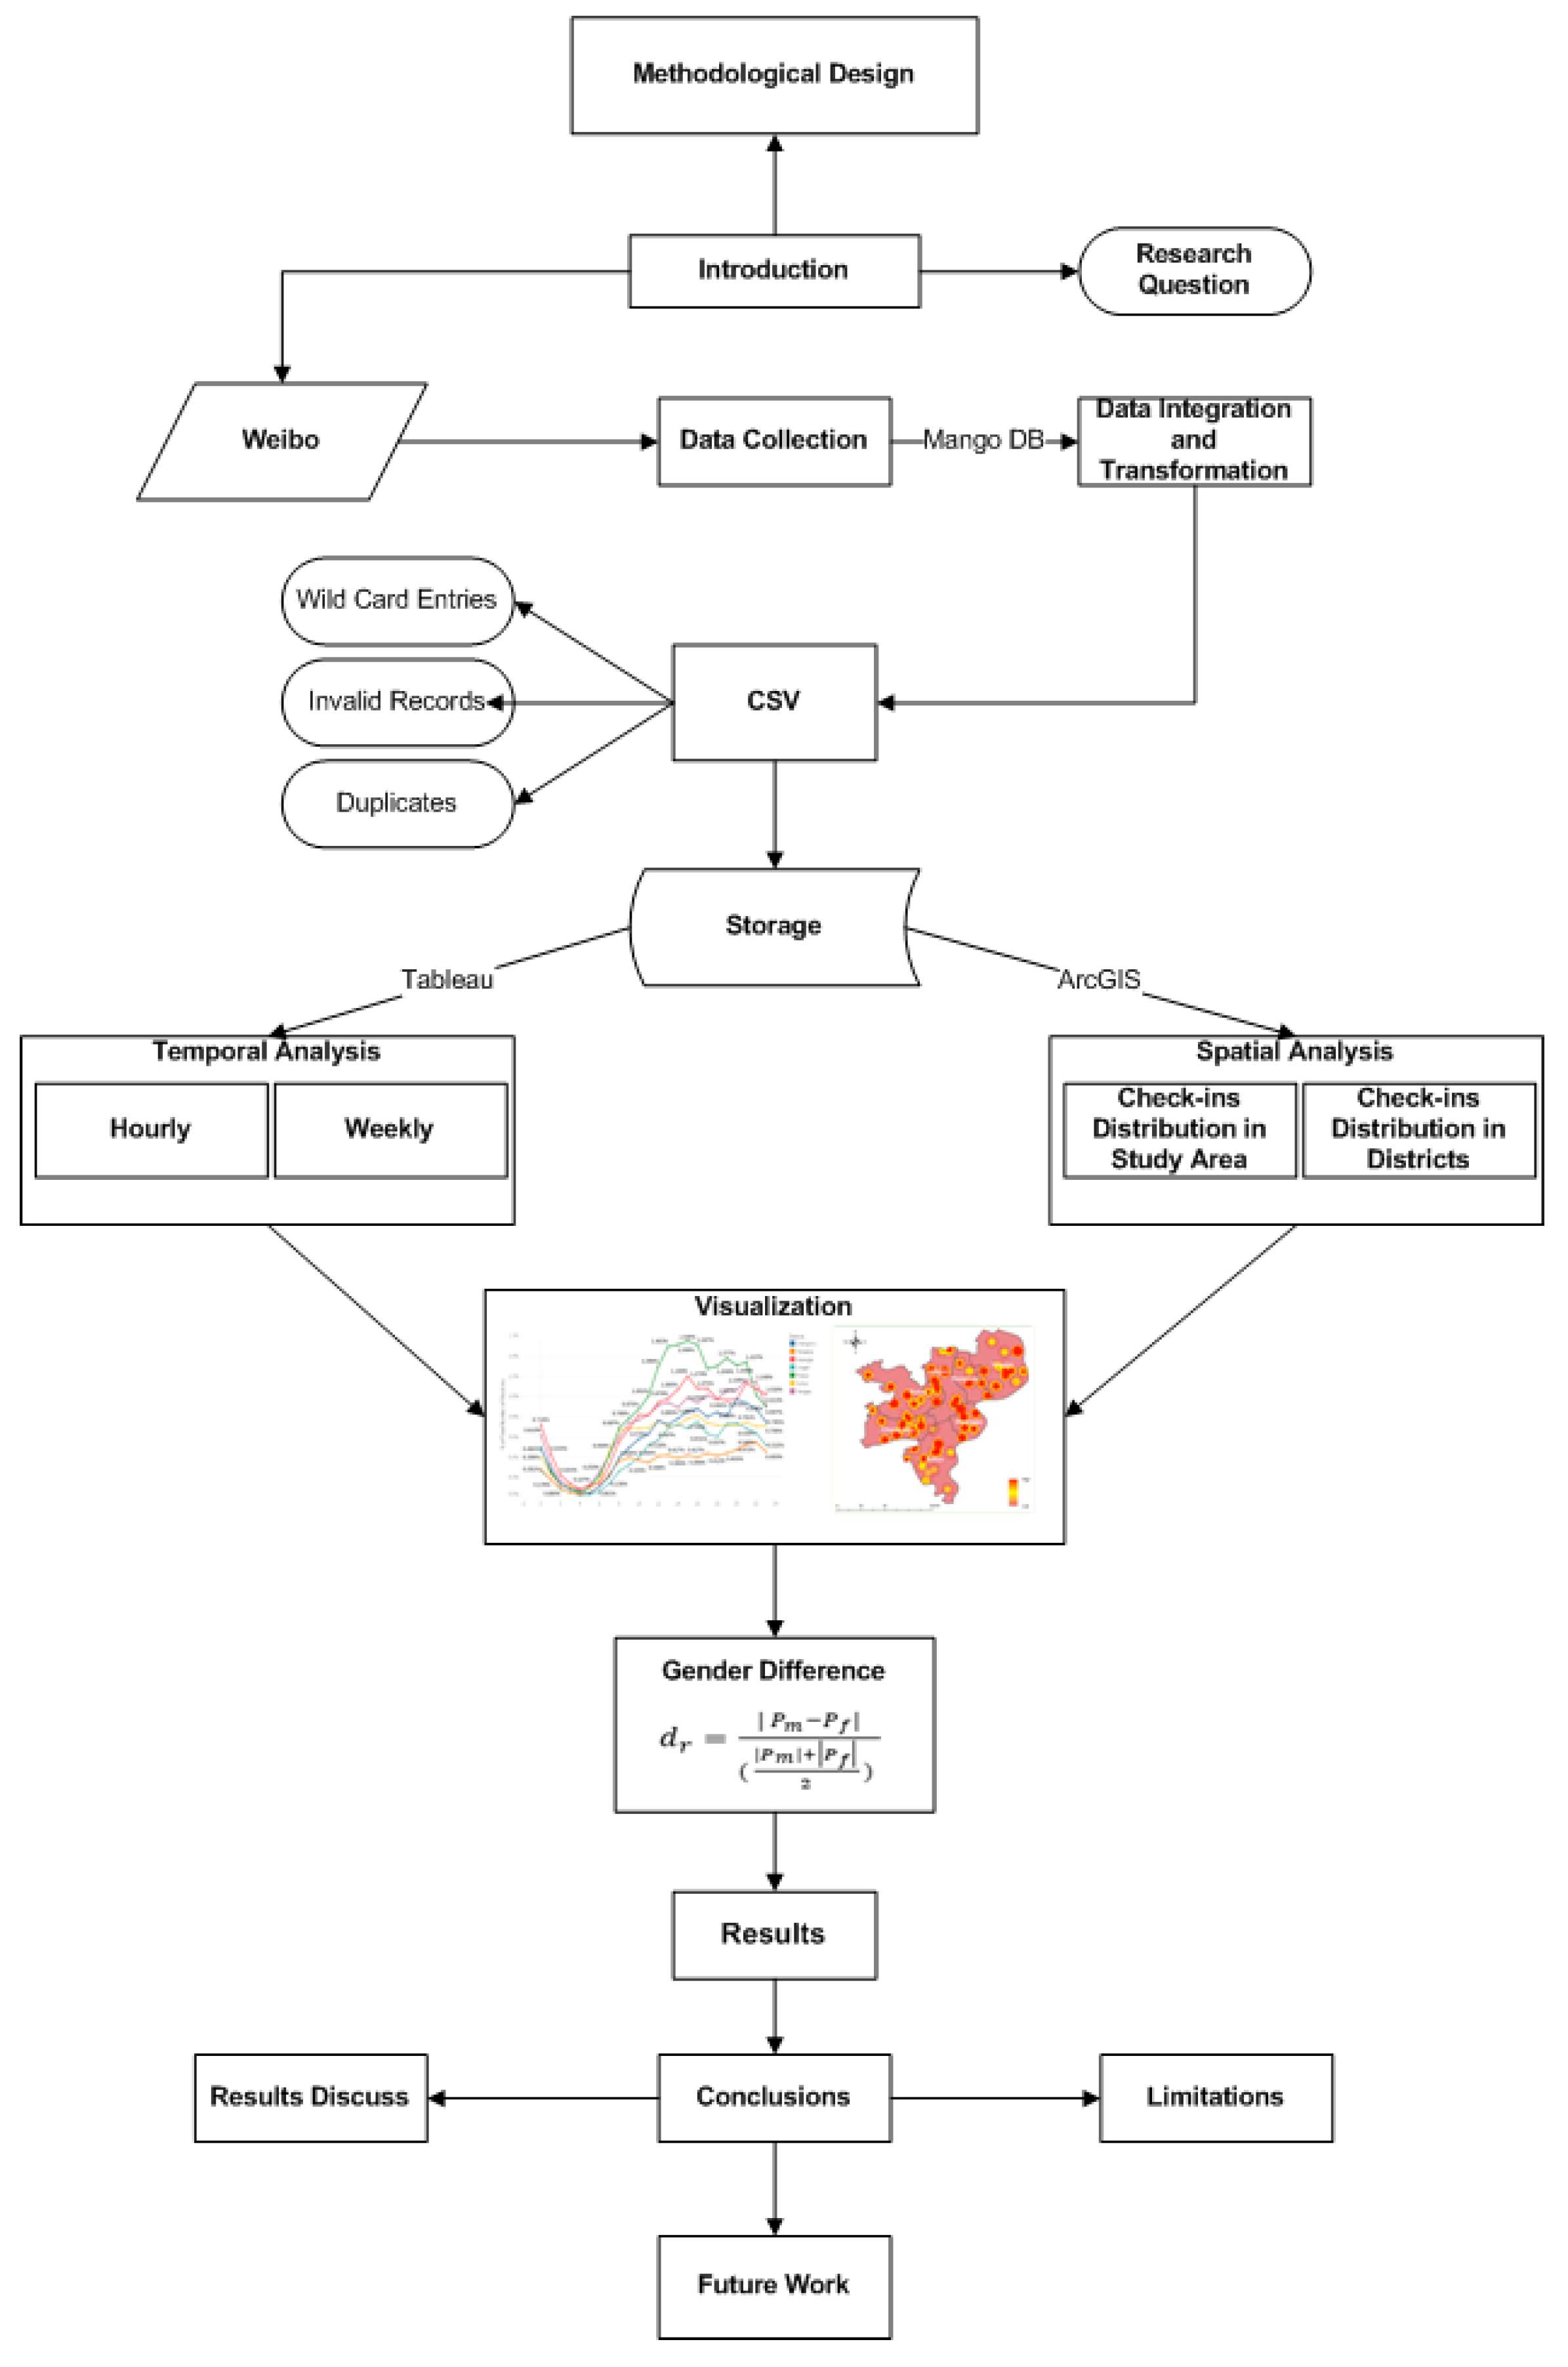
The data that we collected cover all check-ins made within the Shanghai boundary. The data downloaded were included in many JSON files. Figure 3 presents the data preparation process flow.
In this study, the Weibo dataset included a unique user ID, check-in, date, and time. In addition, information about the geographic location (latitude and longitude) and gender were collected through the Weibo API. The LBSN dataset therefore assumes that daily trends are archived of the users’ daily activities, behavior on social media, and spatiotemporal evidence [32]. A typical Weibo check-in is represented as follows: check-in (B2094554D064ABF44293) = {1758115961, ####, B2094554D064ABF44293, Mon July 25 14:47:41 +0800 2016, m, and 121.484566, 31.270601}, where B2094554D064ABF44293 denotes “location_id”; 1758115961 denotes “user_id”; #### denotes “user_name”; Mon July 25 14:47:41 +0800 2016 denotes “day, month, date, time, and year”; m denotes “gender”; and 121.484566, 31.270601 denotes the “geolocation”. Further, JSON is a Java programming platform format that is the most-commonly used data format, although Java is considered to be the main programming language with open-source accessible reader and writer modules. [33,34] Using selected software, the data were filtered into a comma-separated values (CSV) file format, so that all user data, which included the geolocations, could be identified and stored in the database regardless of the publication date. Table 3 shows an example of a check-in in CSV file format.

3.2. Social Media Data Analytics

In this research, we have analyzed Weibo-based geolocation datasets in 7 districts of Shanghai, China (July 2014 to June 2017). Figure 4 shows a check-in behavior analysis framework in which the LBSN data analysis method includes the framework, data preprocessing and cleaning, temporal, and spatial analyses of the LBSN data and statistics to deliver the worth of the LBSN data.

3.3. Temporal Analysis

To track variations in user behavior, we divided time stamps with check-ins into different time classifications. Daily patterns show the hourly distribution of check-ins during the day. First, we divided the timestamps for 24 hours according to check-in data for knowing the peak time of visitors in green parks. Secondly, we divided the check-in data according to numbers for daily stamps to know the accurate visitation rate for weekdays and weekends. We used Tableau 2019.2 for the visualization techniques to explore and analyze the relational databases and data cubes.

3.4. Spatial Analysis

Kernel density estimation is effective in calculating the visitor density spatial structure within the study area. It is a statistical method for estimating a smooth and continuous distribution from a small number of observations. We utilized this method to create a smooth surface density for check-in hot spots in the geographic area. The method is a nonparametric estimation technique for the density of a random sample of data [35] and smooths each data point into small density bumps, after which, all the small bumps are combined to make a final estimation of the density. The KDE method has been widely accepted for spatial distribution [36,37,38]. It describes the spatial density distribution combined with the distance-decay effect and projects the hotspots by transforming scatter point data into a continuous density surface [39]. The KDE technique is an evolving spatiotemporal means that has previously been used [40,41,42] to inspect several features of social media (but not restricted to LBSN) data analytics such as users’ online activity and movement trends [43], check-in behavior [44], city boundary descriptions [45,46], and point-of-interest recommendations [47]. It also explores the distribution of destinations in communities, enabling researchers to see where there are densely scattered destinations and where they are more scattered. Eventually, this seeks to create a smooth surface of density within the geographical space of spatial point cases [33]. The authors utilized the KDE method for the analysis of spatiotemporal patterns in green parks [48]
The data taken into account in our analysis are in the form of geotagged check-ins. Let “E” be a collection of historical data for check-in; that is, E = {e1, ……, en}, where ei = < x, y > is a check-in geolocation 1 < i < n of individual i and on time “t", where “E” represents the dataset we used. The total of the kernel’s functions is scaled to construct a smooth curve that is a unit field. This results in a bivariate of KDE in the following form:
  f K D ( e | E , h ) = 1 n   i = 1 n K h ( e , e i )
  K h = 1 2 π h exp ( 1 2 ( e , e i ) t h 1 ( e , e i ) )
where “e” denotes the check-in location in dataset “E”, along with bandwidth “h”; “h” is supposed to be reliant on the estimated density “fKD”, producing a smooth density surface around “E” at the data point “ei”.
ArcGIS 10.0 was used to evaluate the spatial distribution of the check-ins in space. We used ArcGIS 10.0 (Environmental Systems Research Institute, Inc., Redlands, CA, USA) software with a Shanghai map developed in 2016 using the WGS 1984 geodesic coordinate system. The base map also included major transportation lines (line layer) and administrative districts (polygon layer and district layers) with new OpenStreetMap subway lines and entries (point layer).

4. Results

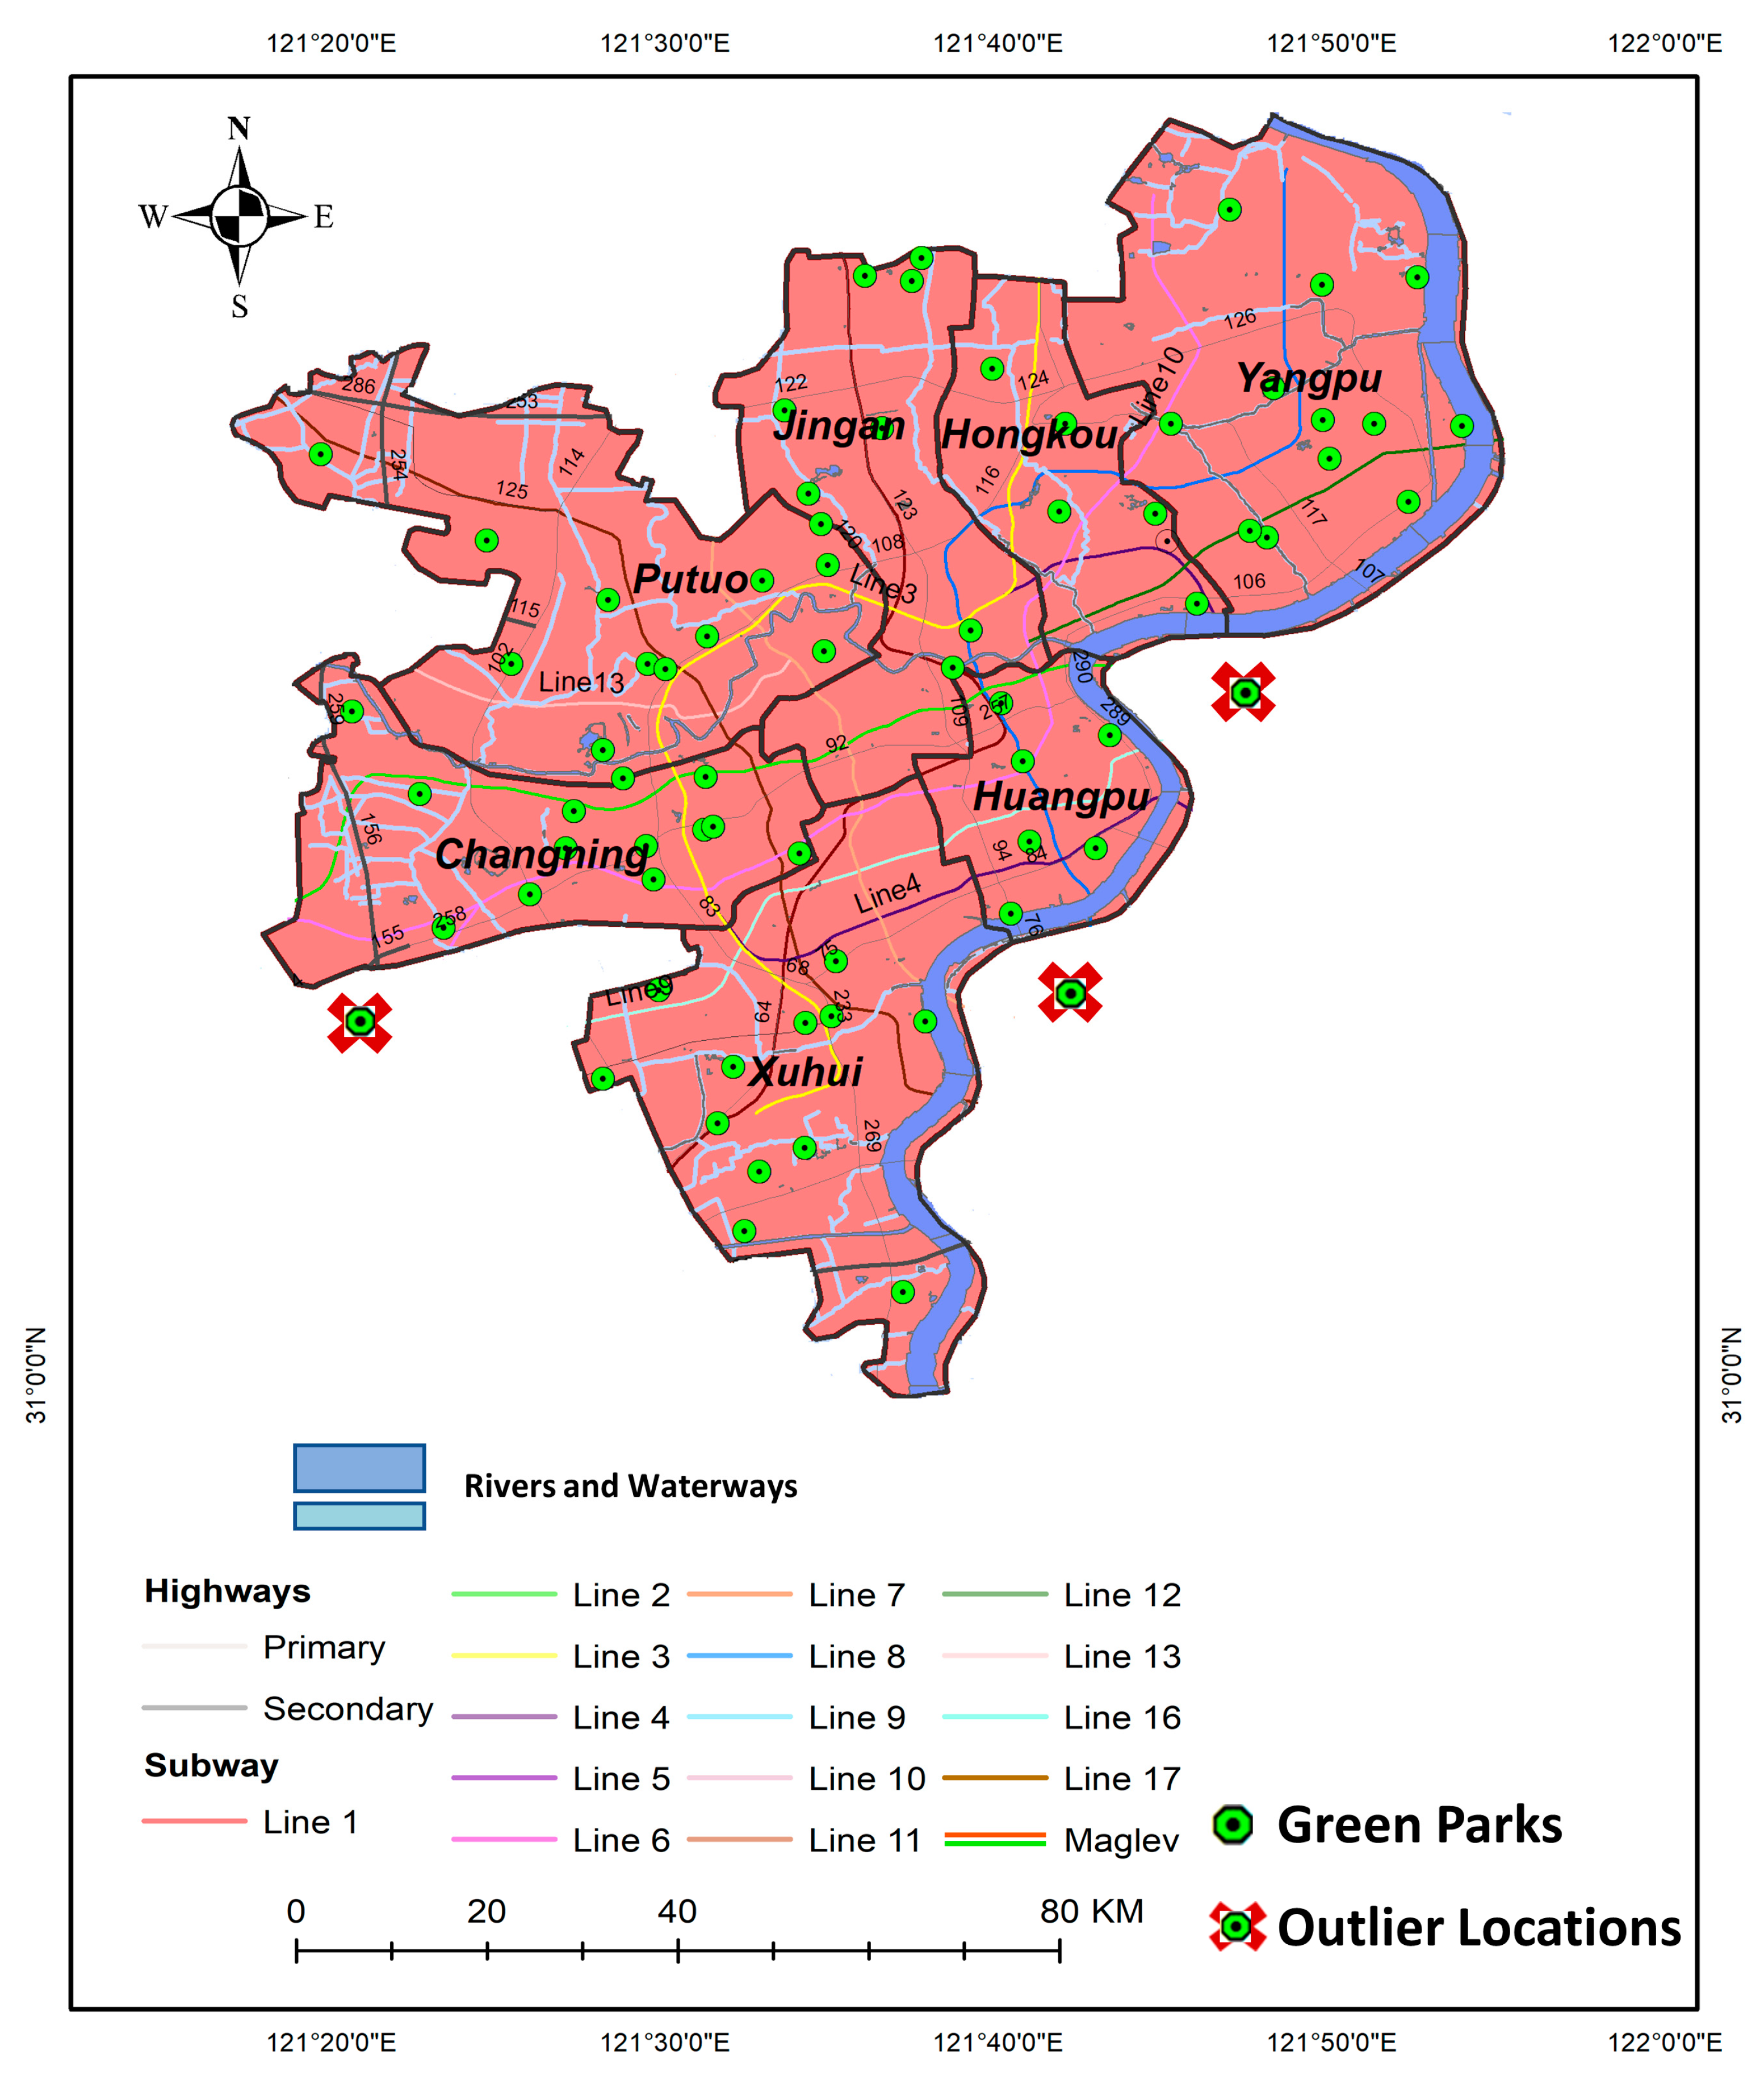
For this analysis, 71 green parks locations were chosen after processing the data collected from Weibo in the city center. The distribution of different green parks included in this research is shown in Figure 5.
As can be seen, there are some outlier locations. We had a dataset of Shanghai, and our study area was based upon the city center, which is why there were some outlier locations that came with the overall Shanghai check-ins. However, after filtration, only locations within the study area were chosen. As per the requirements and for significance, the locations that were among the study area criteria of seven districts (Changning, Hongkou, Huangpu, Jingan, Putuo, Xuhui, and Yangpu) are represented in Figure 6.
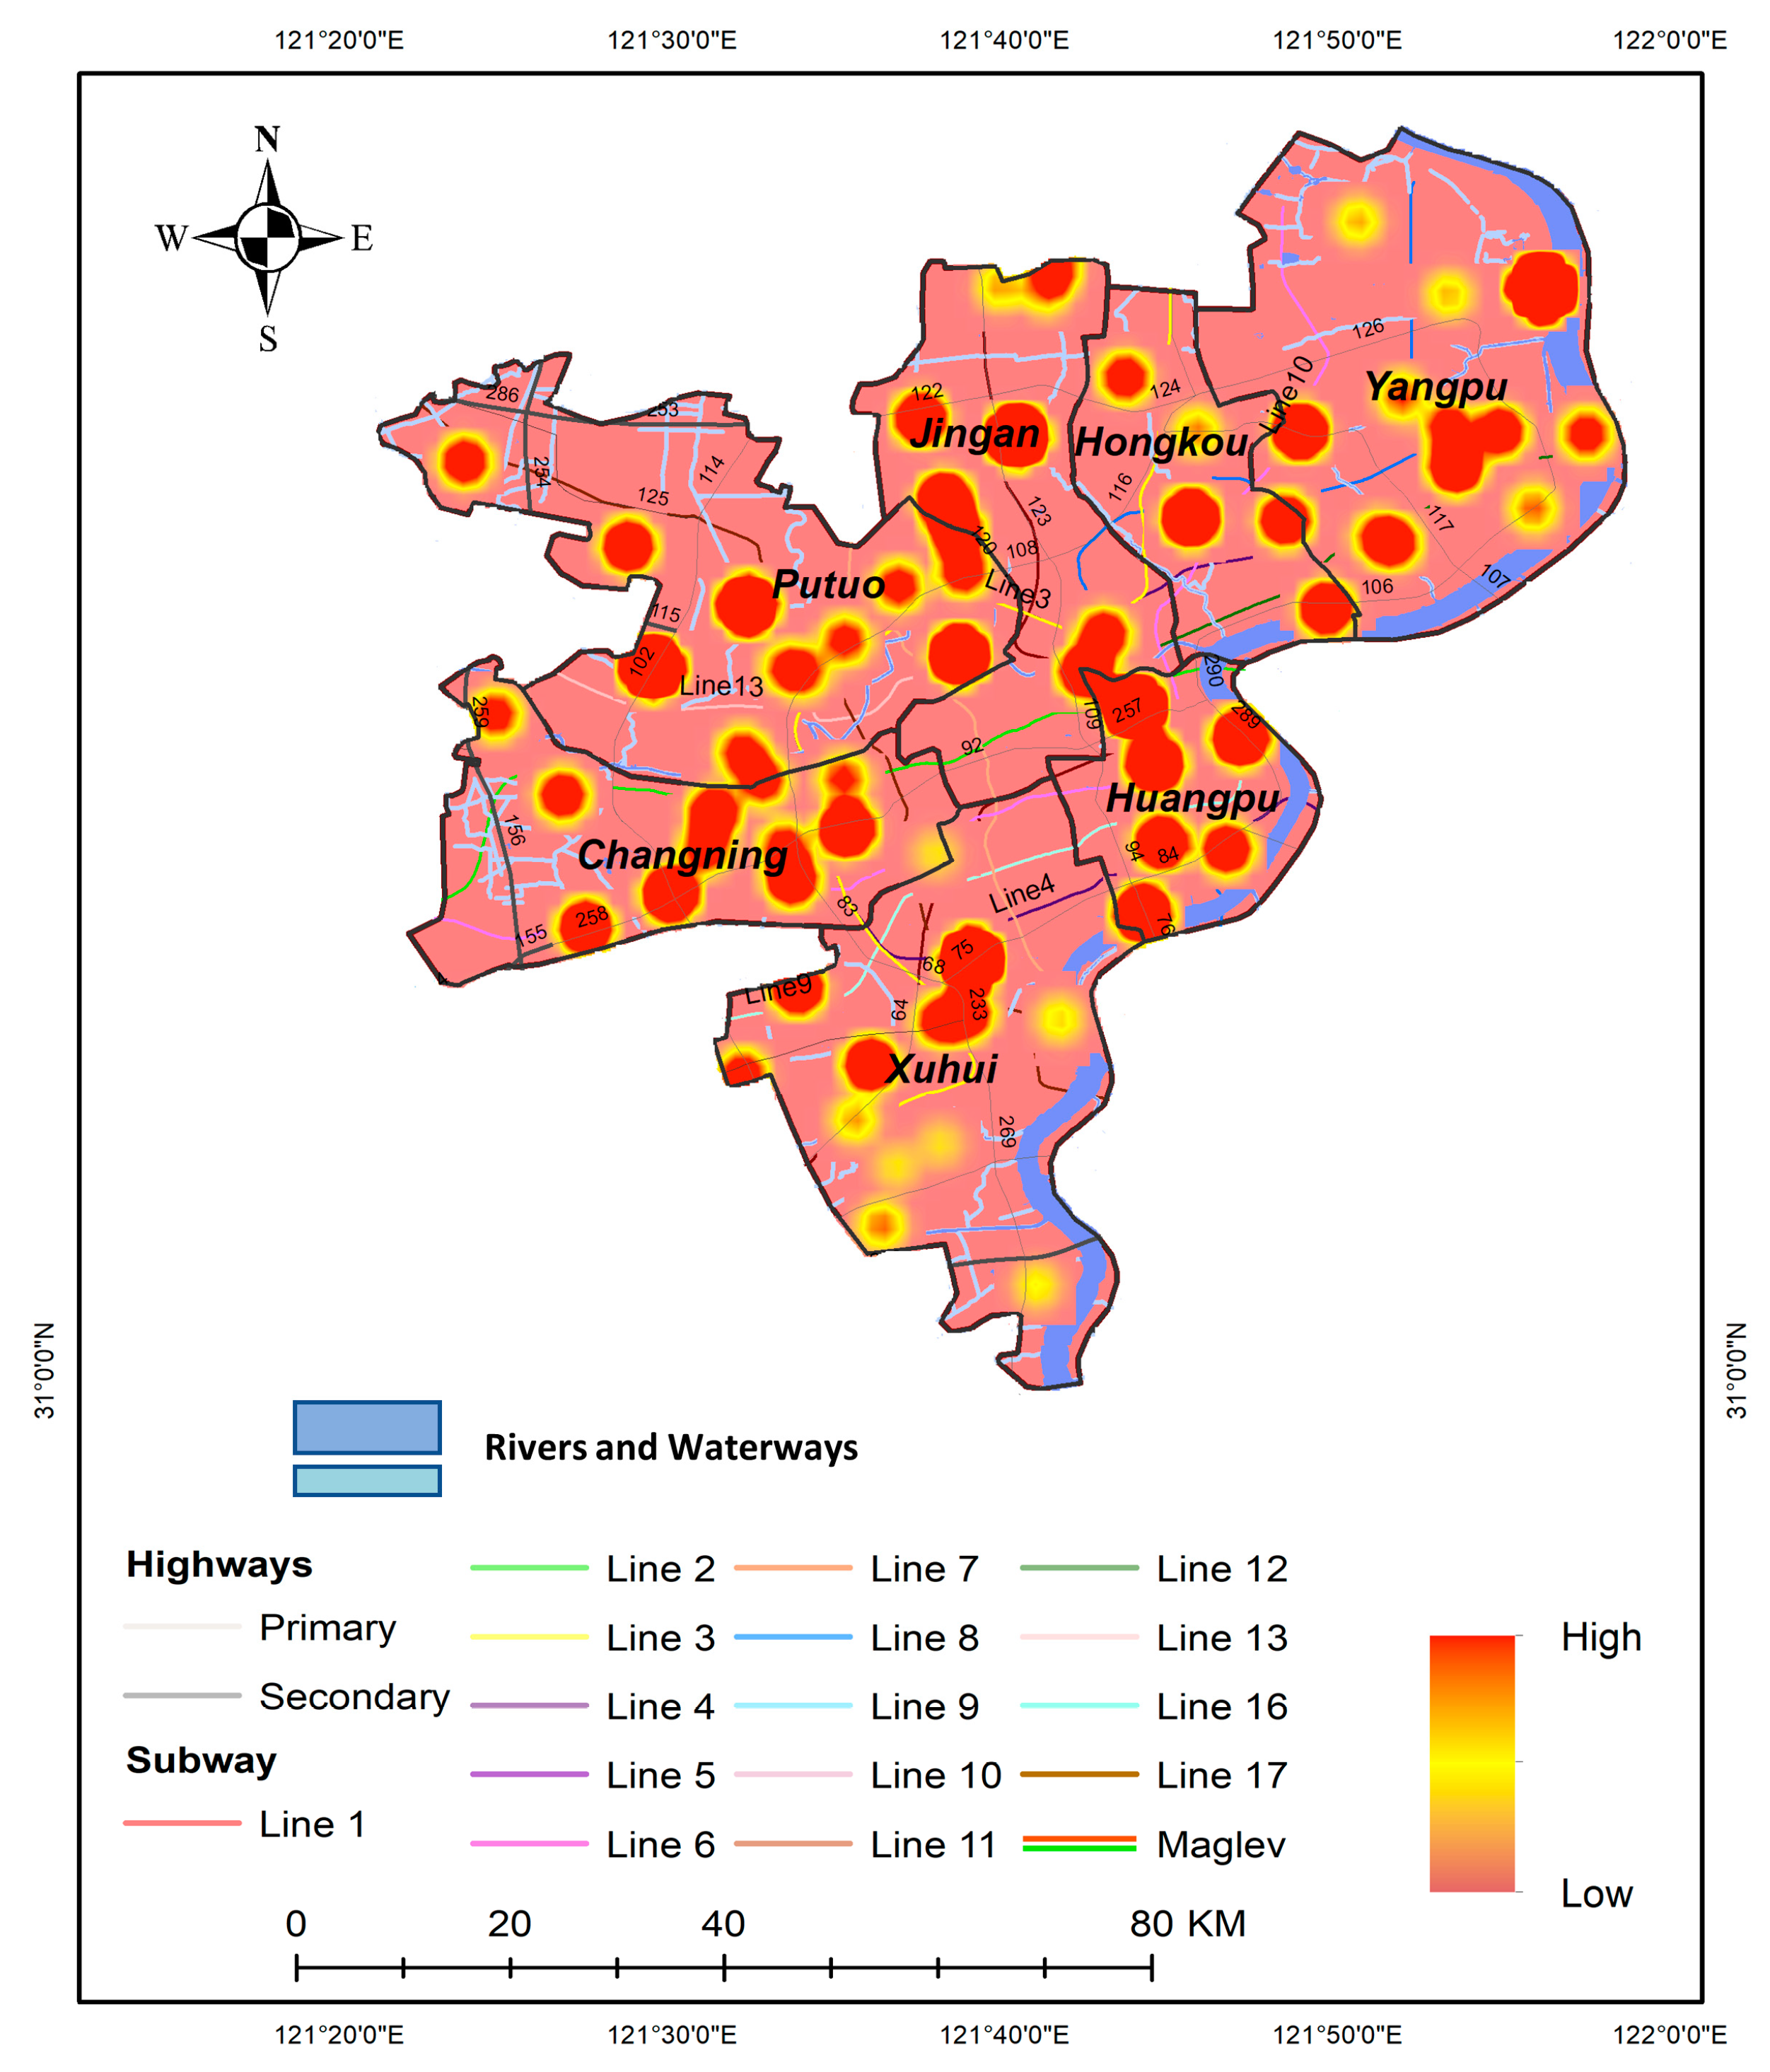
We utilized KDE to examine the spatial distribution of check-in data and ArcGIS for visualization to investigate the Weibo geolocation check-in data. Figure 7 indicates the overall check-in density between July 2014 and June 2017. The red spots show higher human density, higher levels of activity, and a higher percentage of social media usage. It is unsurprising that the green parks in Putuo District have large clusters of activities.
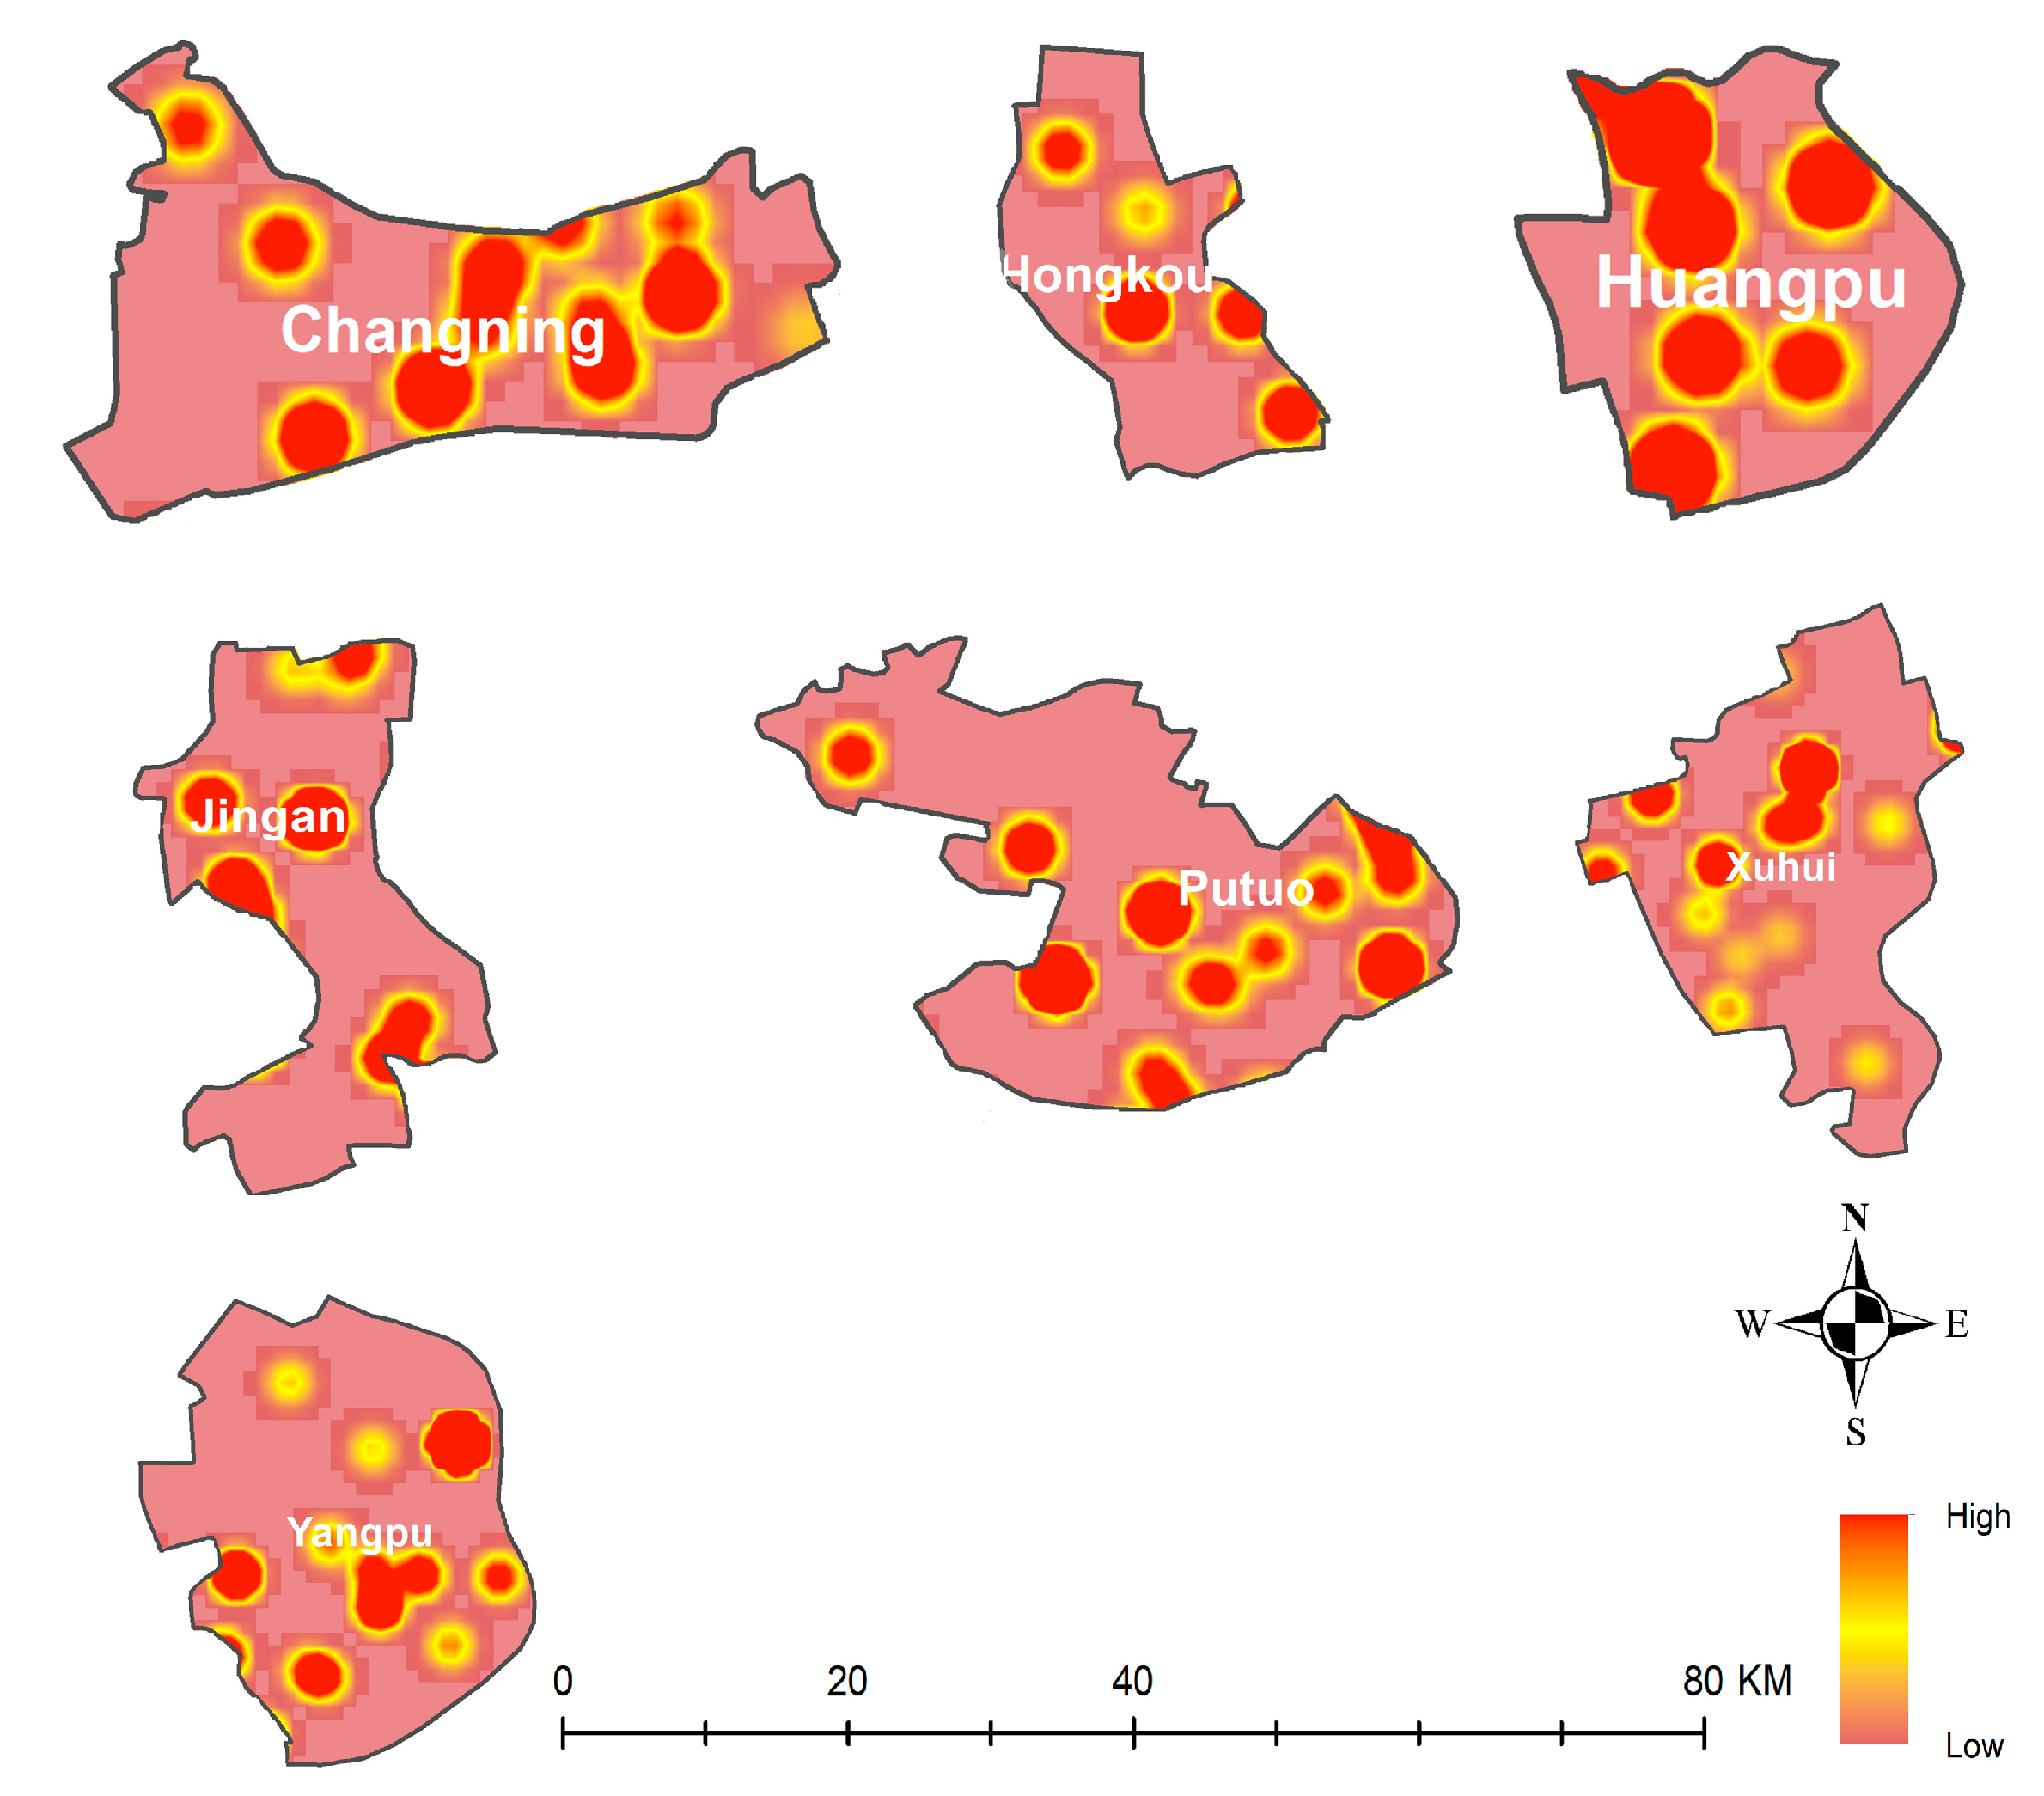
Figure 8 presents the overall check-in density in all the districts, which has been divided into seven. Our results show that the most check-ins were found in Putuo, Huangpu, and Yangpu Districts.
Figure 9 shows the temporal differences in the number of visitors over 24 hours. Although visitors contributed in all periods of the day, the maximum number of check-ins were made between 2:00 p.m. and up to 6:00 p.m. in the parks considered in the research. The trend keeps increasing until between 10:00 p.m. and midnight.
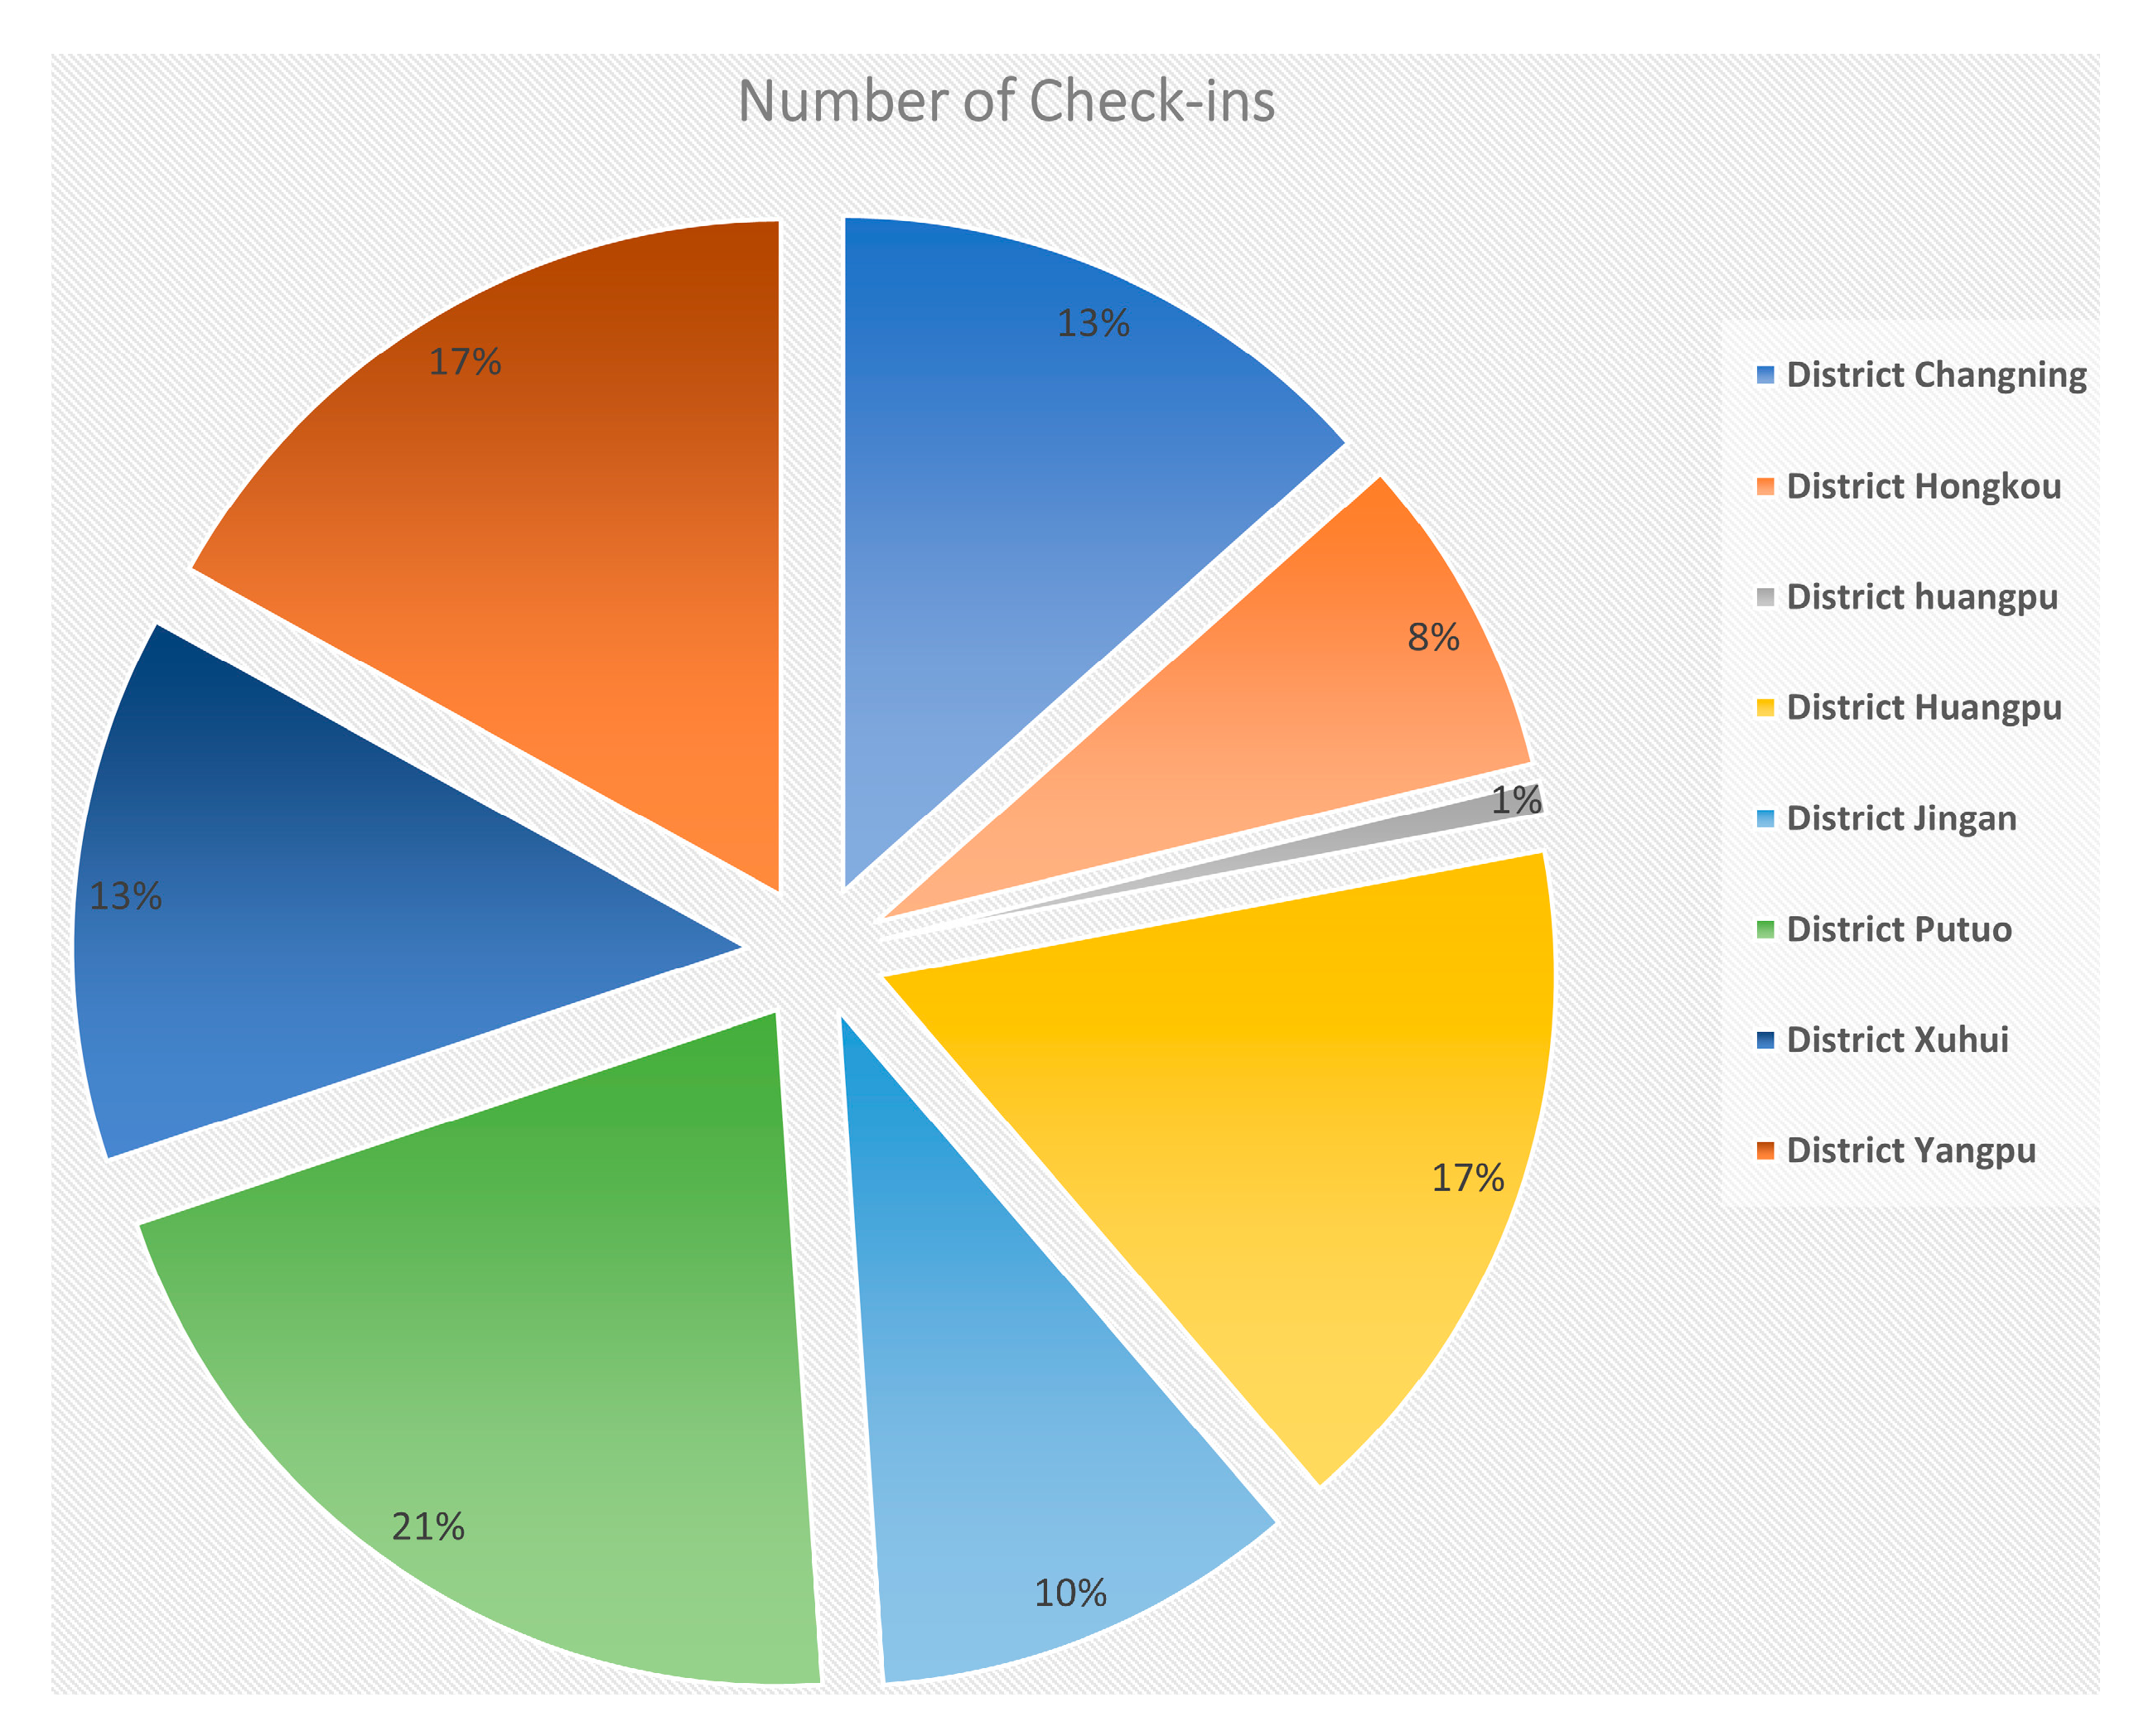
Figure 10 shows the district percentage for the three-year check-in dataset in the downtown area of Shanghai, revealing the differences in the check-in behavior of users in different districts. The number of check-ins in Putuo and Huangpu were really high compared to other districts, which makes Putuo District famous for visitors, which is why the density was high in this district compared to others. The reason for this is that Putuo District is larger in area, and population is also higher than other districts, which is why Putuo District is denser than others.
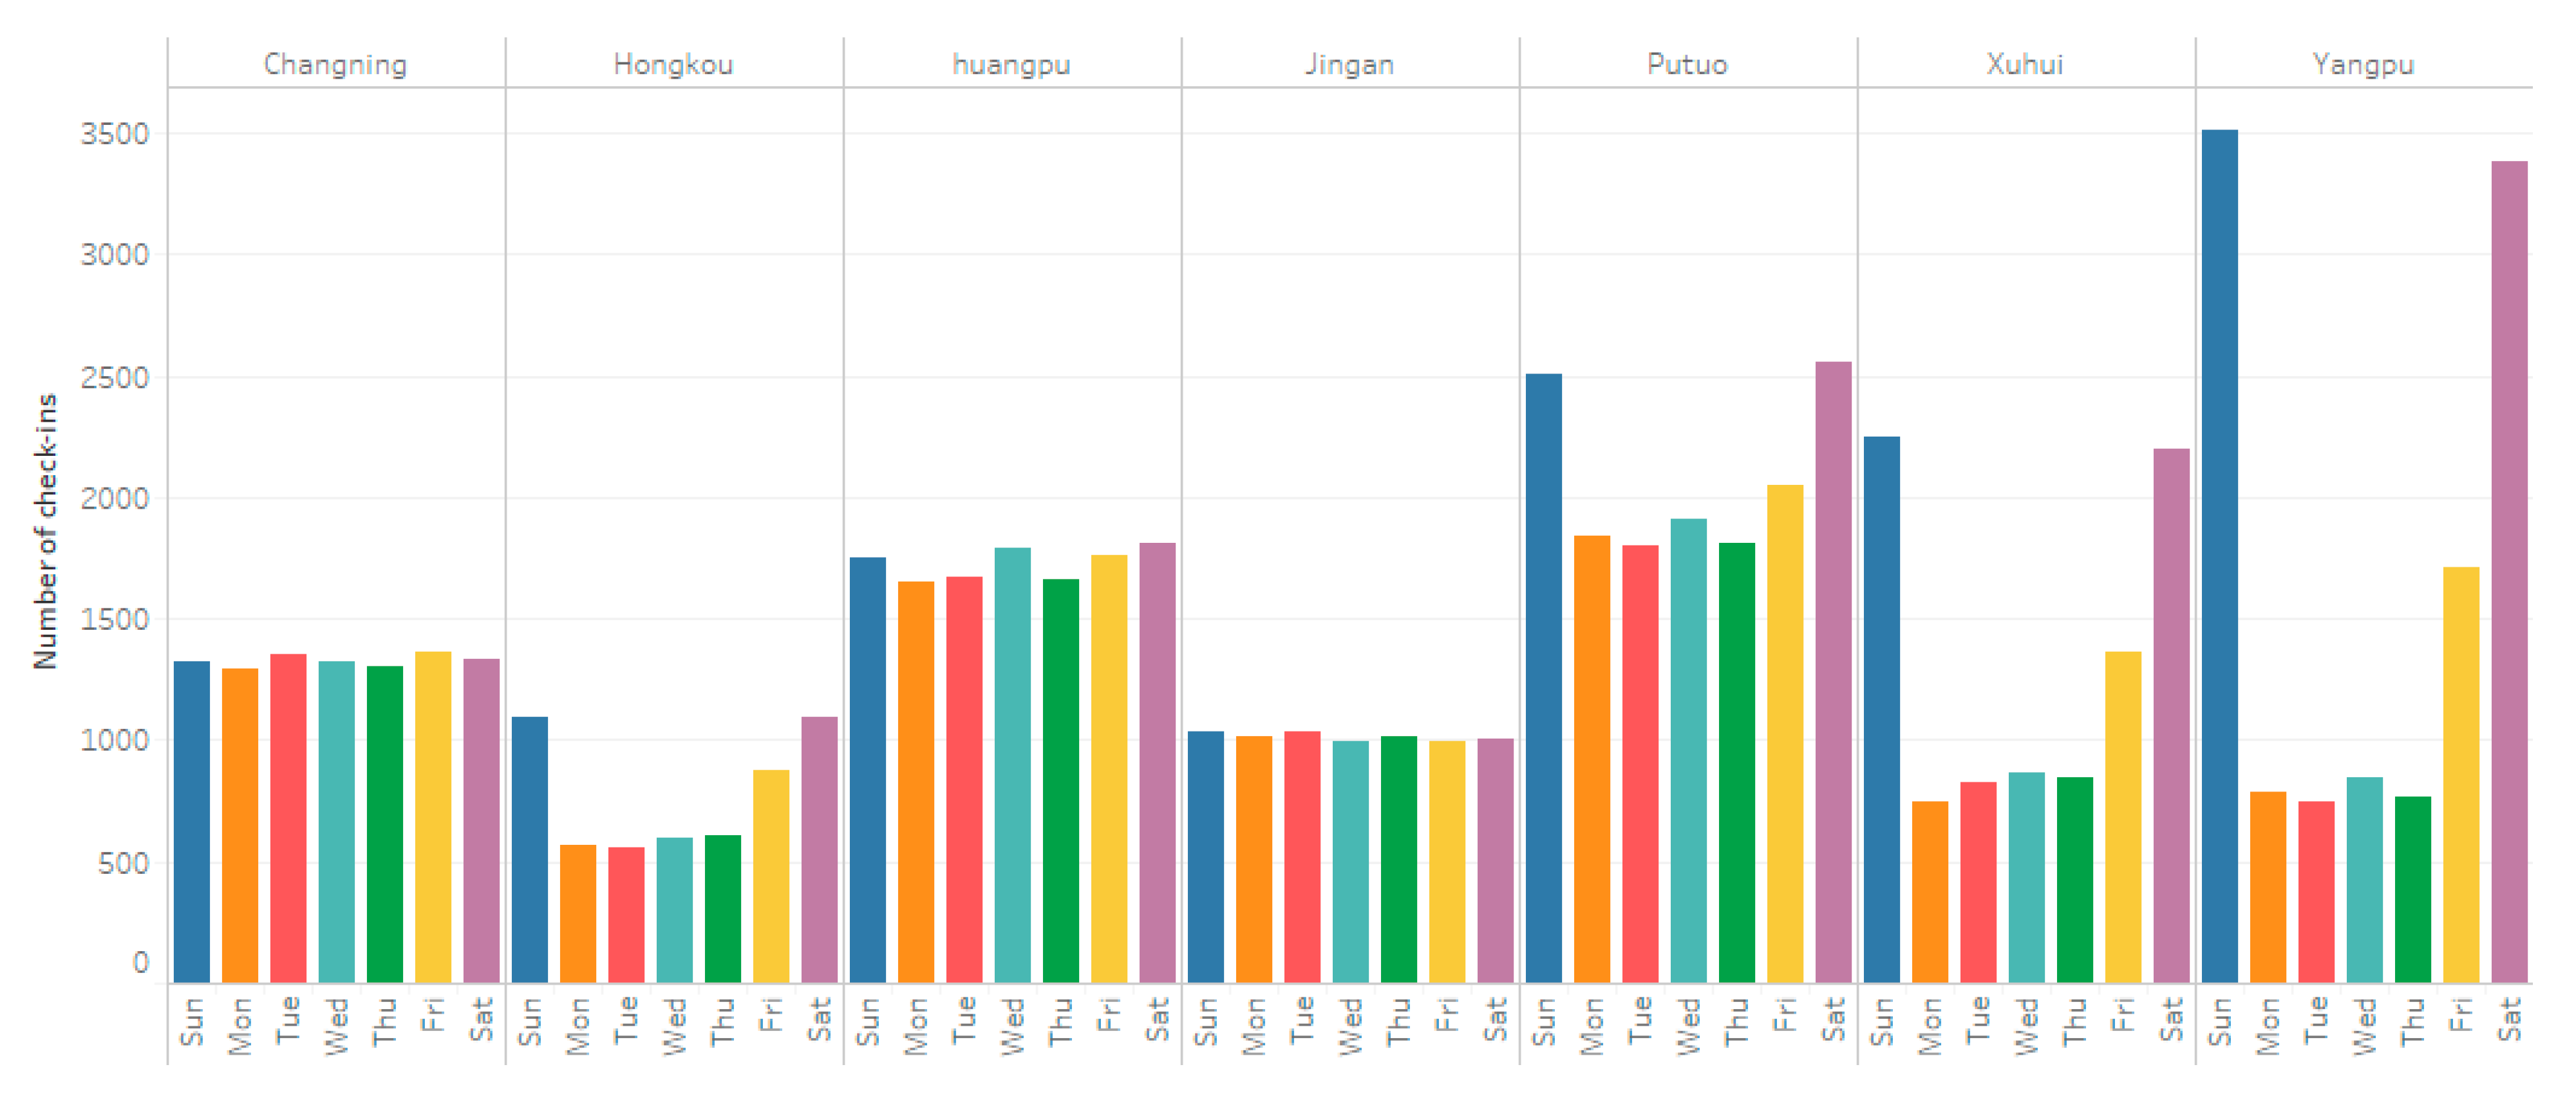
With nearly an equal number of check-ins, every weekday has fewer check-ins than Saturday and Sunday, and the weekly patterns are quite normal. Figure 11 describes the general pattern of weekly check-ins. On weekends, the number of check-ins is high in Yangpu District compared to the others. It reveals that mostly of the check-ins found on weekends (Saturday and Sunday) in every district. The interesting thing to note here is that Yangpu and Putuo Districts have higher numbers of check-ins on weekends but lesser visitation rates on weekdays.
This result indicates that Shanghai’s green parks are fast becoming popular recreational destinations for the people of Shanghai. Figure 12 shows the most popular parks in our study area based on the number of check-ins. Mostly people visit these parks in the city center and share their experience by posting on Weibo. Table 4 also represents the number of check-ins in famous parks.
Table 5 shows the number of check-ins for the districts, days, and gender.
We investigated gender (male and female) data in Shanghai to explore the check-in numbers and behavior. A comparison of male and female user check-ins in days of the week, as well as in districts, examines the difference between male and female visitors in Shanghai. We used the relative difference (dr) [48,49] to estimate the gender differences in Shanghai districts and also for days of the week. It is frequently used as a quantitative indicator of superiority control and quality guarantee and is stated as follows:
d r = |   P m P f | (   | P m | + | P f | 2   )  
Table 6 and Table 7 show the results of the relative difference calculated by using differences between male and female users in a week, and districts are pragmatically shown at the cumulative level. We calculated the gender differences of check-ins by the week and district as a percentile of total accumulated check-ins generated during the course of the study. Table 6 shows the outcomes of the relative difference computed in a week using Equation (3). For Friday and Saturday, the comparative difference values were substantially higher than other days. Table 6 reveals that gender differences of Friday, Saturday, and Sunday are higher than the other days, and likewise, Table 7 shows the outcomes of the relative difference computed in districts, and it reveals that gender differences in Putuo, Xuhui, and Yangpu Districts are higher.
The gender differences in the districts and days is also represented in Figure 13.

5. Discussion

This study used geolocated social network check-in data as a proxy for estimating the number of visits to urban parks. This approach is time-efficient and labor-intensive and provides outstanding spatial coverage. In this research, we performed a temporal analysis of sex-based variations in human behavioral patterns to investigate trends of hourly and daily check-ins, along with weekdays and weekends. The findings revealed that women are much more likely to use social media throughout the weekdays compared to men in almost all districts. In the city center, Putuo District was found to have a high density of check-ins. As the research shows, Weibo data constitute a valuable tool for the evaluation of urban green park functionality and the study of spatiotemporal factors. The advantage of using social media data to evaluate urban green spaces is that we can collect contextual and large-scale knowledge about an entire city in more detail. For this reason, Weibo data are the best source for geospatial data analysis.
The kernel density estimation is a tool for determining the probability density function and is a must-have that allows the user to examine the distribution of probability studied better than when using a traditional histogram. The kernel technique, unlike the histogram, provides smooth estimation, uses the locations of all sample points, and, more convincingly, implies multimodality. KDE is a function in which events are balanced according to their distances and necessary two parameters. The first of these is the bandwidth, the distance of control. Bandwidth selection has a big effect on performance. The second parameter is the weighting function K, most often a normal function. The bandwidth of the kernel is a free parameter that displays a strong impact on the resulting estimate. Compared to the commonly used histogram, the estimator of kernel density offers many advantages. It is a smooth curve and, therefore, better displays the details and uses the locations of all sample points, so the information included in the sample should be better revealed. KDE calculates smooth distributions by excluding the local noise to a particular degree, which minimizes the error by providing a nonparametric probability distribution with an optimum bandwidth. We applied the kernel density estimation in green parks, and according to our Weibo data, the number of check-ins in Putuo and Huangpu Districts are higher than the other districts, and it can been seen that, after applying the KDE, we have same results that makes Putuo and Huangpu denser than others due to large clusters of density. For example, we can also get the better results by applying the KDE if we take a mean number of people in two or more than two parks. The role of the DKE in green spaces and the environment are really important and have been used by many researchers in the research of green parks [31,50,51].
Availability of the data is the main barrier in LBSN studies, mostly due to security and personal privacy. Sharing the present geolocation of visitors and their social circle using LBSNs creates serious issues over individual confidentiality. Personal information is an issue not only for individuals but, also, for institutional or organizational employers who share their information on LBSNs. Quite often, users share their personal data on a voluntary basis, whereas, at other times, data could be collected extrinsically by giving users various incentives and benefits for their details. User locations could be recognized by LBSN services like Google Latitude, Fire Eagle, and WeChat Nearby. Several LBSN services offer additional features that recognize the location of your friend as well [25]. In summary, as the check-in data is too raw and imprecise for assessing the transfer of activities from one location to another, the data cannot reliably reflect the precise nature of district user progression.
This methodology has its own limitations, but, because we cannot access measured visitor rates, we have been unable to determine if there was a healthy association between the check-in and visitation data observed in the urban-area planning and evaluation. Unlike conventional census data, it is of major consideration that social media data usually do not include clear information such as ethnicity and family status. There are, however, ways to obtain these indirectly [34]. The relationship between Weibo’s check-in frequency and actual visitation can vary throughout green parks. The factors affecting the changing conduct of urban behavior in space and time should be investigated. This study’s extensive spatial scope offers valuable knowledge that could boost urban green space planning and growth in other major cities. With the effective use of urban green areas, there is considerable potential to promote moderate-to-strong physical activity among urban residents. These findings highlight the importance of using urban green parks to boost the health of people living in cities all over the world.

6. Conclusions and Future Work

In this study, we applied a big data methodology to overcome the issue of environmental justice linked to the spatial provision of urban green parks in Shanghai. We utilized geotagged Weibo check-in data as park visit indicators in seven districts of Shanghai, which are called the city center or downtown area, and investigated the number of check-in visits. We achieved an in-depth experimental analysis of check-in behavior that used intensity maps and patterns from LBSN data. The findings reveal the distribution of users in parks by check-in data and show that Weibo data is feasible for this study, because it has a lot of potential compared to traditional data. The outcomes show that Putuo District is the center of activities according to the number of check-ins. The total number of Weibo users, depending on the hour of the day, shows that the peak time of visits to green parks is from noon to midnight. We also explored the famous parks in our study area, which are mostly situated in Putuo and Xuhui Districts. Lastly, gender-based variations were measured in green park visitors, and findings reveal that female visitors or users are more involved in their use of social media services when visiting green parks. Our results also show that visitors visit the green parks until midnight, so planners should pay more attention to the facilities and also boost up the surveillance system, because there are some park-like forests where there could be some security concerns. Using medical data with this type of data has great significance, because green parks provide a healthy environment and a place where visitors can engage in different types of activity.

Author Contributions

Qi Liu, Hidayat Ullah, and Wanggen Wan conceived the research; Hidayat Ullah and Saqib Ali Haidery designed the research; Hidayat Ullah, Saqib Ali Haidery, Qi Liu, Tong Qu, and Li Hou performed the simulations; Hidayat Ullah, Saqib Ali Haidery, and Qi Liu wrote the article; and Wanggen Wan and Zhangyou Peng proofread the article for language editing. All authors have read and agreed to the published version of the manuscript.

Funding

This work was supported by the project of Shanghai Science and Technology Commission (No: 18510760300), Anhui Natural Science Foundation (No: 1908085MF178), and Anhui Excellent Young Talents Support Program Project (No: gxyqZD2019069).

Conflicts of Interest

The authors declare no conflict of interest.

References

  1. Cetin, M. Determining the bioclimatic comfort in Kastamonu City. Environ. Monit. Assess. 2015, 187, 640. [Google Scholar] [CrossRef] [PubMed]
  2. Lee, A.; Maheswaran, R. The health benefits of urban green spaces: A review of the evidence. J. Public Heal. 2010, 33, 212–222. [Google Scholar] [CrossRef] [PubMed]
  3. Haq, S.M.A. Urban Green Spaces and an Integrative Approach to Sustainable Environment. J. Environ. Prot. 2011, 2, 601–608. [Google Scholar] [CrossRef] [Green Version]
  4. Amoly, E.; Dadvand, P.; Forns, J.; López-Vicente, M.; Basagaña, X.; Julvez, J.; Alvarez-Pedrerol, M.; Nieuwenhuijsen, M.J.; Sunyer, J. Green and Blue Spaces and Behavioral Development in Barcelona Schoolchildren: The BREATHE Project. Environ. Health Perspect. 2014, 122, 1351–1358. [Google Scholar] [CrossRef] [PubMed]
  5. Hand, K.L.; Freeman, C.; Seddon, P.J.; Recio, M.R.; Stein, A.; Van Heezik, Y. The importance of urban gardens in supporting children’s biophilia. Proc. Natl. Acad. Sci. USA 2017, 114, 274–279. [Google Scholar] [CrossRef] [PubMed] [Green Version]
  6. Richardson, E.A.; Pearce, J.; Mitchell, R.; Kingham, S. Role of physical activity in the relationship between urban green space and health. Public Health 2013, 127, 318–324. [Google Scholar] [CrossRef] [PubMed] [Green Version]
  7. Zhou, W.; Wang, J.; Cadenasso, M. Effects of the spatial configuration of trees on urban heat mitigation: A comparative study. Remote Sens. Environ. 2017, 195, 1–12. [Google Scholar] [CrossRef]
  8. Cohen, D.A.; Marsh, T.; Williamson, S.; Derose, K.P.; Martinez, H.; Setodji, C.; McKenzie, T.L. Parks and physical activity: Why are some parks used more than others? Prev. Med. 2009, 50, S9–S12. [Google Scholar] [CrossRef] [Green Version]
  9. Wendel, H.E.W.; Zarger, R.; Mihelcic, J.R. Accessibility and usability: Green space preferences, perceptions, and barriers in a rapidly urbanizing city in Latin America. Landsc. Urban Plan. 2012, 107, 272–282. [Google Scholar] [CrossRef]
  10. Tenkanen, H.; Di Minin, E.; Heikinheimo, V.; Hausmann, A.; Herbst, M.; Kajala, L.; Toivonen, T. Instagram, Flickr, or Twitter: Assessing the usability of social media data for visitor monitoring in protected areas. Sci. Rep. 2017, 7, 17615. [Google Scholar] [CrossRef] [Green Version]
  11. Wood, S.A.; Guerry, A.D.; Silver, J.M.; Lacayo-Emery, M. Using social media to quantify nature-based tourism and recreation. Sci. Rep. 2013, 3, 2976. [Google Scholar] [CrossRef] [PubMed]
  12. WHO Regional Office for Europe. Urban Green Spaces and Health; WHO Regional Office for Europe: Copenhagen, Denmark, 2016. [Google Scholar]
  13. Nawrocka, A.; Mynarski, W. Objective Assessment of Adherence to Global Recommendations on Physical Activity for Health in Relation to Spirometric Values in Nonsmoker Women Aged 60–75 Years. J. Aging Phys. Act. 2017, 25, 123–127. [Google Scholar] [CrossRef] [PubMed]
  14. Roberts, H.V. Using Twitter data in urban green space research: A case study and critical evaluation. Appl. Geogr. 2017, 81, 13–20. [Google Scholar] [CrossRef]
  15. Martí, P.; Serrano-Estrada, L.; Nolasco-Cirugeda, A. Using locative social media and urban cartographies to identify and locate successful urban plazas. Cities 2017, 64, 66–78. [Google Scholar] [CrossRef]
  16. Smiley, M.J.; Roux, A.V.D.; Brines, S.J.; Brown, D.; Evenson, K.R.; Rodríguez, D.A. A spatial analysis of health-related resources in three diverse metropolitan areas. Health Place 2010, 16, 885–892. [Google Scholar] [CrossRef] [PubMed] [Green Version]
  17. Thornton, L.; Pearce, J.; Macdonald, L.; Lamb, K.E.; Ellaway, A. Does the choice of neighbourhood supermarket access measure influence associations with individual-level fruit and vegetable consumption? A case study from Glasgow. Int. J. Heal. Geogr. 2012, 11, 29. [Google Scholar] [CrossRef] [Green Version]
  18. Thornton, L.; Pearce, J.; Kavanagh, A. Using Geographic Information Systems (GIS) to assess the role of the built environment in influencing obesity: A glossary. Int. J. Behav. Nutr. Phys. Act. 2011, 8, 71. [Google Scholar] [CrossRef] [Green Version]
  19. Demographia World Urban Areas, 8th ed.; Available online: http://www.demographia.com/db-worldua.pdf (accessed on 28 December 2012).
  20. Xiao, Y.; Wang, Z.; Li, Z.; Tang, Z. An assessment of urban park access in Shanghai–Implications for the social equity in urban China. Landsc. Urban Plan. 2017, 157, 383–393. [Google Scholar] [CrossRef]
  21. Department of Economic and Social Affairs. World Urbanization Prospects the 2014 Revision; United Nations: New York, NY, USA, 2014. [Google Scholar]
  22. Xiong, X.; Jin, C.; Chen, H.; Luo, L. Using the Fusion Proximal Area Method and Gravity Method to Identify Areas with Physician Shortages. PLoS ONE 2016, 11, e0163504. [Google Scholar] [CrossRef]
  23. Shen, J.; Kee, G. Development and Planning in Seven Major Coastal Cities in Southern and Eastern China; Springer Science and Business Media LLC: Berlin/Heidelberg, Germany, 2017; Volume 120. [Google Scholar]
  24. Ebrahimpour, Z.; Wan, W.; García, J.L.V.; Cervantes, O.; Hou, L. Analyzing Social-Geographic Human Mobility Patterns Using Large-Scale Social Media Data. ISPRS Int. J. Geo-Inf. 2020, 9, 125. [Google Scholar] [CrossRef] [Green Version]
  25. Weibo Statistics. Available online: http://ir.weibo.com/news-releases/news-release-details/weibo-corporation-report-fourth-quarter-and-fiscal-year-2018 (accessed on 10 June 2019).
  26. Shen, Y.; Sun, F.; Che, Y. Public green spaces and human wellbeing: Mapping the spatial inequity and mismatching status of public green space in the Central City of Shanghai. Urban For. Urban Green. 2017, 27, 59–68. [Google Scholar] [CrossRef]
  27. Zhen, F.; Cao, Y.; Qin, X.; Wang, B. Delineation of an urban agglomeration boundary based on Sina Weibo microblog ‘check-in’ data: A case study of the Yangtze River Delta. Cities 2017, 60, 180–191. [Google Scholar] [CrossRef]
  28. Shen, Y.; Karimi, K. Urban function connectivity: Characterisation of functional urban streets with social media check-in data. Cities 2016, 55, 9–21. [Google Scholar] [CrossRef] [Green Version]
  29. Keeler, B.L.; Wood, S.A.; Polasky, S.; Kling, C.L.; Filstrup, C.T.; Downing, J.A. Recreational demand for clean water: Evidence from geotagged photographs by visitors to lakes. Front. Ecol. Environ. 2015, 13, 76–81. [Google Scholar] [CrossRef] [Green Version]
  30. Consensus Data. Available online: http://tjj.sh.gov.cn/html/sjfb/201901/1003014.html (accessed on 20 January 2020).
  31. Ullah, H.; Wan, W.; Haidery, S.A.; Khan, N.U.; Ebrahimpour, Z.; Muzahid, A.A.M. Spatiotemporal Patterns of Visitors in Urban Green Parks by Mining Social Media Big Data Based Upon WHO Reports. IEEE Access 2020, 8, 39197–39211. [Google Scholar] [CrossRef]
  32. Ye, X.; Wang, T.; Ye, X.; Zhu, J.; Lee, J. Using Social Media for Emergency Response and Urban Sustainability: A Case Study of the 2012 Beijing Rainstorm. Sustainability 2015, 8, 25. [Google Scholar] [CrossRef]
  33. Xie, Z.; Yan, J. Kernel Density Estimation of traffic accidents in a network space. Comput. Environ. Urban Syst. 2008, 32, 396–406. [Google Scholar] [CrossRef] [Green Version]
  34. Khan, N.U.; Wan, W.; Yu, S. Spatiotemporal Analysis of Tourists and Residents in Shanghai Based on Location-Based Social Network’s Data from Weibo. ISPRS Int. J. Geo-Inf. 2020, 9, 70. [Google Scholar] [CrossRef] [Green Version]
  35. Silverman, B.W. Density Estimation for Statistics and Data Analysis; Informa UK Limited: London, UK, 2018. [Google Scholar]
  36. Maroko, A.R.; Maantay, J.; Sohler, N.L.; Grady, K.L.; Arno, P.S. The complexities of measuring access to parks and physical activity sites in New York City: A quantitative and qualitative approach. Int. J. Heal. Geogr. 2009, 8, 34. [Google Scholar] [CrossRef] [Green Version]
  37. Yu, W.; Ai, T.; Shao, S. The analysis and delimitation of Central Business District using network kernel density estimation. J. Transp. Geogr. 2015, 45, 32–47. [Google Scholar] [CrossRef]
  38. Yu, W.; Ai, T.; He, Y.; Shao, S. Spatial co-location pattern mining of facility points-of-interest improved by network neighborhood and distance decay effects. Int. J. Geogr. Inf. Sci. 2016, 31, 280–296. [Google Scholar] [CrossRef]
  39. Ying, L.; Shen, Z.; Chen, J.; Fang, R.; Chen, X.; Jiang, R. Spatiotemporal patterns of road network and road development priority in three parallel rivers region in Yunnan, China: An evaluation based on modified kernel distance estimate. Chin. Geogr. Sci. 2014, 24, 39–49. [Google Scholar] [CrossRef] [Green Version]
  40. Wu, C.; Ye, X.; Ren, F.; Wan, Y.; Ning, P.; Du, Q. Spatial and Social Media Data Analytics of Housing Prices in Shenzhen, China. PLoS ONE 2016, 11, e0164553. [Google Scholar] [CrossRef] [PubMed]
  41. King, T.L.; Bentley, R.; Thornton, L.; Kavanagh, A.M. Using kernel density estimation to understand the influence of neighbourhood destinations on BMI. BMJ Open 2016, 6, e008878. [Google Scholar] [CrossRef] [Green Version]
  42. Khan, N.U.; Wan, W.; Yu, S. Location-Based Social Network’s Data Analysis and Spatio-Temporal Modeling for the Mega City of Shanghai, China. ISPRS Int. J. Geo-Inf. 2020, 9, 76. [Google Scholar] [CrossRef] [Green Version]
  43. Hasan, S.; Zhan, X.; Ukkusuri, S. Understanding urban human activity and mobility patterns using large-scale location-based data from online social media. In Proceedings of the 2nd ACM SIGKDD International Workshop, Chicago, IL, USA, 14 August 2013; Volume 1. [Google Scholar] [CrossRef]
  44. Li, L.; Goodchild, M.F.; Xu, B. Spatial, temporal, and socioeconomic patterns in the use of Twitter and Flickr. Cartogr. Geogr. Inf. Sci. 2013, 40, 61–77. [Google Scholar] [CrossRef]
  45. Sun, Y.; Fan, H.; Li, M.; Zipf, A. Identifying the city center using human travel flows generated from location-based social networking data. Environ. Plan. B Plan. Des. 2015, 43, 480–498. [Google Scholar] [CrossRef]
  46. Yuan, N.J.; Zheng, Y.; Xie, X.; Wang, Y.; Zheng, K.; Xiong, H. Discovering Urban Functional Zones Using Latent Activity Trajectories. IEEE Trans. Knowl. Data Eng. 2014, 27, 712–725. [Google Scholar] [CrossRef]
  47. Li, H.; Ge, Y.; Hong, R.; Zhu, H. Point-of-interest recommendations: Learning potential check-ins from friends. In Proceedings of the 22nd ACM SIGKDD International Conference on Knowledge Discovery and Data Mining, San Francisco, CA, USA, 13–17 August 2016; pp. 975–984. [Google Scholar]
  48. Ullah, H.; Wan, W.; Haidery, S.A.; Khan, N.U.; Ebrahimpour, Z.; Luo, T. Analyzing the Spatiotemporal Patterns in Green Spaces for Urban Studies Using Location-Based Social Media Data. ISPRS Int. J. Geo-Inf. 2019, 8, 506. [Google Scholar] [CrossRef] [Green Version]
  49. Van Iddekinge, C.H.; Lanivich, S.E.; Roth, P.L.; Junco, E. Social Media for Selection? Validity and Adverse Impact Potential of a Facebook-Based Assessment. J. Manag. 2016, 42, 1811–1835. [Google Scholar] [CrossRef]
  50. Li, F.; Zhang, F.; Li, X.; Wang, P.; Liang, J.; Mei, Y.; Cheng, W.; Qian, Y. Spatiotemporal Patterns of the Use of Urban Green Spaces and External Factors Contributing to Their Use in Central Beijing. Int. J. Environ. Res. Public Heal. 2017, 14, 237. [Google Scholar] [CrossRef] [PubMed]
  51. Liu, W.; Chen, W.; Dong, C. Spatial decay of recreational services of urban parks: Characteristics and influencing factors. Urban For. Urban Green. 2017, 25, 130–138. [Google Scholar] [CrossRef]
Figure 1. Study area.
Ijgi 09 00360 g001
Figure 2. Criteria.
Figure 2. Criteria.
Ijgi 09 00360 g002
Figure 3. Data process flow diagram.
Ijgi 09 00360 g003
Figure 4. Data processing.
Ijgi 09 00360 g004
Figure 5. Parks and outlier locations in the study area.
Ijgi 09 00360 g005
Figure 6. Green park locations after filtration.
Ijgi 09 00360 g006
Figure 7. Check-in density.
Ijgi 09 00360 g007
Figure 8. Check-in density in the districts.
Ijgi 09 00360 g008
Figure 9. Absolute numbers per hour.
Ijgi 09 00360 g009
Figure 10. Percentage of check-ins in the districts.
Ijgi 09 00360 g010
Figure 11. Weekly trends in green parks.
Ijgi 09 00360 g011
Figure 12. The most popular parks according to number of check-ins.
Ijgi 09 00360 g012
Figure 13. (a) Gender differences in the districts/days, (b) gender difference weekly, and (c) gender differences in the districts.
Ijgi 09 00360 g013
Table 1. Transformation.
Location IDLat.Long.Category/ENLocation Name District
B2094757D068A2FB469E31.00728121.4233parkMinhang ParkMinhang
B2094654DB6EABFC459E31.03845121.4096parkQuinta ParkMinhang
B2094757D06FA4F9439F31.11351121.5968parkZhoupu ParkPudong
B2094655D268A7FB419A31.02493121.2308parkQICHANG ParkSongjiang
B2094757D068A6FE479931.03036121.2238parkSixian ParkSongjiang
Table 2. Area and population in the districts.
DistrictArea (km2)Population (per 10,000)Check-Ins
Putuo54.83128.4720.93%
Jingan36.88 106.6210.24%
Hongkou 23.46 79.907.79%
Yangpu 60.73 131.3416.98%
Huangpu20.46 65.4817.48%
Changning38.3 69.3713.43%
Xuhui54.76 108.8313.15%
Table 3. Example of Weibo check-in.
Building_idUser_idMonthDateDayTimeYearGenderLong.Lat.Address
B2094554D064ABF4429###0824Wed0:00:032016F121.665031.14363ZhaoHang_Park
B2094757D06FA0F8409D###1111Frit1:24:452016F121.524431.265614Jiangpu_Park
B2094757D06FA6FB409B###0529Mon3:02:192017M121.378731.34228Gucun_Park
Table 4. Number of check-ins in the famous parks.
Name of ParkNumber of Check-InsCheck-Ins %
Gongqing Forest Park614422.65%
People’s Park Lotus Pond374913.82%
Soccer Green Park356713.15%
Peaceful park316411.67%
Daning White Beach Park297510.97%
Longevity Park21477.92%
Begonia Park21267.84%
South Park 16426.05%
Luxun Park61445.93%
Table 5. Overall statistics.
DistrictGenderSunMonTueWedThuFriSat
ChangningF1.20%1.14%1.21%1.16%1.15%1.22%1.13%
M0.71%0.73%0.75%0.76%0.73%0.75%0.80%
HongkouF0.85%0.47%0.49%0.54%0.55%0.72%0.87%
M0.73%0.35%0.32%0.32%0.33%0.55%0.70%
HuangpuF1.54%1.42%1.49%1.57%1.49%1.58%1.56%
M0.99%0.97%0.93%1.02%0.91%0.96%1.05%
JinganF0.94%0.93%0.89%0.91%0.88%0.87%0.90%
M0.56%0.53%0.60%0.54%0.58%0.57%0.55%
PutuoF2.19%1.68%1.68%1.74%1.70%1.84%2.32%
M1.44%0.98%0.93%1.02%0.93%1.13%1.38%
XuhuiF1.72%0.62%0.68%0.73%0.74%1.13%1.74%
M1.53%0.46%0.52%0.52%0.49%0.83%1.45%
YangpuF2.78%0.67%0.63%0.75%0.65%1.36%2.71%
M2.30%0.47%0.45%0.47%0.46%1.12%2.18%
Table 6. Gender difference during the week. dr: relative difference.
DaysCheck-InsFemaleMaledr
Mon11.40%6.92%4.48%0.518
Tue11.56%7.06%4.49%0.511
Wed12.04%7.39%4.65%0.518
Thu11.58%7.17%4.42%0.512
Fri14.62%8.71%5.91%0.519
Sat19.32%11.22%8.10%0.518
Sun19.49%11.22%8.27%0.528
Table 7. Gender difference between the districts.
DistrictCheck-InsFemaleMaledr
Changning13.43%8.21%5.22%0.516
Hongkou7.79%4.49%3.30%0.517
Huangpu17.48%10.66%6.83%0.508
Jingan10.24%6.31%3.93%0.514
Putuo20.93%13.13%7.80%0.478
Xuhui13.15%7.35%5.80%0.563
Yangpu16.98%9.54%7.44%0.549