Abstract
The stability and deformation behavior of high rock slopes depends on many factors, including geological structures, lithology, geomorphic processes, stress distribution, and groundwater regime. A comprehensive mapping program is, therefore, required to investigate and assess the stability of high rock slopes. However, slope steepness, rockfalls and ongoing instability, difficult terrain, and other safety concerns may prevent the collection of data by means of traditional field techniques. Therefore, remote sensing methods are often critical to perform an effective investigation. In this paper, we describe the application of field and remote sensing approaches for the characterization of rock slopes at various scale and distances. Based on over 15 years of the experience gained by the Engineering Geology and Resource Geotechnics Research Group at Simon Fraser University (Vancouver, Canada), we provide a summary of the potential applications, advantages, and limitations of varied remote sensing techniques for comprehensive characterization of rock slopes. We illustrate how remote sensing methods have been critical in performing rock slope investigations. However, we observe that traditional field methods still remain indispensable to collect important intact rock and discontinuity condition data.
1. Introduction
Landslides are among the most destructive natural phenomena and are responsible for several hundreds of deaths every year. Continuous population growth has resulted in the progressive settlement of steeper slopes, causing more people to live and work in areas with high landslide risk [1]. Additionally, the increased likelihood of extreme weather events associated with climate change tendencies can trigger major landslides [2,3].
The development of rock slope instabilities is controlled by many factors. Structural and lithological features, such as faults, folds, joints, foliation, and bedding planes, can provide kinematic freedom to potentially unstable blocks at the scale of outcrops and roadcuts to entire mountain slope [4,5]. Brittle fracturing of intact rock can contribute to the evolution of rock slope instability by allowing the formation of continuous failure surfaces [6,7]. The instability of rock slopes is also enhanced by endogenic and exogenic factors, such as earthquakes [8], groundwater fluctuations [9], glacial retreat [10], and slope erosion and steepening [11]. It is clear that a comprehensive rock slope characterization is required to identify the factors controlling stability, and to investigate how their potential impacts vary both spatially and temporally [12].
Traditional field techniques allow geoscientists and engineers to systematically collect important geomechanical parameters for both intact rock and discontinuities that can be employed in preliminary and advanced stability analyses. However, data collection is spatially restricted to accessible areas and may be limited or prevented by difficult terrain, active instability, steep slopes, and/or time and resource constraints. The development and technological advancements of remote sensing techniques have allowed geological data to be effectively collected across inaccessible slopes [13]. Photogrammetric techniques, such as terrestrial digital photogrammetry (TDP) and structure-from-motion (SfM), are routinely used to perform rock mass characterization [13,14,15] and geomorphic mapping [16]. Airborne and terrestrial laser scanning (ALS and TLS) provide 3D point clouds that can be employed to map geological structures [17] and monitor displacements [18]. Recently, infrared techniques, such as infrared thermography (IRT) and hyperspectral imagery (HSI), have been introduced to investigate seepage and rock slope mineralogy, respectively [19,20]. The integrated application of multiple remote sensing techniques using an integrated approach may improve understanding of the mechanisms underlying slope instability. Presently, multisensor remote sensing applications predominantly involve the coupling of TLS datasets with IRT [21] or HSI datasets [22].
In this paper, we describe and summarize the methods and procedures used for data collection and rock mass and slope characterization at various sites, both in Canada and in Italy (Figure 1), investigated during the past 15 years by current and former members of the Engineering Geology and Resource Geotechnics Research Group at Simon Fraser University. The sites include the Hope Slide and Block 731 (British Columbia, Canada), the Frank Slide and the Palliser rockslide (Alberta, Canada), and the Vajont Slide (Italy). In the paper we review, for each site, the methods used and results obtained from traditional field characterization, and describe how knowledge of the site and instability processes progressively increased through collection and interpretation of remote sensing datasets. For each slope, we present examples of collected datasets, highlighting the potential application and advantages of each remote sensing technique in the characterization of rock mass and slope damage.
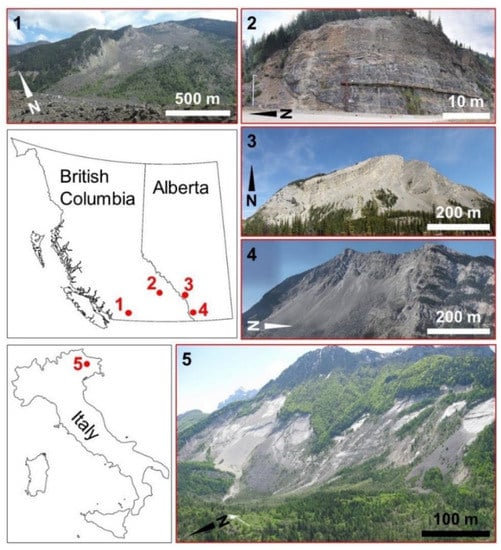
Figure 1.
Location of the sites described in this paper. 1: Hope Slide (British Columbia); 2: Block 731 (British Columbia); 3: Palliser rockslide (Alberta); 4: Frank Slide (Alberta); 5: Vajont Slide (Italy).
2. Methodology
The comprehensive investigation of rock slopes and landslides is a complex task that comprises (a) review and analysis of literature and historical data, (b) data collection by means of both traditional field techniques and remote sensing methods, and (c) data analysis and numerical modelling [12]. In this paper, we describe field and remote sensing techniques and procedures for the collection of geotechnical data at the selected rock slopes.
Traditional field-based mapping techniques were used for the characterization of the rock mass and the systematic collection of discontinuity data using scanline and/or window mapping. The uniaxial compressive strength (UCS) of intact rock was estimated in-situ using a geological hammer or the Schmidt hammer. Intact rock specimens were collected for point load testing (PLT), which provides more reliable uniaxial strength estimations [23]. The International Society for Rock Mechanics and Rock Engineering provides guidelines for the collection of discontinuity data at the rock face [24]. Water conditions, surface roughness, and type of infill were characterized to determine the shear strength of the discontinuities [25]. Rock mass blockiness and block shape were determined based on discontinuity orientation, persistence, and spacing. Rock mass quality was estimated using the Geological Strength Index (GSI), based on the configuration and surface conditions of the discontinuities. GSI was also used to estimate rock mass strength and deformability [26]. Field activity was also useful for the geomorphological characterization of landslide deposits, particularly if high-resolution aerial datasets were not readily available [27,28].
To complement traditional mapping techniques, various remote sensing techniques were used for the characterization of the rock slopes, including high-resolution photography and digital photogrammetric methods (TDP and SfM), ALS and TLS, IRT, and HSI. A brief overview of each method and the survey equipment employed is provided.
2.1. Digital Photogrammetry and High-Resolution Photographs
Digital photogrammetric techniques, such as TDP and SfM, allow 3D models of the investigated slopes to be constructed using photographs taken from at least two different locations [29,30]. The scene reconstruction is performed using a semi-automated procedure that allows identification and matching of pixels (in TDP) or features (in SfM) within the photographs and using a bundle-adjustment approach to estimate their location in 3D. In this study, TDP was largely employed to perform discontinuity mapping and rock mass characterization on the 3D slope models. SfM was employed to perform a block size analysis of the rock avalanche deposit of the Hope Slide, using photographs collected with an unmanned aerial vehicle (UAV). Photographs at the investigated sites were collected with several digital cameras for TDP, including Canon EOS 30D (8.2 MegaPixel), Canon EOS 5D mark II (21.1 MegaPixel), and Canon EOS 5Ds-R (50.6 MegaPixel, Figure 2a). SfM photographs were capture using a DJI Phantom 3 Pro Quadcopter with an integrated 20 MegaPixel camera (Figure 2b). Processing was performed using the 3DM Analyst mapping suite 2.5 [31] for TDP and Photoscan 1.4 [32] for SfM.
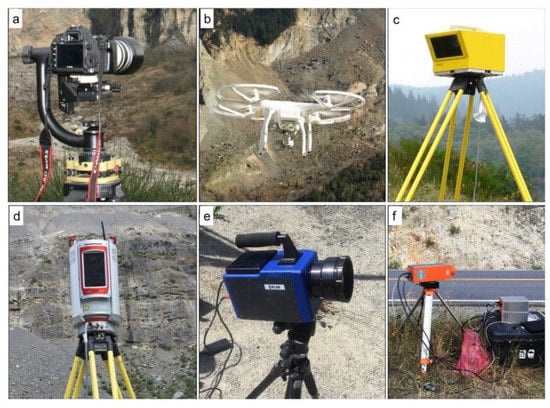
Figure 2.
Remote sensing equipment employed at the investigated sites. a: Canon EOS 5Ds-R with f = 400 telephoto lens; b: DJI Phantom 3 Pro Quadcopter; c: Optech ILRIS3D terrestrial laser scanning (TLS); d: Riegl VZ-4000 TLS; e: FLIR SC7750 thermal camera; f: Specim SWIR3 hyperspectral scanner.
The collection of high-resolution photographs is useful for the identification and mapping of slope damage features, such as open cracks, areas of surface weathering, and presence of discontinuity infill. Characterization of these parameters is difficult on lower resolution TDP and SfM models and, therefore, required high-resolution photographs.
2.2. TLS and ALS
Laser scanning techniques allow 3D point clouds of the investigated slopes to be obtained. In the point clouds, the location of each point is estimated based on the direction and time-of-flight (ToF) of a laser pulse emitted from the instrument and reflected by the investigated slopes [17]. Processing of ALS datasets allows vegetation to be digitally removed, and bare earth (BE) datasets to be created. BE datasets are mainly employed for large-scale structural analysis, geomorphic mapping, and monitoring [13]. However, due to the vertical line of sight and lower resolution, they are not suited for the investigation of steep slopes. Conversely, due to their oblique line of sight and higher resolution, TLS are routinely employed for rock mass characterization, discontinuity mapping, and small-scale slope monitoring [18,33]. In this paper, TLS datasets were collected using Optech ILRIS3D (1500 m max range, Figure 2c) and Riegl VZ-4000 (4000 m max range, Figure 2d) terrestrial laser scanners. Collected point clouds were processed in RiScan Pro 2.6 [34], CloudCompare 2.9 [35], and Polyworks [36].
2.3. IRT
IRT surveys allow the temperature distribution of an investigated object to be examined. Any object with a temperature higher than 0 K is a source of infrared energy. Since the infrared emission is a function of temperature, a thermal camera can capture and convert the infrared radiation into a temperature map of the object [37]. In this paper, IRT was conducted predominantly to investigate and map discontinuity seepage using a FLIR SC7750 thermal camera (Figure 2e). IRT imagery was processed using ResearchIR [38].
2.4. HSI
HSI is a technique that allows the electromagnetic reflected radiation of an object to be investigated. Infrared radiation in the short-wave infrared (SWIR) spectrum is diagnostic of the mineralogical components of natural materials and can be used to identify lithological contacts and variations [39]. HSI is largely employed in the field of mineral exploration, using satellite-based imagery [40]. The recent introduction of ground-based HSI push-broom scanners allows the rock slope lithologies to be mapped using portable hyperspectral cameras [41]. In this paper, we employed a Specim SWIR3 hyperspectral scanner to identify lithological variations at both the outcrop- and mountain-slope scales (Figure 2f). Data processing has been undertaken using the software ENVI 5.5 [42].
3. Rock Slope and Landslide Investigations
3.1. Hope Slide (British Columbia, Canada)
The Hope Slide was a major rock avalanche that occurred on January 9th, 1965. The 48 million m3 slide detached from the southern slope of Johnson Ridge, along BC Highway 3, 15 km east of the town of Hope. The rock avalanche travelled for two kilometers along the Nicolum Valley, infilling the valley floor with about 70 m of material, burying Outram Lake and causing the death of four people who were travelling along the highway at the time of failure [43]. The slide occurred in two stages, separated by a few hours. Two low-magnitude earthquakes were recorded at the site, which are suggested to have resulted from the slope failures [44]. From a geological perspective, the failed slope is composed of a massive greenstone of the Hozameen Group, which is locally intruded by felsite sills and dikes [45]. Various north-south striking faults were observed to cross the slide area, which were suggested to have controlled structurally the location and behavior of the slope instability [45]. The lower part of the slope was affected in prehistoric times by another rock avalanche, roughly similar in size, that likely occurred as a result of glacial retreat [46].
3.1.1. Field Work
Extensive field work at the Hope Slide site was conducted between 2003 and 2004 [47]. Traditional field work techniques were employed to perform rock mass characterization and estimate the spatial variation of the rock mass quality using the GSI. Field work investigations were conducted along the lower part of the lateral scarp, at the base of the rupture surface, and in the upper slope. Engineering geological mapping allowed four structural domains to be identified, based on the orientation of seven observed discontinuity sets. Discontinuity set J1 was found to be sub-parallel to the slope and was suggested to have acted as the sliding surface for the 1965 event. Faults and shear zones identified within the slide area were also investigated and weak gouge up to 30 cm thick was observed at their core. Unconfined compressive strength of the gouge was estimated between 12.5 and 50 MPa, while the intact strength of the greenstone was estimated at 159 MPa using point load testing [47]. The lowest rock mass quality was observed along the lateral scarp, which comprise a shear zone with GSI values as low as 0–10. GSI was found to vary between 20–30 and 70–80 in the central part of the slide area, and between 10–20 and 50–60 in the southern part of the upper slope [47].
From the field-based slope characterization, it was observed that large-scale geological structures were responsible for a high variability of the observed joint sets. Additionally, it was suggested that faults and shear zones divide the failed slope into different blocks, highlighting the strong 3D structural control that governed the 1965 event [47].
3.1.2. Remote Sensing
Extensive remote sensing was conducted at the site in summer 2011 and summer 2015, using SfM, TDP, TLS, and IRT. Results are described in [12,46,48]. Historic aerial photographs, collected in 1961 (i.e., prior to the 1965 rock avalanche events) and retrieved from the Province of British Columbia database, were used to build a pre-failure 3D model using SfM. The 3D model was investigated in ArcGIS 10.5 [49], and a large-scale structural analysis was undertaken using hillshade, slope, and aspect maps. Six major lineaments were identified, which divide the slope into five blocks. Two of these blocks were likely involved in the prehistoric slope failure (Figure 3a).
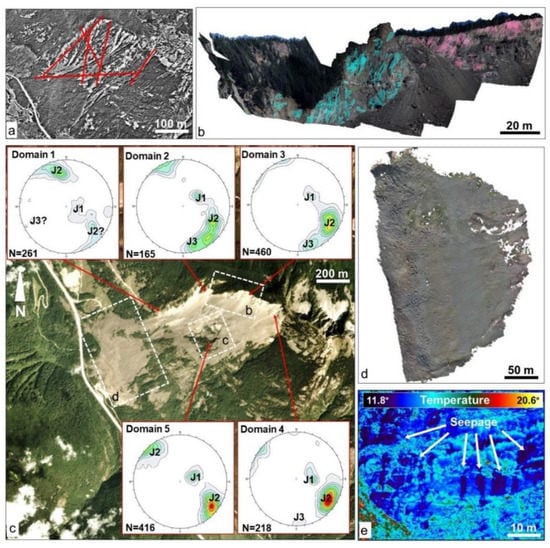
Figure 3.
Remote sensing analysis performed at the Hope Slide. a: pre-failure 3D model of the slope, constructed using 1961 aerial imagery processed using the structure-from-motion (SfM) technique; b: example of a 3D model reconstructed using terrestrial digital photogrammetry (TDP). Blue and pink disks show discontinuities mapped in 3DM Analyst; c: structural overview of the area. The stereonets show the orientation of the discontinuity sets mapped in the TDP models, subdivided into five structural domains; d: orthorectified image of the debris field reconstructed using unmanned aerial vehicle (UAV)-SfM; e: infrared thermography (IRT) dataset of the daylighting sliding surface. Dark areas identify seepage.
A TDP survey was performed from two stations located within the debris field, using a Canon EOS 5D mark II and an f = 400 mm focal length lens. Discontinuity mapping was performed on the constructed 3D models, and over 1600 discontinuity orientations were measured from the inaccessible parts of both the headscarp and sliding surface (Figure 3b). Three discontinuity sets were identified, consistent with the major discontinuity sets mapped using traditional field techniques. J1 was found to be sub-parallel to the slope, while J2 and J3 are perpendicular to J1 and to one another. Based on the discontinuity orientations, five structural domains were identified, characterized by a progressive rotation of the observed discontinuity sets that was not clearly recognized in previous field-based analyses [48] (Figure 3c).
An aerial photogrammetric survey was undertaken using a UAV to investigate block size distribution within the slide debris. About 650 photographs were collected and used to build an orthorectified photograph in Photoscan (Figure 3d). 2000 blocks were then manually digitized, and their volume estimated. The largest block was estimated at 4000 m3 whereas the average block size was about 78 m3.
A TLS survey was conducted from the Hope Slide visitor lookout at the base of the slope in the summer 2015. The elevation difference between the point cloud and the pre-failure model built using historical aerial photographs was computed in ArcGIS to estimate the volume involved in the failure. A volume of 48.4 million m3 was calculated, which is in good agreement with previous estimations, ranging between 47.3 and 48.3 million m3, that were based on pre- and post-failure isopach maps [43,45].
An IRT survey was undertaken to investigate seepage along the daylighting rupture surface, and it was observed that most of the seepage occurs along the discontinuity set J1 (Figure 3e).
Traditional field work and remote sensing data were employed to create a 3D numerical model of the slope and to simulate the failure of the Hope Slide through progressive cohesion reduction along the basal rupture surface using a 3D distinct element modelling approach [12]. The numerical analysis allowed a two-stage failure to be reproduced, which was probably caused by the varied kinematic conditions across the unstable slope.
3.2. Block 731 (British Columbia, Canada)
Block 731 refers to a stabilized, 55 m high rock slope located along the left abutment of the Revelstoke Dam, in British Columbia, Canada [50]. The Revelstoke Dam comprises a 160 m-high concrete gravity dam, a powerhouse located immediately beneath the concrete dam, and an earthfill dam that extends for 1 km to the west of the concrete structure, over the west bank terrace of the Columbia River [51]. During the construction of the dam (1977–1984), a 280,000 m3 rock slope instability developed along the eastern abutment. The instability extended over a length of ca. 200 m and was triggered by blasting for the excavation of the Highway 23 bypass road cut. No attempt was undertaken to stabilize the southernmost part of the unstable slope, referred to as December Slide (30,000 m3), which was progressively excavated, and the material removed. The northern part of the unstable area, referred to as Block 731, involved displacement of a volume of 250,000 m3 of rock mass along a weak shear zone, identified as S3 [50]. Displacement rates up to 3.6 mm/day were recorded during the excavation of the road cut. The installation of a temporary beam at the base of the slope reduced the displacement rates to 0.2 mm/day, allowing permanent remedial measures, comprising anchors and drainage systems, to be installed [50].
The rock mass forming the Block 731 predominantly comprises an alternation of quartzite and horneblend gneiss [50]. These lithologies are part of the Selkirk Allochthone, and specifically the tectonic slice referred to as Clachnacudainn [52]. The Selkirk Allochthone forms the hanging wall of the Columbia River Fault, which is the most important geological structure in the area [53].
3.2.1. Field Work
Field work at the site was undertaken in summer 2017 and involved preliminary discontinuity mapping and rock mass quality estimation using the GSI. A visual analysis of the rock slope, characterized by a dip/dip direction of 63°/296°, showed the presence of two major shear zones, located respectively at the northern edge (3–4 m wide) and in the southern part of the rock slope (1–2 m wide). These appear to correspond to the shear zones S3 and S4, respectively [50].
Preliminary discontinuity mapping undertaken at the site showed the presence of four main discontinuity sets, including the foliation. J1 and J2 dip into the slope with orientations (dip/dip direction) of 65°/128° and 73°/092°, respectively. J3 is a high angle discontinuity set perpendicular to the slope orientation (83°/009°). The foliation in the lower part of the slope dips into the slope at a low angle (36°/120°). It was noted that foliation planes are characterized by smoother surfaces (JCS = 4–10) compared to discontinuity sets J1–J3 (JCS = 8–12).
The rock mass in the shear zones is highly altered, weathered, and fractured, and is easily excavated using a geological hammer (GSI = 0–10). Shotcrete was sprayed to prevent material detachment from the shear zones, but large areas of shotcrete were missing, particularly along the lower slope, at the time of the investigation. Outside of the shear zones, rock mass structure appears very blocky, and overall rock mass quality increases (GSI = 45–55).
3.2.2. Remote Sensing
Remote sensing surveys were conducted in the summer of 2017 and including high-resolution photography, TLS, and HSI analyses. High-resolution photography was collected to produce a detailed panoramic image of the investigated slope, and to complement discontinuity mapping completed on the TLS dataset (Figure 4a). In particular, high-resolution photography was employed to distinguish between tectonic discontinuities, blast damage features, and planar surfaces.
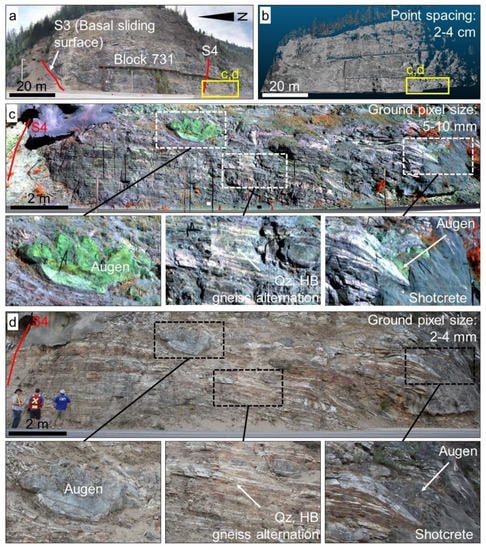
Figure 4.
Multi-sensor remote sensing analysis of the Block 731 road cut on the left abutment of the Revelstoke Dam. a: Panoramic overview of the 55 m high rock slope. Note the location and orientation of the shear zones S3 and S4; b: point cloud of the rock slope. The yellow box in a and b shows the location of sections in c and d; c: minimum noise fraction (MNF) image of part of the lower slope comprising the three lowest noise fraction bands obtained from the hyperspectral imagery (HSI) dataset. Details of augens and lithological alternations are shown. Note the high contrast between different geological materials; d: high-resolution photograph of the same part of the slope shown in c.
The TLS dataset was collected using the Riegl VZ-4000 from two scan positions located at the base of the slope, on the opposite side of Highway 23. A point spacing ranging between 2 and 4 cm was obtained for the collected point cloud (Figure 4b). Four discontinuity sets were identified, including the foliation, consistent with traditional field-based discontinuity mapping, and TLS structural mapping. The average orientation of the foliation and sets J1 and J2 were estimated as 28°/119°, 63°/138°, and 64°/097°, respectively. The orientation of J3 was found to differ between traditional and TLS mapping, due to the higher spatial coverage and number of features mapped on the TLS point cloud. The orientations of the shear zones S3 and S4 were estimated at 48°/332° and 41°/273°, respectively, using the TLS dataset. The analysis described here highlighted the presence a J2, which was not documented in previous analyses [54].
A preliminary HSI analysis was conducted, aiming to investigate the lithological variations that can be observed in the lower part of the slope. The imagery was collected using the SWIR3 hyperspectral scanner from the opposite side of Highway 23. At a distance of 10 m from the slope, the average ground pixel size is ca. 5–10 mm. The collected imagery was processed using an approach similar to [41] and comprised image de-striping, spectral filtering, minimum noise fraction (MNF) transformation [55], and empirical line correction [56]. The processed imagery allows the boundaries between different lithologies to be highlighted. In particular, an alternation between two different geological materials was observed. Locally, augens up to 3 m wide were also highlighted (Figure 4c).
3.3. Palliser Rockslide (Alberta, Canada)
The Palliser Rockslide is a major prehistoric slope failure located in the Canadian Rocky Mountains, 70 km south of Banff, Alberta. Two major failure events involved rock mass detachments from the western slope of Mt. Indefatigable, which constitutes the eastern limb of the Serrail Creek Syncline. The bedrock in the area comprises carbonate rocks of Devonian and Mississippian age [57]. It was noted that the rockslide deposit resulted from two distinct events, possibly separated by thousands of years, which, respectively, involved rock from the Livingstone Formation and the Upper Banff Formation [58]. Cosmogenic dating was performed using 36Cl, noting that the slope failures occurred ca. 10,000 and ca. 7700 years ago, respectively [59]. The displacement occurred in a south-western direction along pervasive bedding planes sub-parallel to the slope orientation, separated by steps as described in Section 3.3.2. A maximum dip angle of 50° is observed at the top of the rupture surface, and progressively decreases towards the base of the slope approaching the axis of the large-scale syncline [60]. The north–western dipping limb of the Serrail Creek Syncline, at the base of the slope, was suggested to provide stability to the present-day slope, north of the prehistoric failure, by providing a “buttress” in which bedding planes dip into the slope [61].
3.3.1. Field work
Traditional field work was undertaken at the site in 2006 and 2008. A detailed description is provided in [61] and [62]. Rock mass characterization was performed, including discontinuity mapping, rock mass quality estimation, and a qualitative, preliminary groundwater analysis. Scanline mapping, undertaken at the base of the slope, revealed the presence of low to medium persistence, extremely close to closely spaced bedding planes (S0), and three discontinuity sets (J1, J2, and J3) characterized by low persistence and close spacing. Mapping conducted along the rupture surface showed the dip angle of the bedding planes to vary between 24° and 52°, with a progressive increase towards the top of the slope, due to the curvature of the north-western limb of the syncline [62]. Rock mass quality, estimated using GSI, was noted to vary between 55–65 and 65–75 in the area where the scanline mapping was undertaken. The rock mass within the Serrail Creek Syncline, daylighting along the northwestern boundary of the slide area, is characterized by a GSI of 30–40, due to a higher fracture intensity [62]. Locally, carbonate infill was identified along bedding planes and J1 discontinuities. Additionally, seepage, karst features. and carbonate recrystallization features were observed within the rock mass forming the lateral boundary of the slide, suggesting that groundwater circulation occurred within the slope, and may have played a role in the failure [62]. Intact rock samples were collected during the field work to estimate the UCS of the intact rock in directions parallel and perpendicular to the bedding; average values of 180 and 118 MPa, respectively, were obtained from point load testing on thirty samples [62].
3.3.2. Remote Sensing
Remote sensing investigations were conducted at the site in 2006, 2008 [61,62], and 2017. In 2006 and 2008, TDP surveys were conducted from multiple locations within the deposit using a Canon EOS 30D with an f = 20–400 mm focal length lens. The 3D models reconstructed using an f = 50 mm focal length lens were processed, based on geomorphic field evidences, to estimate the total volume involved in slope failures. It was suggested that the volume of the younger event did not exceed 8 million m3, whereas the older event caused the failure of 40 million m3 of rock [62]. These estimations are significantly lower than previous analyses [58].
TDP models constructed using an f = 200 mm focal length lens were used to perform long-range discontinuity mapping, step-path surface analysis, intact rock fracture mapping, and bedding waviness estimation. Discontinuity mapping was performed separately for the slide area and the south-western limb of the Serrail Creek Syncline. Results showed good agreement with discontinuity field mapping. Step-path analysis conducted using the TDP 3D models allowed four types of step-path surfaces to be distinguished, based on the persistence, spacing, and orientation of the discontinuities forming the rupture surface [62]. Intact rock fracture mapping was conducted to estimate the percentage of rock bridges, which was noted to be 2%–3% along the failure surface. The waviness of bedding planes in the TDP models was investigated at multiple locations along the rupture surface. The roughness angle i was estimated at multiple locations and noted to vary between 4° and 5° [62].
In summer 2017, a multi-sensor remote sensing survey was undertaken at the site, involving the collection of TLS, high-resolution photography, and IRT datasets.
Two TLS surveys from distinct locations within the rockslide deposit were performed to build a high-density point cloud of the rock slope. The resulting point spacing is 5–7 cm from a distance of 1100 m (Figure 5b).
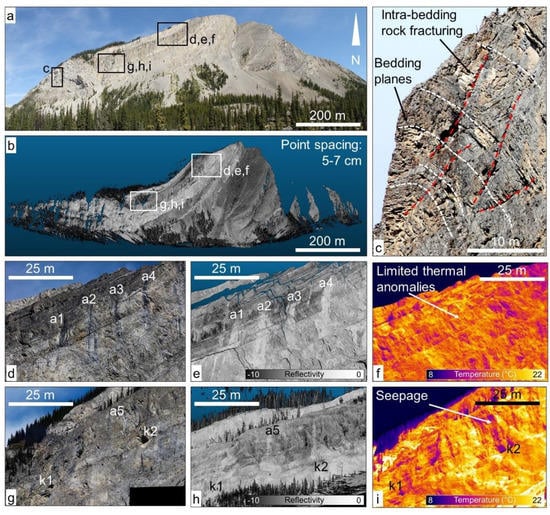
Figure 5.
Remote sensing analysis performed at the Palliser Rockslide. a: panoramic photograph of the slope; b: TLS 3D point cloud; c: high-resolution photograph showing evidence of intra-bedding intact rock fracturing; d–f: details from the high-resolution photography, TLS, and IRT datasets showing areas of surface alteration (a1–a4) due to ephemeral seepage or concentrated water flow; g–i: details from the same datasets showing areas of surface alteration (a5) and karst features (k1, k2).
High-resolution photography was collected using the Canon 5Ds-R 50 MegaPixel camera with an f = 200 mm prime focal length lens. Photographs were collected from a single location within the deposit, at a distance of 1100 m from the top of the rupture surface, and are characterized by a ground pixel size of 2.4 cm. Draping high-resolution photographs onto 3D datasets was noted to enhance the detail of the 3D model [63], potentially allowing location, intensity, and distribution of intact rock fracturing features to be examined (Figure 5c).
The preliminary analysis of the TLS and high-resolution photographic datasets shows the presence of surface alteration along the sub-vertical rock bounding the slide area. Altered surfaces occur along the directions of maximum slope steepness, appearing as darkened surfaces in the high-resolution photographs (Figure 5d,g), and as high reflectance surfaces in the TLS dataset (Figure 5e,h). An IRT survey was conducted to investigate the presence of seepage along the rock slope, which did not show significant water flow in the areas where weathering was observed (Figure 5f,i). It appears that the surface alteration is probably caused by seepage or concentrated water flow occurring during rainfall events and snowmelt periods. Thermal anomalies along the rock slope are predominantly observed where karst features and shadows occur along the rock slope surface.
3.4. Frank Slide (Alberta, Canada)
The Frank Slide is a major rock avalanche (30 million m3) that detached in 1903 from the eastern slope of Turtle Mountain, near the town of Frank [64]. The rock slide displaced along the eastern limb of Turtle Mountain anticline, which strikes in a north-south direction in the slide area [65]. The upper part of the slope, from which the slide detached, comprises limestone and dolostone of the Livingstone, Banff, and Palliser Formations, ranging in age from the Mississippian to Devonian. These formations thrusted over the shales and sandstone of the Fernie Formation and Kootenay Group, ranging in age from Jurassic to Cretaceous [65]. The Kootenay Group also comprises coal deposits, which were being mined at the time of the failure [66]. It has been suggested that coal mining played a role in weakening the slope, however, this hypothesis is not conclusive [64,67]. During the failure, tension cracks opened behind the headscarp, which have not shown further opening since the failure [65].
Presently, slope instability predominantly involves a volume of 7 million m3 in the southern part of the headscarp, referred to as South Peak [68]. Monitoring of the area has been performed using crack meters, trilateral signs, photogrammetry, total station, and dGPS [69]. Since 2014, monitoring is largely based on ground-based InSAR (Interferometric synthetic-aperture radar installed at the base of the slope, which now represents the primary monitoring system at the site [70].
3.4.1. Field Work
Field work activity conducted along the potentially unstable South Peak area is described in [71]. Between 2008 and 2009, structural analysis and rock mass characterization were undertaken at the site. Discontinuity mapping, performed at various locations, allowed five major (J1–J5) and one minor (J6) discontinuity sets to be identified. The mapped discontinuities were noted to be planar or undulating (primary roughness) and characterized by rough surfaces (secondary roughness). Based on the varied orientation of the sets, the South Peak area was subdivided into three different structural domains. Rock mass quality was also estimated using a GSI approach and was observed to vary between 30–40 and 60–70 [71].
3.4.2. Remote Sensing
Various remote sensing datasets have been collected at the site, using a combination of TLS, TDP, high-resolution photography, IRT, and HSI. Preliminary TLS datasets, collected from five stations located at the North Peak and South Peak, were merged with TDP datasets to create the first composite 3D model of the headscarp [72]. TLS point clouds were obtained using the ILRIS3D TLS, whereas an f = 400 mm focal length lens was used to create the TDP models from the base of the slope, at a range of 2.1 km [72]. Structural mapping on the virtual outcrop were noted to agree with field measurements and allowed estimation of discontinuity persistence.
In summer 2017, a remote sensing survey campaign was undertaken at the site, aiming to collect multi-sensor datasets from very-long range (up to 2.8 km). TLS datasets were collected, using the VZ-4000 TLS, from three locations near the Frank Slide Interpretive Center and within the debris field. A point cloud of the headscarp was obtained, characterized by an average point spacing of 5–7 cm, thus potentially allowing for discontinuity mapping from a distance exceeding the range of the ILRIS3D TLS (Figure 6b). High-resolution photography, collected from the interpretive center with the Canon 5Ds-R and an f = 200 mm prime focal length lens, provided imagery characterized by a ground pixel size up to 5.8 cm. It was noted that despite the good resolution of the TLS dataset, the detailed structural investigation becomes challenging when smaller features need to be identified and mapped. Draping the high-resolution photographs onto a mesh obtained from the TLS dataset was found to be beneficial in identifying small-scale features in point clouds collected at long range (Figure 6c). The analysis of high-resolution photography also potentially allows rock bridges and brittle fractures along the rock slope to be examined.
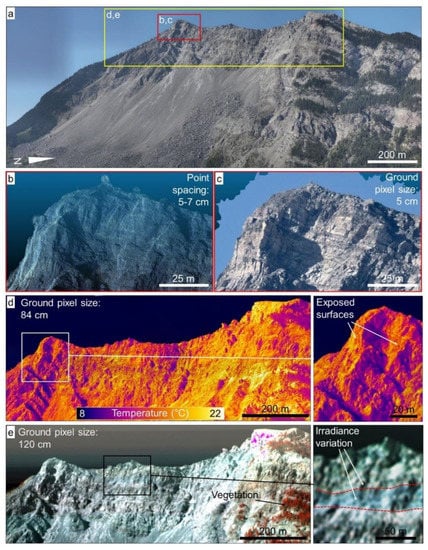
Figure 6.
Multi-sensor remote sensing imagery of the Frank Slide headscarp. a: panoramic overview; b: point cloud of the South Peak area. Red and yellow boxes outline the sections shown in b–e, respectively; c: High-resolution photograph draped onto the TLS dataset; d: IRT image of the Frank Slide. Low temperature areas are associated to surface topography variation; e: HSI image of the Frank Slide (Red band: 1047.0 nm; green band: 1601.9 nm; blue band: 2103.2 nm). Variations in irradiance show possible mineralogical changes between layers.
IRT and HSI datasets were also collected from the interpretive center. The ground pixel sizes obtained with the SC7790 thermal camera and the SWIR3 hyperspectral scanner are 84 cm and 120 cm, respectively. Thermal imagery is generally employed to investigate seepage. At the Frank Slide, temperature distribution throughout the rock slope was noted to be related to the varying exposure across the headscarp (Figure 6d). No appreciable groundwater seepage was observed, possibly due to the lack of rainfall events in the weeks prior to the survey. The collected HSI dataset allows irradiance variations between layers to be observed along the headscarp, possibly associated with varied degrees of dolomitization within the Mississippian Livingston Formation (Figure 6e). Vegetated areas are also clearly visible in the collected dataset.
3.5. Vajont Slide (Italy)
The Vajont Slide is located in northern Italy, at the boundary between the Veneto and Friuli Venezia-Giulia regions, 2 km east of Longarone, a town in the Piave River Valley. This failure was a direct consequence of the construction of a hydroelectric dam along the Vajont gorge, and the subsequent impoundment of a reservoir that reactivated a prehistoric landslide on the northern flank of Mount Toc [73]. Due to the repeated lowering and raising of the reservoir level, and following a heavy rainfall period, on October 9th, 1963, the slope failed [74]. A volume of 250 million m3 of rock slid into the reservoir, generating a displacement wave that completely destroyed the town of Longarone and other small villages along the Piave River Valley, after travelling through the Vajont gorge at high speed. Almost 2000 people died during the event.
The Vajont gorge comprises carbonate rocks of the Soccher Formation, Fonzaso Formation, and Calcare del Vajont Formation, ranging in age from Cretaceous to early Jurassic [73]. The rupture surface of the Vajont Slide occurs within the Fonzaso Formation, which comprises moderately thin to moderately thick micritic limestone beds, characterized by clayey interlayers in the upper part [75]. The displacement of the 1963 slide probably occurred along such clay layers, which were characterized by residual strength values, due to the shearing or cumulateve damage caused by the paleo-deformation [76]. The size and characteristics of the Vajont Slide were greatly affected by geological structures present in the area. The rupture surface was characterized by a chair-like shape, structurally controlled by the Erto Syncline [77]. The lateral and rear release surfaces of the slide were defined by the Col Tramontin Fault and the Col delle Erghene Fault, respectively [78]. The slide body was divided into two major blocks by the Massalezza Creek, which crossed the slide area in a north-south direction. It is suggested that the larger, western block moved first, followed by the eastern block [79].
3.5.1. Field Work
Field work activity was conducted in summer 2010 and 2011. A detailed description of the investigations and results can be found in [78] and [79]. Field investigation involved an in-depth geomorphic characterization of the slide deposit, and a preliminary structural analysis, aimed to collect discontinuity orientation and fold axis data.
Geomorphic mapping was undertaken along north-south oriented foot transects which were spaced at 50 m, throughout the entire slide deposit area. During the survey, geomorphic features (such as gullies and ridges) and variation in slope angle were recorded as data points and were later employed to create a detailed geomorphological map. Based on the distribution of ridges within the deposit, areas of compression and extension, developed during the 1963 slope failure, were interpreted [78].
3.5.2. Remote Sensing
A comprehensive remote sensing analysis was conducted to investigate the pre- and post-failure morphology of the slope, and the structural setting of the sliding surface. A comprehensive remote sensing investigation, including photogrammetric and laser scanning techniques were critical to perform a geomorphic analysis of the pre- and post-failure slope topography, and to investigate the structural geology of the rupture surface, which is today largely inaccessible. The pre-failure slope investigation was conducted based on the stereo-interpretation of 1960 historical, aerial photographs (Figure 7a). A pre-failure geomorphological map was created, which highlighted the location and extension of geomorphic benches. These benches are characterized by low slope angle (<25°), the largest being the Pian della Pozza bench, gently dipping into the slope. Multiple steep scarps were also identified throughout the unstable rock mass. In the upper slope, three major scarps were noted to delineate the M-shaped tension crack that formed in 1960. Below the Pian della Pozza bench, another steep scarp was observed, and was suggested to be related to the incipient failure that would occur in November 1960 [78]. Minor, shallow slope instabilities (i.e., debris slide scars) were also observed both at the base of the slope, near the reservoir, and in the upper slope, close to the intersection of the Massalezza Creek with the rear slide boundary. Additionally, hummocks, ridges, and depressions could be observed, evidencing the unstable nature of the slope [78]. The post-failure geomorphic analysis was conducted using 1963 historic air-photographs and an ALS dataset. Ridges and extensional features were mapped and interpreted to infer the direction of displacement of the blocks forming the slide.
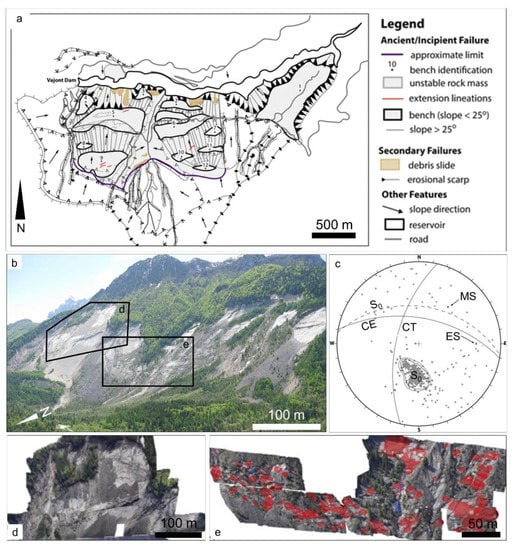
Figure 7.
Overview of the remote sensing analysis undertaken at the Vajont Slide site. a: geomorphological analysis of the pre-1963 slope, based on historic aerial photo-interpretation; b: oblique image of the failed slope and slide deposit. The boxes shows outline the location of the 3D TDP models shown in c–e; c: lower hemisphere stereonet plot showing the discontinuity planes mapped across the rupture surface; d: 3D TDP model of part of the eastern basal rupture surface, constructed using a f = 200 mm focal lens length; e: 3D TDP model of the Massalezza Creek area, constructed using a f = 400 mm focal lens length (a,c–e are modified from [79], by permission).
A high-resolution ALS dataset was used to create aspect and slope maps in ArcGIS to perform a preliminary geomorphic analysis of the slide area and validate the features observed during the traditional geomorphological mapping.
A TDP analysis was conducted to investigate the structural setting of the exposed rupture surface [79]. Long range surveys were conducted, using a Canon EOS 5D mark II with f = 20 mm and f = 200 mm prime focal length lens, and an f = 400 mm focal length lens. Photographs were collected from the opposite valley slope, near the town of Casso (which was only very slightly impacted by the landslide wave in 1963) from a distance ranging between 800 m and 2000 m. The analysis of the 3D models evidenced a progressive variation of the slope dip and dip direction from east (ranging between 46°/ 002° and 36°/ 353°) to west (34°/ 031°), suggesting that the basal rupture surface is characterized by a “bowl” shape due to a synform parallel to the Massalezza Creek. Discontinuity mapping was performed using the 3D models, and a total of seven discontinuity sets, including the bedding, were identified [79] (Figure 7b–e). A rotation of the discontinuity sets was noted, from the east to the west, which is also related to the Massalezza Creek fold [79].
A large-scale morphological analysis of the sliding surface was undertaken using the long-range TDP 3D models, and variations in roughness, concavity, and convexity throughout the sliding surface were observed. Based on this analysis, a semi-quantitative classification of the daylighting sliding surface of the Vajont Slide was proposed [74].
Finally, a qualitative analysis of the evolution with time of the rupture surface was also performed. The release of material from the unstable slope is documented using oblique photographs consistently collected from the opposite slope of the Vajont gorge by various authors in 1964, 1985, 1993, 2002, and 2011 [74].
4. Discussion
The remote sensing analyses conducted at the selected sites and reviewed in this paper allowed better understanding of the geological and geotechnical characteristics at each site. Compared to traditional field-based investigations alone, remotely-sensed geomechanical data could be collected from inaccessible parts of the slope, allowing a more comprehensive study to be undertaken.
At the Hope Slide, traditional field-based rock mass characterization was performed only at the base of the lateral scarp, along the daylighting part of the failure surface, and in the area behind the headscarp [45,47]. Whereas fieldwork results, together with aerial photographs interpretation allowed the recognition of the strong structural control on the 1965 failure, the progressive change in discontinuity set orientation across the slope only became clear after the long-range TDP survey. Future analyses may focus on investigating the role of this structural configuration on the stability and pre-failure deformation of the slope. The use of SfM to reconstruct the pre-failure topography with historical aerial photographs allowed a robust volume estimation to be undertaken, and a 3D geometry for numerical modelling investigations was also obtained. IRT allowed discontinuity seepage to be mapped from long range. Repeated surveys may be undertaken to investigate seasonal groundwater fluctuation and seepage distribution throughout the slope. A similar analysis undertaken using field-based techniques would require strenuous hikes on slippery surfaces, especially after rainfall events and during snowmelt.
Remote sensing analysis conducted at the Block 731 focused on the characterization of the slope from a geological and geomechanical perspective. At this site, only the lowermost zone of the slope is accessible. Remote sensing techniques allowed discontinuity orientation data to be collected from areas, which would otherwise only be accessible using ropes. The short survey range allowed for a high-density 3D point cloud to be collected, enhancing the visibility of features at the centimeter scale. HSI was noted to be effective for detailed lithological mapping at this site in view of (a) the short range of the survey, which allowed for high resolution images and (b) the accessibility of the slope, which allowed calibrated targets to be the positioned on the investigated surface. Future analysis will include (a) the identification of the end-members and (b) the comparison of their spectral signature with a spectral library database to reliably identify the mineralogical composition of the rock.
At the Palliser rockslide site, two orthogonal scanline surveys were conducted at the base of the slope. Such a configuration was critical to limit orientation bias [61]. The ability to perform scanline mapping in the field is strictly dependent on the availability and orientation of accessible outcrops. TDP 3D models significantly increased the number of locations that could be used for discontinuity mapping and allowed window mapping to be undertaken. The analysis of TDP 3D models at the Palliser rockslide allowed a detailed characterization of the discontinuities in inaccessible areas to be performed, including the analysis of bedding plane waviness. TLS surveys conducted in 2017 also provided high resolution point clouds. Compared to TDP models and high-resolution photographs, the TLS datasets also include reflectance data. Reflectance represents the ratio of the reflected pulse amplitude to the amplitude value of a diffusely reflecting white target, and is independent of distance to the slope [80]. Its value is affected by various factors, such as weathering and moisture, and, therefore, it allows preliminarily analysis and mapping of surface alteration and discontinuity seepage. Future work at the Palliser rockslide will comprise large-scale structural analyses, including the characterization of the Serrail Creek Syncline, and further small-scale, window discontinuity mapping and rock mass characterization of the rock slope. Additionally, using an integrated TLS-high resolution photograph dataset, a 3D analysis will be undertaken to investigate the areal percentage of failed rock bridge, and to examine its variations throughout the rupture surface.
Geological investigations conducted at the Frank Slide site included field-based analyses (discontinuity mapping, rock mass quality estimation, intact rock strength estimation) performed behind the 1903 headscarp. The rupture surface of the slide is inaccessible due to slope steepness. The long-range TDP survey allowed 3D models of the slope to be constructed and used to perform rock mass characterization. TLS investigations were also undertaken. Due to the limited range of the Optech ILRIS3D laser scanner, however, the survey stations were located in the area of North Peak, providing a better line of sight for the analysis of the South Peak area. The use of a longer-range instrument, such as the VZ-4000, allowed a TLS survey to be performed from various locations within the slide deposit, from a distance of over 2 km. An IRT survey was also performed from the Frank Slide Interpretive Center. It was noted that the survey distance affects the resolution of the dataset but does not prevent the collection of thermal data. Therefore, IRT potentially allows sufficiently extended areas (possibly, three or four times the ground pixel size) characterized by discontinuity seepage to be identified and mapped at very long range. Likewise, a HSI survey allowed a low resolution dataset to be collected. Although lithological variations were observed across the slope, quantitative analyses could not be undertaken due to (a) the large ground pixel size of the dataset, which causes the spectral response of the rock to be averaged over a large area, and (b) to the lack of spectrally calibrated targets on the rock face.
The field-based geological investigation at the Vajont Slide predominantly involved the detailed, geomorphological characterization of the slide deposit. Accessible locations for field mapping along the rupture surface were, instead, limited, and located on steep, scree-covered slopes. Mapping of small-scale structures (folds, faults, jointing) could be undertaken at these locations. Additionally, the analysis of centimeter-scale clayey layers that contributed to the 1963 event was possible only by direct observation of the outcrops. Conversely, comprehensive discontinuity mapping of inaccessible slopes, including the sliding surface and the sub-vertical, eastern, lateral release surface, could only be performed using long-range TDP surveys; 3D TDP models were also employed to perform advanced topographic analyses in ArcGIS and Polyworks, highlighting the bowl-shaped morphology of the rupture surface.
5. Summary: Experience Gained and Lessons Learned
Throughout the past 15 years, many rock slopes and rockslide sites have been investigated in Canada and abroad using field methods and multiple remote sensing techniques. This extensive experience has allowed us to gain knowledge and understanding of the advantages, limitations, and potential uses of the various techniques both at short and long range.
5.1. ALS, UAV-SfM, Aerial Imagery
Aerial datasets allow geoscientists to perform preliminary, large-scale structural, and geomorphic characterization of the investigated area, as well as preliminary, low-resolution change detection analyses. A great advantage of ALS, compared to UAV-SfM and aerial imagery, is the possibility of providing BE datasets in which vegetation and human structures are digitally removed from the dataset. This allows for structural lineaments and geomorphic features to be identified and mapped even on vegetated slopes. Conversely, structural investigations using UAV-SfM and aerial imagery are reliable almost exclusively on non-vegetated surfaces, or for the mapping of large geomorphic features. UAV-SfM, however, can provide high-quality datasets at a relatively low cost. The dataset resolution will depend on the flight height and the specifications of the camera. Aerial imagery can also be employed for geomorphic and structural interpretation, including 3D model reconstruction using an SfM approach (depending on the amount and overlap of the photographs), with the additional advantage that historic photographic imagery can be retrieved from public authorities and institutions. In general, aerial techniques are poorly suited for the investigation of vertical or subvertical rock slopes, due to the unfavorable line of sight.
5.2. TDP, SfM, and TLS
The collection of TDP and TLS datasets provides the means for extensive discontinuity data collection, including orientation, persistence, and spacing, at both long- and short-range, as well as performing geomorphologic characterization and change detection analyses. While both techniques provide a 3D point cloud or mesh of the slope, there are key advantages and limitations, depending on the characteristic of the site and the environmental conditions. Sampling bias associated with TDP and TLS discontinuity characterization are discussed in [62].
The accessibility and visibility of the slope is the first aspect that should be considered in order to choose the most appropriate remote sensing method. Our experience shows that TLS provides highly reliable data with the minimum effort. A single scanning station is generally sufficient to provide a 3D dataset adequate for discontinuity mapping and rock mass characterization. Nevertheless, scanning from multiple locations is preferable to avoid occlusions due to vegetation or changes in rock slope surface orientation. Conversely, TDP and SfM always require a minimum of two camera stations, and the resulting 3D model will exclusively comprise surfaces that are visible from both stations. Therefore, the use of more than two camera stations is recommended. This precaution, although beneficial in preventing occlusions due to variable orientation of the rock slope, can sometimes be impractical, due to difficult terrain conditions, limited accessibility, and limited visibility. The use of oblique, aerial-based techniques (e.g., UAV-SfM) may be considered to overcome this limitation.
TLS surveys were found to be effective in collecting 3D data with poor visibility conditions, due to fog, smoke, and/or rain. Although an increased number of unreliable echoes (e.g., mid-air points in the point cloud) are generally obtained with poor visibility conditions, it was noted that cleaning the point cloud with filters typically available in the processing software (e.g., RiScan Pro) is a relatively easy task. Conversely, adequate visibility and weather conditions are critical for a successful TDP and SfM survey. Haze, fog, and smog can severely limit the visibility, especially at a long range, potentially preventing the collection of a reliable dataset. Conversely, completely clear, sunny conditions can cause the presence of shadows along the rock slope surface, which may result, both at long- and short-range, in areas of no-data or artifacts within the 3D model. We suggest that days with high, even clouds represent the best conditions for undertaking TDP and SfM surveys. It is noted that collecting RAW images (i.e., unprocessed, uncompressed files) may provide a means to considerably enhance the quality of the dataset, by (a) brightening the surfaces in shadow and (b) enhancing contrast and color intensity to improve the sharpness of photographs collected in hazy, foggy, or smoky conditions.
The distance from the slope can be critical in determining the technique to be used. Generally, high-resolution digital reflex cameras can provide longer survey ranges, depending on the visibility conditions. However, the ground pixel size (function of sensor size, focal length, and MegaPixel count) will increase linearly with the distance of observation, causing in turn a decrease in the detail of the photograph. In contrast, the maximum range of a TLS survey is a function of the instrument specifications, and it can further decrease if the rock slope comprises low reflectance material (e.g., seepage, dark-coloured rocks). Additionally, the radius of the emitted laser beam increases with the distanceas a function of the laser wavelength.. The beam footprint is the surface area of rock slope covered by the laser beam and represents the surface within which the position of the point in the cloud is averaged. This phenomenon, referred to as “beam divergence”, is exacerbated by atmospheric scattering, and causes sharp edges on the rock slope to look “smoothed” in dense point clouds collected from very long range. It is stressed that very dense point clouds are not necessarily characterized by higher detail; on the contrary, they may be unnecessarily large (in terms of file size) and provide the surveyor with a false sense of confidence.
5.3. High-resolution Photography
High-resolution photography provides a means to investigate small details within a rock slope from long range. High-resolution imagery may be used for the construction of 3D TPD and SfM models, if imagery is collected from multiple stations. However, the construction of 3D models using very high-resolution imagery (e.g., 50 MegaPixel) may require long runtime and a high computational effort, due to the large file size of this type of imagery. For instance, a single high-quality jpeg image collected using the Canon EOS 5Ds-R may be up to 30 MB, whereas a RAW file may take up to 100 MB. Limitations of high-resolution photography are similar to those of TDP and SfM surveys, with regard to visibility, weather conditions, and presence of shadows along the investigated slope.
5.4. IRT and HSI
Both IRT and HSI can characterize the emitted and reflected infrared radiation of rock slopes,respectively, and they share similar advantages and limitations. IRT and HSI are generally characterized by a relatively low resolution, due to the limited number of pixels within the sensors. This results in large ground pixel size values at long distance, which prevent the observation of small details. However, it has been shown that long-range analyses are still able to provide important information on the large-scale spatial distribution of seepage (see IRT dataset of Hope Slide) and lithological variation (as in the HSI dataset of Frank Slide) within a rock slope. In contrast, the resolution of these techniques allows the collection of high-quality datasets at short range, as observed at the Block 731 site.
IRT surveys are generally easier and faster, compared to HSI. Thermal cameras provide 2D datasets that can be observed in real time, and instantaneously collected. Conversely, ground-based, HSI systems used for geological application (such as the Specim SWIR3) generally comprise push-broom sensors, which consist of a single column of pixels. Therefore, in order to collect an hyperspectral cube [81], the scanner needs to physically move using a rotor, increasing the time required for the survey.
The analysis and interpretation of IRT datasets is straightforward, and no correction is generally required to identify relative temperature differences. The thermal image is exported as a raster image in which each pixel is color-coded based on the temperature of the slope. More advanced investigations, however, can be undertaken by analyzing the temperature variation with time during the cooling cycle of the rock [21]. The interpretation of HSI datasets is more complex and requires familiarity with the processing software and the characteristics of hyperspectral datasets. The output of an HSI survey is a 3D cube that contains the irradiation data of the investigated object. Such a dataset requires a substantial amount of filtering and calibration before any quantitative analysis can be undertaken. An important part of this procedure is the correction of the dataset, using an empirical-line approach [41], which requires one (or, preferably, two) spectrally calibrated targets that should be positioned next to the investigated slope. While this does not present difficulties at short range, at long range multiple issues may arise, including (a) potential difficulties in accessing the investigated slope, (b) the need for larger spectrally calibrated targets, due to the increased ground pixel size, and (c) the need to consider the impact of atmospheric effects if a significant variation in distance exists across the scene.
5.5. Potential Applications of Remote Sensing Techniques
Remote sensing techniques can be instrumental in providing reliable datasets for rock slopes that are inaccessible due to steepness, ongoing instability, and safety concerns in general. The workflow in Figure 8 summarizes the potential applications of each of the described remote sensing techniques in the characterization of rock slopes, emphasizing the scale (i.e., range) of the analysis.
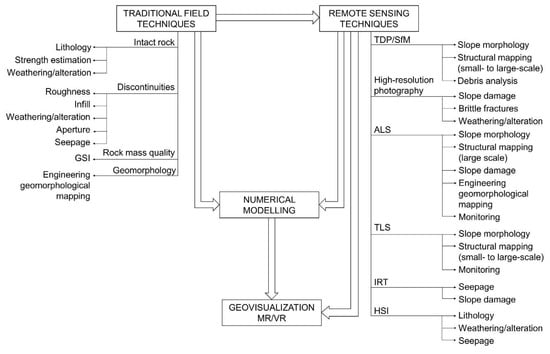
Figure 8.
Workflow describing an approach for the comprehensive analysis of rock slopes.
The data collected using both traditional field and remote sensing techniques may be used to perform preliminary and advanced numerical modelling investigation, which can provide a better understanding of the potential failure mechanisms that affect or affected the slope [12].
The interpretation of the collected data and numerical modelling results can be enhanced by using advanced geovisualization methods, such as mixed reality (MR) and virtual reality (VR), which allow for the observation of 3D datasets and numerical simulations in an immersive virtual environment [82].
6. Conclusions
The comprehensive characterization of rock slopes is critical to the identification of the failure mechanisms and factors that control their stability. Steepness of the slopes, rock fall activity, difficult terrain, and other safety concerns are some of the factors that may prevent collection of geological, structural, geomorphological, and hydrogeological data using traditional field methods. Therefore, remote sensing surveys often represents a critical task in the characterization and stability analysis of high rock slopes.
Photogrammetric (TDP and SfM) and laser scanner techniques (TLS and ALS) are routinely employed for the characterization of rock slopes and rock masses at various scales. However, the analysis of 3D datasets predominantly focuses on discontinuity mapping, including orientation, persistence, and spacing. Our experience suggests that the integrated use of multiple remote sensing techniques can improve our understanding of the geological and geomorphological processes and factors that govern the stability of rock slopes. Research conducted within the Engineering Geology and Resource Geotechnics Research Group at Simon Fraser University has demonstrated potential applications of various techniques in the investigation of rock slopes and landslides. In this paper, we have provided a summary of some of the sites investigated throughout the past 15 years and highlighted advantages, limitations, and potential application of the various remote sensing techniques employed. Aerial datasets, including ALS, UAV-SfM, and aerial imagery, can be employed to perform large scale, structural and geomorphological characterization of the investigated area. Ground-based methods, such as TDP, SfM, TLS, and high-resolution photography are instrumental in collecting structural and geomorphological data at various ranges, including slope and brittle damage analysis both in 2D and 3D. IRT can be effectively used to investigate and map groundwater seepage. More recently, ground-based HSI has been introduced for the lithological characterization of rock slopes, and potential applications include surface weathering and alteration investigation, shear zone characterization, and rock fall scar analyses.
Despite the successful application of these techniques in the characterization of rock slopes and landslides, we emphasize that traditional field methods are still required to collect extremely important geological and geotechnical data, including intact rock strength, discontinuity infill characteristics, and joint conditions. Therefore, remote sensing techniques should not be considered a substitute for traditional geotechnical field techniques, rather as complementary tools that can greatly enhance our understanding of the processes and mechanisms governing the stability of rock slopes and landslides.
Author Contributions
Conceptualization, Doug Stead; Writing-Original Draft Preparation, Doug Stead and Davide Donati; Writing-Review & Technical Editing, Andrea Wolter and Matthieu Sturzenegger; Supervision, Doug Stead; Funding Acquisition, Doug Stead.
Funding
The authors would like to acknowledge financial support provided through a NSERC Discovery Grant (ID: RGPIN 05817) and FRBC Endowment funds provided to Doug Stead. A KEY Big Data graduate scholarship was provided to Davide Donati.
Acknowledgments
The authors acknowledge the contribution of three anonymous reviewers that improved the quality of the paper. The authors would like to acknowledge Parks Canada for allowing remote sensing surveys to be undertaken within Banff, Jasper, and Glacier National Parks (permit number: JNP-2017-24719).
Conflicts of Interest
The authors declare no conflict of interest.
References
- Petley, D. Global patterns of loss of life from landslides. Geology 2012, 40, 927–930. [Google Scholar] [CrossRef]
- Seneviratnen, S.; Nicholls, N.; Easterling, D.; Goodess, C.M.; Kannae, S.; Kossin, J.; Luo, Y.W.; Marengo, J.A.; Mcinnes, K.L.; Rahimi, M.; et al. Changes in climate extremes and their impacts on the natural physical environment: An overview of the IPCC SREX report. In Managing the Risks of Extreme Events and Disasters to Advance Climate Change Adaptation; Cambridge University Press: Cambridge, UK; New York, NY, USA, 2012; pp. 109–230. [Google Scholar]
- Gariano, S.; Guzzetti, F. Landslides in a changing climate. Earth-Sci. Rev. 2016, 162, 227–252. [Google Scholar] [CrossRef]
- Agliardi, F.; Crosta, G.; Zanchi, A. Structural constraints on deep-seated slope deformation kinematics. Eng. Geol. 2001, 59, 83–102. [Google Scholar] [CrossRef]
- Brideau, M.-A.; Yan, M.; Stead, D. The role of tectonic damage and brittle rock fracture in the development of large rock slope failures. Geomorphology 2009, 103, 30–49. [Google Scholar] [CrossRef]
- Havaej, M.; Stead, D.; Mayer, J.; Wolter, A. Modelling the relation between failure kinematics and slope damage in high rock slopes using a lattice scheme approach. In Proceedings of the 48th US Rock Mechanics/Geomechanics Symposium, Minneapolis, MN, USA, 25–28 June 2014; ARMA: New York, NY, USA, 2014. [Google Scholar]
- Spreafico, M.C.; Cervi, F.; Francioni, M.; Stead, D.; Borgatti, L. An investigation into the development of toppling at the edge of fractured rock plateaux using a numerical modelling approach. Geomorphology 2017, 288, 83–98. [Google Scholar] [CrossRef]
- Gischig, V.S.; Eberhardt, E.; Moore, J.R.; Hungr, O. On the seismic response of deep-seated rock slope instabilities—Insights from numerical modeling. Eng. Geol. 2015, 193, 1–18. [Google Scholar] [CrossRef]
- Preisig, G.; Eberhardt, E.; Smithyman, M.; Preh, A.; Bonzanigo, L. Hydromechanical Rock Mass Fatigue in Deep-Seated Landslides Accompanying Seasonal Variations in Pore Pressures. Rock Mech. Rock Eng. 2016, 49, 2333–2351. [Google Scholar] [CrossRef]
- Clayton, A.; Stead, D.; Kinakin, D.; Wolter, A. Engineering geomorphological interpretation of the Mitchell Creek Landslide, British Columbia, Canada. Landslides 2017, 14, 1655–1675. [Google Scholar] [CrossRef]
- Leith, K.J. Stress Development and Geomechanical Controls on the Geomorphic Evolution of Alpine Valleys. Ph.D. Thesis, ETH Zurich, Zürich, Switzerland, 2012. [Google Scholar]
- Donati, D.; Stead, D.; Brideau, M.-A.; Ghirotti, M. A remote sensing approach for the derivation of numerical modelling input data: Insights from the Hope Slide, Canada. In Proceedings of the ‘Rock Mechanics for Africa’, Proceedings of the ISRM International Symposium AfriRock Conference, Capetown, South Africa, 3–5 October 2017. [Google Scholar]
- Romeo, S.; Di Matteo, L.; Kieffer, D.; Tosi, G.; Stoppini, S.; Radcioni, F. The use of gigapixel photogrammetry for the understanding of landslide processes in alpine terrain. Geosciences 2019, 9, 99. [Google Scholar] [CrossRef]
- Francioni, M.; Salvini, R.; Stead, D.; Coggan, J. Improvements in the integration of remote sensing and rock slope modelling. Nat. Hazards 2018, 90, 975–1004. [Google Scholar] [CrossRef]
- Francioni, M.; Salvini, R.; Stead, D.; Giovannini, R.; Riccucci, S.; Vanneschi, C.; Gullì, D. An integrated remote sensing-GIS approach for the analysis of an open pit in the Carrara marble district, Italy: Slope stability assessment through kinematic and numerical methods. Comput. Geotech. 2015, 67, 46–63. [Google Scholar] [CrossRef]
- Francioni, M.; Coggan, J.; Eyre, M.; Stead, D. A combined field/remote sensing approach for characterizing landslide risk in coastal areas. Int. J. Appl. Earth Obs. Geoinf. 2018, 67, 79–95. [Google Scholar] [CrossRef]
- Abellán, A.; Oppikofer, T.; Jaboyedoff, M.; Rosser, N.J.; Lim, M.; Lato, M.J. Terrestrial laser scanning of rock slope instabilities. Earth Surf. Process. Landf. 2014, 39, 80–97. [Google Scholar] [CrossRef]
- Kromer, R.A.; Hutchinson, D.J.; Lato, M.J.; Gauthier, D.; Edwards, T. Identifying rock slope failure precursors using LiDAR for transportation corridor hazard management. Eng. Geol. 2015, 195, 93–103. [Google Scholar] [CrossRef]
- Vivas, J.B. Groundwater Characterization and Modelling in Natural and Open Pit Rock Slopes. Master’s Thesis, Simon Fraser University, Burnaby, BC, Canada, 2014. [Google Scholar]
- Kurz, T.H.; Buckley, S.J.; Howell, J.A. Close range hyperspectral imaging integrated with terrestrial lidar scanning applied to rock characterisation at centimetre scale. ISPRS Int. Arch. Photogramm. Remote Sens. Spat. Inf. Sci. 2012, XXXIX-B5, 417–422. [Google Scholar] [CrossRef]
- Teza, G.; Marcato, G.; Castelli, E.; Galgaro, A. IRTROCK: A MATLAB toolbox for contactless recognition of surface and shallow weakness of a rock cliff by infrared thermography. Comput. Geotech. 2012, 45, 109–118. [Google Scholar] [CrossRef]
- Buckley, S.J.; Kurz, T.H.; Howell, J.A.; Schneider, D. Terrestrial LiDAR and hyperspectral data fusion products for geological outcrop analysis. Comput. Geosci. 2013, 54, 249–258. [Google Scholar] [CrossRef]
- Hoek, E.; Kaiser, P.K.; Bawden, W.F. Support of Underground Excavations in Hard Rock; CRC Press: Boca Raton, FL, USA, 1995. [Google Scholar]
- ISRM. Suggested methods for the quantitative description of discontinuities in rock masses. Int. J. Rock Mech. Min. Sci. Abstr. 1978, 15, 319–368. [Google Scholar] [CrossRef]
- Barton, N. The shear strength of rock and rock joints. Int. J. Rock Mech. Min. Sci. Abstr. 1976, 13, 255–279. [Google Scholar] [CrossRef]
- Hoek, E.; Brown, E.T. The Hoek–Brown failure criterion and GSI—2018 edition. J. Rock Mech. Geotech. Eng. 2019, 11, 445–463. [Google Scholar] [CrossRef]
- Doornkamp, J.C.; Brunsden, D.; Jones, D.K.C.; Cooke, R.U.; Bush, P.R. Rapid geomorphological assessments for engineering. Q. J. Eng. Geol. Hydrogeol. 2007, 12, 189–204. [Google Scholar] [CrossRef]
- Griffiths, J.S.; Stokes, M.; Stead, D.; Giles, D. Landscape evolution and engineering geology: Results from IAEG Commission 22. Bull. Eng. Geol. Environ. 2012, 71, 605–636. [Google Scholar] [CrossRef]
- Birch, J.S. Using 3DM Analyst mine mapping suite for rock face characterisation. Available online: http://www.adamtech.com.au/3dm/GoldenRocks.pdf (accessed on 20 April 2019).
- Westoby, M.J.; Brasington, J.; Glasser, N.F.; Hambrey, M.J.; Reynolds, J.M. ‘Structure-from-Motion’ photogrammetry: A low-cost, effective tool for geoscience applications. Geomorphology 2012, 179, 300–314. [Google Scholar] [CrossRef]
- AdamTechnology. 3DM Analyst Mine Mapping Suite 2.5—User’s manual. Unpublished work. 2015. [Google Scholar]
- Agisoft LLC. Photoscan 1.4, 2017. Available online: https://www.agisoft.com (accessed on 1 May 2019).
- Oppikofer, T.; Jaboyedoff, M.; Blikra, L.; Derron, M.-H.; Metzger, R. Characterization and monitoring of the Åknes rockslide using terrestrial laser scanning. Nat. Hazards Earth Syst. Sci. 2009, 9, 1003–1019. [Google Scholar] [CrossRef]
- Riegl LMS GmbH. RiSCAN Pro version 2.6, 2018. Available online: http://www.riegl.com/ (accessed on 20 April 2019).
- CloudCompare (version 2.10) [GPL software]. 2018. Available online: http://www.cloudcompare.org/ (accessed on 1 May 2019).
- InnovMetric. PolyWorks 2018 IR10.1. Available online: https://www.innovmetric.com/en (accessed on 20 May 2019).
- Baroň, I.; Bečkovský, D.; Míča, L. Application of infrared thermography for mapping open fractures in deep-seated rockslides and unstable cliffs. Landslides 2014, 11, 15–27. [Google Scholar] [CrossRef]
- FLIR Systems Inc. ResearchIR 4, 2015. Available online: https://www.flir.com/products/researchir/ (accessed on 20 May 2019).
- Hunt, G.R. Electromagnetic radiation; the communication link in remote sensing. In Remote Sensing in Geology; Siegal, B.S., Gillespie, A.R., Eds.; John Wiley & Sons: Hoboken, NJ, USA, 1980; pp. 5–45. [Google Scholar]
- Van Der Meer, F.D.; Van Der Werff, H.M.A.; Van Ruitenbeek, F.J.A.; Hecker, C.A.; Bakker, W.H.; Noomen, M.F.; Van Der Meijde, M.; Carranza, E.J.M.; De Smeth, J.B.; Woldai, T. Multi- and hyperspectral geologic remote sensing: A review. Int. J. Appl. Earth Obs. Geoinf. 2012, 14, 112–128. [Google Scholar] [CrossRef]
- Kurz, T.H.; Buckley, S.J.; Howell, J.A. Close-range hyperspectral imaging for geological field studies: Workflow and methods. Int. J. Remote Sens. 2013, 34, 1798–1822. [Google Scholar] [CrossRef]
- Harris Geospatial Solutions. ENVI 5.5, 2018. Available online: https://www.harrisgeospatial.com/Software-Technology/ENVI (accessed on 20 June 2019).
- Mathews, W.H.; McTaggart, K.C. The Hope Landslide, British Columbia. Proc. Geol. Assoc. Can. 1969, 20, 65–75. [Google Scholar]
- Weichert, D.; Horner, R.B.; Evans, S.G. Seismic signatures of landslides: The 1990 Brenda mine collapse and the 1965 Hope rockslides. Bull. Seismol. Soc. Am. 1994, 84, 1523–1532. [Google Scholar]
- Von Sacken, R. New Data and Re-Evaluation of the 1965 Hope Slide, British Columbia. Master’s Thesis, University of British Columbia, Vancouver, BC, Canada, 1991. [Google Scholar]
- Donati, D. The Characterization of Slope Damage Using an Integrated Remote Sensing-Numerical Modelling Approach. Ph.D. Thesis, Simon Fraser University, Burnaby, BC, Canada. In preparation.
- Brideau, M.A.; Stead, D.; Kinakin, D.; Fecova, K. Influence of tectonic structures on the Hope Slide, British Columbia, Canada. Eng. Geol. 2005, 80, 242–259. [Google Scholar] [CrossRef]
- Donati, D. A Structural Investigation of the Hope Slide, BC, Using Terrestrial Photogrammetry and Rock Mass Characterization. Master’s Thesis, University of Bologna, Bologna, Italy, 2012. [Google Scholar]
- ESRI. ArcGIS 10.5, 2017. Available online: https://desktop.arcgis.com/en/ (accessed on 20 June 2019).
- Corkum, A.G.; Martin, C.D. Analysis of a rock slide stabilized with a toe-berm: A case study in British Columbia, Canada. Int. J. Rock Mech. Min. Sci. 2004, 41, 1109–1121. [Google Scholar] [CrossRef]
- Imrie, A.S.; Moore, D.P. The use of rock engineering to overcome adverse geology at Revelstoke Dam. Surf. Undergr. Proj. Case 1993, 5, 701–725. [Google Scholar] [CrossRef]
- Stewart, T.W.G.; Moore, D.P. Displacement behavior of the Checkerboard Creek rock slope. In Terrain Stability and Forest Management in the Interior of British Columbia; Jordan, P., Orban, J., Eds.; British Columbia Forest Science Program: British Columbia, BC, Canada, 2001; pp. 178–190. [Google Scholar]
- Read, P.B.; Brown, R.L. Columbia River fault zone: Southeastern margin of the Shuswap and Monashee complexes, southern British Columbia. Can. J. Earth Sci. 1981, 18, 1127–1145. [Google Scholar] [CrossRef]
- Martin, C.D.; Tannant, D.D.; Lan, H. Comparison of terrestrial-based, high resolution, LiDAR and digital photogrammetry surveys of a rock slope. In Rock Mechanics: Meeting Society’s Challenges and Demands; CRC Press: Boca Raton, FL, USA, 2007; pp. 925–932. [Google Scholar]
- Green, A.A.; Berman, M.; Switzer, P.; Graig, M.D. A transformation for ordering multispectral data in term of image quality with implications for noise removal0. IEEE Trans. Geosci. Remote Sens. 1988, 26, 65–74. [Google Scholar] [CrossRef]
- Smith, G.M.; Milton, E.J. The use of the empirical line method to calibrate remotely sensed data to reflectance. Int. J. Remote Sens. 1999, 20, 2653–2662. [Google Scholar] [CrossRef]
- McMechan, M.E. Geology and structure cross-section, Peter Lougheed Provincial Park, Alberta. In Geological Survey of Canada; Minister of Supply and Services Canada: Ottawa, ON, Canada, 1989. [Google Scholar]
- Jackson, L. Terrain inventory of the Kananaskis Lakes Map Area, Alberta. In Geological Survey of Canada; Minister of Supply and Services Canada: Ottawa, ON, Canada, 1987; 40p. [Google Scholar] [CrossRef]
- Sturzenegger, M.; Stead, D.; Gosse, J.; Ward, B.; Froese, C.R. Reconstruction of the history of the Palliser Rockslide based on 36Cl terrestrial cosmogenic nuclide dating and debris volume estimations. Landslides 2015, 12, 1097–1106. [Google Scholar] [CrossRef]
- Cruden, D.M.; Eaton, T.M. Reconnaissance of rockslide hazards in Kananaskis Country, Alberta. Can. Geotech. J. 1988, 25, 411. [Google Scholar] [CrossRef]
- Sturzenegger, M.; Stead, D. The Palliser Rockslide, Canadian Rocky Mountains: Characterization and modeling of a stepped failure surface. Geomorphology 2012, 138, 145–161. [Google Scholar] [CrossRef]
- Sturzenegger, M. Multi-Scale Characterization of Rock Mass Discontinuities and Rock Slope Geometry Using Terrestrial Remote Sensing Techniques. Ph.D. Thesis, Simon Fraser University, Burnaby, BC, Canada, 2010. [Google Scholar]
- Donati, D.; Stead, D.; Onserl, E. New approaches to characterize brittle fracture and damage in fractured rock masses. In Proceedings of the 10th Asian Rock Mechanics Symposium, Singapore, 29 October–3 November 2018. Paper ARMS10-P-0505. [Google Scholar]
- Cruden, D.M.; Martin, C.D. Before the Frank Slide. Can. Geotech. J. 2007, 44, 765–780. [Google Scholar] [CrossRef]
- Humair, F.; Pedrazzini, A.; Epard, J.L.; Froese, C.R.; Jaboyedoff, M. Structural characterization of Turtle Mountain anticline (Alberta, Canada) and impact on rock slope failure. Tectonophysics 2013, 605, 133–148. [Google Scholar] [CrossRef]
- McConnell, R.G.; Brock, R.W. Report on the Great Landslide at Frank, Alberta, Canada, 1903; Department of the Interior: Ottawa, ON, Canada, 1904. [Google Scholar]
- Benko, B.; Stead, D. The Frank slide: A reexamination of the failure mechanism. Can. Geotech. J. 1998, 35, 299–311. [Google Scholar] [CrossRef]
- Moreno, F.; Froese, C.R. Turtle Mountain Field Laboratory Monitoring and Research Summary Report, 2005; EUB/AGS Earth Sciences Report; Alberta Energy and Utilities Board: Calgary, AB, Canada, 2006. [Google Scholar]
- Froese, C.R.; Moreno, F.; Jaboyedoff, M.; Cruden, D.M. 25 years of movement monitoring on South Peak, Turtle Mountain: Understanding the hazard. Can. Geotech. J. 2009, 46, 256–269. [Google Scholar] [CrossRef]
- Wood, D.E.; Yusifabayov, J.A.; Chao, D.K.; Shipman, T.C. Turtle Mountain Field Laboratory, Alberta (NTS 82G): 2016 Data and Activity Summary; AER/AGS Open File Report; Alberta Energy Regulator: Calgary, AB, Canada, 2018. [Google Scholar]
- Brideau, M.-A.; Pedrazzini, A.; Stead, D.; Froese, C.R.; Jaboyedoff, M.; Van Zeyl, D. Three-dimensional slope stability analysis of South Peak, Crowsnest Pass, Alberta, Canada. Landslides 2011, 8, 139–158. [Google Scholar] [CrossRef]
- Sturzenegger, M.; Stead, D. Quantifying discontinuity orientation and persistence on high mountain rock slopes and large landslides using terrestrial remote sensing techniques. Nat. Hazards Earth Syst. Sci. 2009, 9, 267–287. [Google Scholar] [CrossRef]
- Semenza, E.; Ghirotti, M. History of the 1963 Vaiont slide: The importance of geological factors. Bull. Eng. Geol. Environ. 2000, 59, 87–97. [Google Scholar] [CrossRef]
- Hendron, A.J.; Patton, F.D. The Vaiont Slide, a Geotechnical Analysis Based on Geologic Observations of the Failure Surface; Technical Report; U.S. Army Corps of Engineers Waterways Experiment Station: Vicksburg, Mississippi, 1985; Volume 1. [Google Scholar]
- Costa, V.; Doglioni, C.; Grandesso, P.; Masetti, D.; Pellegrini, G.B.; Tracanella, E. Carta Geologica d’Italia alla scala 1:50.000. Note illustrative del F°063 Belluno, 1992; 74p. (In Italian). Available online: http://www.isprambiente.gov.it/Media/carg/veneto.html (accessed on 20 June 2019).
- Massironi, M.; Zampieri, D.; Superchi, L.; Bistacchi, A.; Ravagnan, R.; Bergamo, A.; Ghirotti, M.; Genevois, R. Geological structures of the Vajont landslide. Ital. J. Eng. Geol. Environ. 2013, 2013, 573–582. [Google Scholar] [CrossRef]
- Wolter, A.; Stead, D.; Ward, B.C.; Clague, J.J.; Ghirotti, M. Engineering geomorphological characterisation of the Vajont Slide, Italy, and a new interpretation of the chronology and evolution of the landslide. LandSlides 2016, 13, 1067–1081. [Google Scholar] [CrossRef]
- Wolter, A. Characterisation of Large Catastrophic Landslides Using an Integrated Field, Remote Sensing and Numerical Modelling Approach. Ph.D. Thesis, Simon Fraser University, Burnaby, BC, Canada, 2014. [Google Scholar]
- Wolter, A.; Stead, D.; Clague, J.J. A morphologic characterisation of the 1963 Vajont Slide, Italy, using long-range terrestrial photogrammetry. Geomorphology 2014, 206, 147–164. [Google Scholar] [CrossRef]
- Riegl. 3D Terrestrial Laser Scanner RIEGL VZ-4000—General Description and Data Interfaces, 2014. Available online: http://www.riegl.com/nc/products/terrestrial-scanning/produktdetail/product/scanner/30/ (accessed on 20 June 2019).
- Shaw, G.A.; Burke, H.K. Spectral imaging for remote sensing. Linc. Lab. J. 2003, 14, 3–28. [Google Scholar]
- Onsel, E.; Donati, D.; Stead, D.; Chang, O. 2018 Applications of virtual and mixed reality in rock engineering. In Proceedings of the 52nd US Rock Mechanics/Geomechanics Symposium, Seattle, WA, USA, 17–20 June 2018; 7p. [Google Scholar]


© 2019 by the authors. Licensee MDPI, Basel, Switzerland. This article is an open access article distributed under the terms and conditions of the Creative Commons Attribution (CC BY) license (http://creativecommons.org/licenses/by/4.0/).