1. Introduction
The Internet of Things (IoT) is shaping the development of the Information and Communication Technologies (ICT) sector [
1]. The possibility of seamlessly merging the real and virtual worlds through the massive deployment of embedded devices presents new and exciting opportunities for both research and business [
2]. With the development of sensors and the gradual maturity of sensing technology, the IoT is being widely applied in industrial process monitoring, production chain management, material supply chain management, product quality control, equipment maintenance, and other production processes [
3]. Since the IoT is becoming an increasingly popular topic for individuals, businesses, and governments, the need to develop prototypes focused on different phases of the IoT is growing. In the process and use phase, communication servers receive the collection data, then data streams are processed and forwarded for presentation through easy-to-understand visualization and interpretation tools that can be widely accessed on different platforms and have been designed for different applications. In the manufacturing field, equipment is virtualized in computers system based on digital twins where the digital twin system collects equipment information through sensors and displays real-time information using virtual objects in systems [
4,
5]. Obtaining remote device information through sensors and visualizing the information in the local system are convenient for users to monitor remote devices. Therefore, meaningful presentation and visualization are critical for IoT applications as more information is provided to consumers, and allows policymakers to convert data into knowledge—a process that is critical in helping the end user make decisions quickly [
6].
Visualizing geo-sensor data while regularly updating the presentation of the location is necessary [
7,
8]. A good method of providing this information is with a map. Many applications of geo-sensor data visualization are based on maps [
9,
10,
11]. Geo-sensor data transferred from the communication server can be stored in a geo-database and then visualized in a map using the render method. Using ArcInfo software as an example [
12], the map render methods include SimpleRenderer, UniqueValueRenderer, and ClassBreaksRenderer. Periodically refreshing the map using the UniqueValueRenderer method enables visualizing changing sensor data; however, a frequent refresh rate increases the burden on the system. In addition, an infrequent refresh rate means some changes in the sensor data are ignored. Therefore, refreshing the map periodically is not suitable for real-time visualization.
In order to visualize sensor data in real-time, ArcGIS provides another module, GeoEvent, to visualize the real-time sensor data stream. Sensor data represent the state of the geo-sensor device; the GeoEvent model visualizes the state of the sensor by establishing a mapping relation between the sensor data and map symbols. If the more states need to be visualized, then more symbols have to be defined. In the field of geo-sensor device management, which is based on map, the user often builds complex symbols to display the sensor device or visualized the two or more states of the device with one symbol. The real-time visualization method provided by GeoEvent does not meet the requirements of monitoring of multiple states of the device by one symbol in the manufacturing field.
Kubíček studied the integration of the information from flood warning services into a map according to the characteristics of the users, and real -time flood information was displayed on the map with map symbols based on the adaptive mapping method [
13]. Bouattoua realized a real-time information visualization process based on map symbols and chorem, which is a schematized representation, by abstracting the sensor data stream [
14]. These researches mainly focused on the geo-sensor data visualization process from the perspective of map cognition based on map symbols, but for real-time monitoring of a device, these methods still have certain limitations.
There are no single, well-defined methods to provide sensor data for real-time visualization on maps in the field of real-time monitoring of device. In our previous studies, we have outlined how to implement real-time sensor data visualization based on mapping sensor data items to graphic elements [
15], but the details are not elaborated in previous publications. In addition, previous studies did not involve how to build models for acquiring real-time sensor data and real-time sensor data visualization in client-server and browser-server GIS architecture. So, the following discussion describes the method of mapping geo-sensor data to graphic element in symbol, through which multiple device states can be represented using one map symbol, and the models required for real-time geo-sensor data visualization in GIS.
2. Sensor Data Acquisition and Visualization in the SCADA System
Traditionally, most sensor data acquisition and visualization were built around the supervisory control and data acquisition (SCADA) system, which is a system for remote monitoring and control that operates with coded signals over communication channels [
16,
17,
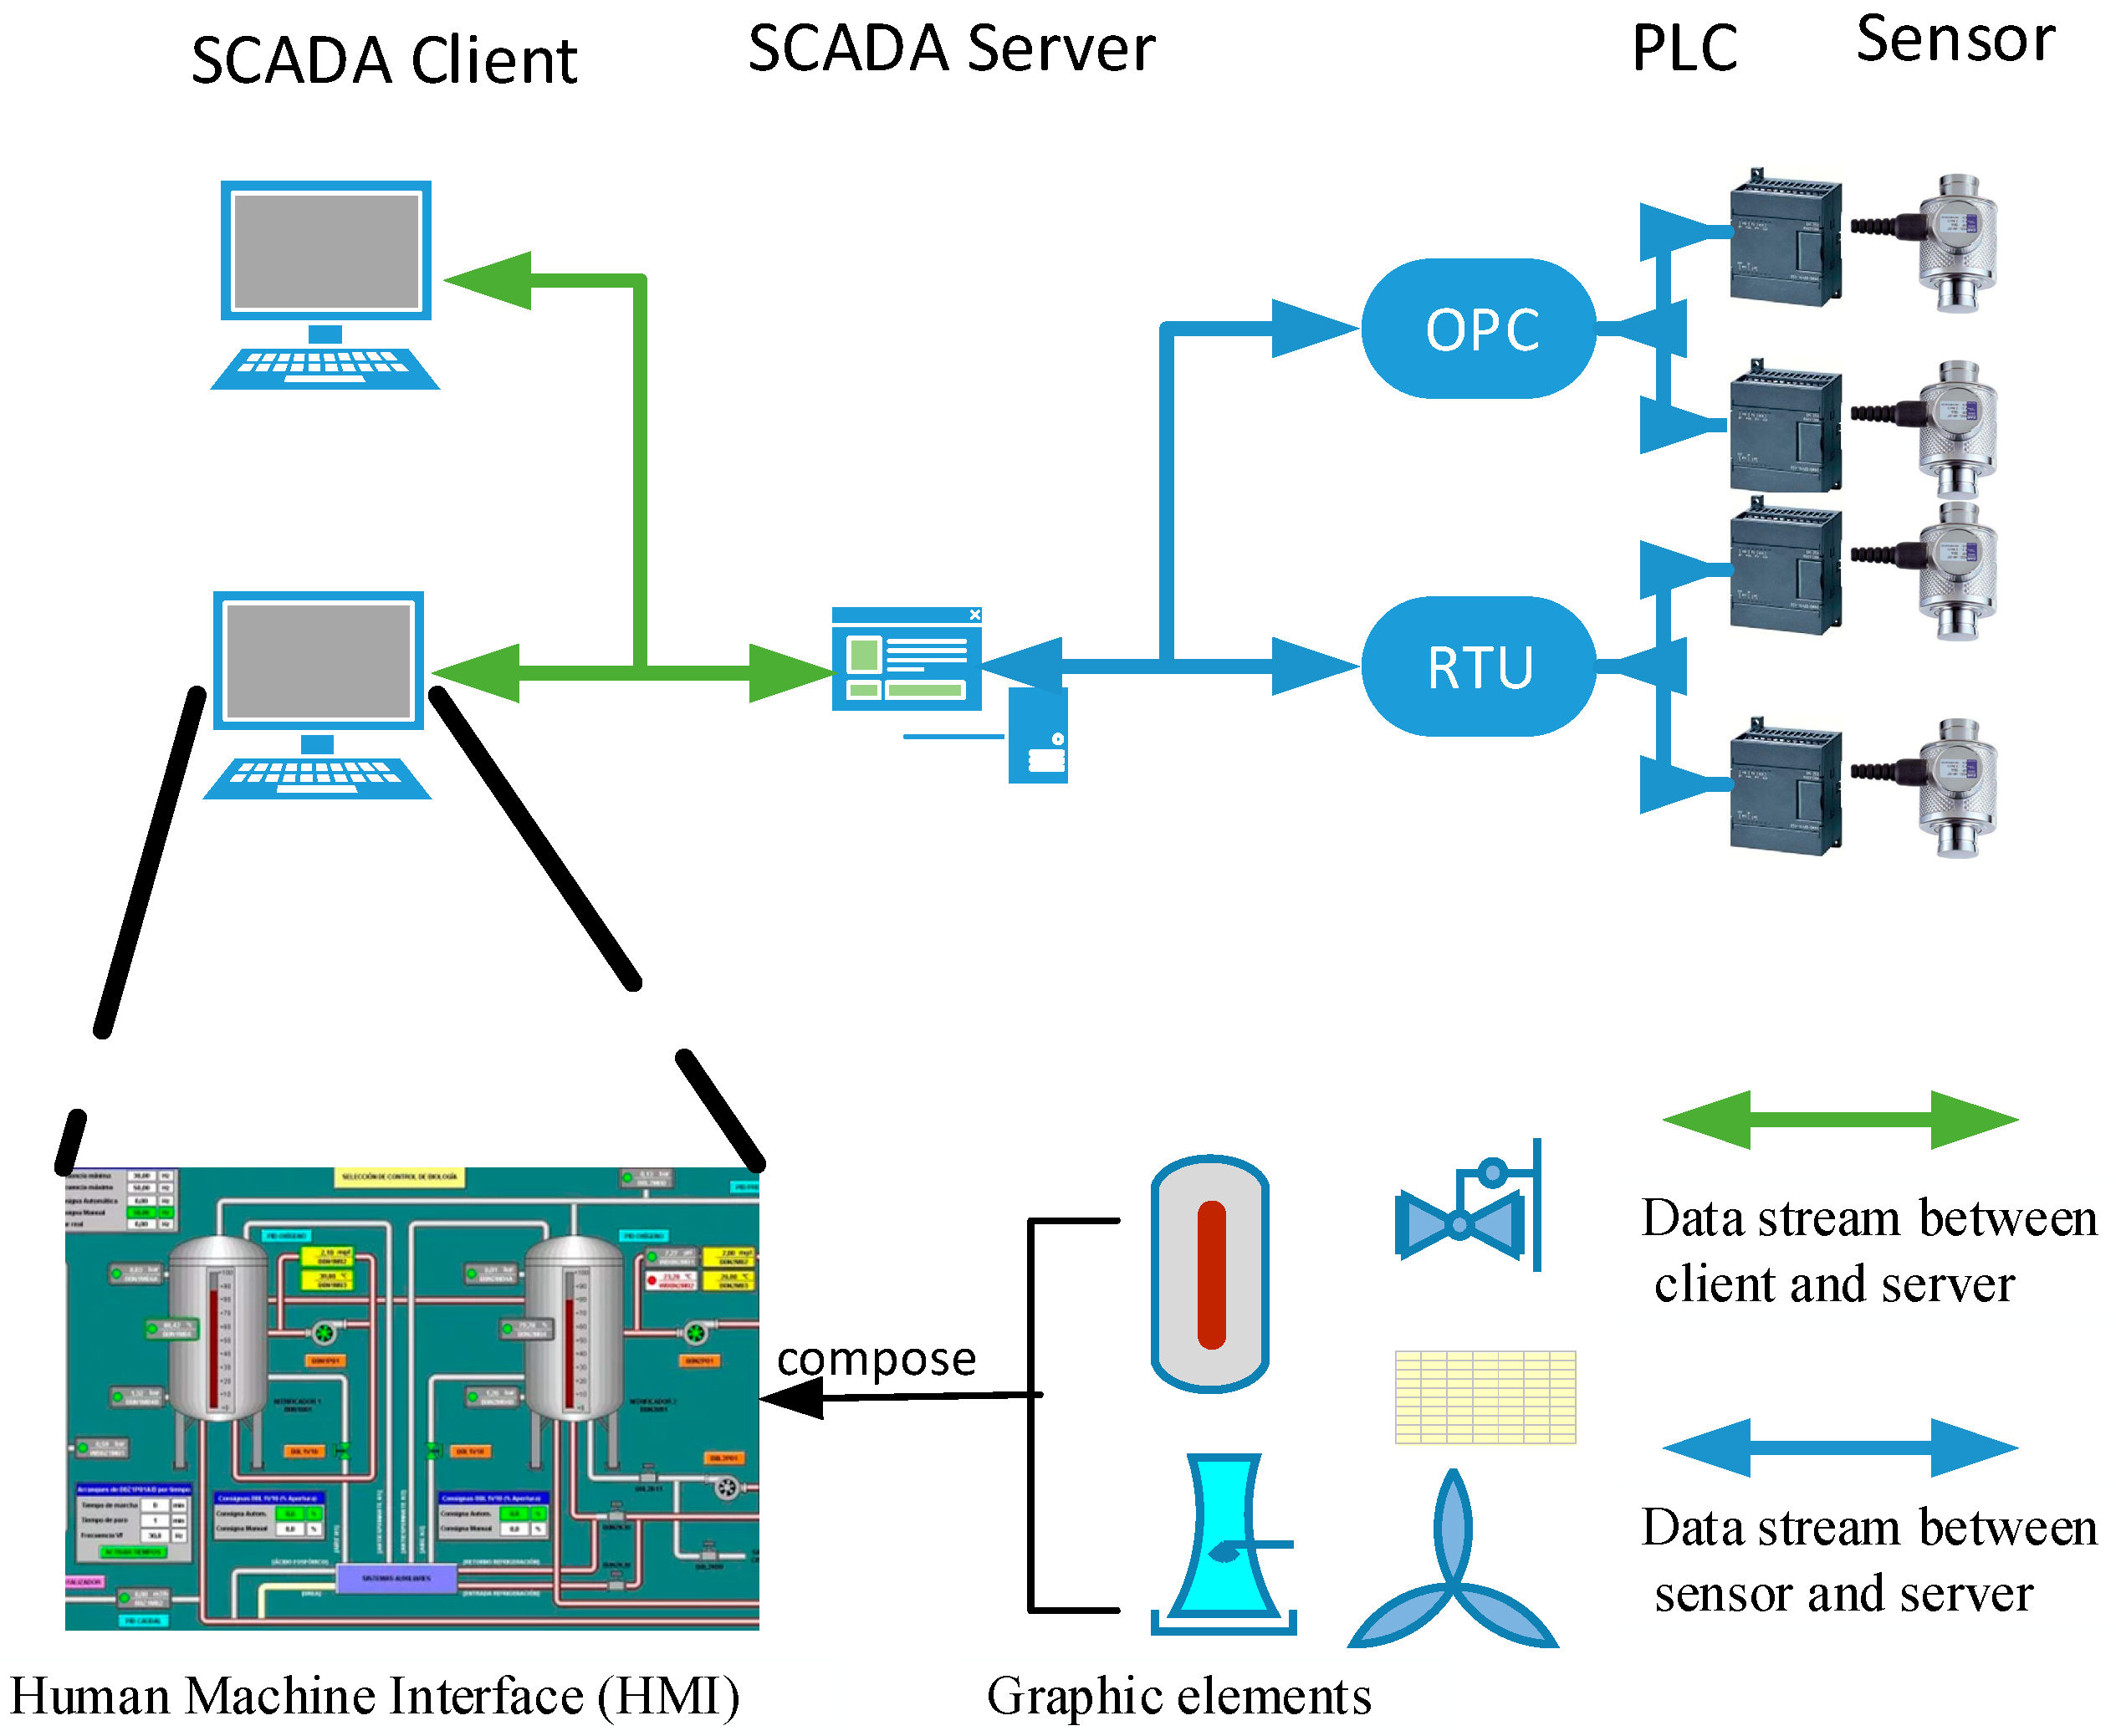
18]. In basic SCADA architectures, information from sensors is sent to programmable logic controllers (PLCs) or remote terminal units (RTUs), which then send that information to computers with SCADA software. SCADA software analyzes and displays the data in a human machine interface (HMI), where all the elements—trends, alarms, buttons, text arrays and other objects—are represented graphically in visualization screens (
Figure 1). The elements that constitute a graphical sketch of the monitoring site appear in the HMI. As the spatial scope of the monitoring site is small, the information can be presented in one scene (one picture). However, large-scope sensor arrays that are produced have been used worldwide in recent years. The location of the sensor data, which is commonly handled by the geographic information system (GIS), is increasingly important, and the implementation of geographical schematics in SCADA systems has been widely accepted. Ten proposed a framework to migrate a GIS database to a SCADA system where spatial data are converted to a scalable vector graphics (SVG) format to appear in an HMI [
19]. The authors employed international standards from both domains to enable information exchange between the SCADA and GIS systems, and then presented new concepts for bridging these systems [
8]. The above studies focused on how to transfer spatial information from a GIS to a SCADA system and presentation in an HMI but focused less on how to collect sensor data and perform visualization in a GIS.
A HMI, in providing a graphical presentation, should comply with the ISO 11064-5 specification. A graphic element is the basis of the HMI scene during sensor data acquisition and visualization [
20]. The user defines the system parameters to store real-time sensor data and then constructs mapping of the system parameters and the graphic elements. During the run time, when the system receives the sensor data, it triggers the HMI to refresh its screen. The HMI is refreshed according to the graphic element and mapping rules. For example, in InTouch (a SCADA system with a HMI), symbols composed of graphic elements and created by the symbol editor are placed in an InTouch window. After building the relationships between the sensor data and the graphics via the system parameters, changing sensor data drive changes in the graphics in the InTouch window.
For the visualization of geographic objects, the map in a GIS is a special HMI. The map is a symbolic representation of the selected characteristics of a place and presents information about the world in a simple and visual manner. Cartographers design and use symbols to represent geographic features. The procedure for creating a map with spatial features is similar to a HMI in a SCADA system. The geographic object is abstracted to a map symbol, which is composed of graphic elements, and then the symbol is rendered on the map. The key to visualizing real-time sensor data on a map is the mapping profile between the sensor data and the graphic elements in the map symbol, as with a SCADA system.
3. Mapping Profile Definition between Geo-sensor Data and Protocol-coupling Map Symbol
The traditional map symbols principles are based on the Bertin visual variable system [
21]. Map symbols describe the different characteristics of geographical entities using visual variables, such as size, hue, orientation, shape, location, texture, and density. According to geometric characteristics, map symbols are divided into marker symbols, line symbols, and fill symbols. Normally, geo-sensors are displayed on a map using marker symbols. Marker symbols include of a series of basic vector elements, such as ellipse, roundrect, rect, line, text, and circle. The visual variables of the marker symbols are determined by the drawing parameters of the vector elements (
Figure 2).
According to the process in SCADA, building the mapping of geo-sensor data and vector elements into a marker symbol is key to visualizing real-time sensor data on a map. Therefore, it is necessary to incorporate this mapping into the traditional marker symbol model for real-time data visualization of a geo-sensor device. The data collected by the geo-sensor were periodic, so the sensor data in the system are presented as discrete data. According to the principle of data visualization, different data types correspond to different visualization methods. For example, finite discrete data can be directly matched to different visual variables, and infinite discrete data can be divided into limited intervals, with each interval corresponding to different visual variables.
Production rules are widely used for representing knowledge in systems [
22,
23]. Bouattou [
14] defined a set of production rules to decide what the salient phenomena are, and then used in visualization process. Adly developed a knowledge-based system which is represented in production rules, and is used for planning Agricultural Land Drainage based on GIS [
24]. Any production rule consists of two parts: the IF part, called the antecedent (premise or condition) and the Then part called the consequent (conclusion or action). A production rule can have multiple antecedents joined by the keywords AND (conjunction), OR (disjunction) or a combination of both. In this study, the essential in mapping of geo-sensor data and graphic element is the mapping of intervals of geo-sensor data and visual variables, that is, when the sensor data is in different intervals, the graphic element is displayed as different visual variables. The relationship between geo-sensor data and visual variable is antecedent-consequent, so this research examined methods for expressing the mapping as a succinct collection of production rules in the form
IFconditionsTHENoutcomes.
System parameters used to store real-time sensor data in system running time were defined in
conditions. There was at least one set of logical expressions in
conditions; a logical expression defines the relationship between a system parameter and a threshold (e.g.,
Oilmass > 100), and different expressions are joined by logical operators (
not,
and,
or).
Outcomes are defined as
visual variable =
value (
Figure 2).
In this sample, graphic data were defined in lines 2 to 21, and the mapping was defined in lines 22 to 29. The two system parameters, Oilmass and isfilling, were defined and used to store sensor data in running time. The Oilmass parameter was mapped into color visual variables (lines 22 to 25)—the roundrect graphic element with the identification TY1 in the protocol-coupling symbol (line 3) corresponds to the Olimass parameter. The fill color changes to white—rgb(255,255,255) if Oilmass is less than 100; if Oilmass is more than 100, the fill color changes to red—rgb(255,0,0). The isfilling parameter was mapped into shape visual variables (lines 26 to 29), so if isfilling is true, the line graphic element TY8 (line 5) is invisible and the TY9 (line 7) graphic element is visible and vice versa.
4. Parsing Interface-Oriented Sensor Data Transmission Protocol
Through the IoT network, sensor data are transmitted from the sending side to the server side. At the transmitter, sensor data are serialized into a data stream (frame data) according to a certain sequence or organization mode. After receiving the data stream on the server, the data are deserialized in the same sequence or organization mode. The data organization agreement is called the data transmission protocol. In some IoT applications, the protocol is in an open format, such as eXtensible Messaging and Presence Protocol (XMPP) or Message Queuing Telemetry Transport (MQTT) [
25,
26]. In other applications, considering the system and data security, the application users define the transmission protocol with private format.
In the construction process of map symbols, establishing the mapping relationship between the geo-sensor data and the visual variable is crucial. Therefore, the map symbol builder must obtain the metadata information of the protocol during the map symbol construction process including data type, data name, data length, and data precision. In the map render process, the sensor data stream transmitted from the sending side should be converted into an open data format for data visualization. In the field of object-oriented programming, programmers often build drop-in replacements by declaring and implementing the same interface. The metadata interface (
IMetaData) and data-parsing interface (
IDataParser) for the data transmission protocol are defined. The metadata interface obtains the name and type of the item in the geo-sensor data which are used to the construct the map symbol. The data-parsing interface (
IDataParser) takes action on the server side when the geo-sensor data stream arrives. Two methods are in
IDataParser: the
FrameStart method and the
FrameEnd method. In the class that implements the data-parsing interface, the data stream is transformed from a private format into a public format. JavaScript Object Notation (JSON) is a lightweight text data exchange format independent of programming languages that is often used for data transmission in the IoT [
27,
28]. Thus, JSON is suitable for describing the sensor data after geo-sensor data stream parsing.
The protocol designers program the driver class, which implements the two interfaces (
IMetaData,
IDataParser). The map symbol constructor does not care about the structure of the transmission protocol. The metadata information of the geo-sensor data is obtained by
IMetaData and used for mapping definition. In the geo-sensor message broker running on the server, the geo-sensor data frame is converted to JSON format data by
IDataParser, then the JSON format data are used for real-time visualization. The designer of the protocol also protects the privacy of the protocol and the privacy of the sensor data (
Figure 3).
5. Architecture of Protocol-Coupling Map Symbol for Real-Time Visualization of Geo-Sensor Data
Traditionally, a geo-sensor device is abstracted into a symbol (graphics block) shown on a map. Users need to predefine marker symbols corresponding to different geo-sensor data. The protocol-coupling map symbol model includes three parts: graphic data, metadata of the sensor data, and the mapping profile (
Figure 2). Graphic data in the model are similar to the traditional marker symbol and are composed of basic graphic elements. The combination of a series of graphic elements forms complex marker symbols. Each graphic element contains identification (ID) and visual parameters, such as pen width, pen color, line style, fill color, and visibility. The metadata of the geo-sensor data describe the name and type of the sensor data item. The mapping profile describes the relationship between the sensor data and the visual parameters in a graphic element.
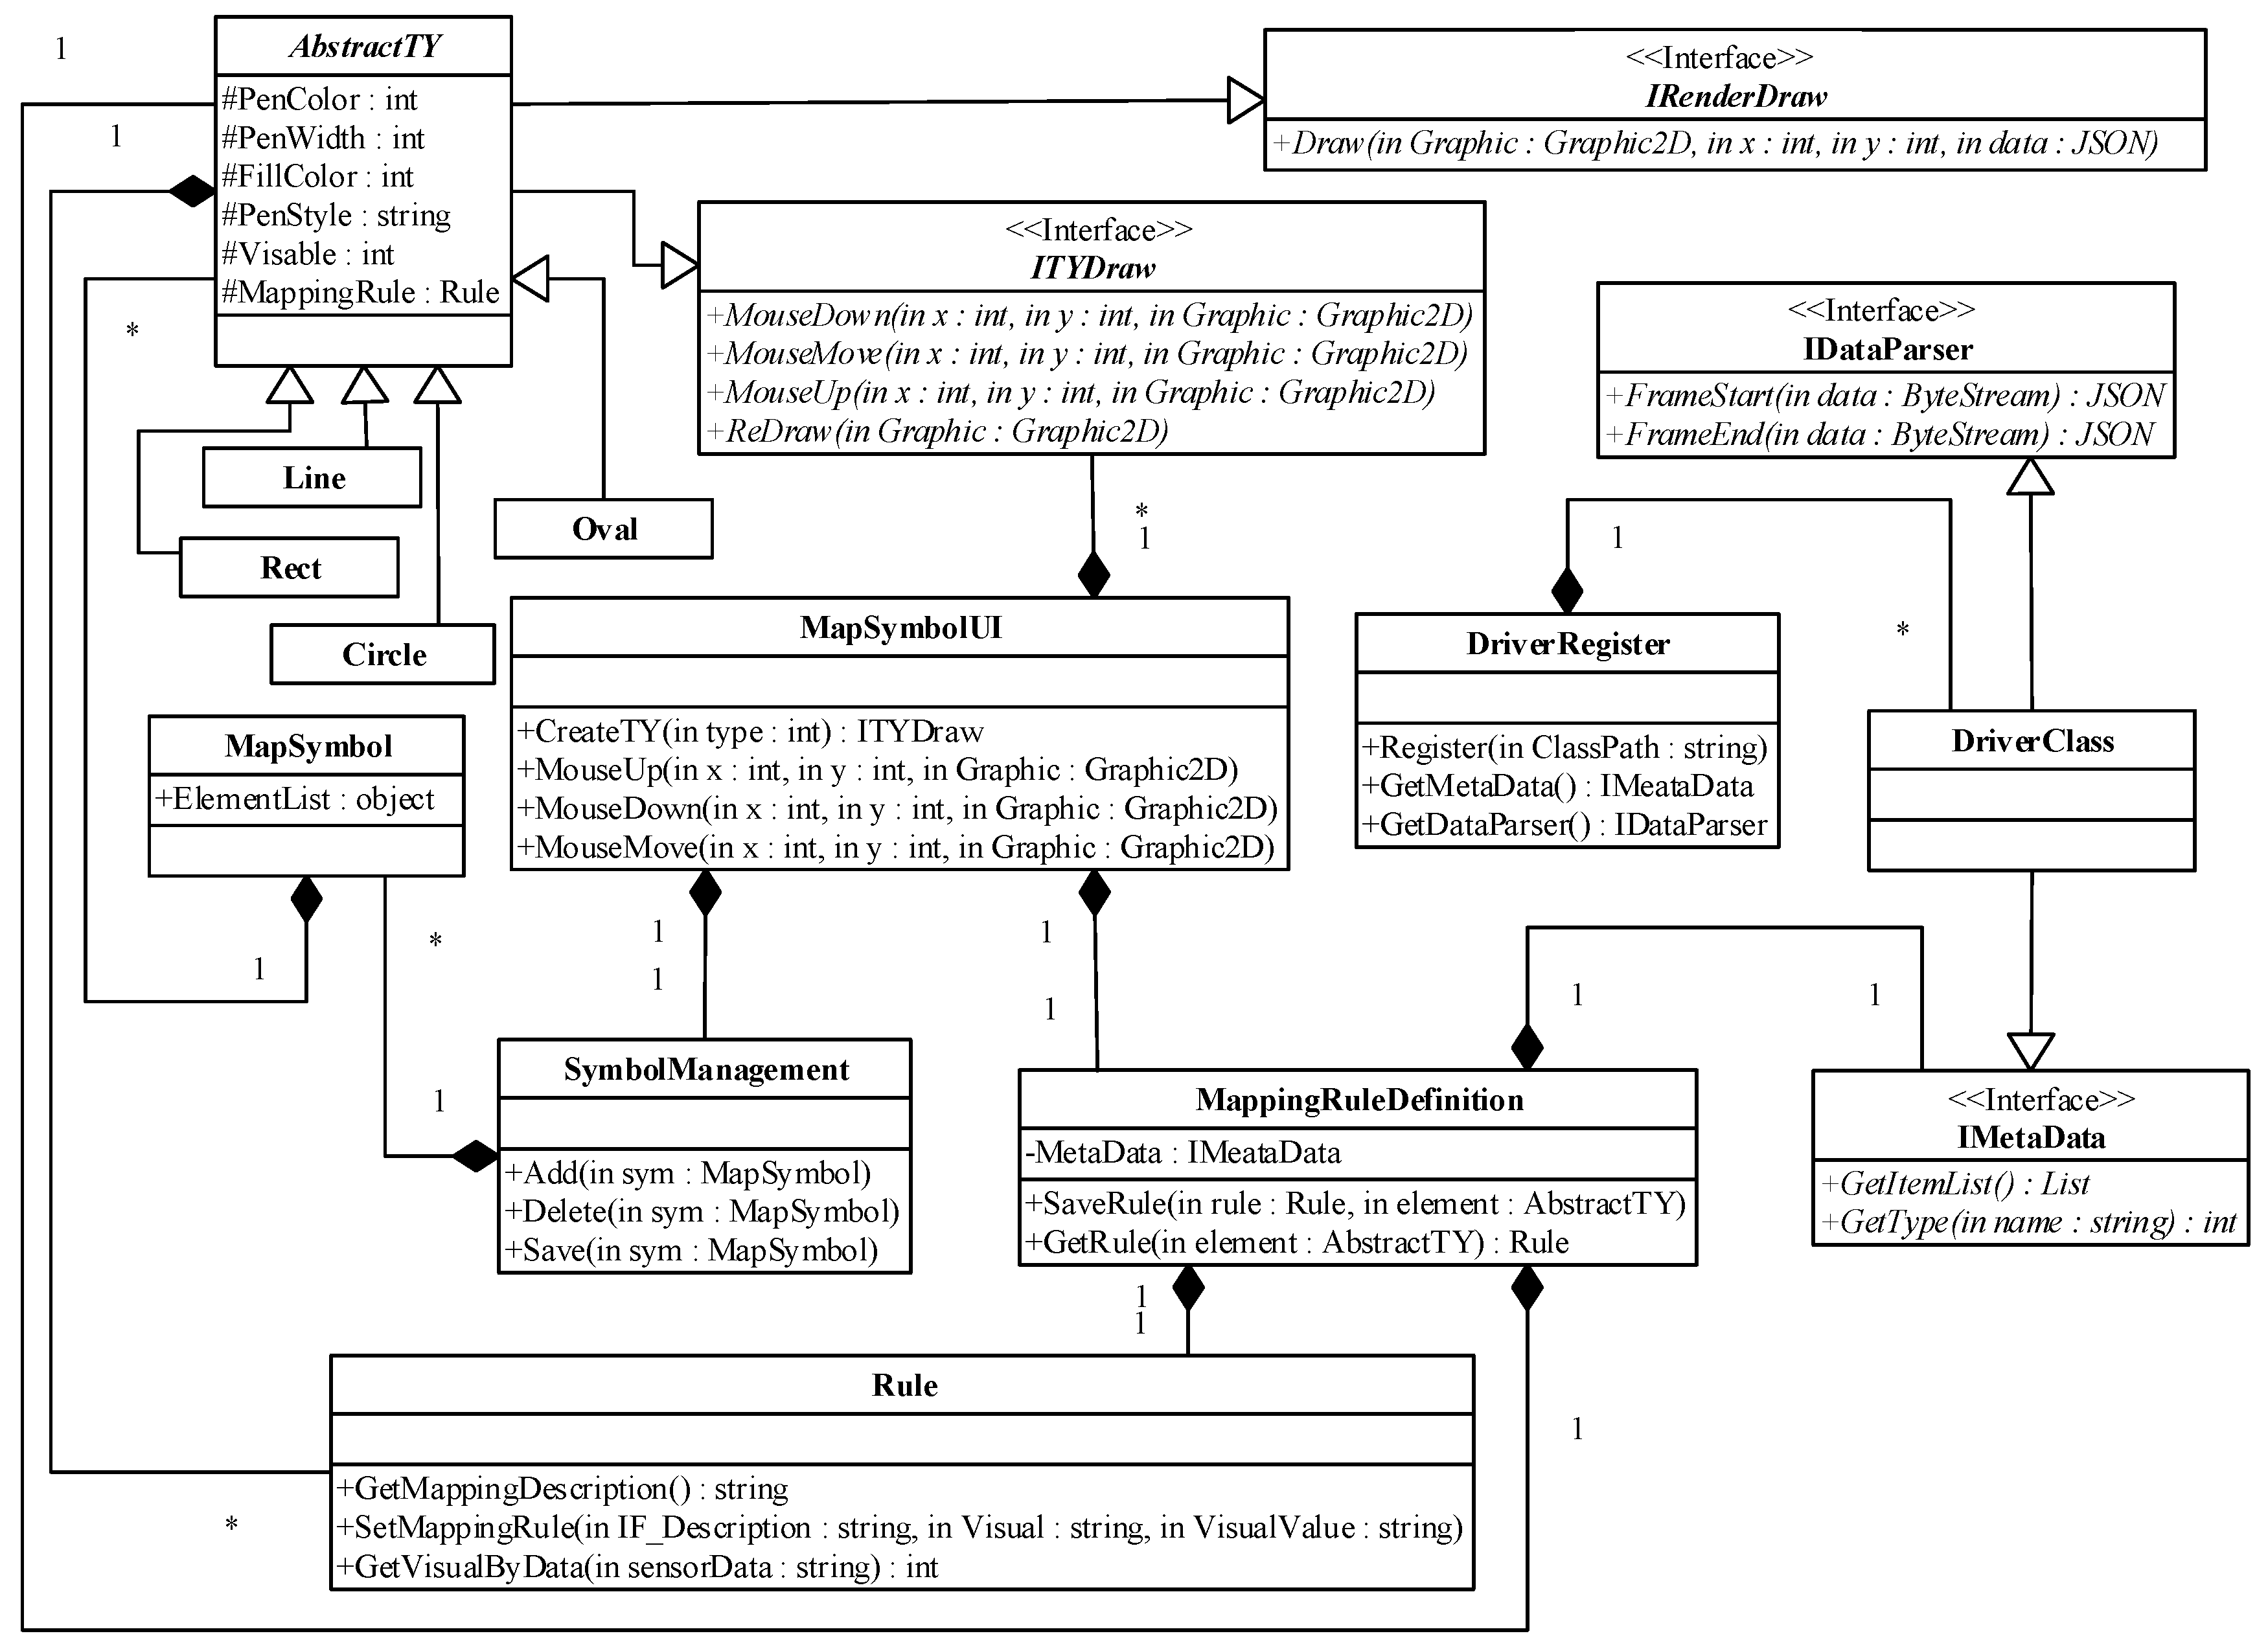
The graphic element is the basic component of a map symbol. From the viewpoint of object-oriented modeling (programming), each type of graphic element includes visual variables as properties and functions for graphic designing and rendering. The functions of the graphic element can be generalized into two types: graphic design and map symbol render in map visualization. Two interfaces (ITYDraw and IRenderDraw) are defined for the two types of functions. ITYDraw contains the methods needed for the graphic design, such as mouse up, mouse move, mouse down, and redraw. IRenderDraw is mainly used for map rendering, which includes the render method invoked when the map is refreshed. The abstract class of the graph element (AbstractTY), which implements the two interfaces (ITYDraw and IRenderDraw), is defined in the model. All properties of each type of graphic element in a map symbol are inherited from the abstract class.
MapSymbolUI binds the ITYDraw interface and the mouse operation in the drawing area, which integrates the symbol model and user interface (UI). Users can choose different types of graphic elements and use the mouse event to draw the symbol element in the drawing area, and then build the new map symbol which is stored in MapSymbol.
IMetaData binds the
MapSymbolUI by the
MappingRuleDefinition class. In the process of building the map symbol,
IMetaData, in the driver class, shows the sensor metadata information to the map symbol constructor. The constructor defines the mapping of the geo-sensor data item and visual variables of the graphic element,
MappingRuleDefinition creates and initializes a
Rule instance with the mapping profile, then saves the
Rule instance to the current graphic element. Any class implements (
IDataParser and
IMetaData) can be registered to the map symbol system by
DriverRegister, then this class instance is called in mapping definition. In the process of map rendering, the graphic rendering function (
IRenderDraw) maps the geo-sensor data into visual variables by the
Rule class. An outline of the model is shown in
Figure 4.
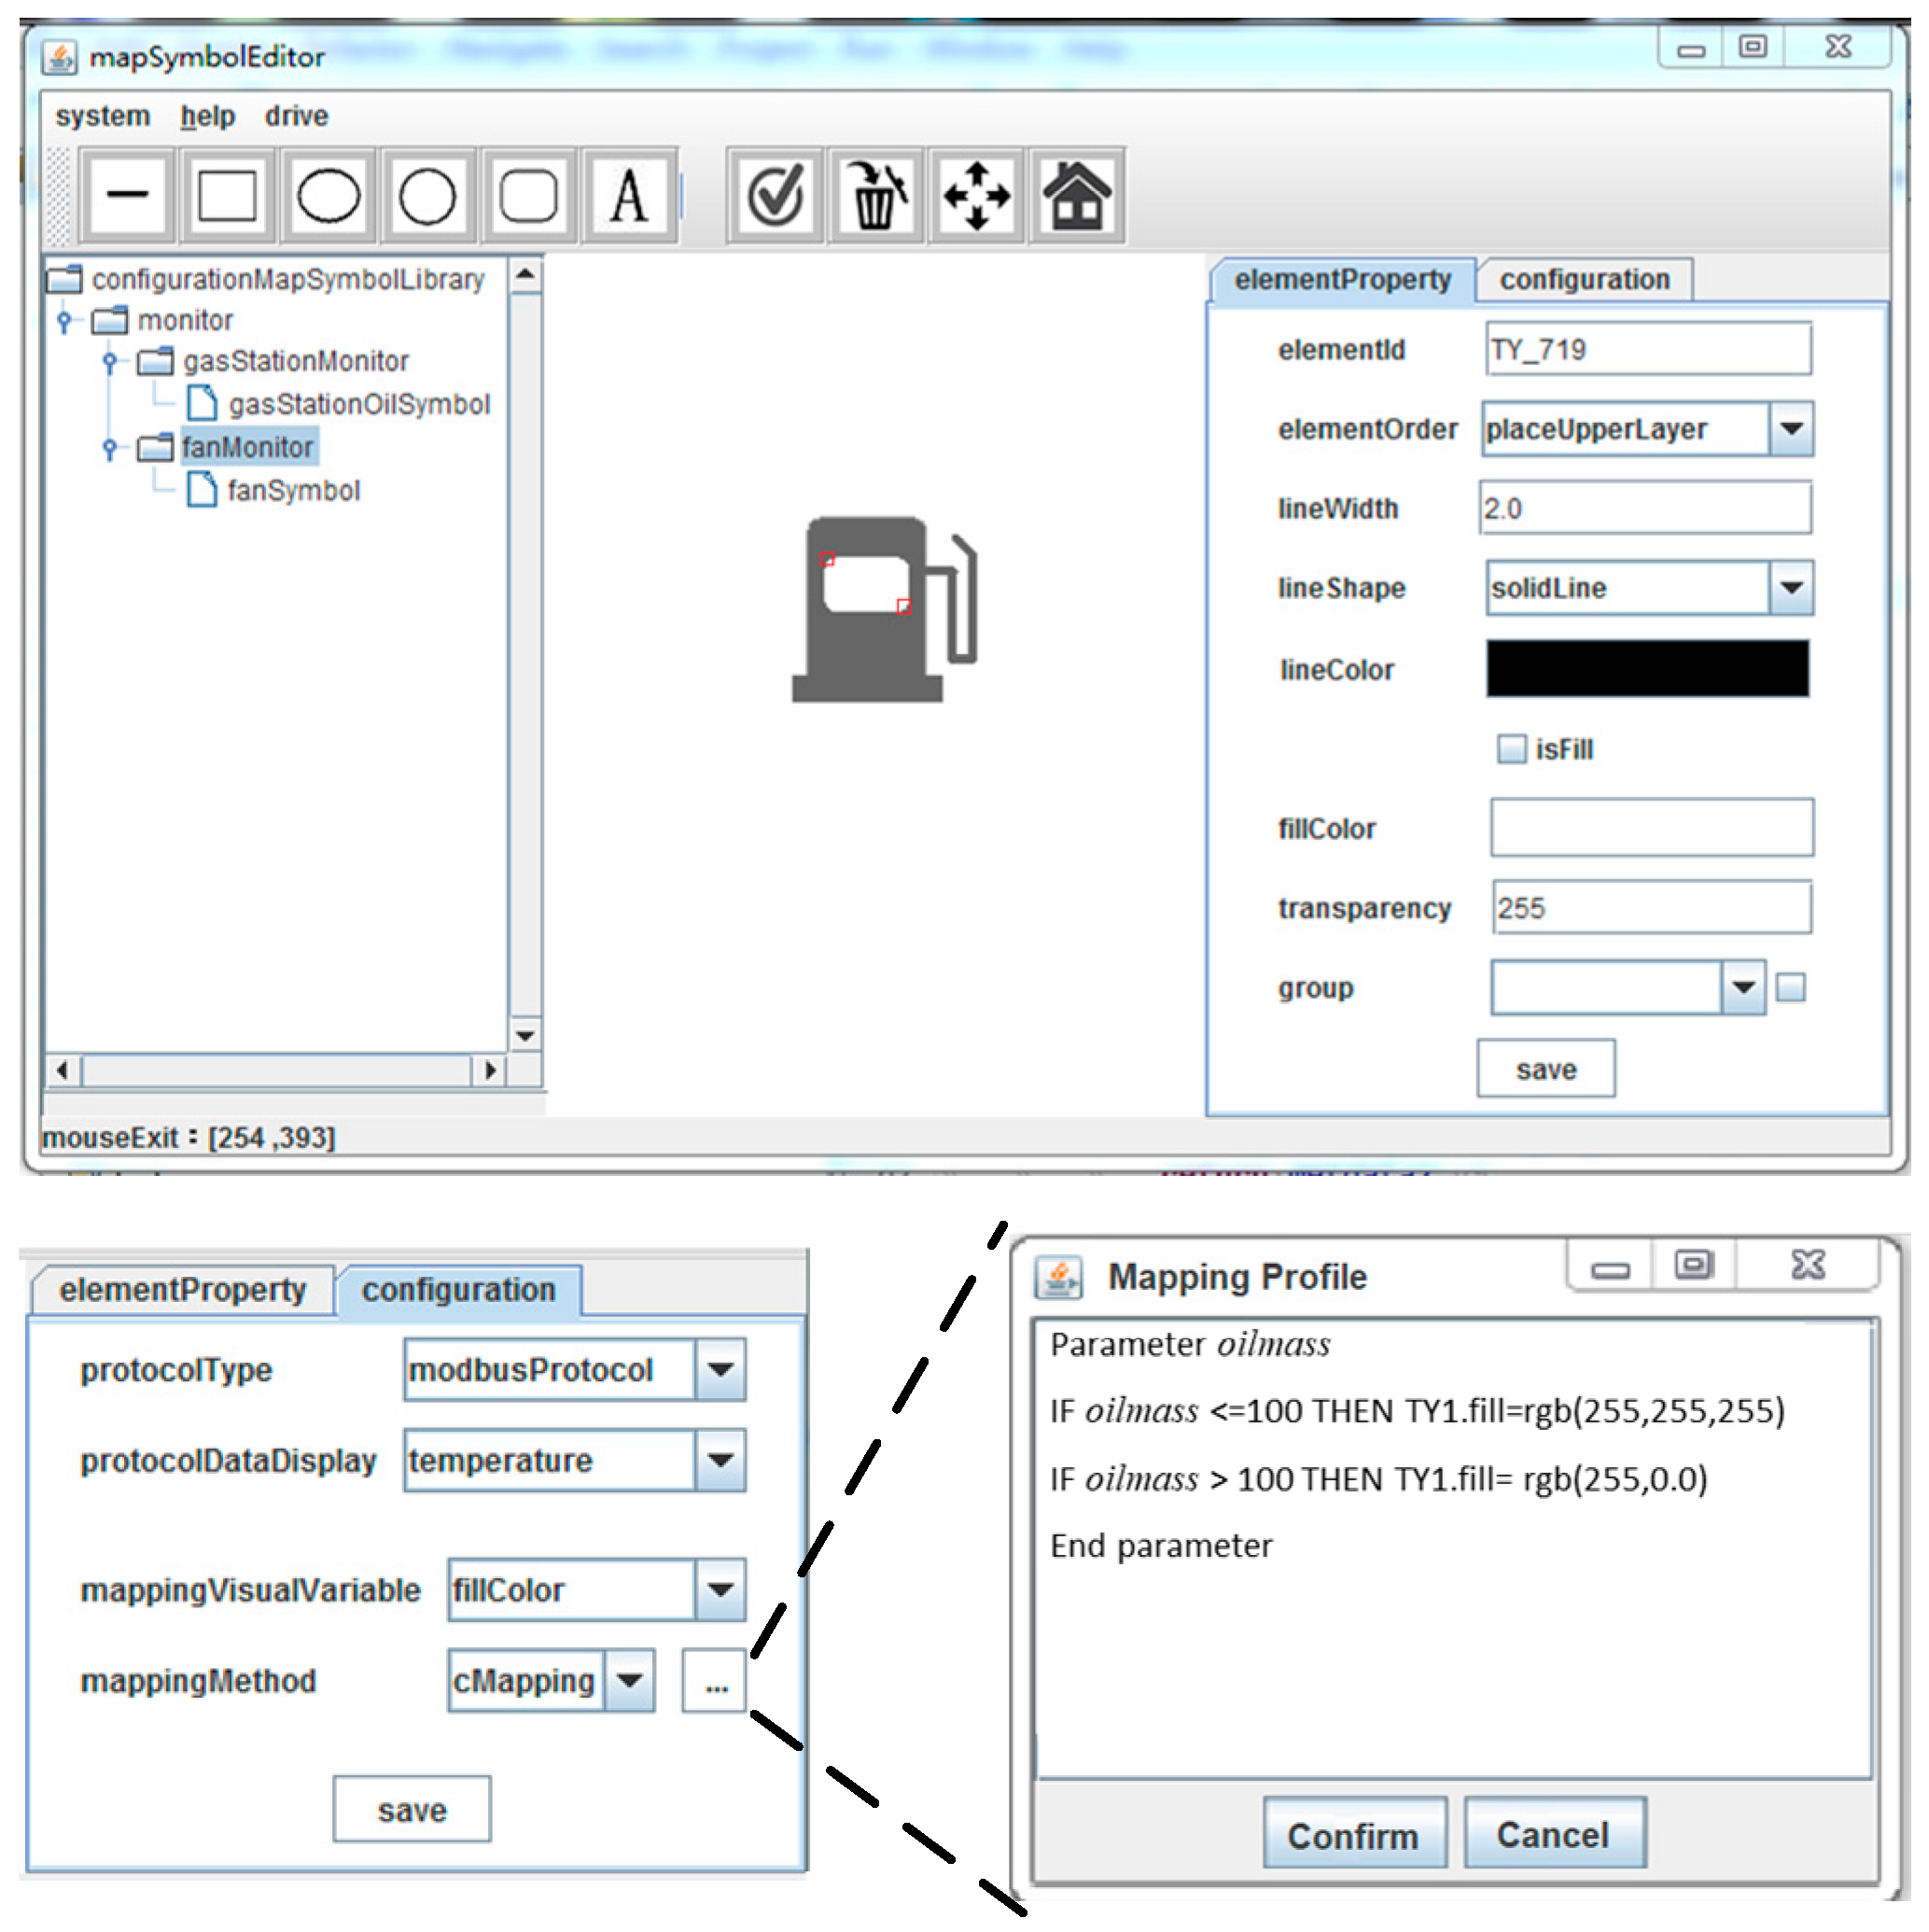
According to the architecture, protocol-coupling map symbol construction software in JAVA was developed (
Figure 5). In the software, the user builds the map symbol via mouse interaction. The user selects different types of graphic by clicking the corresponding shortcut button and creates graphic instance by mouse interaction in the drawing area. In the drawing area, the symbol constructor can create multiple graphics and build a new map symbol. The user can also select graphic elements by mouse action, and the selected graphic is identified by two small red squares. The visual variables of the selected graphic can be changed by interactions with the right property panel, and the mapping profile between the selected element and geo-sensor data item is defined on the configuration panel. Any class that implements the
IMetaData interface and is registered to the system can be displayed in the drop-down box and used in the mapping profile definition. On the configuration panel, the user selects the communication protocol and geo-sensor data item that needs to be visualized, and then edit the script in the new window to build the mapping between the selected geo-sensor data item and the visual variable of the current selected graphic.
6. Geo-Sensor Message Broker Based on Spatial-Communication Protocol in GIS Server
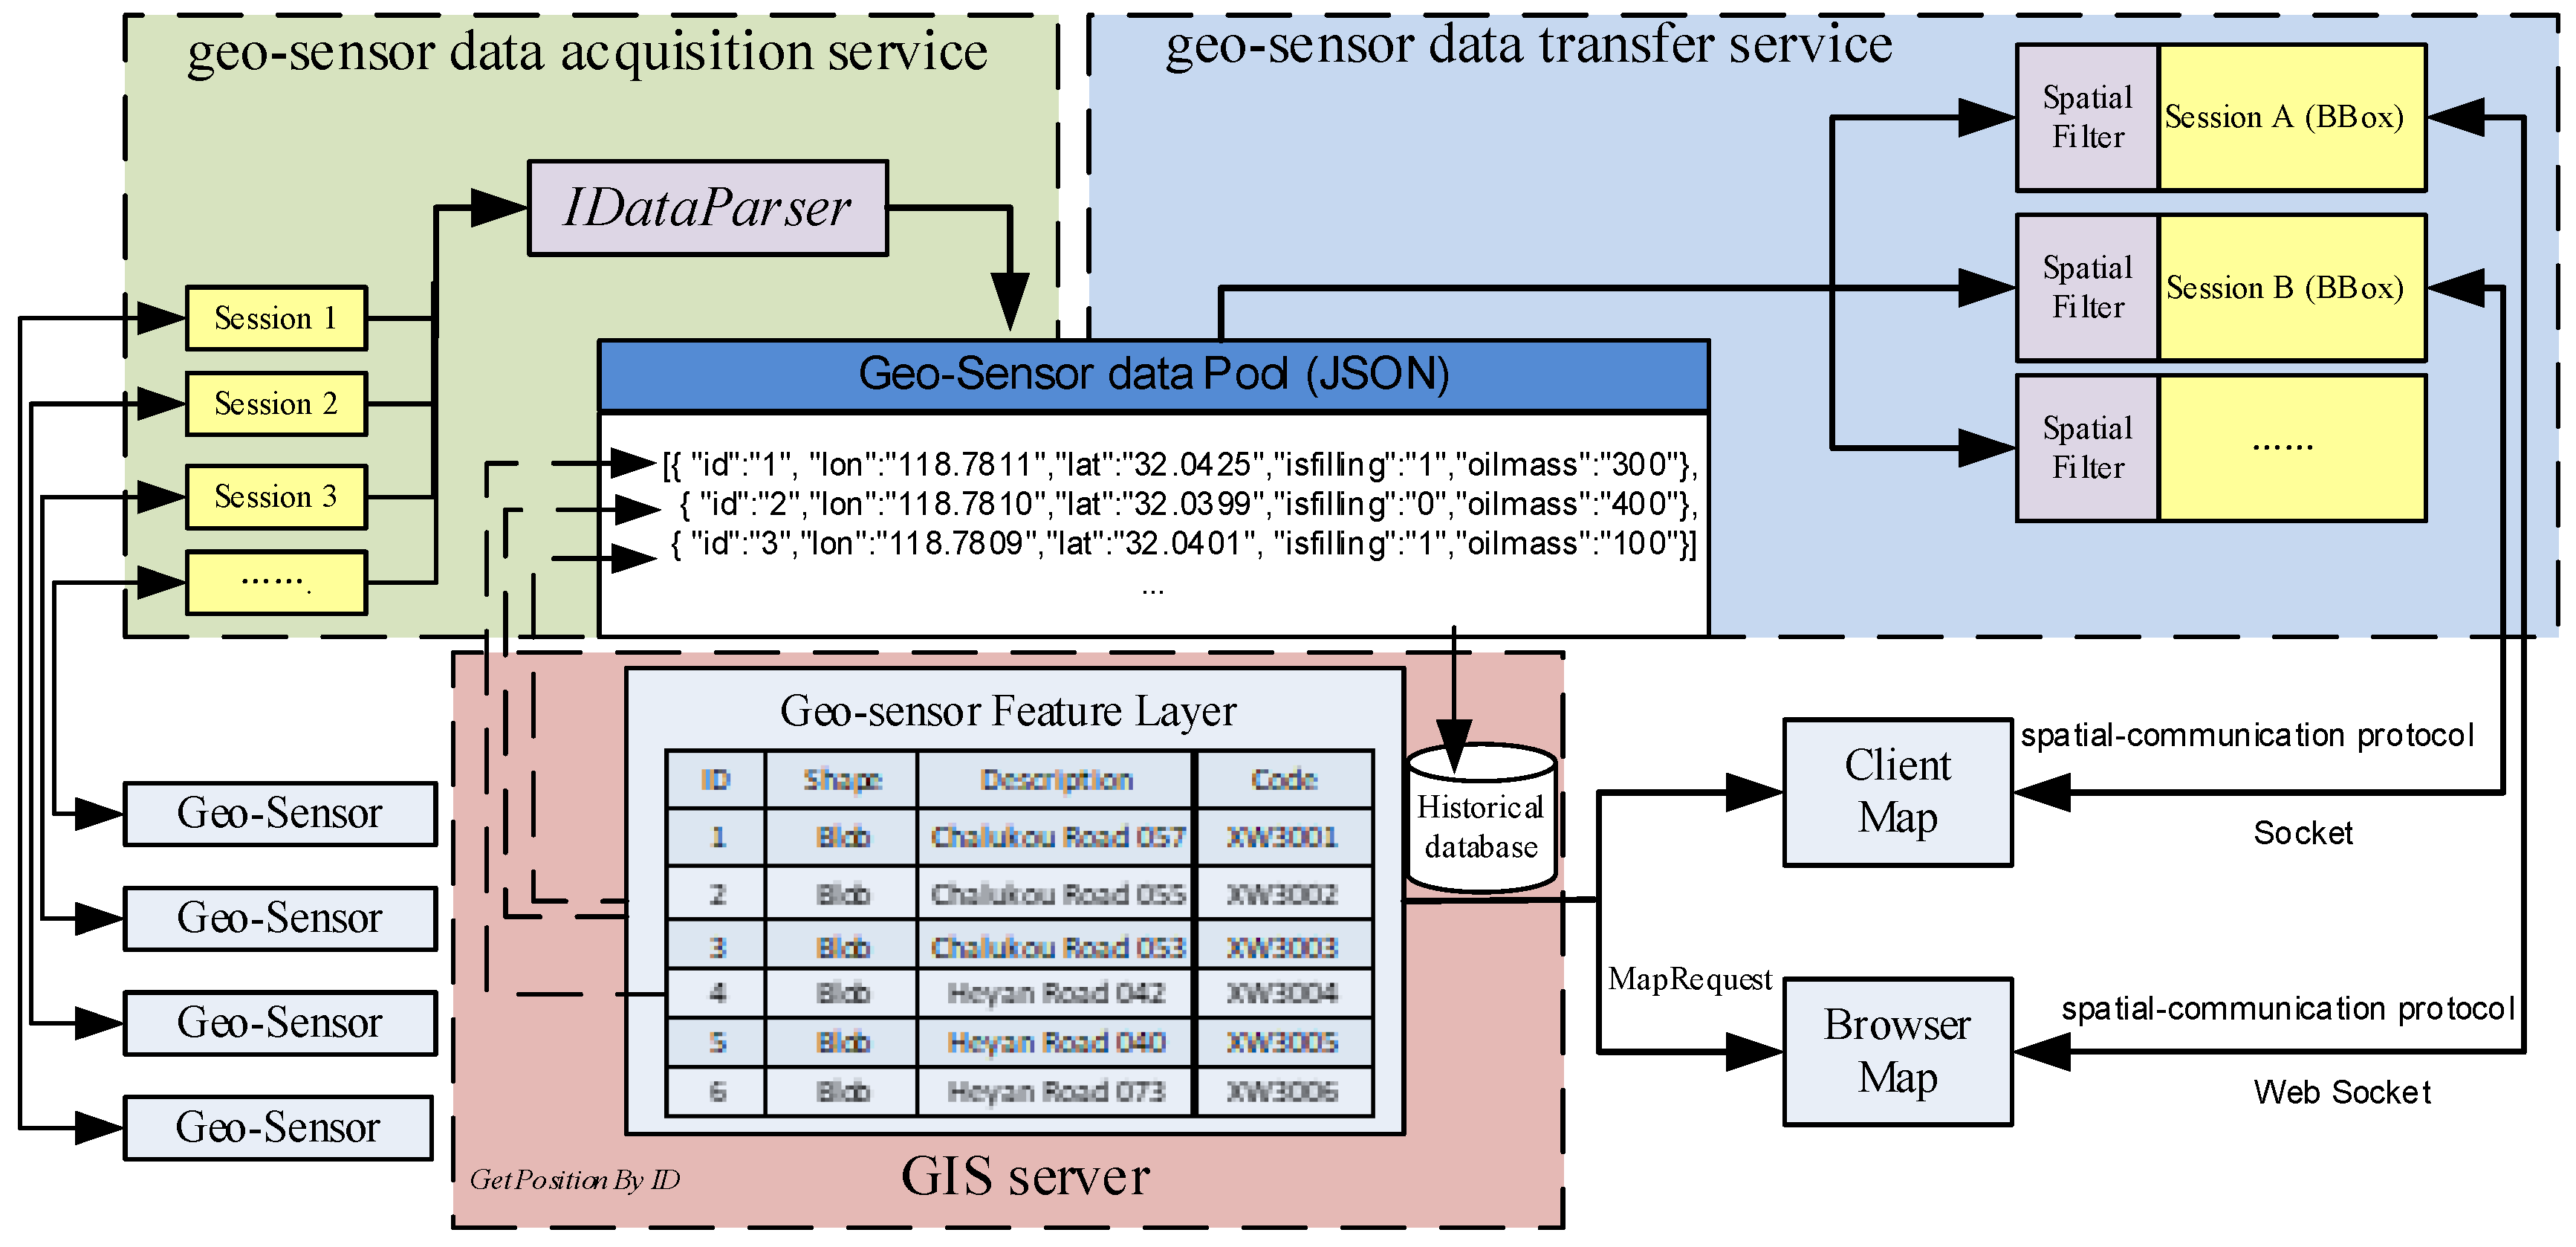
To ensure that sensor data can be transferred from the device to the map client in real time, it was necessary to establish a geo-sensor message broker for real-time sensor data communication on the server side, where the broker can act as a bridge between the map client and remote geo-sensors. The geo-sensor message broker acquires geo-sensor data in real time and forwards it to the map client to meet the real-time visualization requirements. The geo-sensor message broker includes two services: the geo-sensor data acquisition service and the transfer service.
The geo-sensor data acquisition service connects with the sensor through a long-polling connection. When the acquisition service receives data frame from the sensor, the service calls the parsing interface (
IDataParser) in the driver class to transform the received geo-sensor data frame into JSON format data. The geo-sensor data are stored in databases, and the JSON data are forwarded to the geo-sensor data pool. Each geo-sensor data frame contains an ID that corresponds to the geo-sensor feature ID in the spatial database (
Figure 6).
The second service is the geo-sensor data transfer service that establishes a long connection with the map client through Socket or Web Socket. Since the map instance view is different on clients, the geo-sensors displayed on the map instance are different. Therefore, the real-time sensor data that need to be pushed to the clients are different. The spatial filter in the data transfer service was built so that each client map has its own spatial filter in the connection session. When the client map is operated (pan, zoom in or out), boundbox information of the client map is transmitted to the spatial filter instance on the transfer service. Then, the filter executes a spatial query to obtain the ID sequence of the geo-sensors that appeared in the current map view, and only geo-sensor data whose ID in the ID sequence are pushed to this client (
Figure 6).
In computer science, handshaking is the basic Web Socket or Socket protocol concept that ensures the server is in sync with its clients. In order to ensure the synchronization between the map client and the service, the spatial-communication protocol was defined. This protocol defines a full duplex communication: the map client sends boundbox messages to the geo-sensor data transfer service, then the service updates the corresponding spatial filter and responds back. The geo-sensor data transfer service pushes the geo-sensor data to the map client, then the map client receives data and feedback.
The spatial-communication protocol was defined in the JSON format as shown in
Table 1. There are three keys in the JSON body:
MapClientID,
FunctionCode, and
Data.
When the client map view changes, the map client upload the spatial information (BBox, srs) to the server with FunctionCode 1. The geo-sensor data transfer service receives the information and updates the spatial filter instance for the current map view, then feeds back FunctionCode 1 to the map client.
Each map client has a corresponding spatial filter instance in the server. When sensor data with a sensor id and spatial information is sent to the geo-sensor data pool, the data flows into all the spatial filter instances. If the sensor data with spatial information meets the filter condition in the spatial filter instance and geo-sensor data item has changed compared to the previous, the filter instance will send a copy of the data to corresponding map client with FunctionCode 2.
When the map client gets the sensor data, the map client gives feedback to the server, and the client triggers the function to repaint the map symbols based on the mapping profile (
Section 3).
7. Application of Geo-Sensor Data Real-Time Visualization Using Protocol-Coupling Map Symbols
Normally, a GIS is built in client-server or browser-server architecture, and the map rendering methods are different in the two architectures.
7.1. Geo-Sensor Data Real-Time Visualization in Client-Server Architecture
In client-server architecture, GIS is component-based, and the different components are coupled together through an interface. The components in GIS associated with map visualization are the layer component and the symbol component, which are coupled through a rendering interface. GIS software provides some simple symbols based on the rendering interface to meet the requirements of general map visualization. In addition, a user can achieve customized visualization by implementing the rendering interface.
As layer components do not support real-time sensor data acquisition, a real-time sensor data acquisition module was added to the geo-sensor layer. After the layer component was initialized, the data acquisition module was connected to the service in the geo-sensor message broker through the socket, and real-time JSON-format sensor data in the current map view was visualized (
Figure 6). Then the data were forwarded to the symbol render interface (
IRenderDraw) via the sensor layer component. According to the mapping profile, the symbol-rendering interface changes the visual variables, then realizes real-time sensor data visualization based on the map symbol.
In this paper,
GeoTools was used for verification.
GeoTools is an open source GIS software package that provides the components for GIS development in client-server architecture [
29].
DirectLayer is a basic layer component. Any class that inherits
DirectLayer can be embedded into the
GeoTools system.
The
GeoSensorLayer that inherits the methods and properties of the
DirectLayer was defined, and a sensor data acquisition module ran in an independent thread for geo-sensor data acquisition.
GeoSensorLayer overrides the draw method of the parent class. The new draw method loads the location data and sensor ID from the spatial database or geo-sensor data acquisition module and converts the location data into screen coordinates using
MapViewport in
GeoTools. Screen coordinates of the sensor, the graphic handle in
DirectLayer, and the sensor data are packaged together for symbol rendering. The change in sensor data triggers the refresh of the
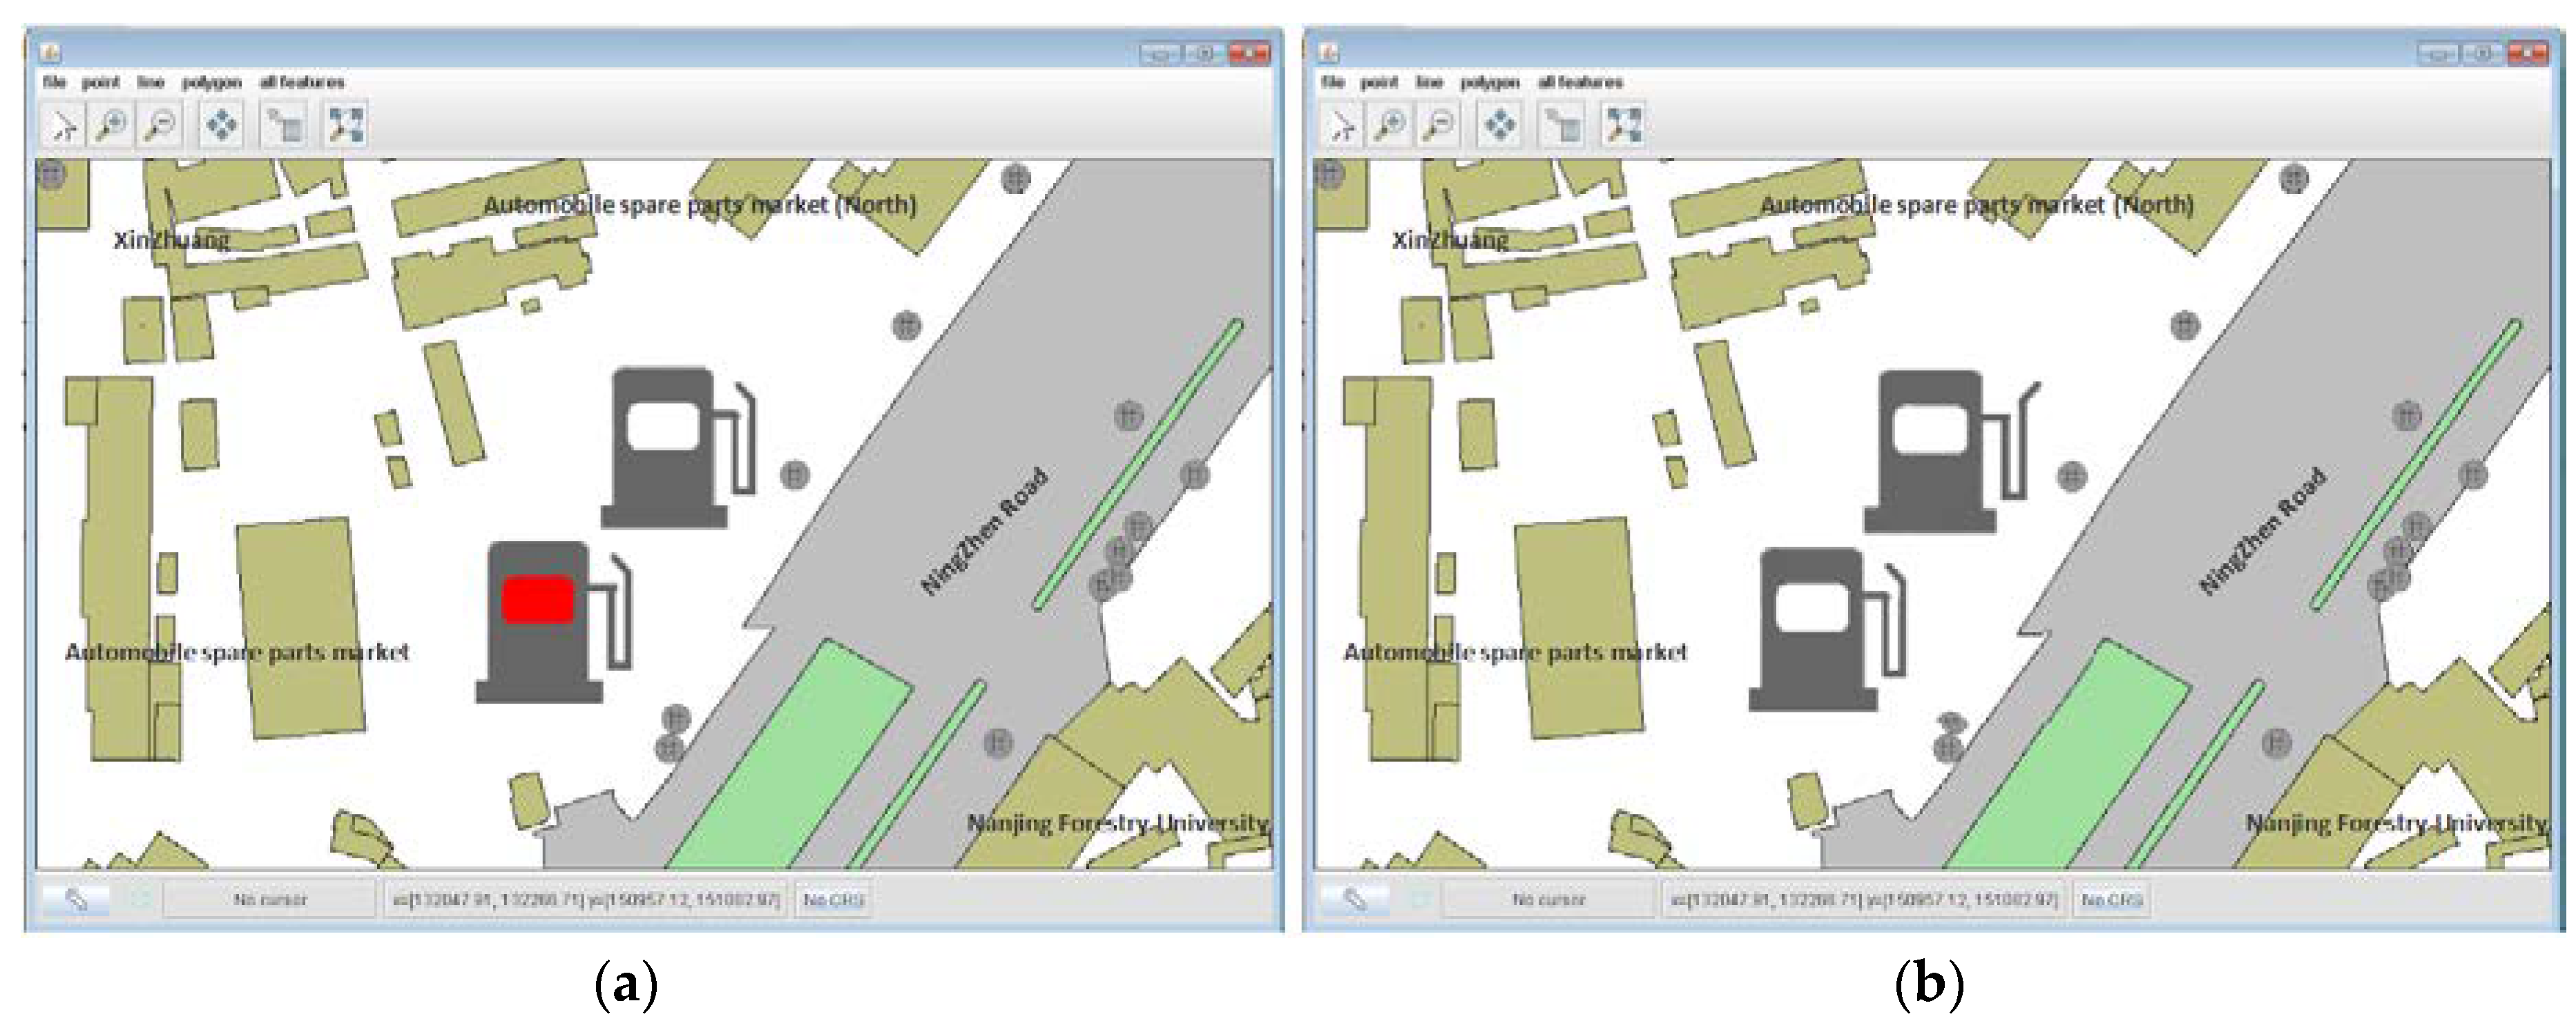
GeoSensorLayer, and realizes real-time sensor data visualization based on the map symbol. Using a gas station as an example, the sensor data collected from the gas station were transmitted to the system through a private protocol, and the designer of the protocol and hardware programmed a driver class that implemented the protocol parsing interface. After the driver class was registered to the system, the user built the gas station map symbol and mapping profile, then the symbol was rendered on the map. When the oil of the gas station was below the threshold, the color of the rectangular box of the map symbol changed to red (
Figure 7a) according to the mapping profile (
Figure 2, lines 22 to 25). When the gasoline pump was filling, the shape of the graphic element changes (
Figure 7b) according to the mapping profile (
Figure 2, lines 26 to 29).
7.2. Geo-Sensor Data Real-Time Visualization in Browser-Server Architecture
The Web Map Service (WMS) is a widely-implemented service standard provided by the Open Geospatial Consortium (OGC) [
30], and is often used in building browser-server GIS architecture. Three main operations can be performed by standard WMS clients:
GetCapabilities requests an XML document containing metadata on the available layers and other service capabilities;
GetMap requests a map image based on the user’s choice of layer, style, geographic extent, and resolution; and
GetFeatureInfo requests more information on a specific geographic location. The
GetMap requests usually serve the map in a bitmap format, e.g., PNG, GIF, or JPEG. In addition, vector graphics, such as points, lines, curves, and text, can be included when expressed in the SVG format.
Bitmap images, for example, do not change well. Therefore, bitmap format maps are not suitable for real-time sensor data visualization. SVG is an XML-based vector image format for two-dimensional (2D) graphics and is used to describe rectangles, circles, lines, polylines, polygons, composite graphics, etc. So, it is a common format used to describe vector map symbols [
31] and maps.
Like HTML, SVG is represented using the Document Object Model (DOM) and can be relatively easily manipulated with JavaScript. A user can obtain the SVG element by using the JavaScript’s getElementById method and setting the selected element’s attributes with the setAttributeNS method.
SVG was used as the output format of WMS for real-time visualization. A significant advantage of using SVG is not only its ability to render vector graphics, but also its ability to use JavaScript to change SVG DOM, thus allowing user behavior to dynamically alter displayable SVG graphics that are suitable for real-time visualization based on a mapping profile.
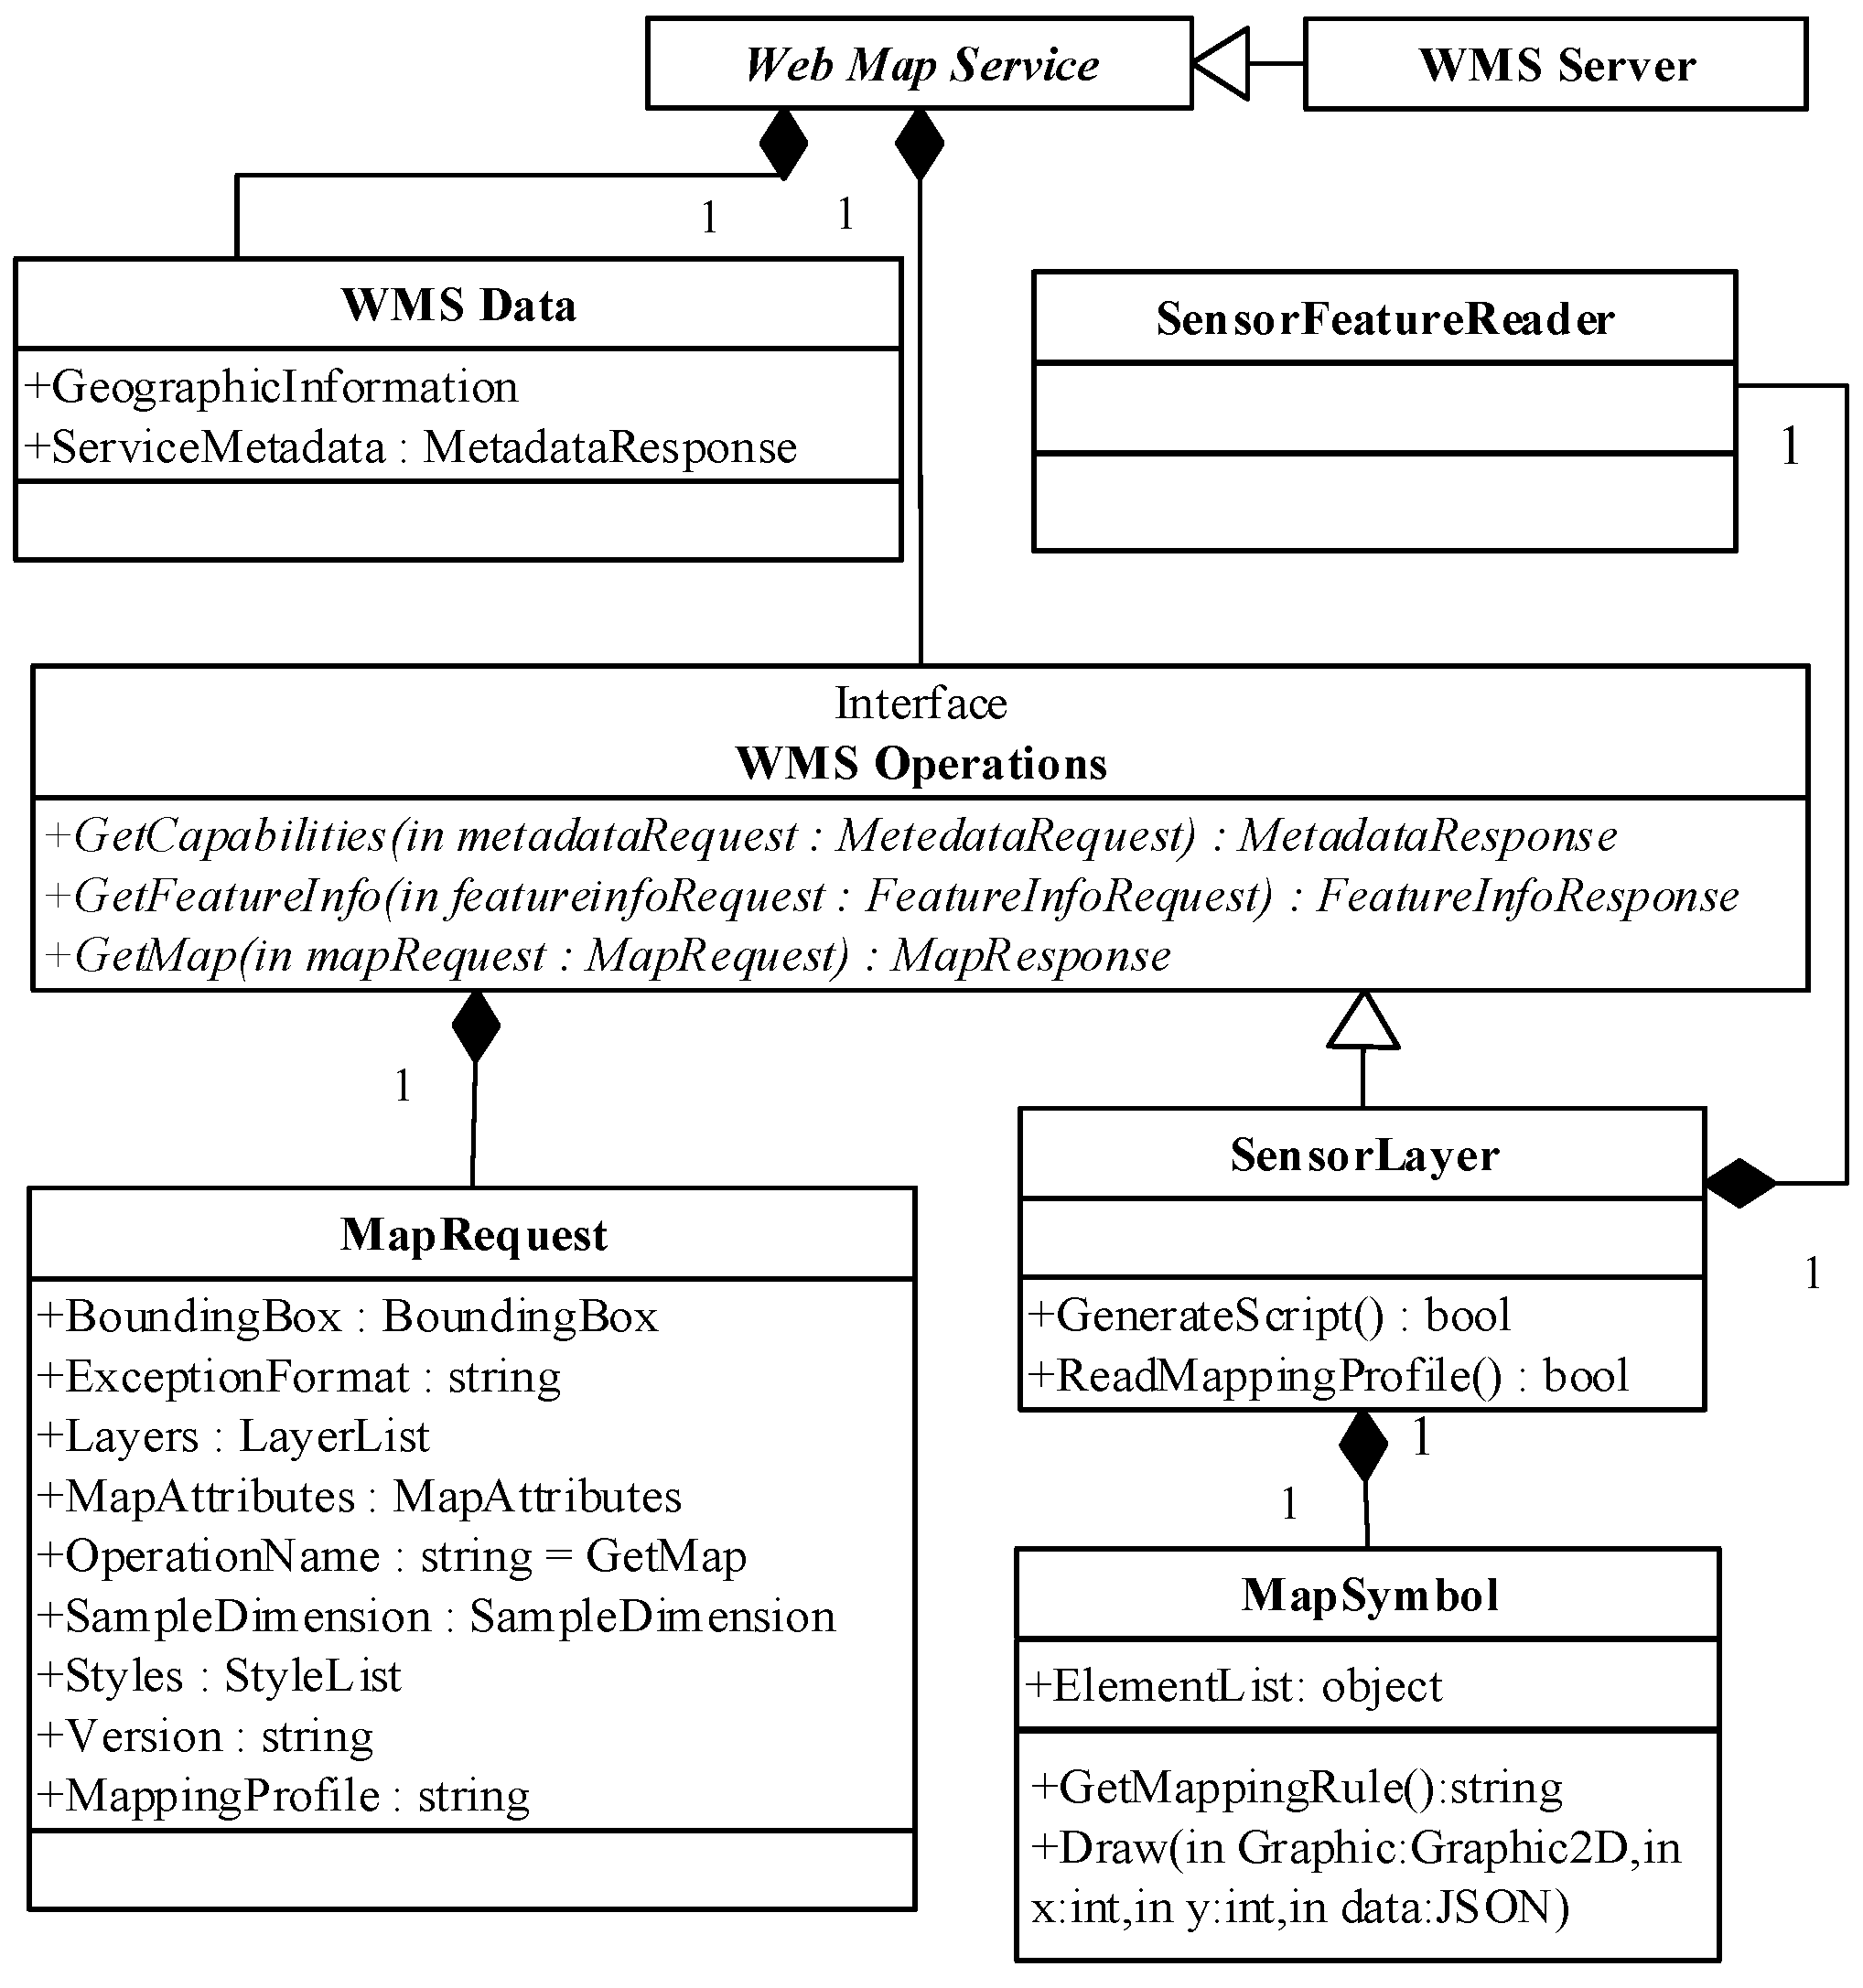
On the map server, a
SensorLayer class was defined, which encapsulated the basic functionality of the WMS operations and meets the OGC WMS standard. The detailed UML diagram of the class
SensorLayer is shown in
Figure 8. The
GetMap method was implemented in the
SensorLayer class.
When the client initiates a map request to the server,
GetMap method in
SensorLayer on server response to this request. First, according to the value of the BBox parameter in a
GetMap request, sensor features within the BBox are loaded from the sensor spatial data files or geo-sensor data acquisition module, and each feature includes geo-location and sensor ID. According to the value of Width and Height parameters which specified the size in integer pixels of the map to be produced, the geo-coordinates of sensor features are converted to pixel coordinates. Second, map symbol data is cloned into the SVG <g> element which groups SVG shapes (such as rect, ellipse, line, etc.) that correspond to the graphic elements in the protocol-coupling symbol, then the coordinates of the shapes in the SVG <g> element are translated with reference to the pixel coordinates. Each SVG <g> element represents a geo-sensor device. In order to distinguish the graphic elements of each sensor on the SVG map so that the system could change the visual effect of the SVG according to the mapping profile, each SVG shape in <g> element was identified by its global unique ID, which is a combination of sensor ID and graphic element ID in the symbol. Finally, the
GenerateScript method in the
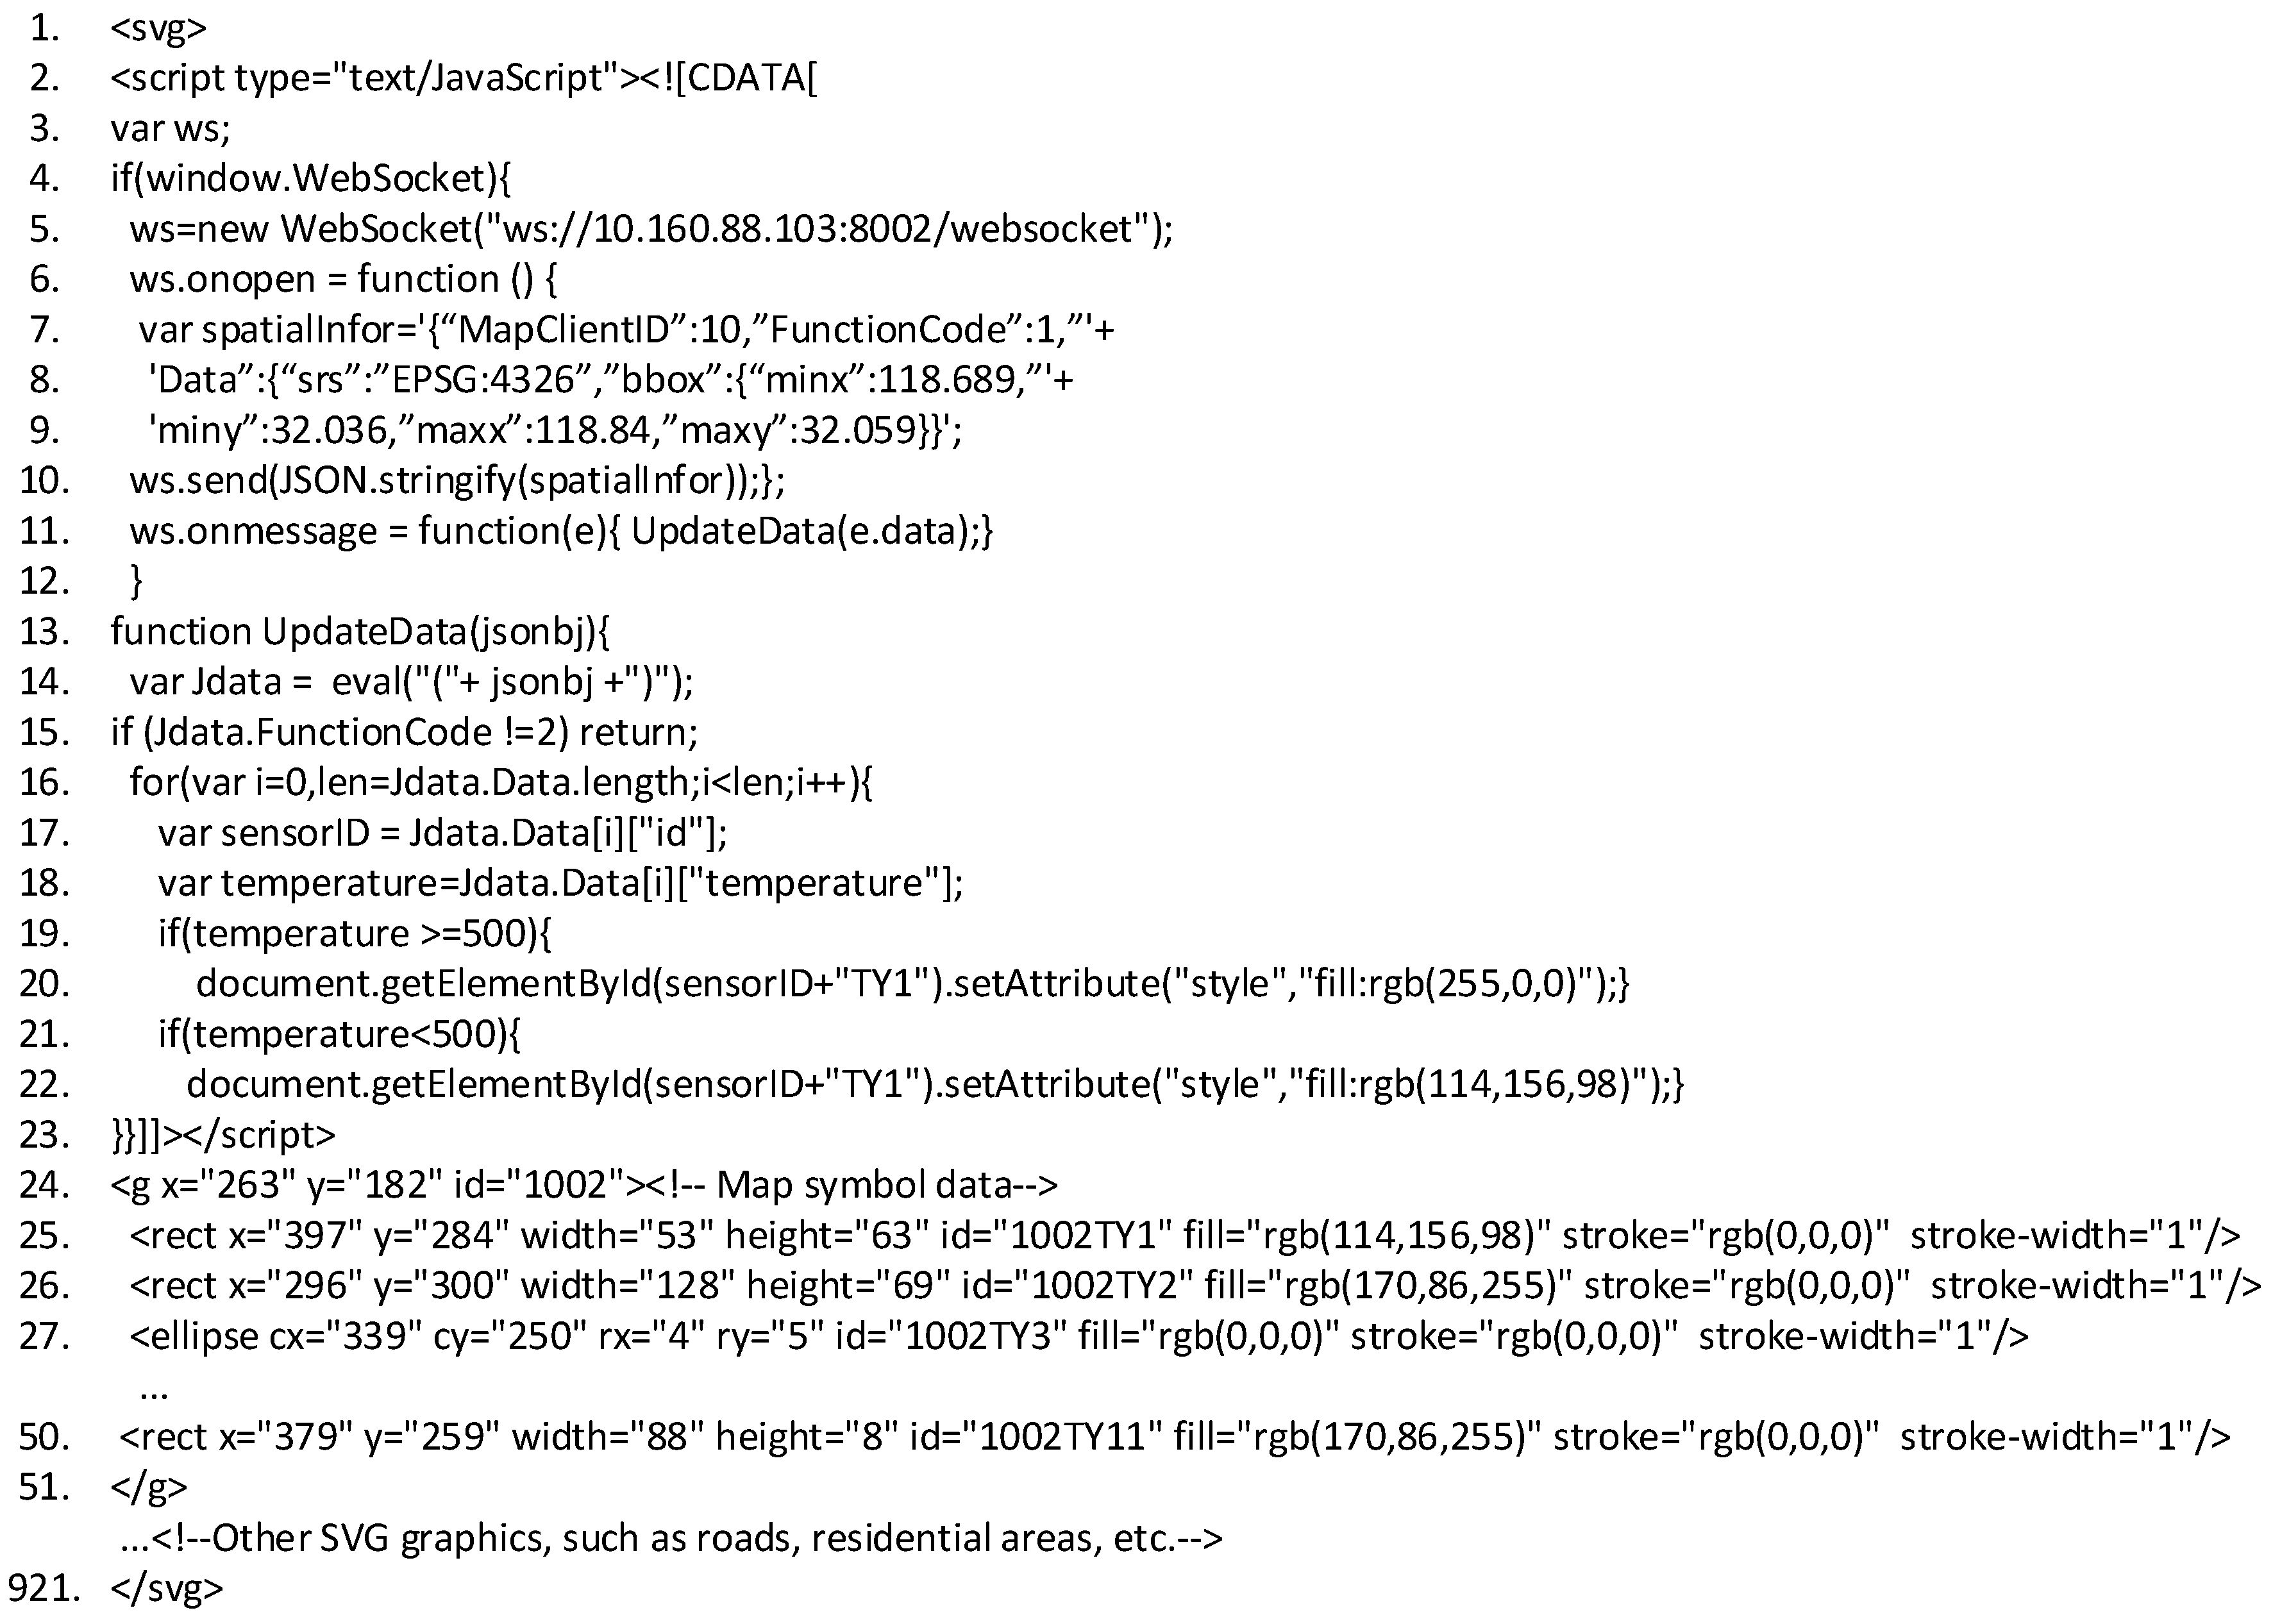
SensorLayer class converts the mapping profile into JavaScript code block through which the map client obtains sensor data from the geo-sensor message broker, and changes the SVG graphic according to the mapping rules. JavaScript code block and SVG <g> elements constitutes an instance of the SVG map which is responded to client (
Figure 9).
Different with the way of map symbol rendering in Client-Server architecture, the map server converts spatial data and map symbol data into one SVG document according to the map request parameters via
SensorLayer, and the mapping profile in the symbol is converted into JavaScript block that exists in the script area of the SVG document. After the map browser obtains the SVG format instance by
GetMap operation from map server, the WebSocket connection between the geo-sensor message broker and the map instance is triggered by JavaScript (lines 5 to 12,
Figure 9). Through the WebSocket pipeline, the BBox information of map instance is sent to geo-sensor message broker (lines 7 to 10,
Figure 9), and the real time sensor data in current map view were pushed to map instance by message broker. The changes in the sensor data were mapped to dynamically alterations of the displayable SVG graphics in map instance by JavaScript (line 13 to 23,
Figure 9)
GeoServer is an open source Java-based server built on the
GeoTools and adheres to the OGC-WMS for standard [
32].
GeoServer, through an open-source plugin system, integrates of different implementations of the WMS interface. The flexible nature of
GeoServer allows the user to easily plug in a new web map service or upgrade an existing service to address new business requirements. In this paper,
GeoServer was used to implement custom WMS, which integrates
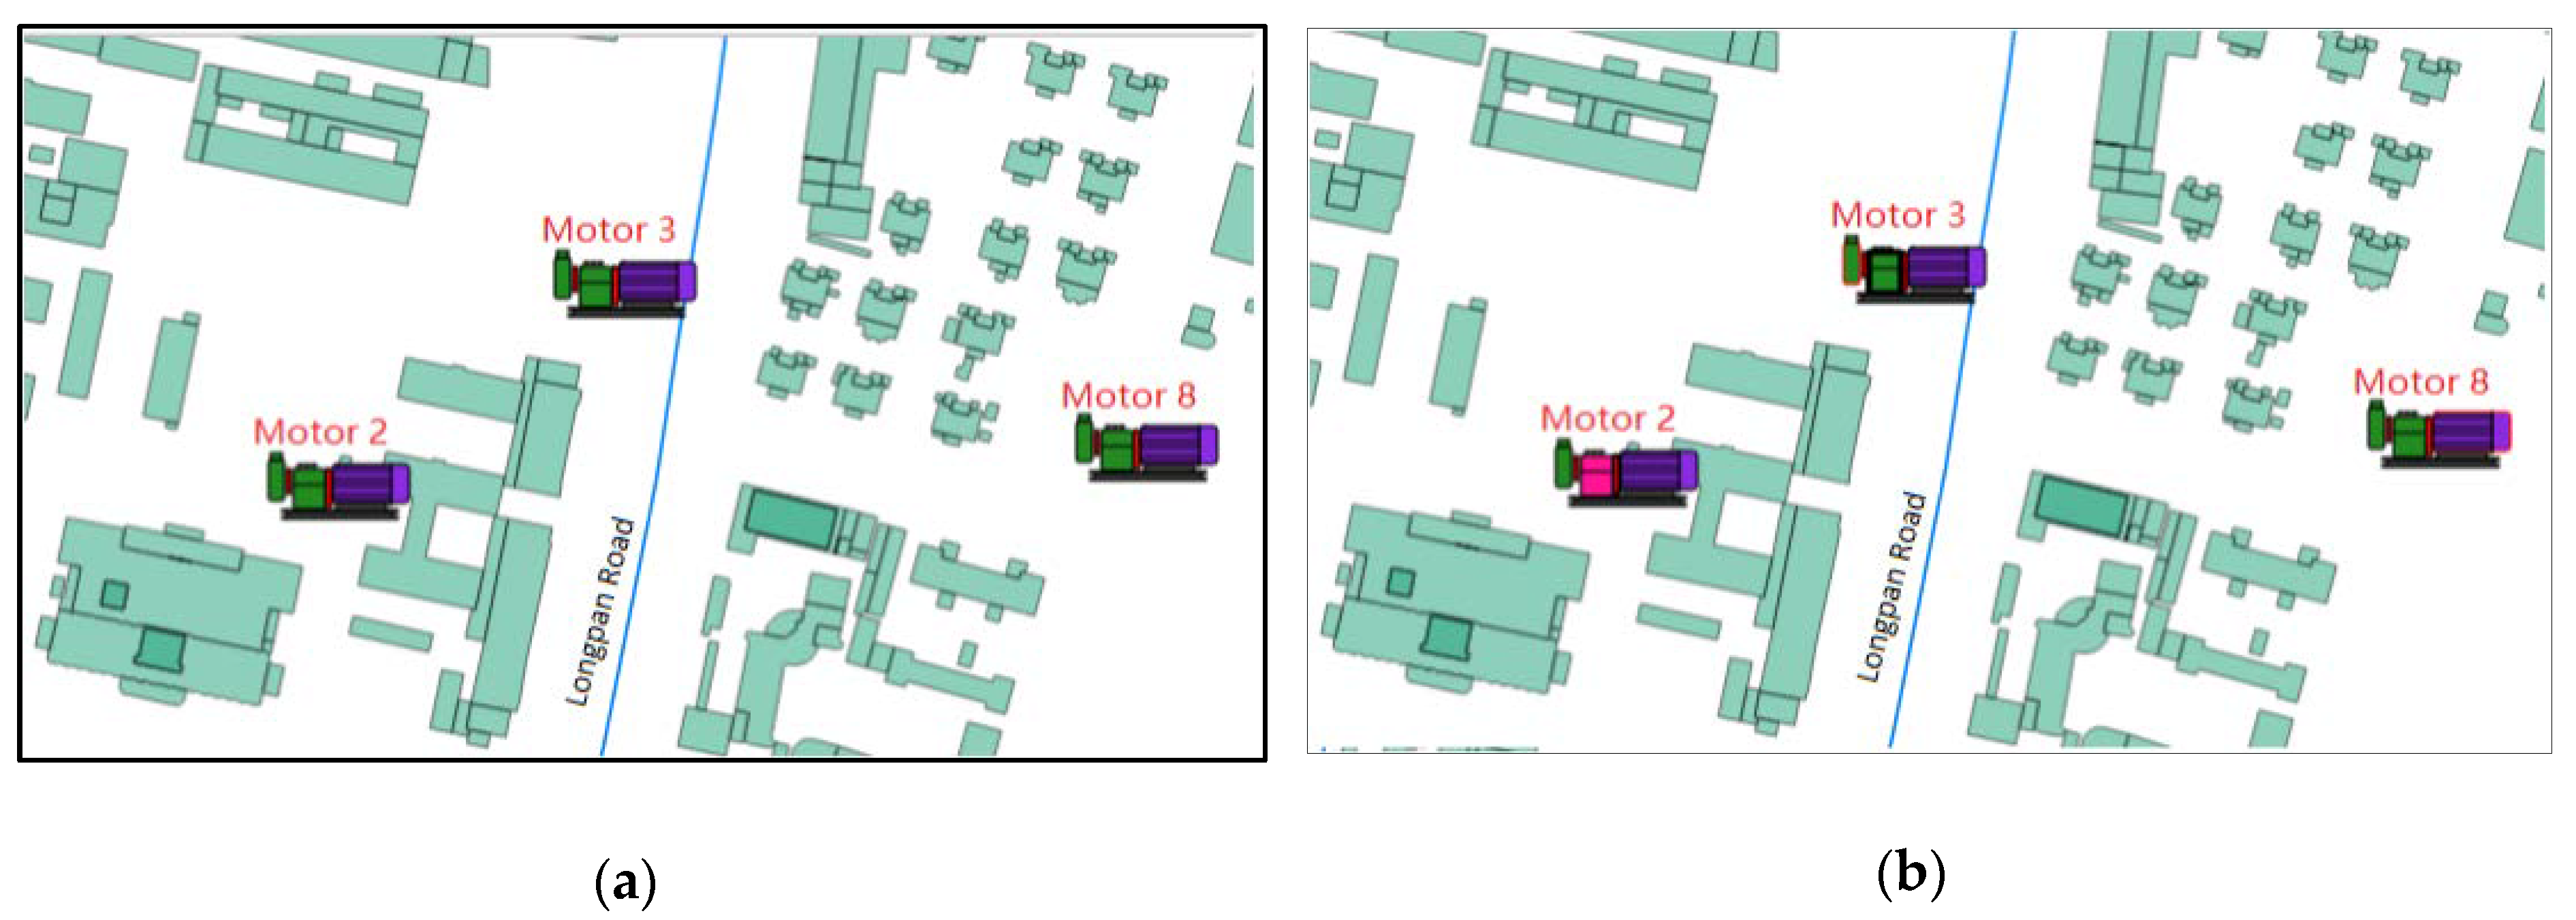
SensorLayer. Taking motors as an example, the sensor data collected from the motor was transmitted to the system through the MODBUS [
33] protocol. The MODBUS driver class, which implements the protocol parsing interface, was registered to the system before the user built the motor map symbol and mapping profile.
SensorLayer in custom WMS read the symbol data and generated a SVG document.
Figure 10 shows the map instance generated by custom WMS in
GeoServer; the changes in color reflect the changes in the temperatures of the motors.
8. Conclusions
This paper described the construction and implementation of map symbols for real-time sensor data visualization on a map for geo-sensor device monitoring. We used different communication protocols and monitoring devices to verify the method, and all of the above-mentioned methods were verified in browser-server and client-server architecture of the GIS. In this paper, three aspects of the map symbol that were needed to implement real-time visualization of sensor data were defined:
(1) We defined how the geo-sensor data can be mapped to the visual variable of the graphic element in map symbol. The geo-sensor data item represents the internal state of the sensor. Although different states of the geo-sensor can be displayed as different map symbols based on the traditional GIS render method by defining the mapping relationship between the geo-sensor data item and symbols, when the number of states that needs to be visualized is increased, it is necessary to construct an equal number of map symbols, and establish the mapping relationship, even if all the map symbols are similar. This means that the user needs to complete large amounts of repetitive work, which becomes increasingly arduous when the map symbol structure is complicated. Especially when visualizing multiple states of a geo-sensor device through one symbol, the traditional symbol cannot meet the user and meeting requirements. By establishing the mapping relationship between the graphic element in map symbol and the geo-sensor data item, multiple states of the geo-sensor can be expressed with one map symbol, which makes it more convenient for device real-time monitoring through map symbols.
(2) We defined the protocol parsing interface through which the mapping of sensor data items and graphic elements could be defined in map symbol construction software and the geo-sensor data streams could be parsed into internally open format data. According to the characteristics of the geo-sensor data transmission protocol, the protocol metadata parsing interface and geo-sensor data parsing interface were defined. Based on the protocol parsing interface, the map symbol builders and the communication protocols designers are independent. Any protocol parsing class that implements the parsing interface can be integrated into the map symbol construction process, where both the private format protocol and the open format protocol can be integrated into the symbol building process. Therefore, this protocol parsing interface guarantees the versatility of the symbol constructing software, which means that more types of geo-sensors can be easily integrated into GIS systems.
(3) geo-sensor message broker based on spatial-communication protocol was built. The map client communicates with the geo-sensor transfer service in the message broker through the spatial-communication protocol. During the communication between the map client and the geo-sensor message broker, the map client transmits the current map information (SRS, BoundBox) to the broker through spatial-communication protocol. Given the spatial information in the protocol, the transfer service in the broker establishes the spatial filter for each map client connect session, only the geo-sensor data in the bound box are pushed to the map client, which improves efficiency when transmitting geo-sensor data from the broker to the map client.
This paper focused on the symbol construction method of the coupling communication protocol, which means that a map symbol can easily express multiple states of a geo-sensor, and then be used for real-time monitoring of remote devices. In addition, based on the protocol parsing interface, we facilitated coupling different communication protocols into the system, which enabled displaying more kinds of geo-sensors on the map. We developed the symbol construction software around the method above and verified the method. However, for some aspects of map visualization, less research was involved, such as how to design a symbol that complies with cartographic specification, how to avoid overlaps between symbols in the context of the map, and how to abstract key information from the geo-sensor data stream in the case of big data to improve map readability. Future research will focus on these aspects, which will enable maps to be more convenient and scientific when visualizing real time geo-sensor data in the field of device monitoring. How to integrate the map symbol building method with the specifications in the IoT, such as Sensor Web Enablement (SWE) services and Sensor Observation Service (SOS), is another challenging and meaningful task for future work.


