1. Introduction
Urban vitality is an important indicator for measuring the quality of urban space, the degree of functional mix, and the capacity for sustainable urban development. Classical urban theory suggests that vitality does not arise from a single function or a static spatial form, but rather emerges as a comprehensive outcome of the continuous interaction among functional mix, human activity, public space, and diverse urban life [
1,
2,
3]. Jacobs was among the first to link urban vitality with neighborhood functional mix, high-density human activity, and diversity in building age [
1]. Lynch regarded “vitality” as an important dimension of urban form performance, emphasizing the capacity of the built environment to support basic human needs and social activities [
2]. Montgomery further operationalized urban vitality into measurable indicators such as activity density, functional mix, and public space, providing an analytical basis for subsequent quantitative research [
3]. Recent reviews further indicate that urban vitality research has gradually expanded from classical theoretical interpretation to refined measurement driven by multi-source data, with increasing attention paid to the relationships among the built environment, human activities, spatial perception, and planning implementation [
4,
5].
With the widespread application of multi-source geospatial data, such as nighttime light data, location-based services, points of interest (POIs), and road networks, urban vitality research has gradually shifted from qualitative description and macro-level statistical evaluation toward spatially explicit and fine-scale quantitative measurement [
6,
7,
8,
9,
10,
11,
12,
13,
14,
15,
16,
17,
18]. Existing studies have shown that multi-source geospatial big data can comprehensively characterize urban vitality from the perspectives of the built environment, human activities, and human–environment interactions [
6], and can be further extended to multiple dimensions, including economic, social, cultural, and ecological dimensions [
7]. Among these data sources, nighttime light data are often used to characterize the intensity of economic activity because they can reflect the spatial distribution of artificial light sources on the ground [
8,
9,
10,
11]. Location-based data, such as Baidu heat map data, can effectively capture the spatiotemporal distribution of human activities in cities [
12,
13,
14,
19,
20]. POI data have also been widely applied to urban function identification and facility supply measurement [
15,
16]. In recent years, emerging data sources such as street-view imagery have also been introduced into urban vitality research [
17,
18]. Related studies have further combined machine learning methods and spatial heterogeneity models to identify perceived street environments and built environment characteristics, and to analyze their nonlinear impacts on urban vitality and spatial differences [
19,
21]. The integration of these data sources provides important technical support for identifying spatial differences in urban vitality and functional structures at the block scale.
Although existing studies have provided an important foundation for measuring urban vitality, recent reviews have pointed out that existing research still has limitations in the selection of proxy indicators, temporal representativeness, the expression of functional differences, and the explanation of underlying mechanisms [
4,
5]. First, a single data source often reflects only one aspect of urban vitality, making it difficult to simultaneously characterize the synergistic relationships among economic activity, human activity, and cultural resource supply. Second, existing measurements of cultural vitality mostly rely on POI counts or simple density indicators, and remain insufficient in characterizing differences in cultural resource types, spatial distribution patterns, and their relationships with economic and social vitality. As a result, the representation of cultural vitality tends to remain at the level of simple facility supply. Third, existing studies mostly focus on the spatial distribution of vitality levels, while the coupling coordination state among economic, social, and cultural vitality, local spatial clustering characteristics, and the dominant factors of disorder remain insufficiently explored. Coupling coordination degree models can characterize the synergistic relationships among multiple subsystems, while spatial autocorrelation analysis can reveal the spatial dependence and local clustering characteristics of geographic phenomena [
22,
23,
24,
25,
26]. However, their integrated application in the multidimensional diagnosis of urban vitality at the block scale still requires further development.
This study refines a block-scale diagnostic workflow for multidimensional urban vitality by integrating vitality measurement, coordination assessment, spatial clustering identification, and dominant disorder factor diagnosis. Existing studies have widely used multi-source data, such as nighttime light data, location-based service data, and POIs, to identify the spatial patterns of urban vitality and have discussed the effects of the built environment, functional mix, or facility supply on vitality [
6,
7,
8,
9,
10,
11,
12,
13,
14,
15,
16,
17,
18,
19,
21]. However, these studies have mostly focused on comprehensive vitality evaluation or the explanation of influencing factors, while insufficient attention has been paid to the coordination status among economic, social, and cultural vitality and the dominant constraining dimensions of low-coordination blocks [
17,
18,
19,
21,
26]. In contrast, this study integrates multidimensional vitality measurement, coupling coordination assessment, spatial clustering identification, and dominant disorder factor diagnosis into a unified workflow [
22,
23,
24,
25,
26,
27,
28], thereby enhancing the comprehensive diagnostic capacity of block-scale urban vitality research.
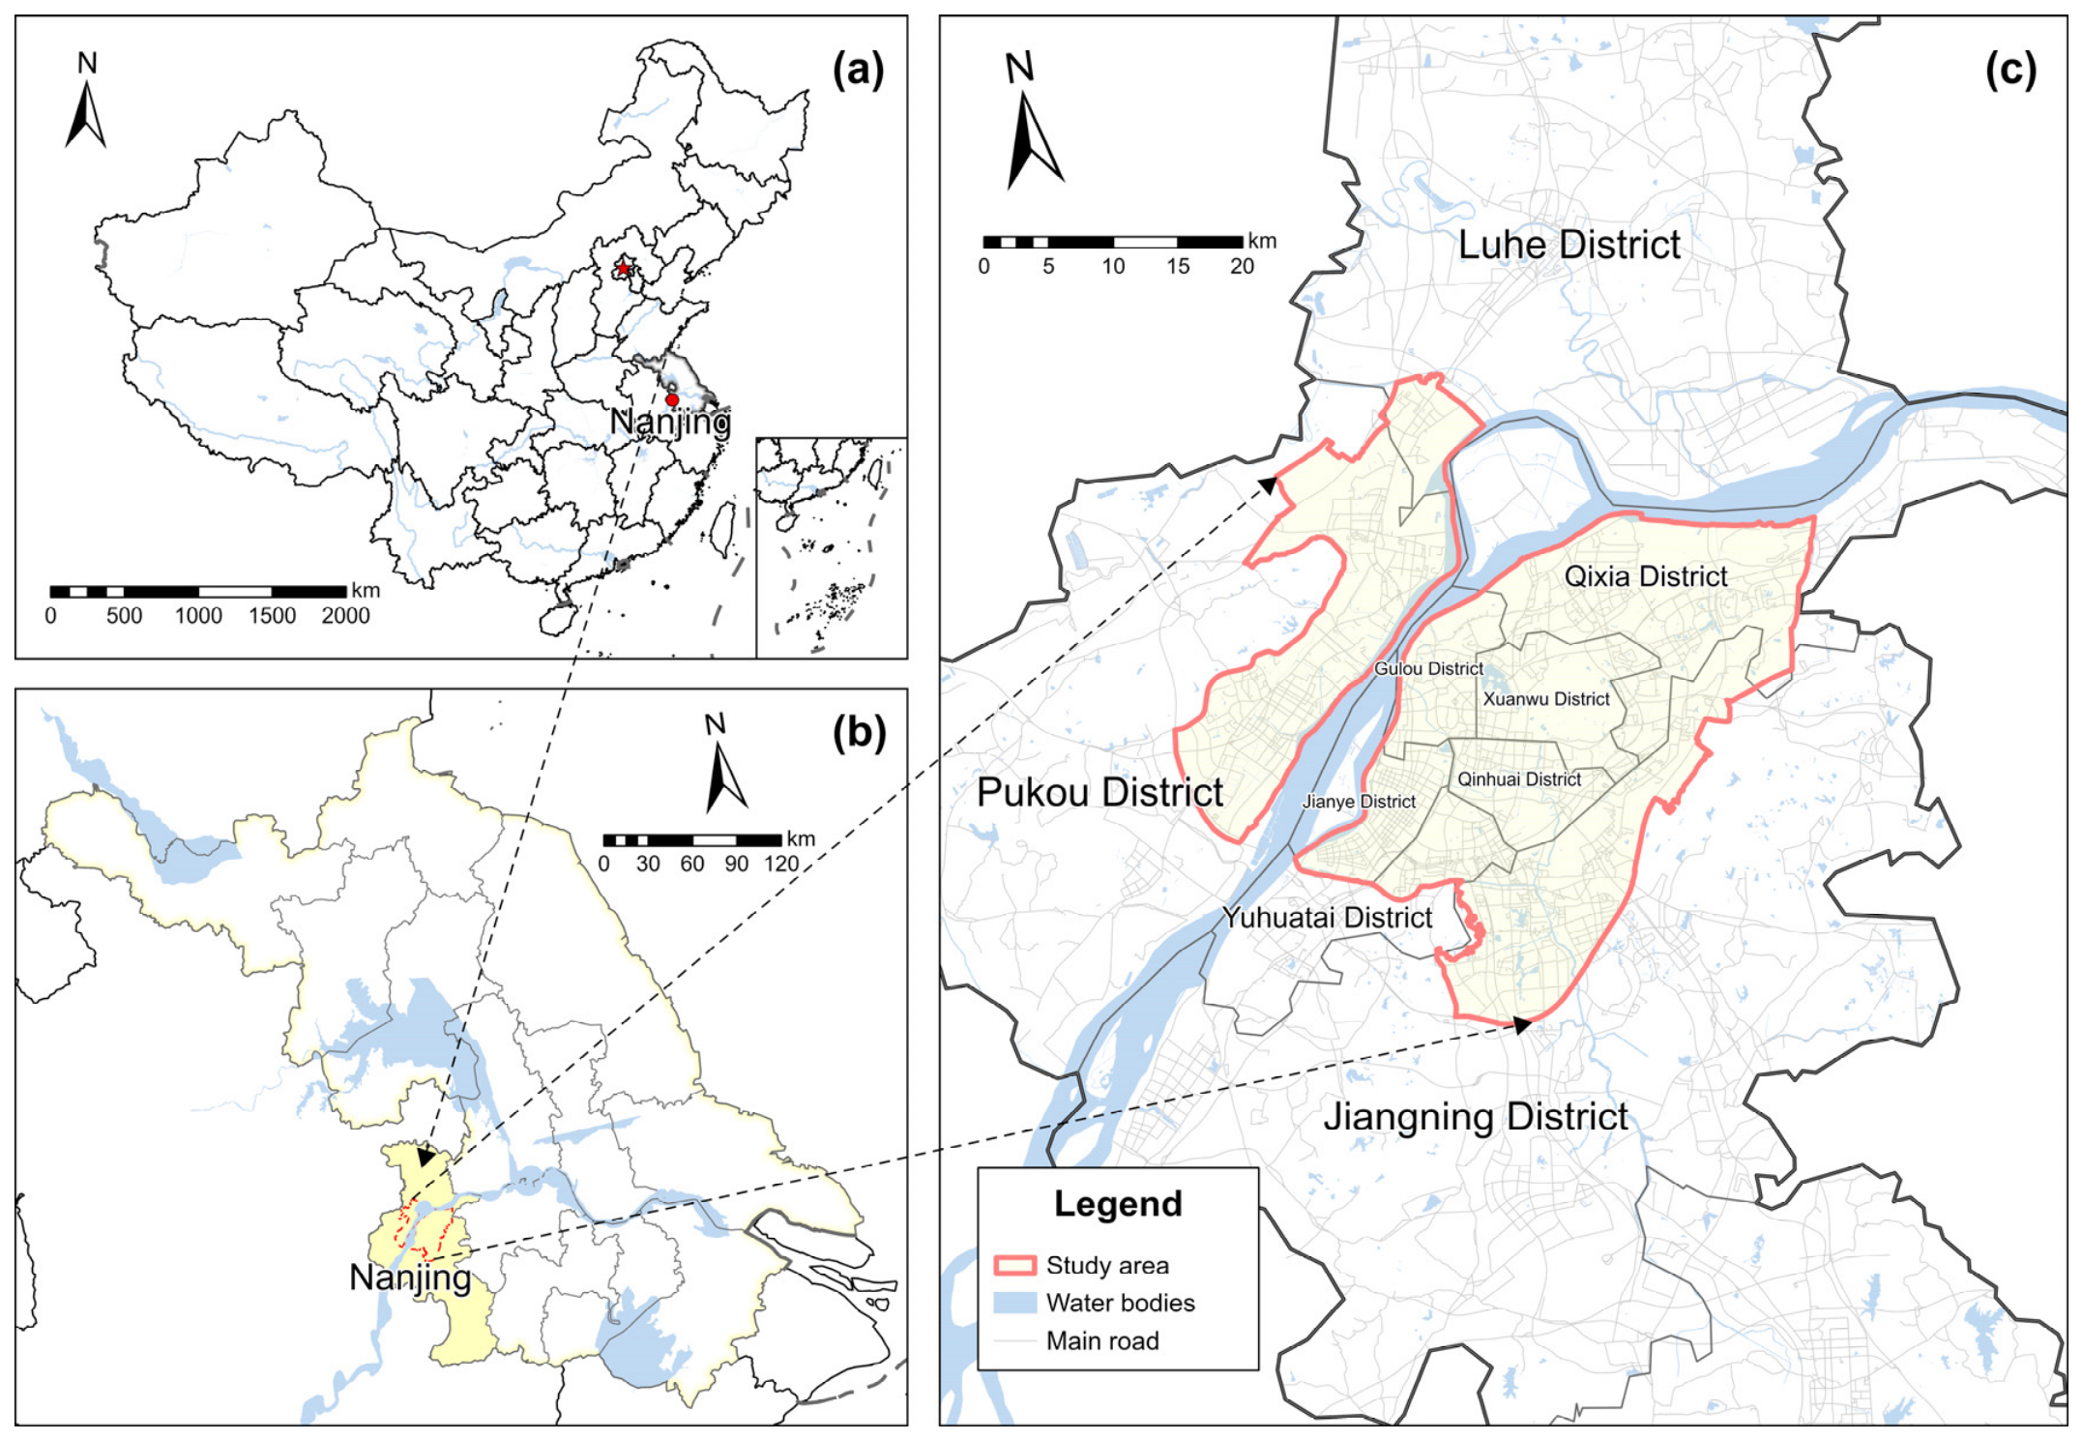
Nanjing is an important historical and cultural city in China and one of the central cities in the Yangtze River Delta region. Its central urban area includes various spatial types, such as the traditional old city core, Hexi New City, the Jiangbei new main urban area, university towns, riverside spaces, and newly developed peripheral areas [
29,
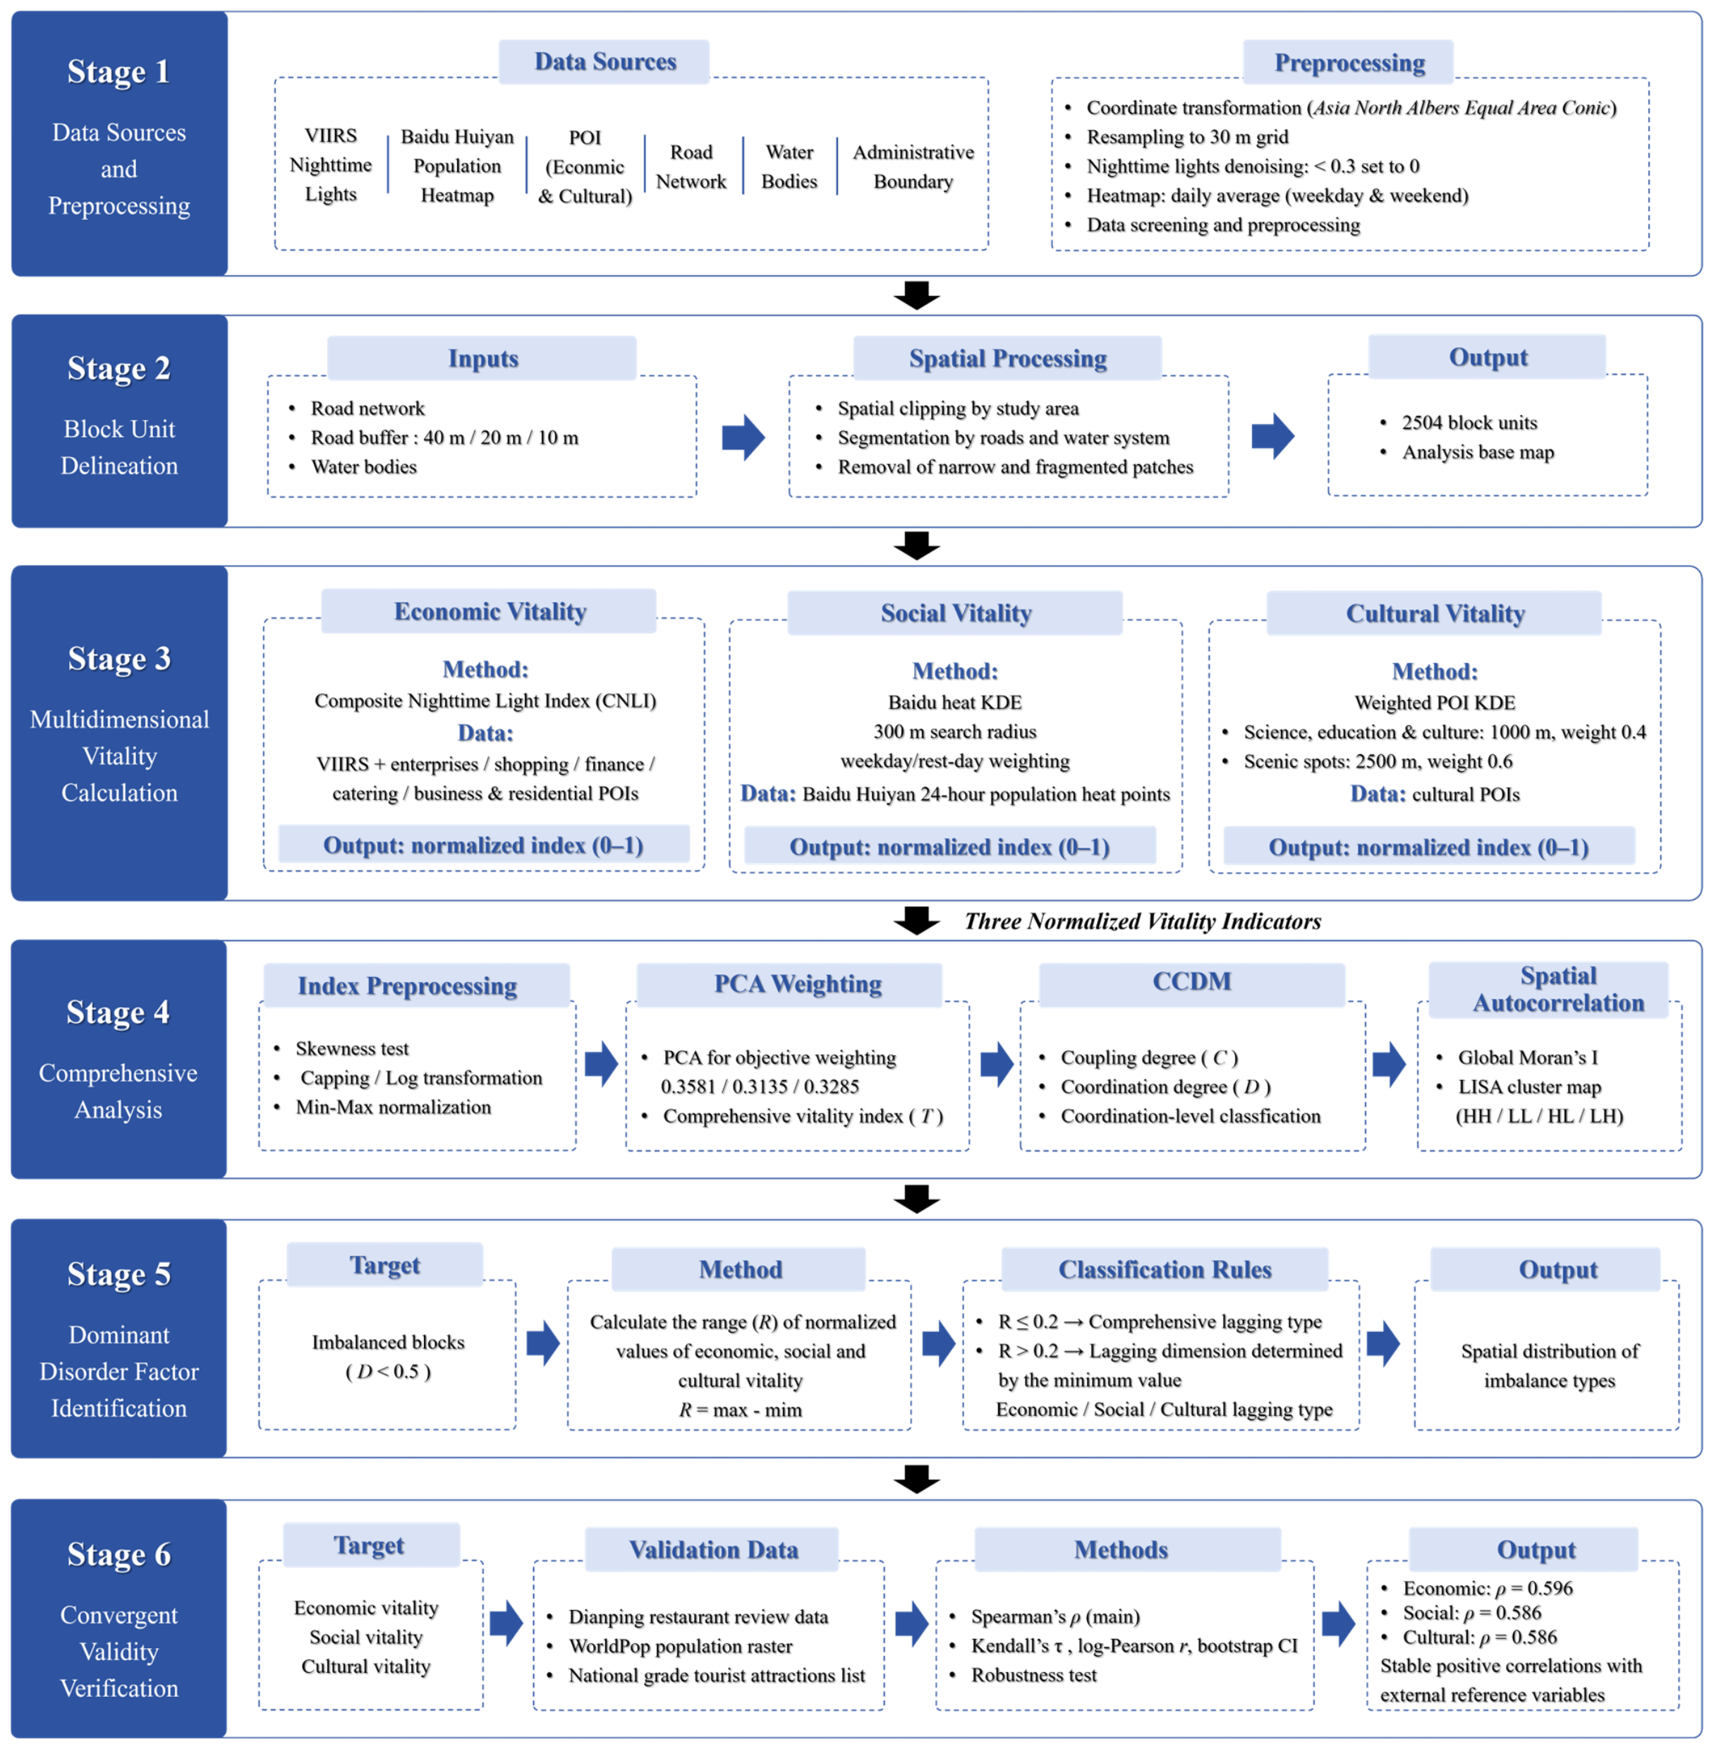
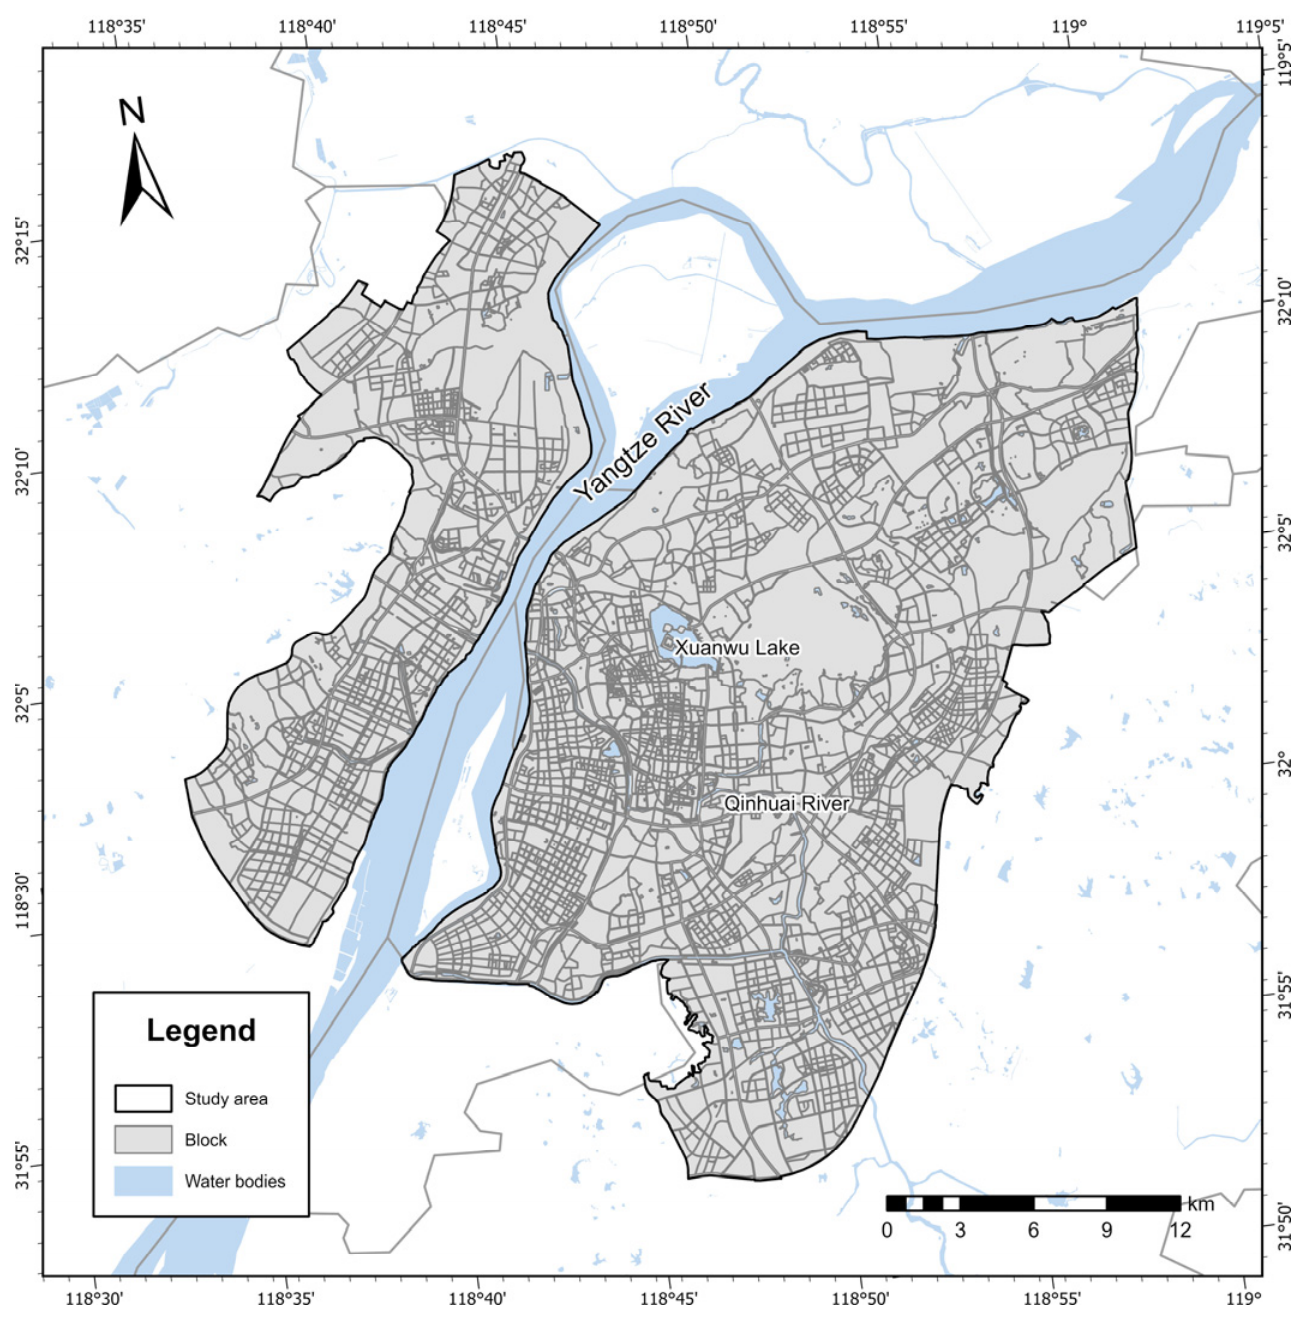
30]. Under the combined influence of historical accumulation and rapid urban expansion, the central urban area of Nanjing presents a spatial pattern characterized by the coexistence of old and new urban areas, polycentric development, and significant functional differences. This provides a typical case for analyzing the spatial structure and coupling coordination relationship of multidimensional vitality in a historical and cultural city. Based on this, this study takes 2504 blocks in the central urban area of Nanjing as the basic analytical units and integrates multi-source geospatial data, including VIIRS nighttime light data, Baidu Huiyan population heat data, POIs, road networks, and water systems. An urban vitality evaluation system is constructed from three dimensions: economic, social, and cultural vitality. The following research questions are addressed: What spatial pattern does multidimensional vitality exhibit in the central urban area of Nanjing? How does the coupling coordination level of multidimensional vitality vary across space? What are the dominant constraints in low-coordination blocks?
Addressing the above research questions, the contributions of this study are mainly reflected in the following three aspects. (1) In the measurement of economic vitality, VIIRS nighttime light data are geometrically fused with the kernel density of economy-related POIs to mitigate the potential problems of light spillover and spatial generalization in nighttime light data at the block scale, allowing economic vitality to better reflect the spatial clustering characteristics of industrial, consumption, and business activities. (2) From the perspective of “observable urban vitality,” multi-source geospatial data, including nighttime light data, population heat data, and POIs, are used to characterize economic activity, human activity, and cultural resource supply, respectively. A block-scale three-dimensional evaluation framework of economic–social–cultural vitality is constructed, and external reference data are introduced to examine the consistency between the indicator results and the actual distribution of commercial consumption, population agglomeration, and cultural tourism resources. (3) On the basis of comprehensive vitality measurement, coupling coordination degree, spatial autocorrelation, and dominant disorder factor identification are further introduced, shifting the research focus from the “spatial description of vitality levels” to the diagnostic analysis of “whether multidimensional vitality is coordinated and which dimensions constrain low-coordination blocks,” thereby providing more targeted quantitative evidence for refined block-scale governance in historic and cultural cities.
3. Results
3.1. Results of Vitality Indicator Calculation
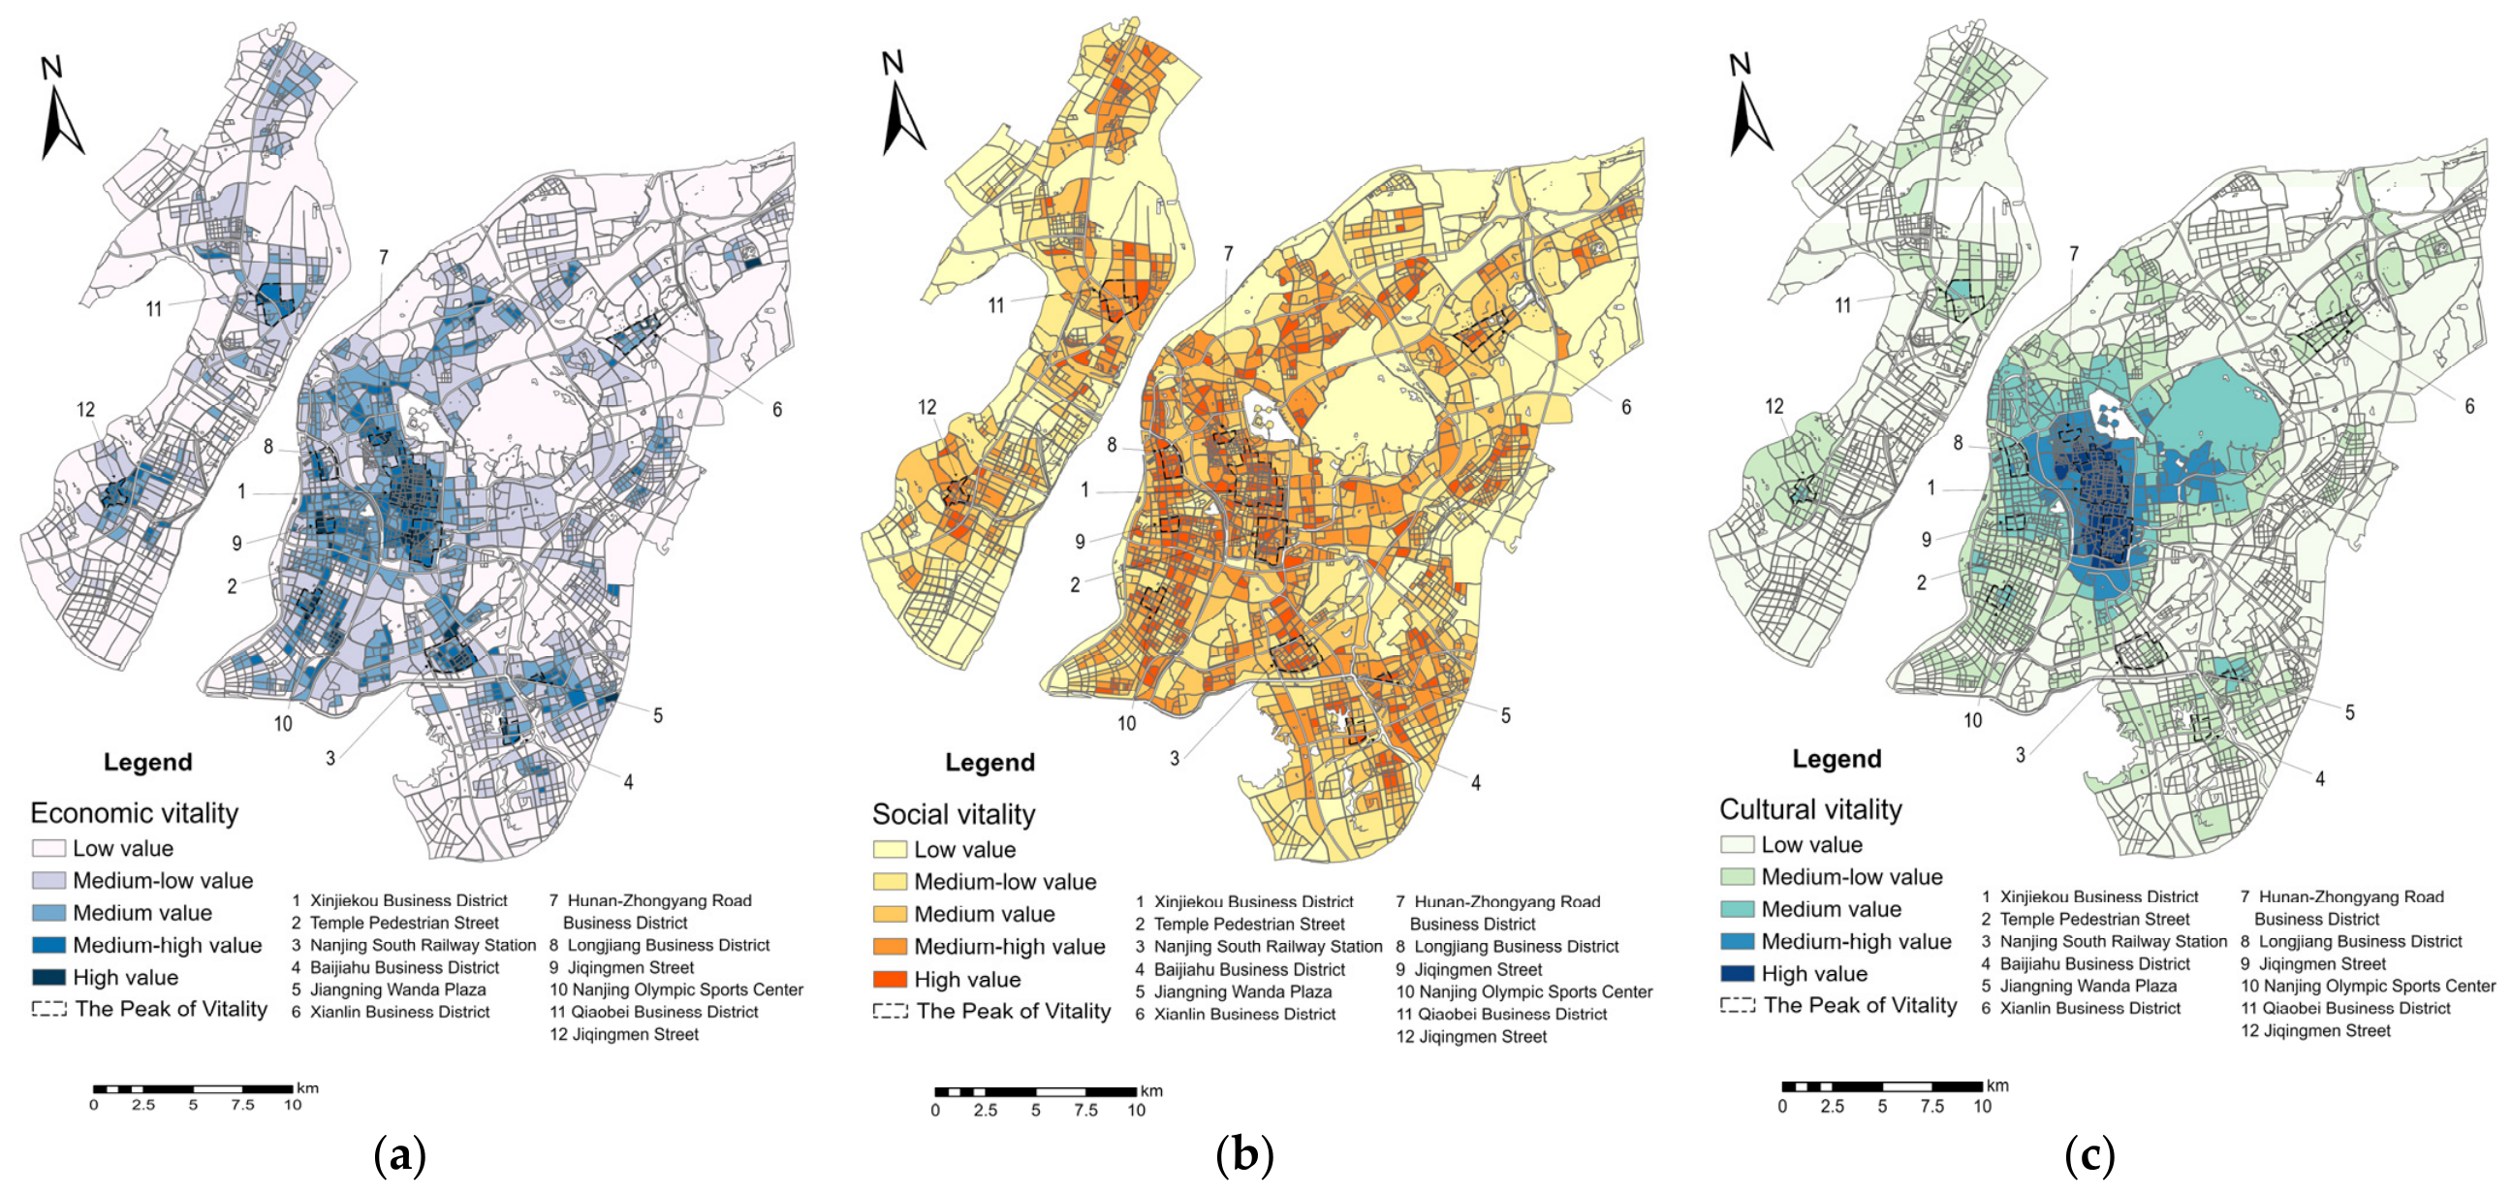
Based on the vitality calculation methods described above, the economic, social, and cultural vitality of Nanjing’s central urban area were measured separately. Using the natural breaks classification method, the results were divided into five levels: low, medium-low, medium, medium-high, and high values (
Figure 5).
Economic vitality shows a pattern characterized by the coexistence of agglomeration in the old city core and nodal distribution in peripheral areas. High-value areas are mainly concentrated in the Xinjiekou business district, Confucius Temple Pedestrian Street and its surrounding area, while several medium- and relatively high-value patches are formed around nodes such as the Hunan Road–Zhongyang Road business district, the Longjiang business district, the Nanjing Olympic Sports Center, Nanjing South Railway Station, Jiangning Wanda Plaza, and the Baijiahu business district. Peripheral areas such as Qiaobei, Jiangbei, and Xianlin also show localized medium- or relatively high-value distributions, but their overall spatial continuity is relatively weak. Overall, economic vitality remains most strongly concentrated in the old city core, while peripheral areas mainly show scattered point-like distributions supported by regional commercial nodes, transportation hubs, and mature residential areas.
In contrast to economic vitality, social vitality in the central urban area shows a relatively balanced spatial distribution. High- and relatively high-value units are widely distributed and are not highly concentrated in a few core nodes. In addition to high-value clusters such as the Xinjiekou business district, Confucius Temple Pedestrian Street, the Hunan Road–Zhongyang Road business district, the Longjiang business district, and the area around the Nanjing Olympic Sports Center, areas such as Qiaobei, Jiangbei, Xianlin, Nanjing South Railway Station, Jiangning Wanda Plaza, and the Baijiahu business district also contain numerous medium- and relatively high-value patches. These patterns reflect the close relationship between social vitality and the maturity of community life circles, the convenience of public services, and daily consumption activities. This indicates that social vitality better reflects the spatial distribution of daily life activities and has strong life-oriented characteristics and relative spatial balance.
Cultural vitality generally shows a pattern of central agglomeration and contiguous distribution. High-value areas are mainly concentrated around the Confucius Temple Scenic Area, the Xinjiekou business district, and the Hunan Road–Zhongyang Road business district, and extend toward the Ming Palace–Nanjing Museum–Nanjing Library area, forming a cultural vitality agglomeration belt covering the old city core. Among these areas, Confucius Temple and its surroundings constitute a core of cultural vitality supported by dense historical and cultural resources and cultural tourism consumption. The Xinjiekou and Hunan Road–Zhongyang Road areas maintain relatively high levels of activity due to the support of commercial and cultural facilities, public service facilities, and high-intensity urban activities. The area around the Ming Palace forms stable medium-to-high- and high-value zones supported by high-level cultural facilities. Compared with economic and social vitality, cultural vitality declines more markedly in peripheral areas. Qiaobei, Jiangbei, Xianlin, and Jiangning are mostly dominated by low- and relatively low-value areas, with only scattered medium-value patches.
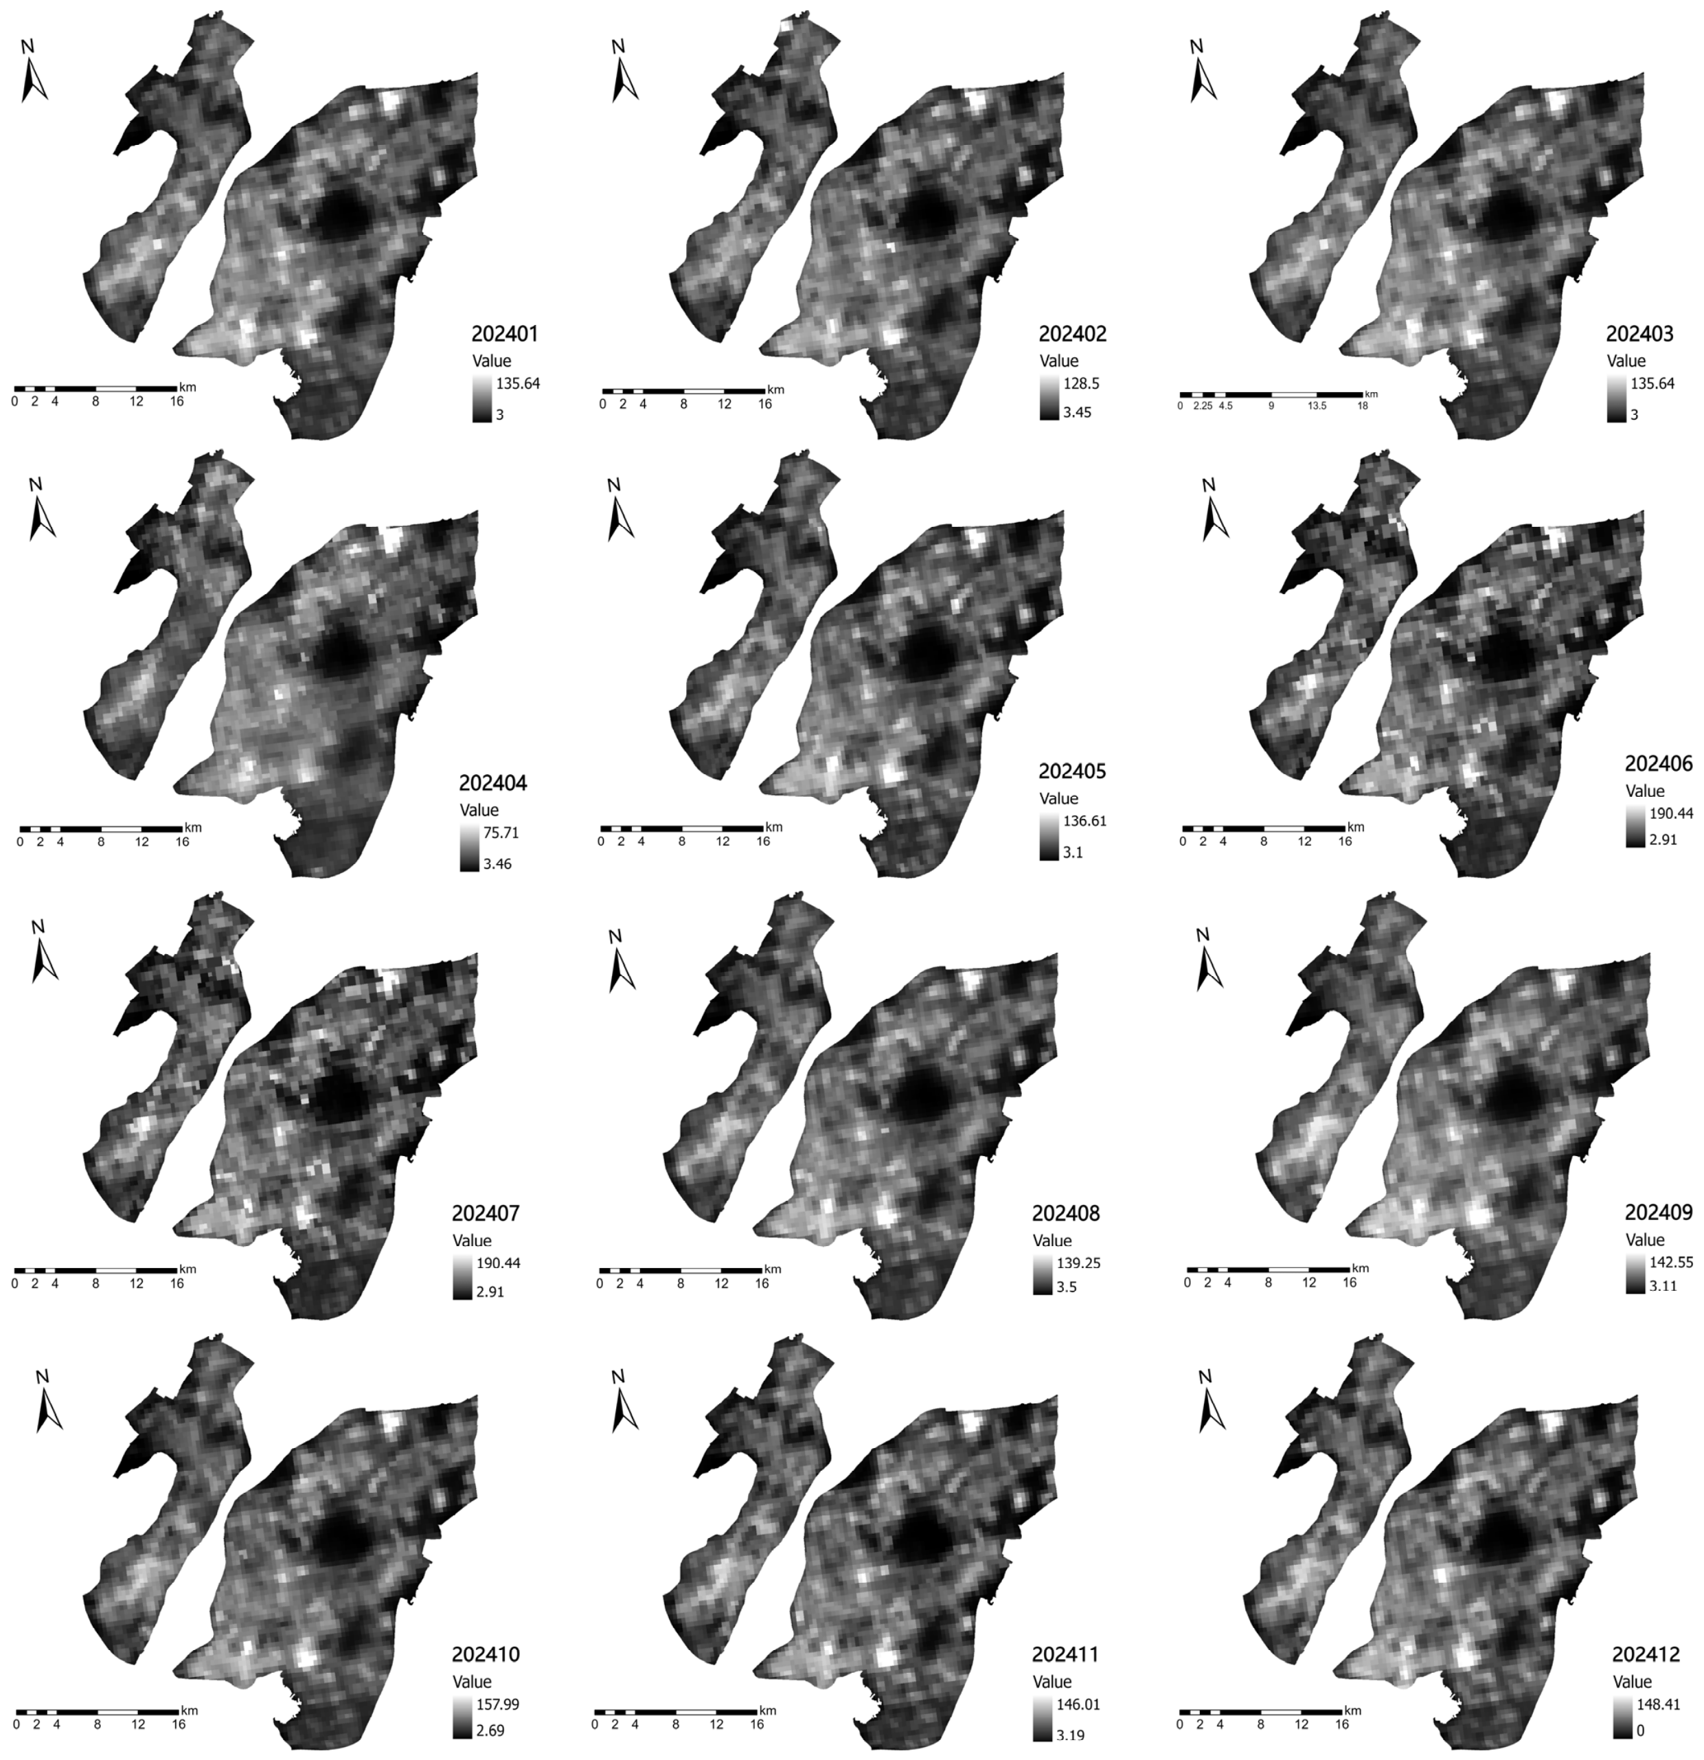
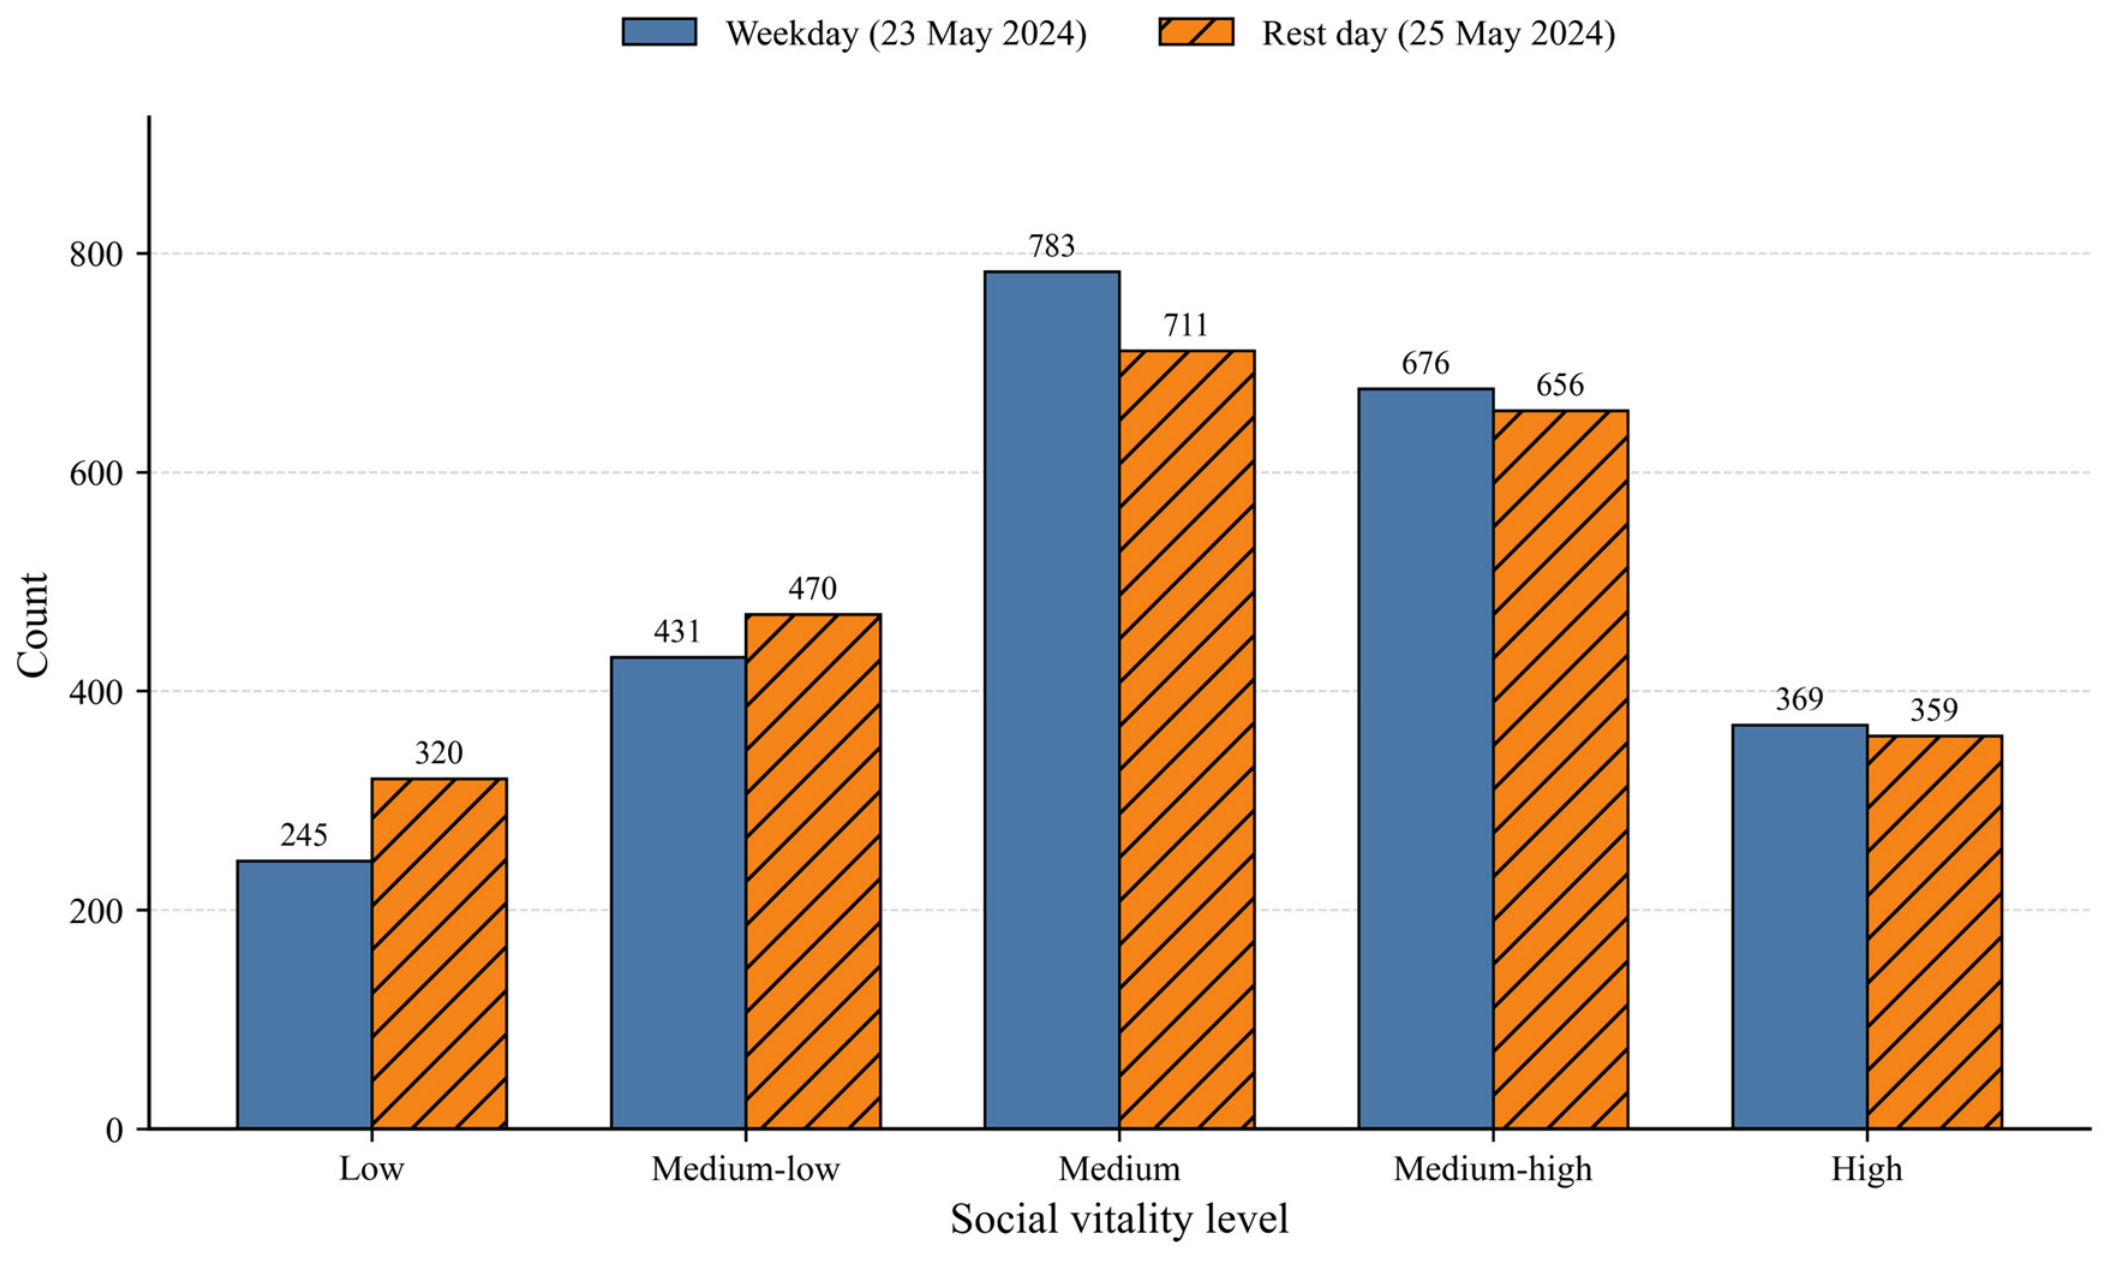
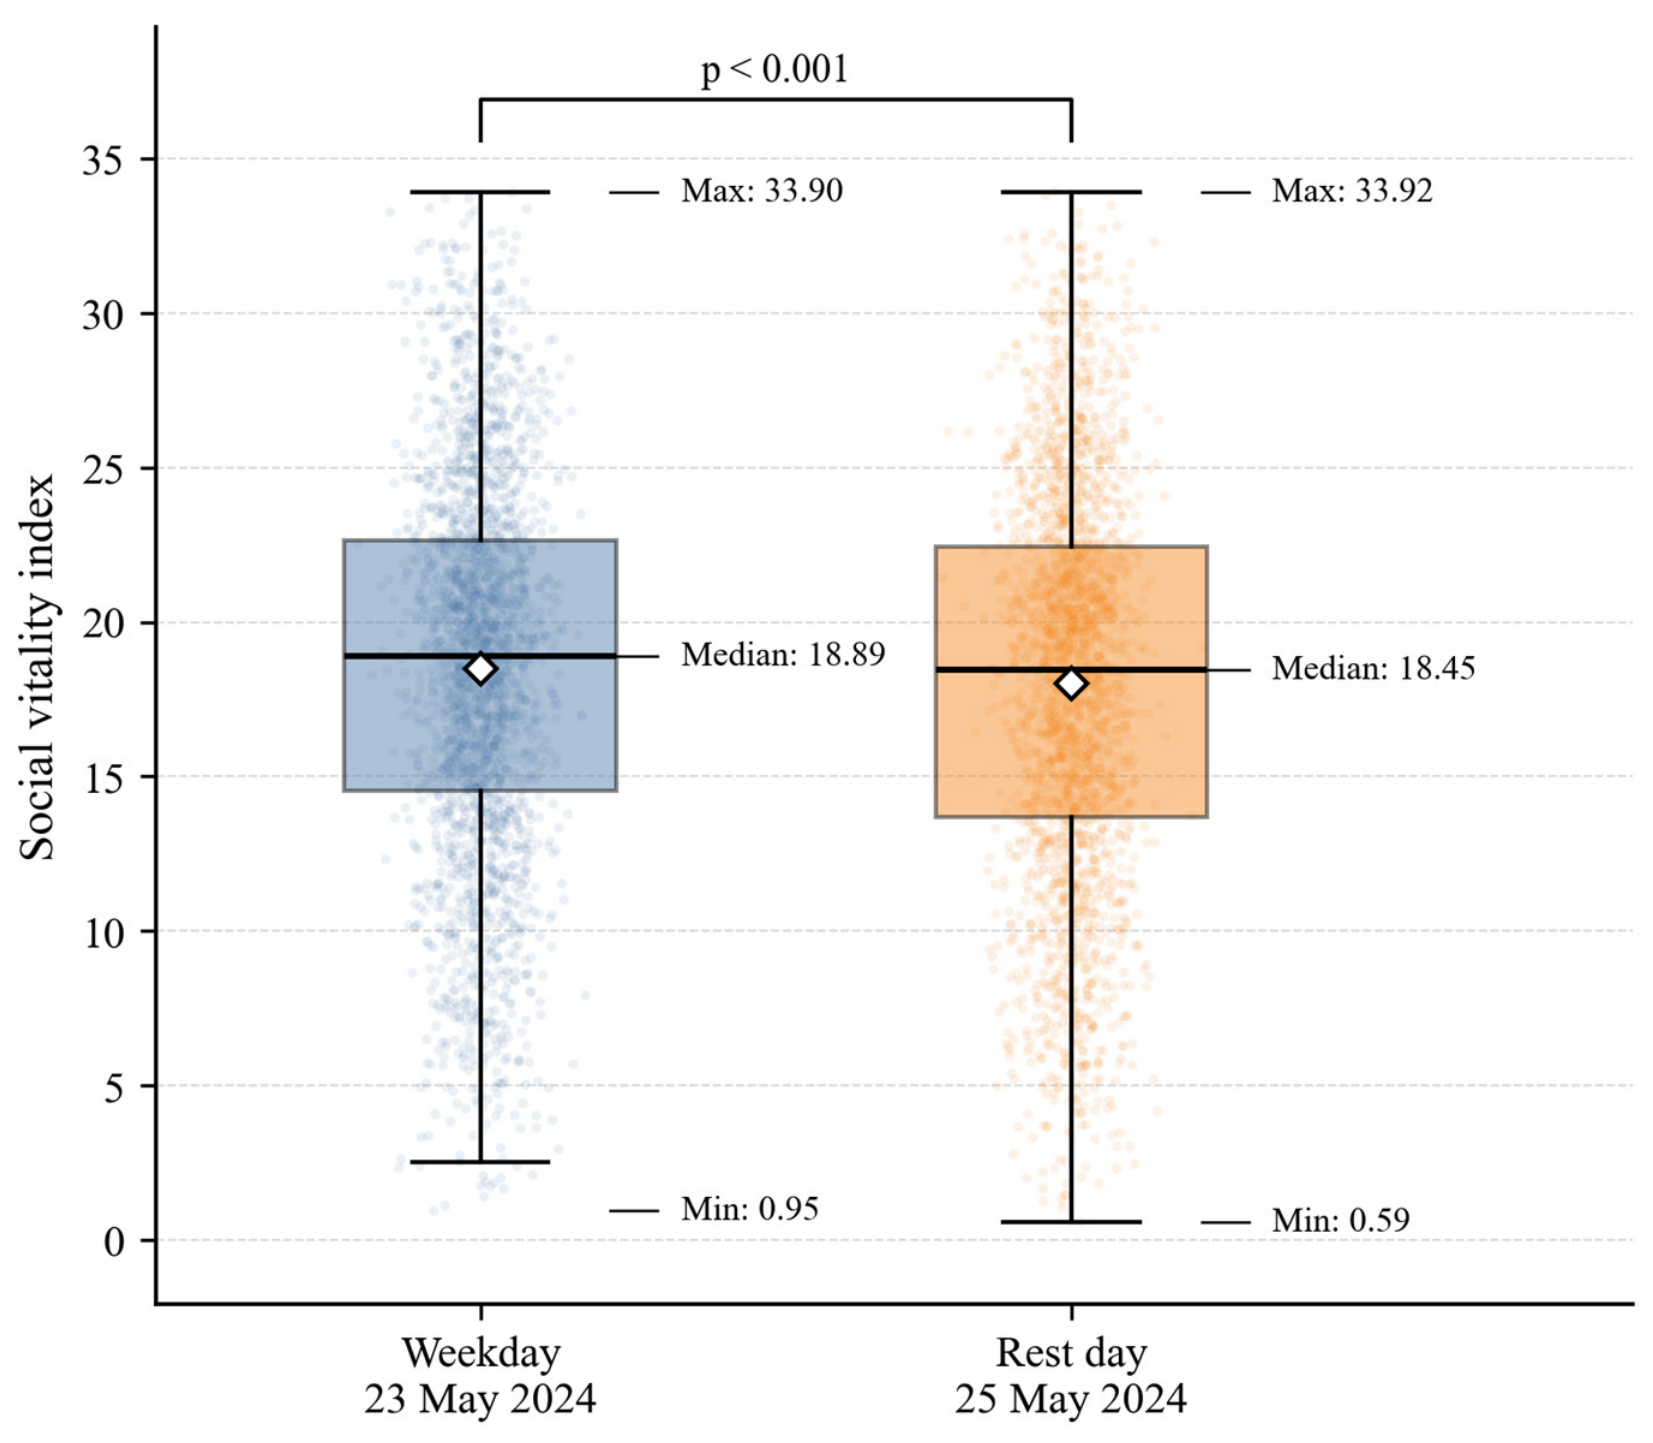
To examine the differences in social vitality between the weekday and the rest day, this study further compared the spatial distribution, class structure, and statistical distribution of social vitality on the two sample days. The results show that social vitality on the weekday was slightly higher overall than that on the rest day, while the spatial patterns of the two days were generally similar. Core business districts, mature residential areas, and major transportation nodes maintained relatively high levels of activity on both sample days. These results indicate that the 5:2 weighted average of weekday and rest-day values can effectively represent block-level social vitality at the weekly scale. The relevant results are shown in
Figure A2 and
Figure A3.
3.2. Convergent Validity Verification of Vitality Indicators
To further examine whether the economic, social, and cultural vitality indicators developed in this study can effectively characterize the corresponding dimensions of urban activity, this study introduces external reference data to conduct convergent validity verification. Convergent validity emphasizes that measurement results from different data sources or methods for the same or similar underlying concepts should show consistent relationships [
42]. Since data such as nighttime light data, population heat data, and POIs are all indirect proxies for urban vitality, it is necessary to examine whether their spatial distribution patterns are consistent with the actual distribution of economic activities, population agglomeration, and cultural resources.
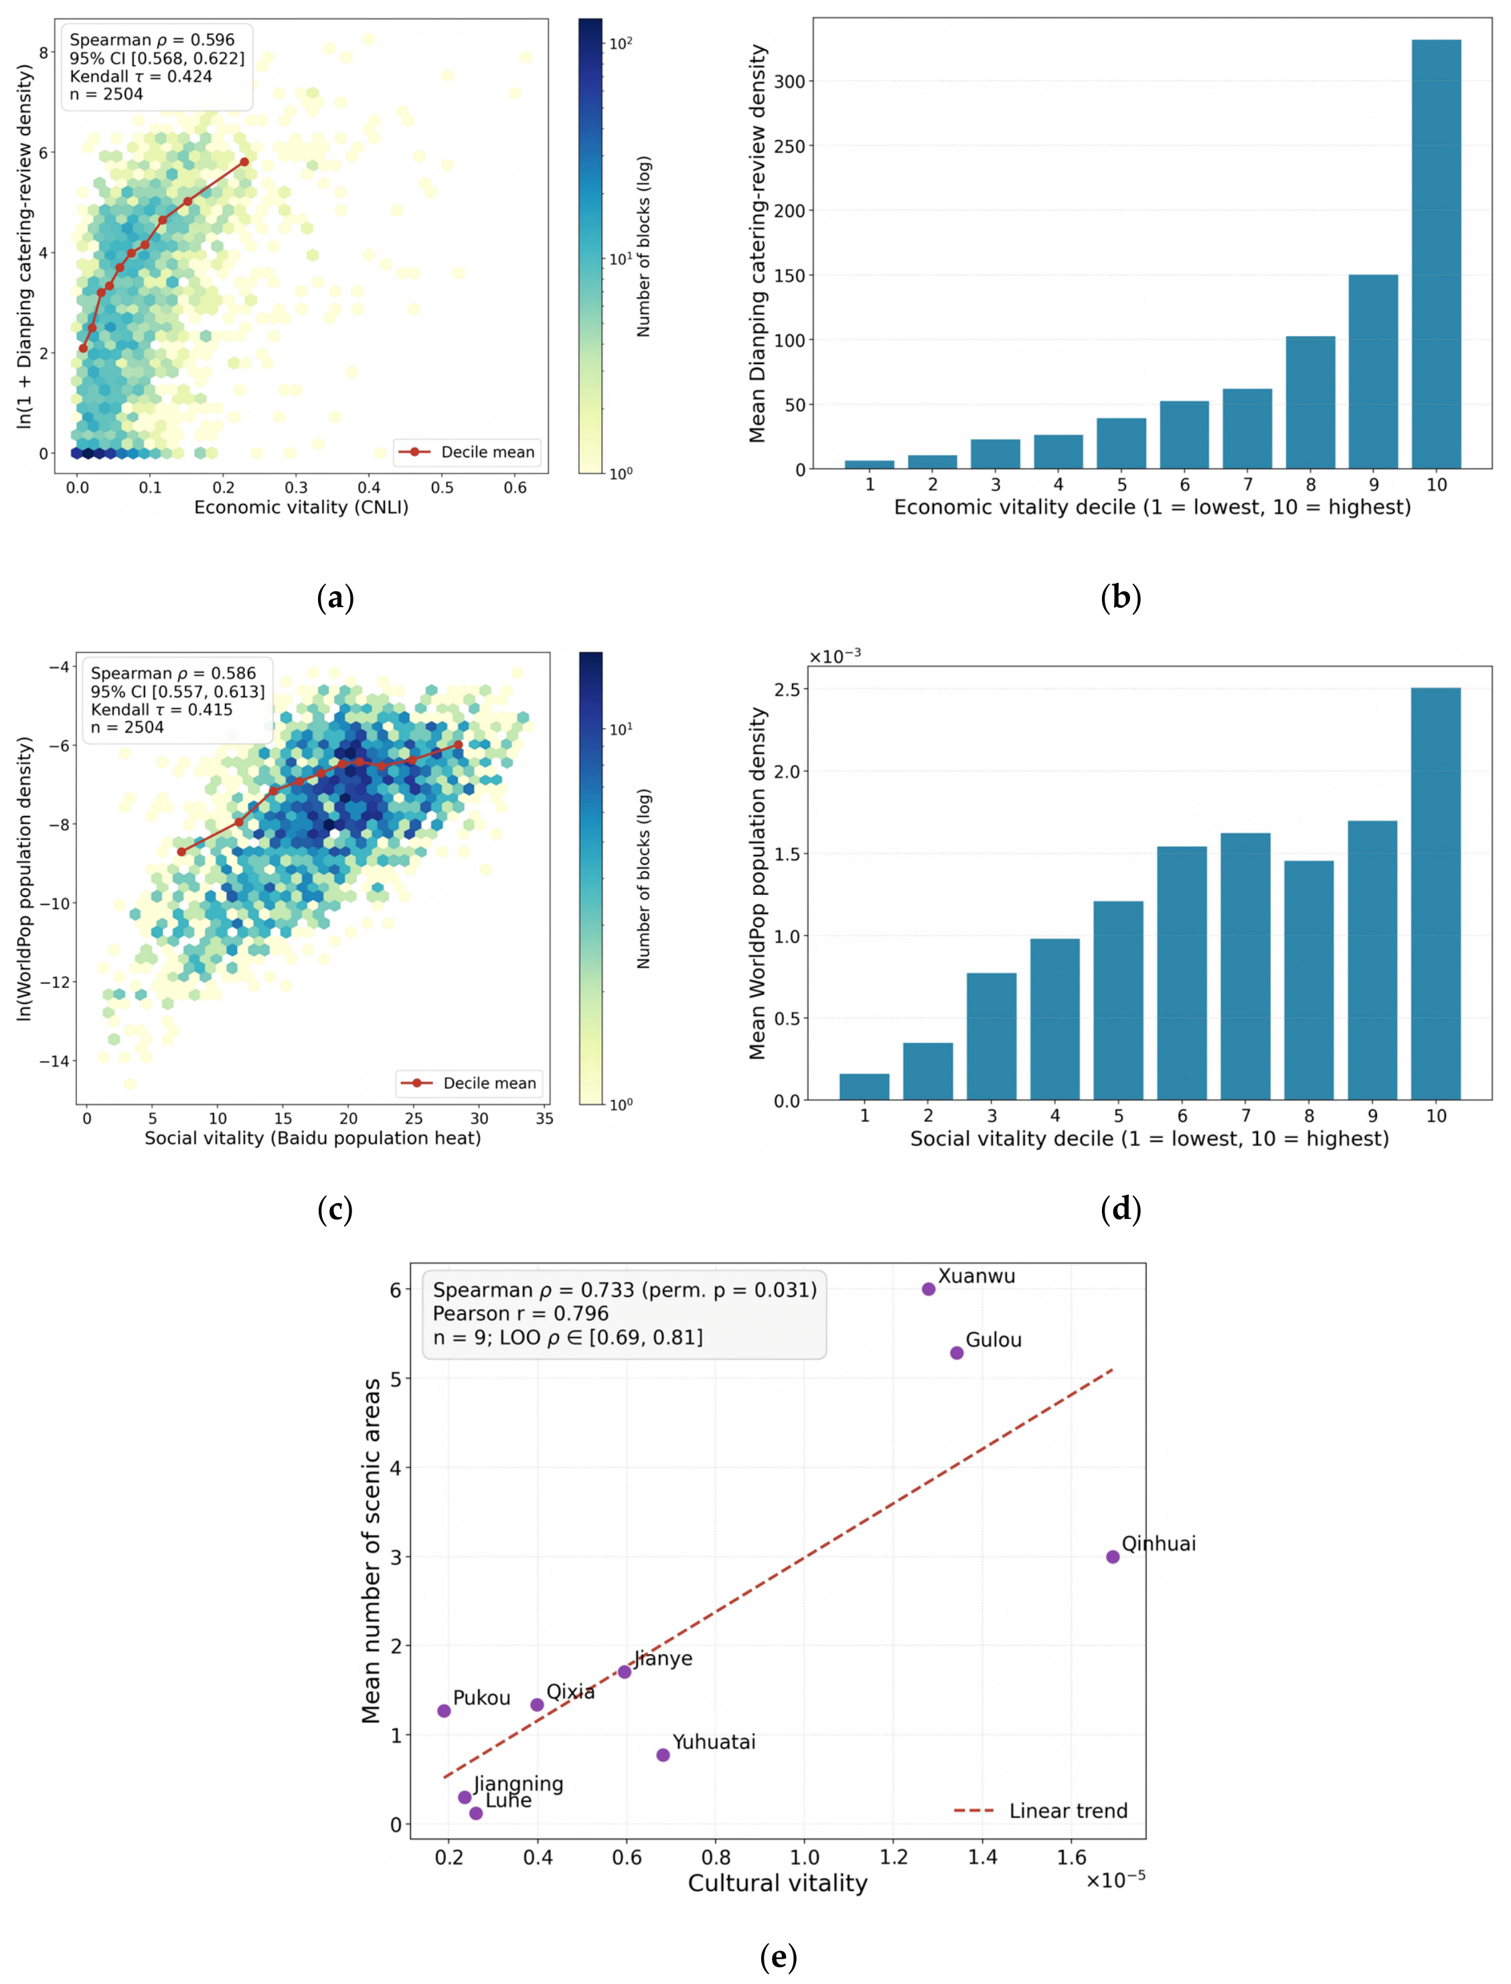
Specifically, for economic vitality, the Composite Nighttime Light Index (CNLI) constructed in this study was used as the indicator to be validated, and the density of Dianping restaurant reviews in Nanjing in 2024 was used as the external reference variable. For social vitality, the Baidu Huiyan weighted population heat value was used as the indicator to be validated, and population density calculated from WorldPop population raster data [
32] was used as the external reference variable. For cultural vitality, the weighted kernel density of cultural facilities was used as the indicator to be validated, and the number of scenic spots derived from the list of national grade tourist attractions in Nanjing [
35] was used as the external reference variable. These external datasets validate the three vitality indicators from the perspectives of commercial consumption activities, spatial population agglomeration, and cultural tourism resources, respectively.
In terms of validation scale, economic and social vitality were both validated across the 2504 block units. Cultural vitality, however, was validated at the district level, covering a total of nine administrative districts, because the official scenic spot directory is more appropriately aggregated by administrative district. Considering that block-level data usually exhibit skewed distributions and spatial heterogeneity, this study used Spearman’s rank correlation coefficient as the main statistic, and further calculated Kendall’s tau, the log-transformed Pearson correlation coefficient, and bootstrap confidence intervals [
43,
44]. For the district-level validation of cultural vitality, permutation tests and leave-one-out robustness tests were further employed because of the small sample size.
The validation results are shown in
Table 5 and
Figure 6. Economic vitality was significantly positively correlated with the density of Dianping restaurant reviews, with Spearman’s ρ of 0.596, a 95% bootstrap confidence interval of [0.568, 0.622], a Kendall’s tau of 0.424, and a log-transformed Pearson correlation coefficient of 0.536. The decile gradient results further show that as the level of economic vitality increased, the average density of restaurant reviews generally increased, indicating that the CNLI can effectively reflect the spatial clustering characteristics of commercial consumption activities at the block scale.
Social vitality also showed a stable positive correlation with WorldPop population density, with Spearman’s ρ of 0.586, a 95% bootstrap confidence interval of [0.557, 0.613], a Kendall’s tau of 0.415, and a log-transformed Pearson correlation coefficient of 0.636. These results indicate that blocks with higher Baidu Huiyan population heat values generally also had higher population densities, suggesting that the social vitality indicator constructed in this study can effectively capture population agglomeration and the intensity of daily activities.
The district-level validation results for cultural vitality show a strong positive correlation between average cultural vitality and the number of scenic spots, with Spearman’s ρ of 0.733, a permutation test p-value of 0.031, and a Pearson correlation coefficient of 0.796. The leave-one-out test showed that after excluding one administrative district at a time, Spearman’s ρ remained within the range of [0.69, 0.81], indicating that this correlation was reasonably robust.
Overall, all three types of vitality indicators exhibited stable positive correlations with their respective external reference variables, indicating that the economic, social, and cultural vitality indicators constructed in this study have good convergent validity. At the same time, this validation still has certain limitations. First, Dianping restaurant review density mainly reflects dining consumption and online review activity. It is more suitable as an external validation variable for consumption-oriented economic vitality, but it cannot fully represent all economic activities. Second, WorldPop population density and Baidu Huiyan population heat data focus on static population distribution and dynamic activity intensity, respectively, and there are conceptual differences between the two. Third, the validation of cultural vitality is constrained by the small sample size at the district level. In addition, because the list of tourist attractions mainly reflects cultural tourism resources, its coverage of community cultural facilities, intangible cultural heritage activities, and everyday cultural consumption remains limited.
3.3. Spatial Distribution and Clustering Characteristics of Comprehensive Vitality
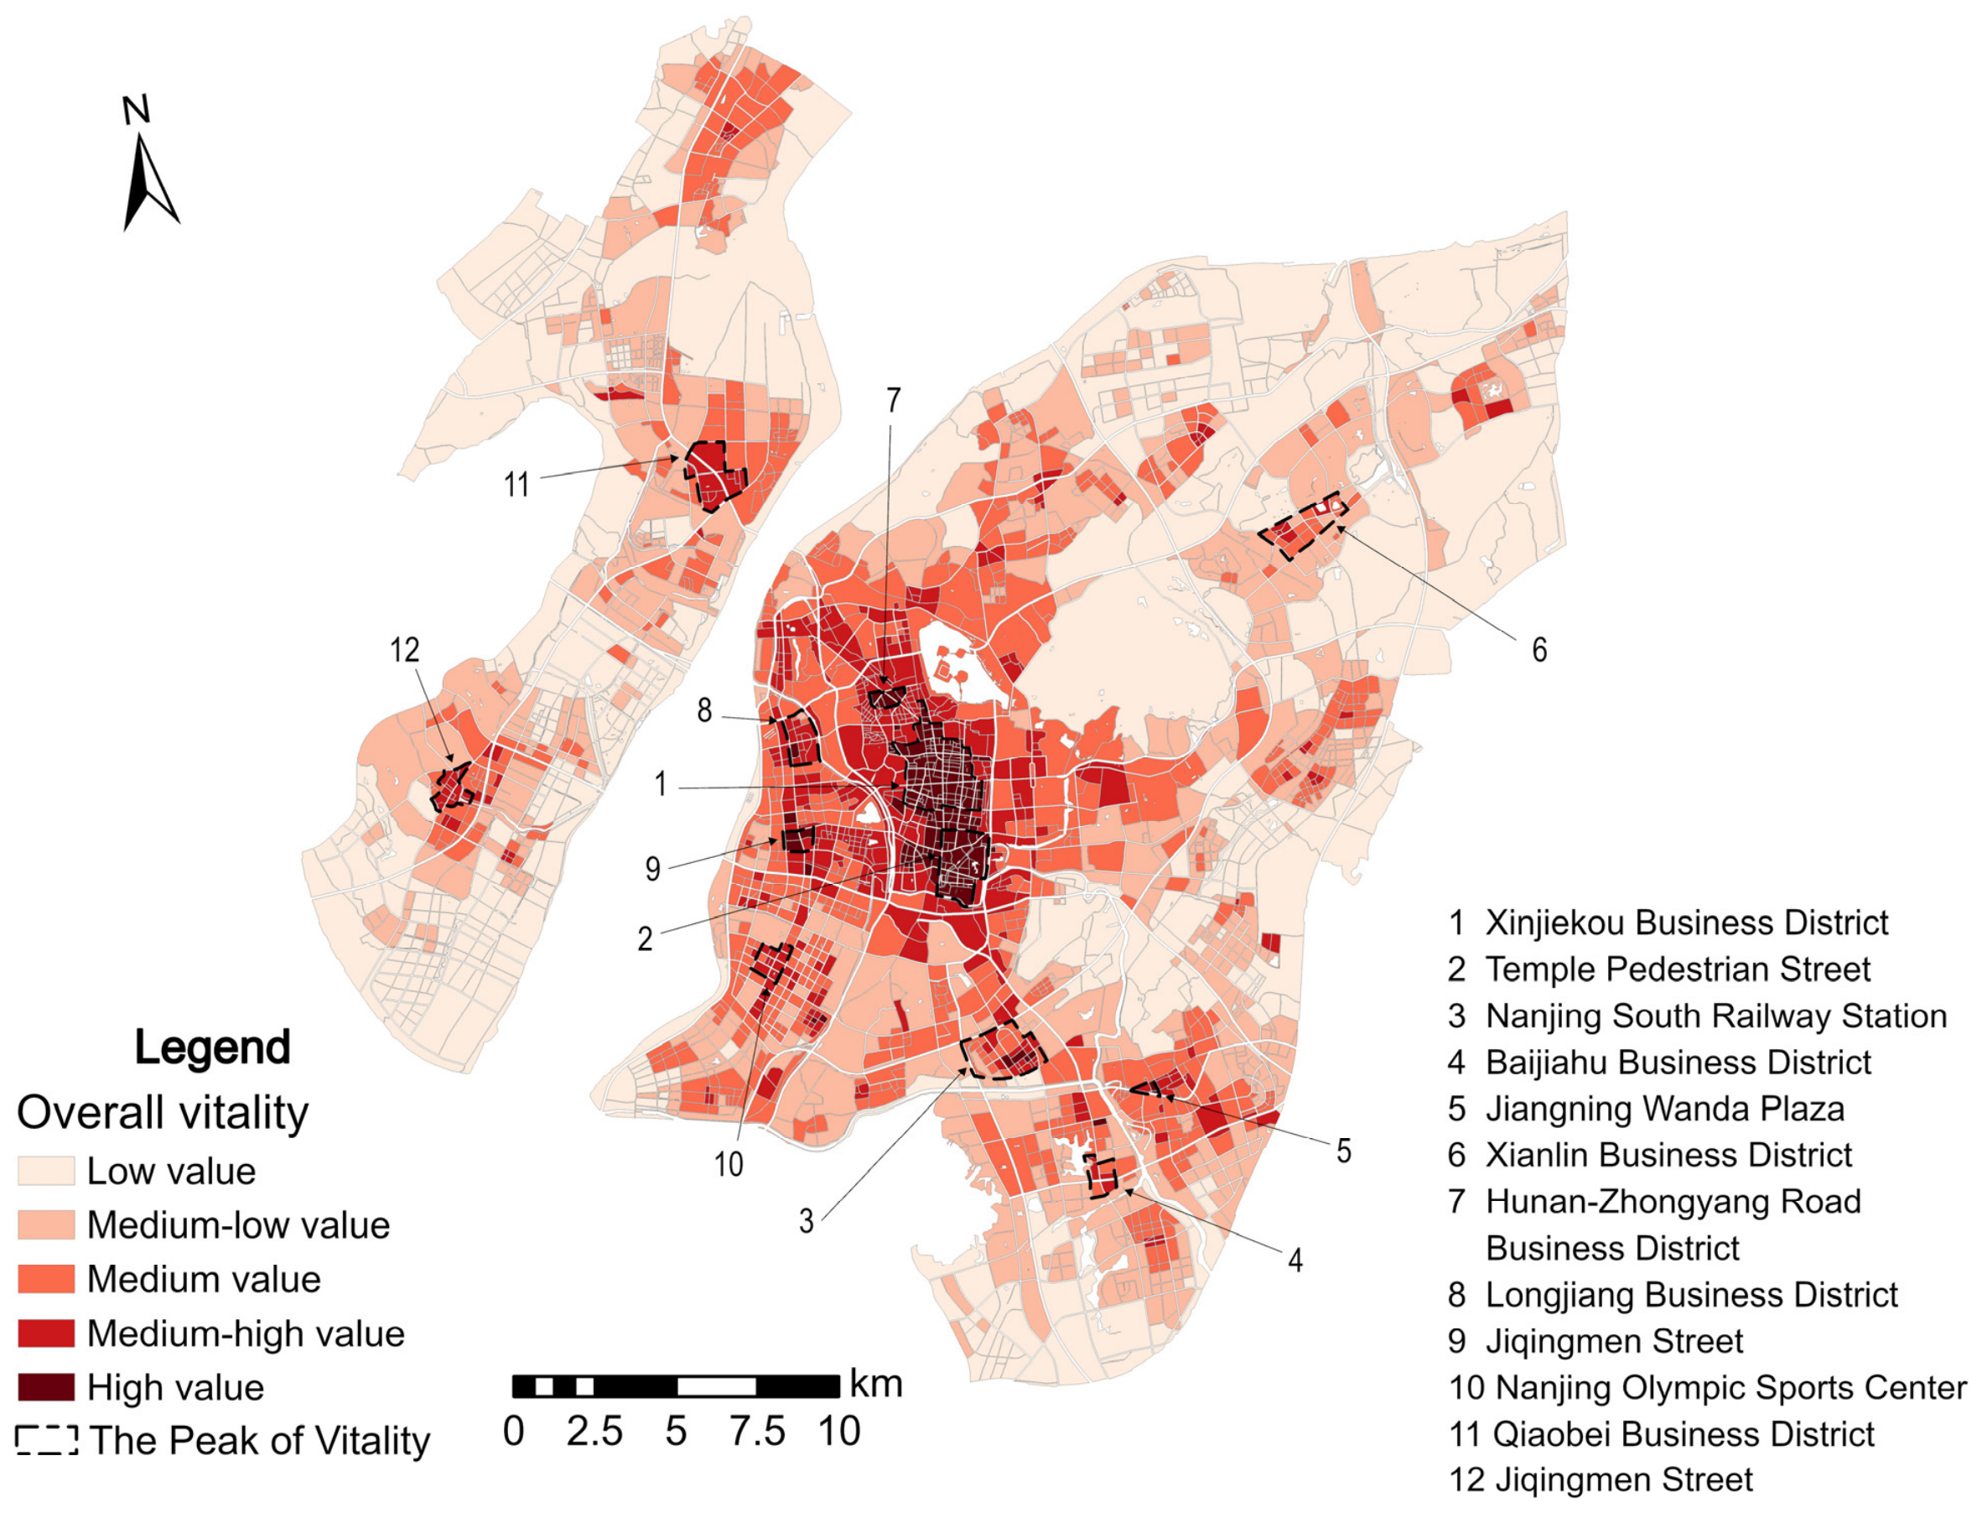
Comprehensive vitality is a composite evaluation result derived from the weighted sum of economic, social, and cultural vitality, reflecting the overall superimposition of multidimensional functional activities at the block level. Its spatial distribution is shown in
Figure 7. Overall, the comprehensive vitality of Nanjing’s central urban area exhibits a distinct “core agglomeration–multi-node diffusion” spatial structure. High-value areas are mainly concentrated in the Xinjiekou business district, Confucius Temple Pedestrian Street, Hunan Road–Zhongyang Road business district, Longjiang business district, and Jiqingmen Avenue. Several localized relatively high- or high-value patches are also formed around peripheral nodes such as Nanjing South Railway Station, the Baijiahu business district, Jiangning Wanda Plaza, the Xianlin business district, the Qiaobei business district, and the Nanjing Olympic Sports Center. Low-value areas are widely distributed along the outer periphery of the central urban area.
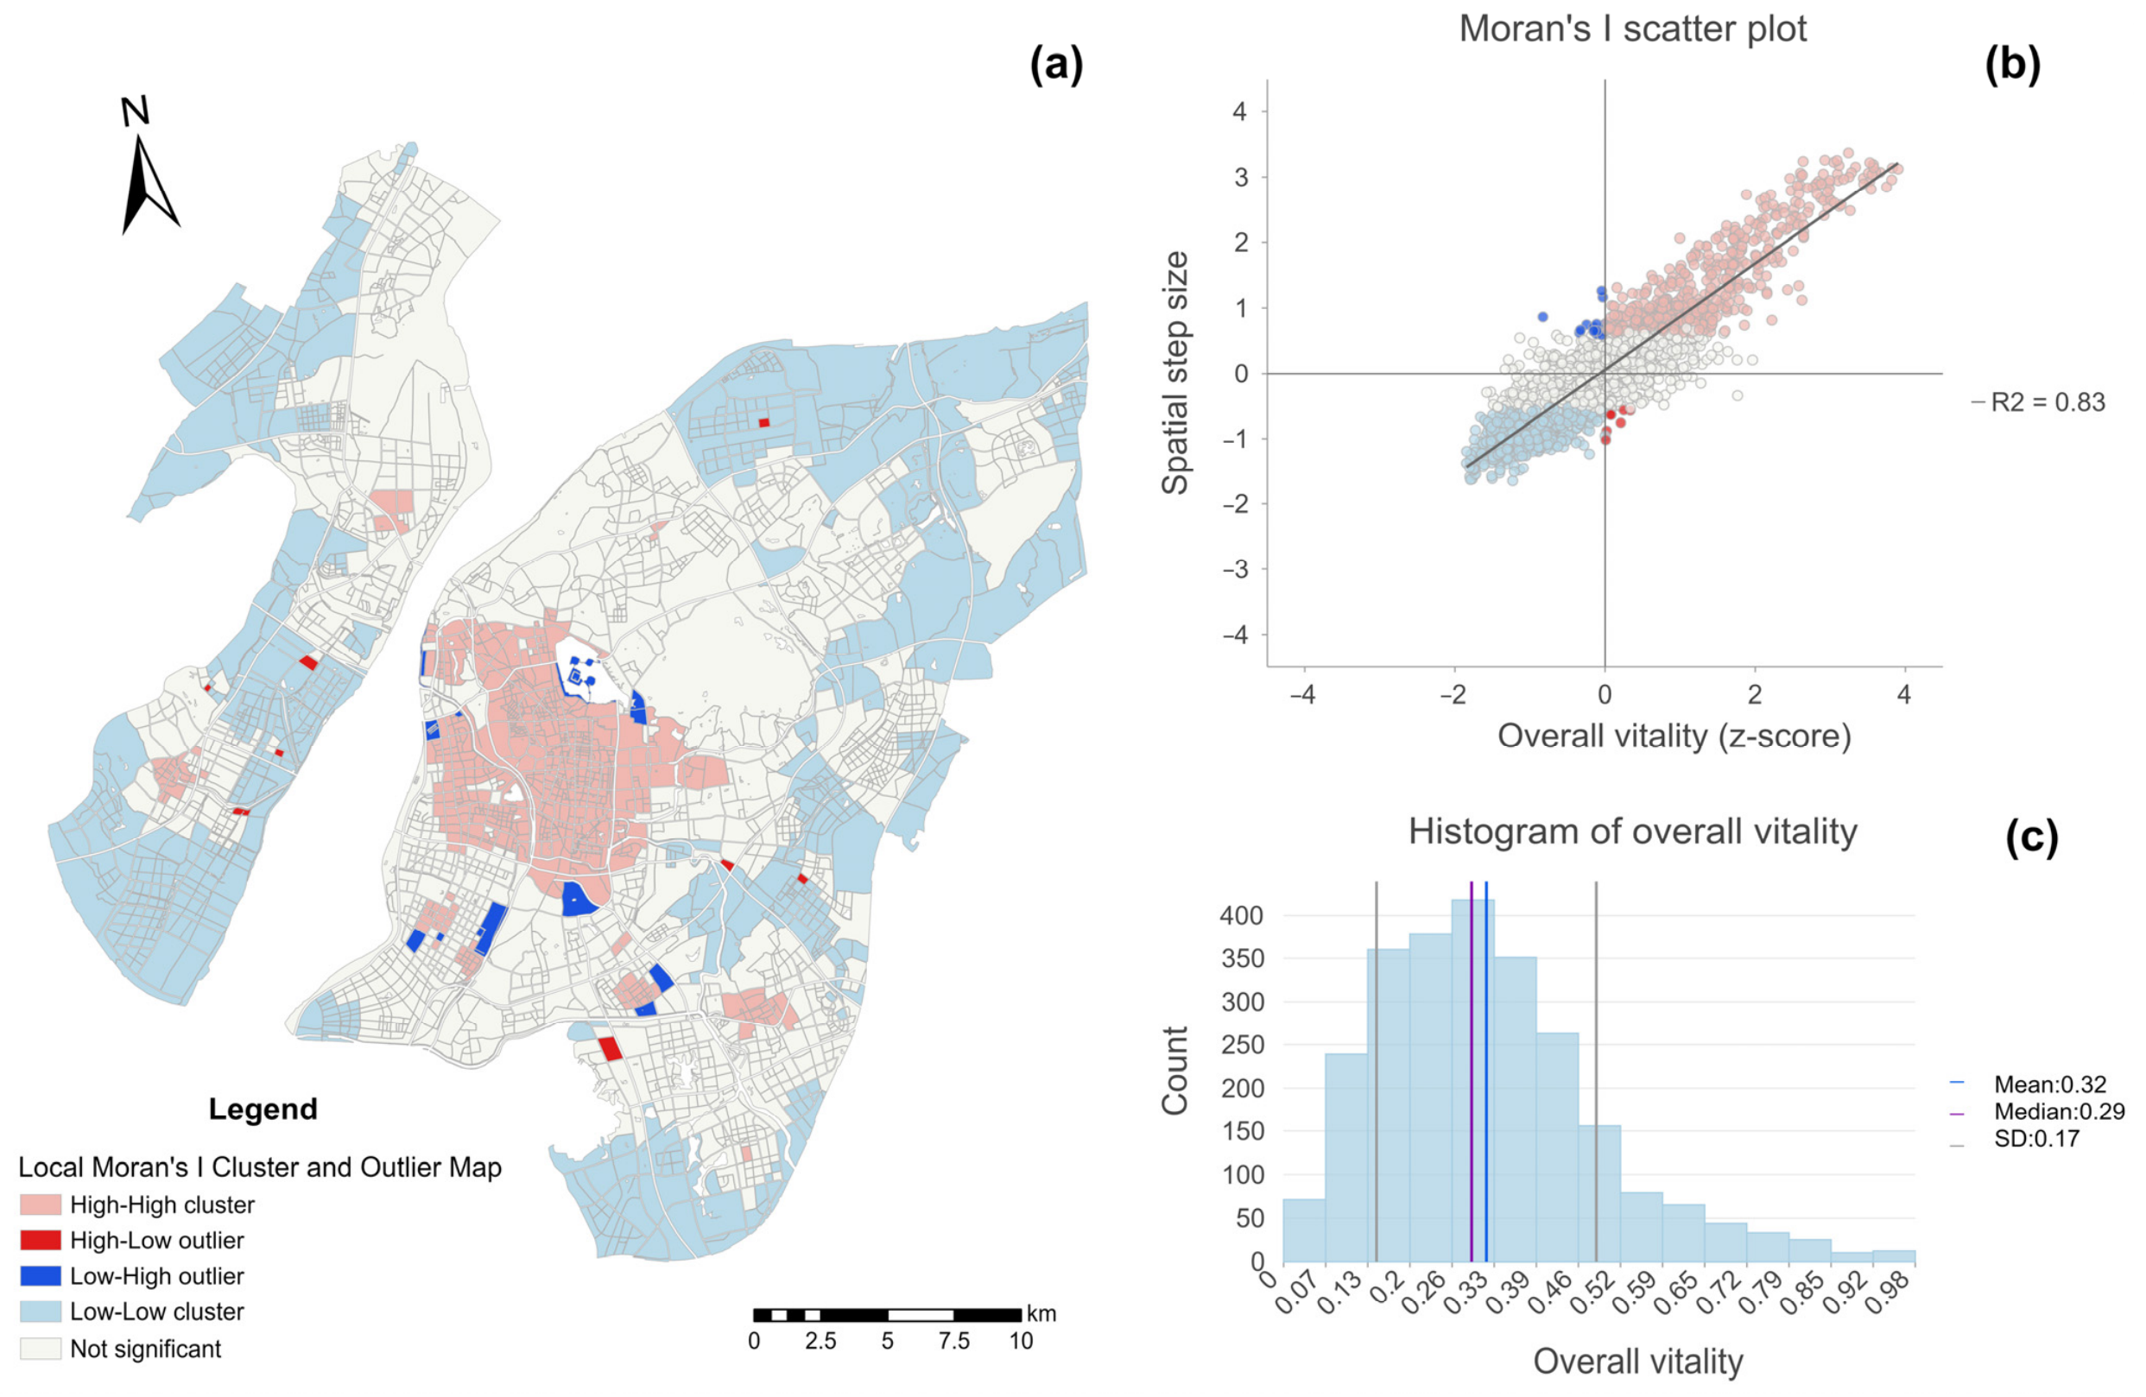
Global spatial autocorrelation analysis further verified the clustering characteristics of the spatial distribution of comprehensive vitality. The Global Moran’s I of comprehensive vitality in Nanjing’s central urban area was 0.8089, with a z-value of 85.45, passing the significance test. This indicates that comprehensive vitality was not randomly distributed but showed significant positive spatial autocorrelation; that is, high-value units tended to be adjacent to high-value units, and low-value units tended to be adjacent to low-value units. In the Moran’s I scatter plot, most points fell in the first and third quadrants, further indicating that high–high and low–low clustering were the main forms of the spatial distribution of comprehensive vitality.
The local spatial autocorrelation results further revealed the spatial clustering structure of comprehensive vitality (
Figure 8). High–high (HH) clusters were mainly distributed in areas such as the Xinjiekou Business District, Confucius Temple Pedestrian Street, Hunan Road–Zhongyang Road Business District, Longjiang Business District, and the Nanjing Olympic Sports Center, indicating clear spatial continuity among high-vitality blocks. Low–low (LL) clusters were mainly distributed along the outer periphery of the central urban area, reflecting the contiguous clustering of low-vitality blocks. In addition, low–high (LH) outliers were scattered within or along the edges of core high-vitality areas, while high–low (HL) outliers mainly appeared as local nodes within peripheral low-vitality backgrounds. This indicates that some blocks showed relatively prominent vitality differences compared with their surrounding areas.
3.4. Spatial Differentiation of Coupling Coordination Degree
Based on the measurements of economic, social, and cultural vitality, this study performed skewness preprocessing and normalization on the three vitality indicators and then calculated the block-level coupling coordination degree
. The blocks were subsequently classified into six categories according to the classification criteria described in
Section 2.4.4 (
Table 6). The spatial distribution of the coupling coordination degree is shown in
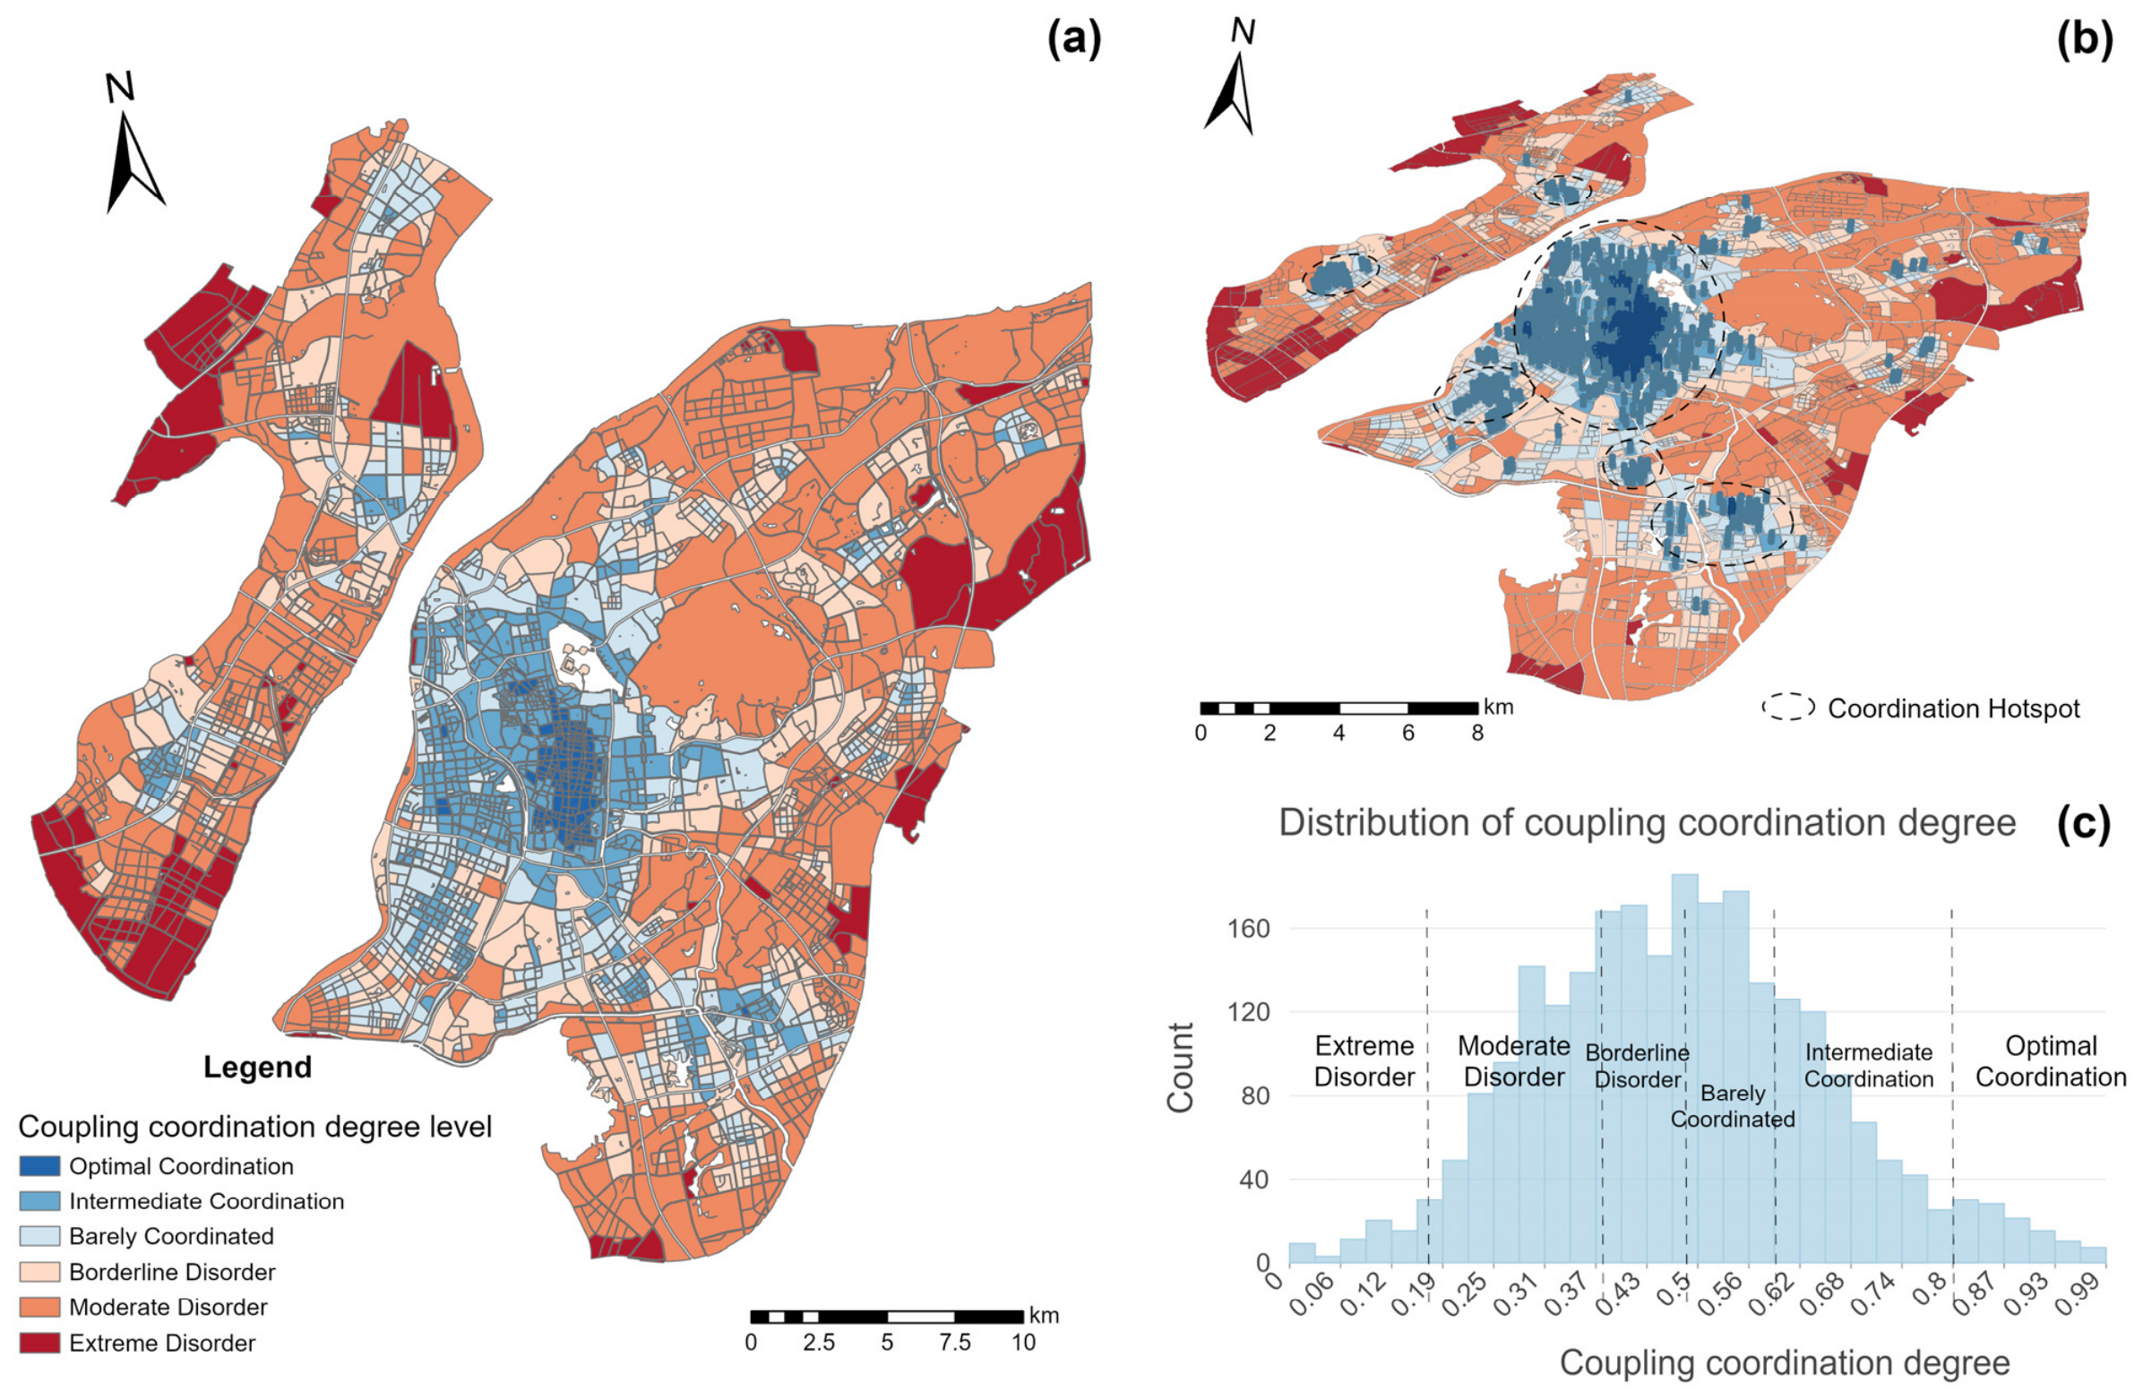
Figure 9a. Overall, the coupling coordination degree in Nanjing’s central urban area exhibits a spatial pattern of gradual decline from the old city core toward the periphery. The core area shows a relatively high level of coordination, whereas the coordination level of peripheral and edge blocks decreases markedly.
In terms of the classification distribution, optimal coordination units are mainly concentrated in the Xinjiekou Business District, Confucius Temple Pedestrian Street, Hunan Road–Zhongyang Road Business District, Longjiang Business District, and the area around the Nanjing Olympic Sports Center. Intermediate coordination units are mostly distributed around the periphery of optimal coordination areas and form localized patches in areas such as Nanjing South Railway Station, the Baijiahu Business District, Jiangning Wanda Plaza, the Xianlin Business District, the Qiaobei Business District, and the Jiangbei Business District. Units classified as borderline disorder, moderate disorder, and extreme disorder are mainly distributed in newly developed areas and peripheral blocks of the central urban area. The 3D spatial visualization results in
Figure 9b further show that high-coordination areas are mainly centered around the old city core, with secondary hotspots forming at some peripheral commercial and transportation nodes.
To further examine the spatial dependence characteristics of the coupling coordination degree, this study conducted global spatial autocorrelation analysis on the coupling coordination degree
and compared it with the Global Moran’s I results of the comprehensive vitality index (
Table 7). The results show that the Moran’s I of the comprehensive vitality index was 0.8089, with a z-value of 85.45, while the Moran’s I of the coupling coordination degree
was 0.8372, with a z-value of 88.42. Both passed the significance test, indicating that the comprehensive vitality level and multidimensional coordination state of Nanjing’s central urban area exhibit significant positive spatial autocorrelation. The Moran’s I of the coupling coordination degree
was slightly higher than that of the comprehensive vitality index, indicating that the multidimensional vitality coordination state has stronger spatial continuity and neighborhood dependence.
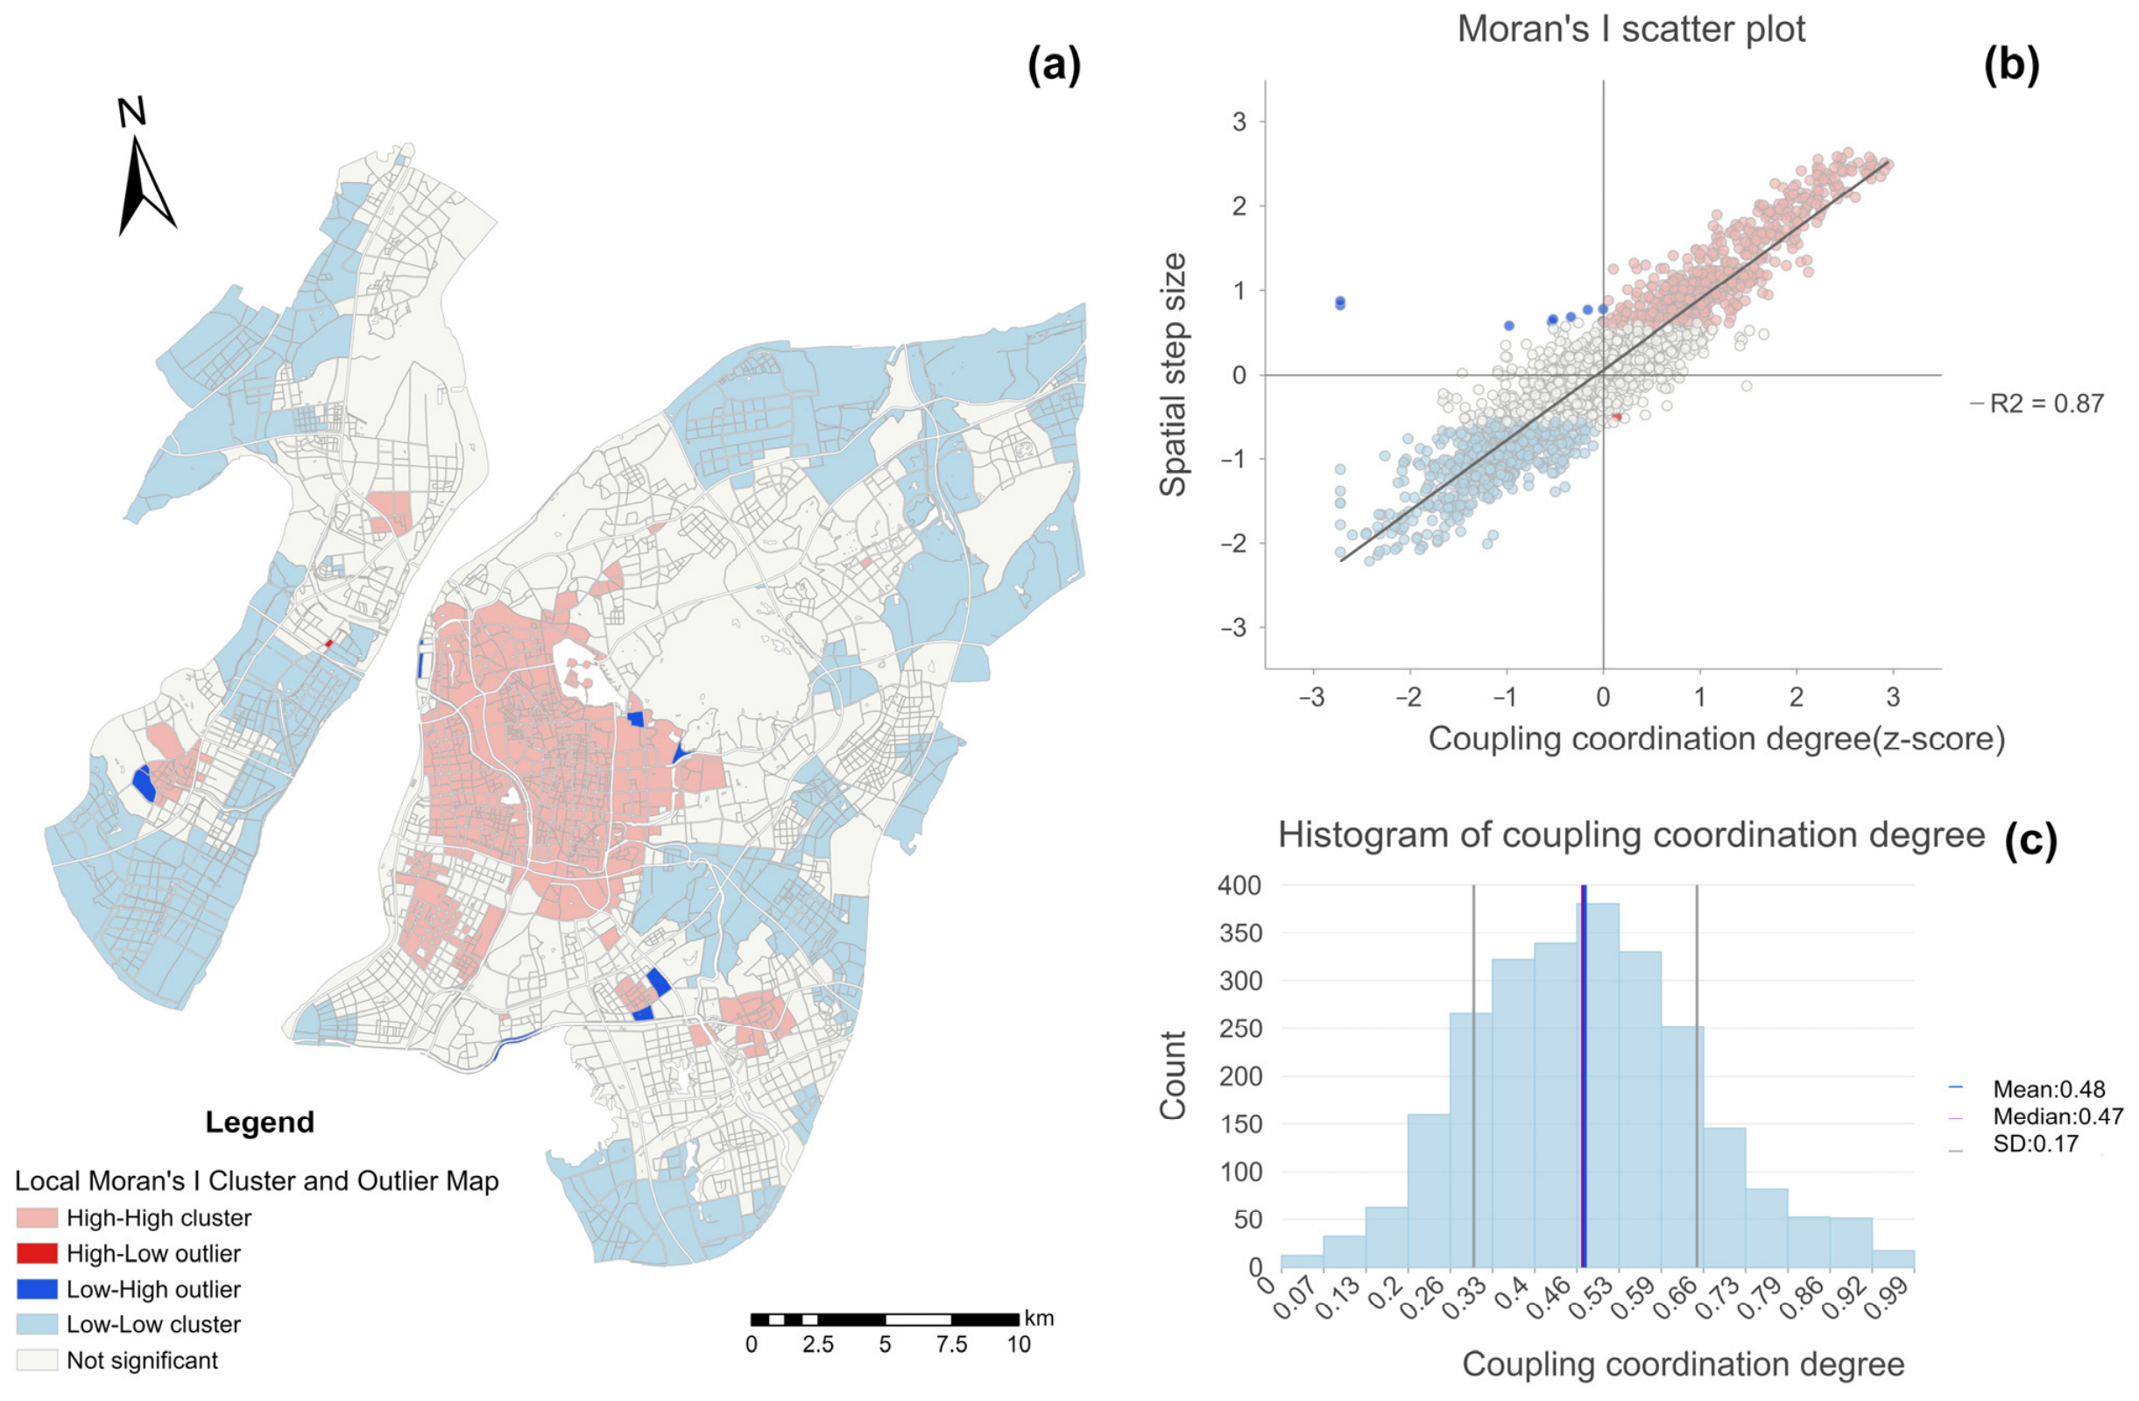
The LISA clustering results of the coupling coordination degree are shown in
Figure 10. High–high (HH) clusters mainly correspond to the old city core and its surrounding mature areas, indicating clear spatial continuity among high-coordination blocks. Low–low (LL) clusters are widely distributed in peripheral blocks in Jiangning, Pukou, and Qixia, suggesting that low-coordination states do not occur in isolation but rather show contiguous spatial clustering. The Moran’s I scatter plot further shows a clear positive correlation between the standardized values of coupling coordination degree and their spatial lag values, consistent with the Global Moran’s I results. The histogram shows that the coupling coordination degree is mainly concentrated in the medium-level range, with a mean of 0.48, a median of 0.47, and a standard deviation of 0.17, indicating that most blocks are in a transitional stage from disorder to coordination.
3.5. Identification of Dominant Disorder Factors
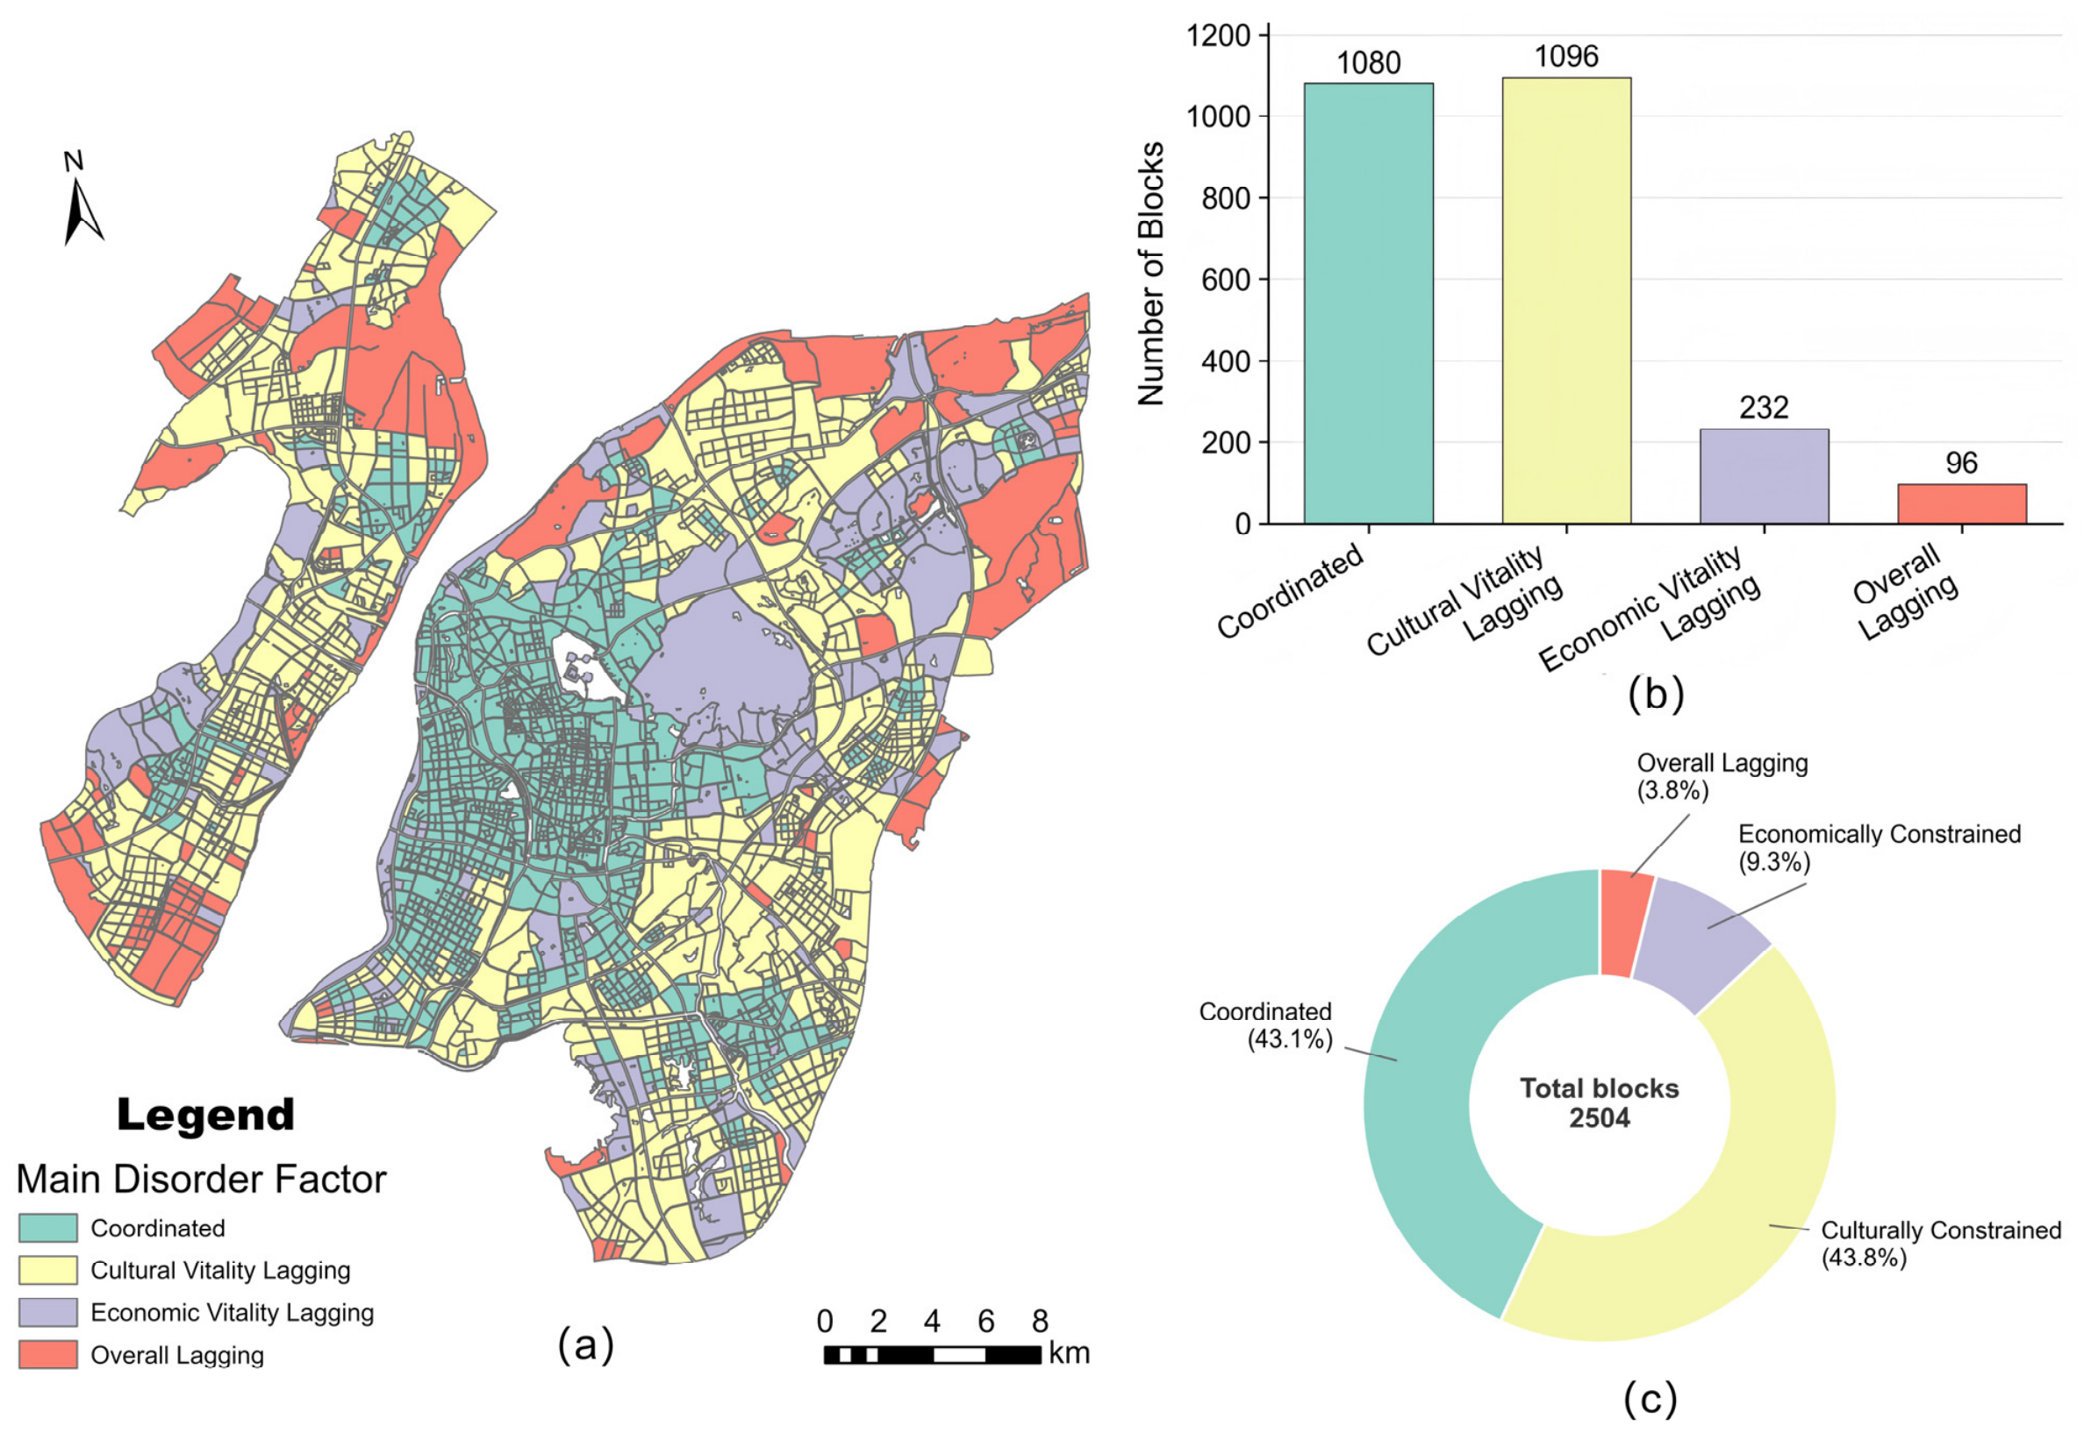
To further explain the formation of low coupling coordination degree areas, this study identified the dominant disorder factors based on the relative shortcomings of economic, social, and cultural vitality. The results show that the disorder types in Nanjing’s central urban area exhibit clear quantitative differences and spatial differentiation (
Figure 11). In terms of quantity, Cultural Vitality Lagging blocks were the most numerous, totaling 1096 blocks and accounting for 43.8%, making this the dominant disorder type. Coordinated blocks totaled 1080, accounting for 43.1%, and were mainly distributed in the old city core and its surrounding mature areas. Economic Vitality Lagging blocks totaled 232, accounting for 9.3%, and were mostly distributed around scenic areas, university campuses, and large ecological spaces. Overall Lagging blocks totaled 96, accounting for 3.8%, and were mainly located in peripheral edge areas with relatively low development intensity and insufficient functional mix. No Social Vitality Lagging blocks were identified. These results indicate that most blocks in Nanjing’s central urban area have a certain coordination foundation, and social vitality is generally relatively balanced and does not constitute a major constraint. In contrast, cultural vitality lagging is the main factor affecting the coupling coordination of multidimensional vitality, while economic vitality lagging and overall lagging show stronger spatial type differences.
From the perspective of spatial distribution, Cultural Vitality Lagging blocks are widely distributed, mainly appearing in peripheral new towns, newly developed residential areas, and some blocks with relatively insufficient cultural facility supply. These areas usually have a certain foundation of social or economic vitality, but their cultural facility density, cultural resource influence, or cultural activity spaces are relatively insufficient, resulting in a cultural dimension shortcoming in the coupling coordination of multidimensional vitality.
Economic Vitality Lagging blocks are mostly distributed around scenic areas, university campuses, and large ecological spaces, such as the Zhongshan Scenic Area, Yuhuatai, the western country park of the Jiangbei New Main City, Xianlin University Town, and some university areas in Jiangning and Pukou. These spaces often have relatively high cultural, educational, or ecological value, but their commercial and business activities, consumption activities, and nighttime light intensity are relatively weak. Therefore, they show deficiencies in the economic vitality dimension represented by the corrected nighttime light index. It should be noted that Economic Vitality Lagging does not necessarily indicate a low level of development, but rather reflects the difference between the dominant functional attributes of these areas and their economic activity intensity.
Overall Lagging blocks are characterized by relatively low levels of economic, social, and cultural vitality at the same time. Spatially, they are mostly distributed in peripheral areas of the central urban area with relatively low development intensity, insufficient functional mix, or weak public service provision. Unlike single-dimension lagging blocks, Overall Lagging blocks lack a prominent advantageous dimension to support the other dimensions, and therefore appear as low-level multidimensional disorder in the coupling coordination degree evaluation.
4. Discussion
4.1. Improvements in Block Vitality Measurement Using Multi-Source Geospatial Big Data
Urban vitality is characterized by significant multidimensionality and spatial heterogeneity, making it difficult for a single data source to fully capture its complex nature. Existing studies have demonstrated the effectiveness of nighttime light data, population heat data, and POI data in measuring urban vitality [
6,
7,
12,
13,
14,
15,
16,
17,
18]. However, these datasets focus on economic activity, human activity, and facility provision, respectively, and using them in isolation may lead to evaluation bias. This study integrates VIIRS nighttime light data, Baidu Huiyan population heat data, and POI data into a unified block-scale framework, enabling the simultaneous characterization of economic agglomeration, human activity, and cultural resource distribution, thereby enhancing the comprehensiveness of the spatial representation of urban vitality.
Compared with existing representative studies that focus on multi-source data overlay or comprehensive vitality evaluation, this study further combines multidimensional vitality measurement with disorder diagnosis. Traditional single-indicator evaluation or comprehensive index methods can intuitively identify high and low levels of vitality, but they have difficulty revealing the matching relationships among different vitality dimensions and identifying the specific sources of constraints in low-vitality or low-coordination blocks [
4,
5]. Existing urban vitality studies have mostly focused on comprehensive vitality levels, the influencing factors of the built environment, or the identification of spatial vitality patterns [
17,
18,
19], while relatively insufficient attention has been paid to whether economic, social, and cultural vitality are coordinated and which dimensions mainly constrain low-coordination blocks. On the basis of constructing indicators for economic vitality, human activity, and cultural resource supply, this study further introduces coupling coordination degree, spatial autocorrelation, and dominant disorder factor identification [
22,
23,
24,
25,
26,
27,
28]. Therefore, the evaluation results can not only answer “which blocks have higher or lower vitality,” but also further explain “which blocks exhibit uncoordinated multidimensional vitality” and “which vitality dimension constitutes their main shortcoming.”
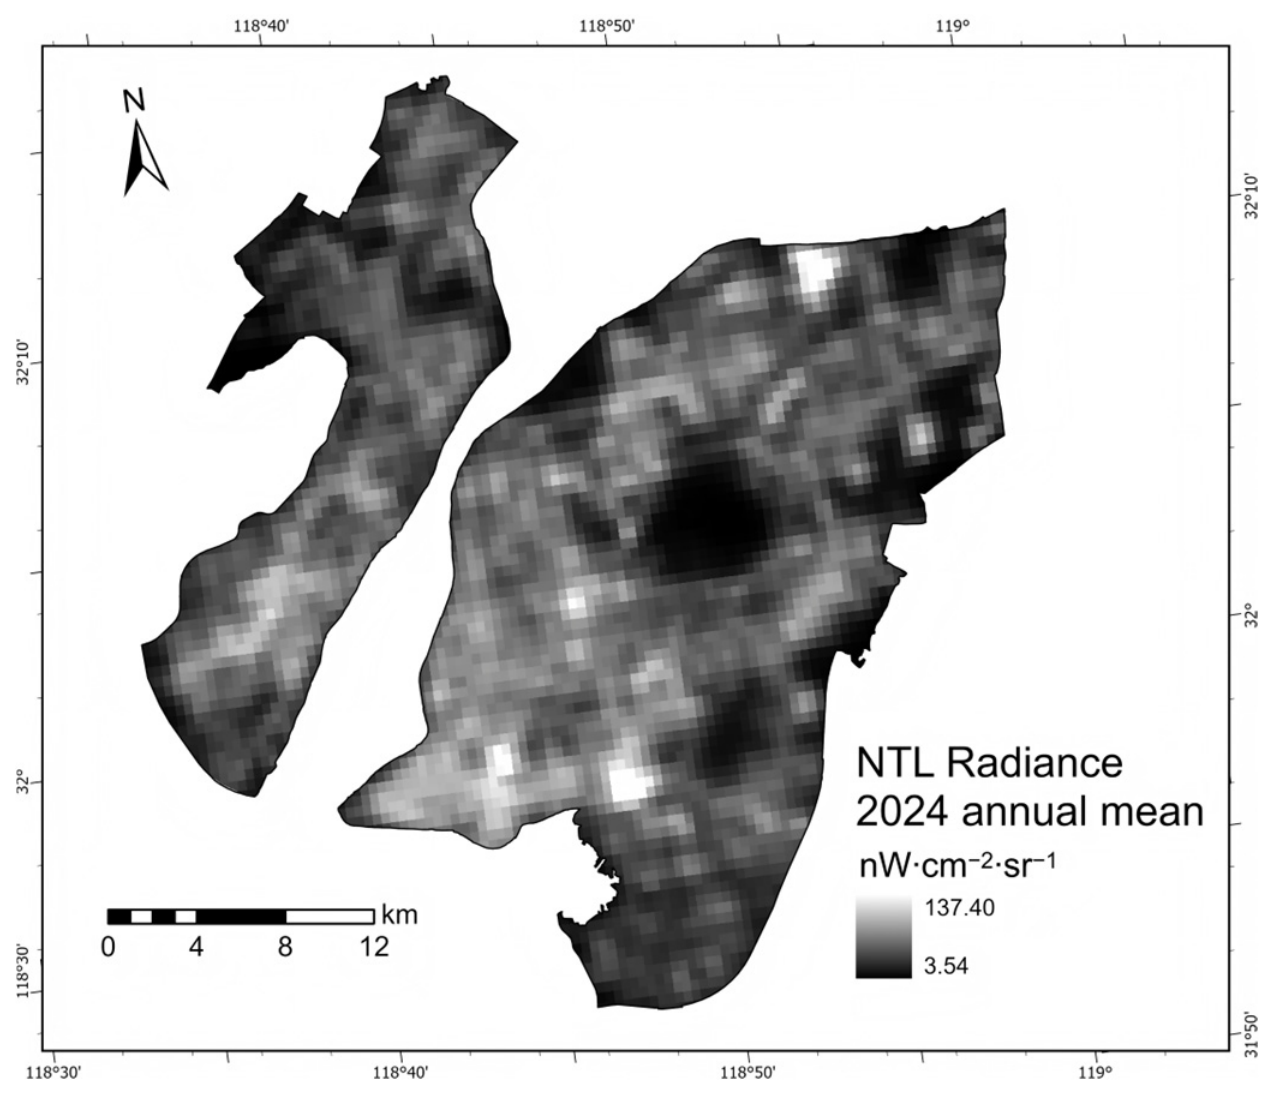
Specifically, the introduction of the Composite Nighttime Light Index (CNLI) helps mitigate the light spillover problems that may occur in VIIRS nighttime light data at the edges of built-up areas, along roads, and around large open spaces [
8,
9,
10]. Compared with the direct use of nighttime light radiance, incorporating the kernel density of economy-related POIs into the correction process allows the assessment of economic vitality to better reflect the spatial clustering characteristics of actual industrial, consumption, and business activities. Meanwhile, POI data provide important support for urban function identification and facility supply measurement [
15,
16]. By incorporating cultural POIs, including science, education, and cultural services and scenic spots, into the measurement of cultural vitality, this study adds the dimension of cultural resource supply beyond economic activity and human activity, which helps comprehensively identify spatial differences in urban vitality from economic, social, and cultural perspectives.
Therefore, the main methodological contribution of this study lies in integrating multi-source geospatial data, dimension-specific vitality measurement, and spatial diagnostic methods into the same block-scale framework. The value of this framework is mainly reflected in two aspects. First, it can distinguish different types of observable vitality, including economic activity, human activity, and cultural resource supply. Second, it can further identify the relative shortcoming dimensions of low-coordination blocks, thereby shifting urban vitality assessment from a description of overall levels toward a spatial diagnosis with stronger planning interpretability.
4.2. Spatial Coupling Mechanism of Multidimensional Vitality
The results show that both comprehensive vitality and coupling coordination degree in Nanjing’s central urban area exhibit significant characteristics of core agglomeration and peripheral decline. This pattern is closely related to Nanjing’s long-established urban functional organization and the spatial structure of the central urban area, where old and new urban areas coexist [
30]. The old city core has long served multiple functions, including commercial and business activities, historical and cultural heritage, public services, and transportation interchange. With a high degree of functional mix, dense human activity, and accumulated cultural resources, the old city core supports strong interactions among economic, social, and cultural vitality. This is generally consistent with urban vitality theory, which emphasizes that functional mix, human activity, and spatial diversity jointly shape urban vitality [
1,
2,
3].
From the perspective of socio-spatial processes, the vitality pattern of Nanjing’s central urban area is not determined solely by the number of facilities or the intensity of population agglomeration. Instead, it is jointly shaped by historically formed functional mix, spatial morphology, public service provision, and daily activity networks. The relatively high multidimensional coordination level of the old city core indicates that long-accumulated commercial, cultural, transportation, and public service functions can promote mutual reinforcement among economic activity, human interaction, and cultural consumption. In contrast, the dimensional lag observed in peripheral new towns or functionally single areas suggests that increased urban development intensity does not necessarily translate synchronously into multidimensional urban vitality. The formation of cultural resources, neighborhood living atmosphere, and spaces for social interaction usually requires a longer time period.
In contrast, although the Hexi CBD, Nanjing South Railway Station, and some peripheral new towns have formed localized high-value or moderately coordinated patches, their vitality structures differ from that of the old city core. Vitality enhancement in emerging functional areas often relies first on the development of business offices, transportation hubs, large residential areas, and commercial complexes, allowing economic or social vitality to improve relatively quickly. However, the accumulation of cultural resources, the formation of everyday living atmosphere, and the establishment of public cultural service networks usually require a longer period. As a result, some new town areas still show a certain lag in multidimensional vitality coordination. This indicates that the vitality improvement of peripheral new towns depends not only on development intensity, but also on the continuous improvement of public services, cultural facilities, and spaces for daily activities.
The identification of dominant disorder factors further shows that the causes of low coordination differ across spatial types. Blocks with lagging cultural vitality are the most numerous, indicating that, under rapid urban expansion, road, residential, and industrial space construction in some peripheral new towns and newly developed residential areas has progressed faster than the provision of cultural facilities and public cultural spaces. As a result, insufficient cultural resources have become an important factor constraining the coordinated improvement of multidimensional vitality. Blocks with lagging economic vitality are mostly found around scenic areas, universities, and large ecological spaces. These areas usually have high cultural, educational, or ecological value, but relatively weak commercial and business activities and nighttime light intensity. Therefore, “lagging economic vitality” should not be simply interpreted as underdevelopment, but should be understood in relation to their dominant functional attributes. Overall lagging blocks mainly reflect simultaneously low levels of economic, social, and cultural vitality, indicating that these areas lack an advantageous dimension to support their overall coordination level.
Therefore, the coordinated improvement of multidimensional vitality in Nanjing’s central urban area should not pursue homogeneous development across all areas. Instead, it should be understood in a differentiated manner according to the dominant functions, vitality structures, and shortcoming dimensions of different spatial types. The high coordination of the old city core mainly derives from long-accumulated mixed functions and cultural resources. The improvement of coordination in emerging functional areas is affected by the supply of cultural facilities and the formation cycle of neighborhood living atmosphere, whereas the lag in economic vitality around scenic areas, universities, and ecological spaces more reflects differences in functional attributes. Compared with existing urban vitality studies in China and internationally, the core agglomeration, peripheral decline, and multi-node diffusion characteristics observed in Nanjing’s central urban area show certain commonalities: high-vitality spaces are usually closely associated with functional mix, transport accessibility, human activity density, and public service agglomeration [
6,
7,
12,
13,
14,
15,
16,
17,
18]. However, as a historic and cultural city, the highly coordinated vitality of Nanjing’s old city core is supported not only by commercial and transportation activities, but also by historical and cultural resources, cultural tourism consumption, and long-established neighborhood life networks. This mechanism indicates that cultural resources are not merely an auxiliary dimension of urban vitality, but may constitute an important structural factor influencing the coordination status of multidimensional vitality in historic and cultural cities.
4.3. Planning Implications of Spatial Autocorrelation and Disorder Diagnosis
The Global Moran’s I results indicate that both comprehensive vitality and coupling coordination degree in Nanjing’s central urban area exhibit significant positive spatial autocorrelation, while LISA analysis further reveals local clustering patterns and spatial heterogeneity [
23,
24]. This implies that urban vitality is not distributed in isolation within individual blocks, but forms continuous spatial clustering zones through functional, transportation, and human activity linkages between adjacent blocks. Therefore, urban renewal and spatial governance should shift from piecemeal interventions in individual low-value blocks to area-scale identification of high-vitality contiguous zones, low-vitality contiguous zones, and low-value breakpoints within core areas. For example, old city core areas such as Xinjiekou–Confucius Temple–Hunan Road–Zhongyang Road–Longjiang can be treated as high-vitality contiguous zones for integrated quality improvement, whereas peripheral new towns and contiguous low-value areas at the urban edge are more suitable as priority areas for strengthening public services, transport accessibility, and everyday activity spaces.
For high–high clusters, attention should be paid to excessive functional concentration, tourist pressure, and spatial carrying capacity. While maintaining the advantages of commerce, culture, and public services, these areas should further improve pedestrian environments, public space quality, and historical and cultural preservation to avoid the decline of spatial quality caused by overdevelopment or excessive commercialization. For low–low clusters, priority should be given to improving public services, community activity spaces, public cultural facilities, public transport accessibility, and functional mix, so as to prevent peripheral areas from remaining locked in a long-term low-vitality state.
For spatial outliers, differentiated assessments should be made according to land use attributes. Low–high outliers in ecological green spaces, scenic areas, or cultural heritage protection areas should focus on ecological services, cultural preservation, and public accessibility rather than high-intensity commercial development. If such areas are awaiting functional renewal, their connections with surrounding high-vitality areas can be strengthened through public space renovation, mixed-use function introduction, and block interface optimization. High–low outliers usually represent local vitality nodes within low-vitality peripheral backgrounds and can serve as entry points for improving surrounding functions and public services.
From the perspective of dominant disorder factors, areas with lagging cultural vitality should be subject to differentiated interventions according to their specific spatial types. For peripheral new towns and newly developed residential areas, lagging cultural vitality more directly indicates insufficient provision of everyday public cultural services, open spaces, and community activity venues. Therefore, priority should be given to supplementing cultural service facilities and everyday activity spaces. However, this does not mean that all blocks need to reach the same level of cultural vitality as the old city core. For areas with lagging economic vitality around scenic spots, universities, and ecological spaces, high-intensity commercial development should not be regarded as a simple improvement path. Instead, low-impact, high-quality, service-oriented commercial and public service facilities should be provided in accordance with their dominant ecological, educational, or cultural functions. For comprehensively lagging areas, systematic reinforcement is needed in terms of transport accessibility, public services, industrial functions, and cultural facilities, so as to enhance the mutual support among different dimensions of vitality.
4.4. Limitations and Future Research Directions
This study still has several limitations. In terms of data sources, nighttime light data, POI data, and Baidu heat map data are used as proxy indicators for different dimensions of observable urban vitality, and their interpretation is affected by temporal representativeness and data uncertainty. First, Baidu heat map data reflect relative human activity based on location-based services [
12,
13,
14]. Although these data have high spatiotemporal resolution, they cannot be fully equated with actual population counts and may be influenced by the platform’s user structure and sampling mechanisms. In addition, the Baidu Huiyan population heat data used for social vitality measurement in this study covered only two sample days. Although typical dates without statutory holidays or obvious extreme weather effects were selected, the two-day sample still cannot fully represent changes in human activity under annual, seasonal, and special-event conditions [
45]. Therefore, the social vitality results in this study are mainly used to explain the relative spatial pattern of human activity among blocks under typical-date conditions, rather than the long-term average level of population vitality. The absence of blocks with lagging social vitality may also be related to the spatial smoothing effects caused by the grid-based aggregation and kernel density processing of Baidu heat data. Second, POI data may contain classification errors, update delays, and differences in platform coverage [
15,
16]. Although the service-level weighting of cultural facilities improves upon simple density-based methods, the weight settings remain somewhat empirical. Third, although VIIRS nighttime light data were corrected using POI information [
8,
9,
10], a scale mismatch still exists between their spatial resolution and the block scale, limiting their ability to identify small-scale economic activities. In addition, different data sources still vary in completeness and timeliness. For example, because multi-source data differ in platform update frequency and acquisition mechanisms, local delays or omissions may exist. The acquisition times of road network data, population heat data, nighttime light data, and POI data are also not completely consistent, which may introduce uncertainty related to temporal mismatch. Therefore, the results of this study are more suitable for explaining the relative spatial differentiation characteristics of observable urban vitality in Nanjing’s central urban area during the study period, rather than being interpreted as fully synchronized, real-time, or long-term stable representations of urban operation status.
At the methodological level, first, the coupling coordination degree model is essentially a descriptive comprehensive evaluation method based on normalized indicators. Its results may be affected by indicator selection, standardization methods, weight settings, and classification thresholds. This study used Min–Max normalization to transform economic, social, and cultural vitality into the [0, 1] interval to meet the model’s requirement for non-negative input values. However, this also means that the coupling coordination degree mainly reflects relative differences among blocks within the study area and should not be interpreted as an absolute level of coordination. Meanwhile, the CCDM reveals the matching degree among multidimensional vitality indicators, but it cannot prove the existence of causal coupling relationships among economic, social, and cultural vitality.
In addition to the above limitations, this study primarily relies on cross-sectional data from 2024 and has not yet revealed the long-term evolution of urban vitality. It is also difficult to fully capture vitality fluctuations under different seasons, time periods, and special-event conditions. Future research could further incorporate multi-year nighttime light data, continuous population heat data, mobile phone signaling data, street-view imagery, land-use mix, road network accessibility, and building morphology to construct a more temporally explicit monitoring framework for urban vitality. At the same time, multivariate clustering, machine learning interpretation models, and cross-city comparisons could be combined to further examine the classification of vitality systems, influencing mechanisms, temporal evolution, and the transferability of the proposed method.
5. Conclusions
This study takes 2504 blocks in Nanjing’s central urban area as the basic analytical units. By integrating multi-source geospatial data, including VIIRS nighttime light data, Baidu heat map data, POIs, road networks, and water systems, this study constructs a three-dimensional urban vitality evaluation system encompassing economic, social, and cultural vitality. By combining principal component analysis (PCA), the coupling coordination degree model, and spatial autocorrelation analysis, this study identifies the spatial structure and coupling coordination status of multidimensional vitality in Nanjing’s central urban area. The main conclusions are as follows.
- (1)
Multidimensional vitality in Nanjing’s central urban area exhibits significant spatial heterogeneity. Economic vitality is mainly concentrated in commercial, business, and cultural tourism consumption hubs. Social vitality is relatively evenly distributed. Cultural vitality is more concentrated in areas with dense historical and cultural resources in the old city, while cultural vitality in peripheral blocks is generally weaker.
- (2)
Comprehensive vitality presents a distinct “core agglomeration–multi-node diffusion” spatial structure and shows significant positive spatial autocorrelation. The Global Moran’s I of comprehensive vitality is 0.8089. The LISA results indicate that the old city core and some mature functional areas form continuous high–high clusters, while peripheral edge areas form relatively distinct low–low clusters.
- (3)
The coupling coordination degree shows a spatial differentiation pattern that decreases from the core to the periphery. The Global Moran’s I of coupling coordination degree is 0.8372, indicating that the multidimensional vitality coordination state has strong spatial dependence. Optimal coordination units are mainly concentrated in the old city core and its surrounding mature areas, while peripheral new towns and edge blocks are mostly in a transitional stage from disorder to coordination.
- (4)
The identification of dominant disorder factors shows that cultural vitality lagging is the most prevalent disorder type in Nanjing’s central urban area. Peripheral new towns and newly developed residential areas are more likely to experience insufficient cultural resource supply; areas surrounding scenic spots, universities, and large ecological spaces mostly exhibit economic vitality lagging; and less-developed peripheral edge blocks mainly exhibit overall disorder. These results suggest that urban vitality optimization should adopt differentiated renewal strategies according to different spatial types.
Overall, the block-scale vitality measurement and coupling coordination diagnostic framework based on multi-source geospatial big data developed in this study can identify the spatial structure, clustering characteristics, and dominant disorder factors of urban vitality in a relatively refined manner. It provides quantitative evidence for the renewal of historic and cultural city cores, the improvement of functional shortcomings in peripheral new towns, and refined governance at the block scale.