Abstract
With advances in technological sciences, individuals can utilize low-cost air monitoring sensors to record air quality at homes, schools, and businesses. Air quality data collected from LCSs are publicly accessible, informing the community of the air quality around them. It is important to measure local and regional particulate matter (PM) concentrations to keep the public involved, especially those with specific health concerns, such as asthma, wheezing, and seasonal allergies. The number of studies involving the use of LCSs to evaluate PM levels is increasing with more manufacturers producing ‘easy to use’ LCSs targeting the public. The goal of this review is to understand and incorporate the findings from studies using LCSs to analyze PM of various sizes, i.e., PM1, PM2.5, PM4, and PM10. This review integrates analyses from 51 different studies in 14 countries, including the U.S. The findings indicate spatial heterogeneity in the PM concentrations across a region. Some of the low-cost sensor manufacturers mentioned in these studies include Plantower, AQMesh, Alpha-sense, PurpleAir, E-MOTEs, and Shinyei. This review emphasizes the importance of LCSs in the field of PM monitoring and its potential to inform the public about their exposure burden, and to aid state and federal decision makers in formulating policies for mitigating the effects of PM pollution in any urban or rural setting.
1. Introduction
Low-cost air quality sensors are manufactured to perform proper applications for ambient monitoring [1]. Low-cost sensors (LCSs) enable knowledge of the surrounding air by differentiating between good, moderate, and unhealthy air quality when visibility is impaired [2,3,4]. These consumer-grade sensors allow deployment in dense sensor networks, while improving the monitoring networks both spatially and temporally [2,3,4]. The capabilities of LCSs range according to the manufacturers’ purpose of application, either for personal exposure, ambient, or mobile monitoring [1,2]. The increasing demand for the use of LCSs for ambient air monitoring can be explained by the enhanced interest of researchers and the public in air quality [2].
Various studies showing different LCSs manufacturers with their own calibrations, performance durations, and metrics have been covered in this study. Different reference instruments and methods are used to verify the reliability and accuracy of LCSs [2,5]. By verifying acquired data, said researcher can defend their methods of deployed sensors. Extended measures include a pre/post-deployment calibration from co-located analyses with regulatory-grade monitors [2,5]. Co-location tests are advised when working with LCSs to develop precision and accuracy amongst the measurements during deployment [2,5]. Quantification of measurement error can be deduced with the co-location data to identify any potential degradation or drift from the sensor or sensors over time [2].
Model reproducibility highlights the ability of the device to adjust with different interferences [6]. Improvement of LCS reproducibility and accuracy can be proven with variable transformations, nonlinear calibration models, and training data selection [6]. Some of the many detection methods which the sensors use are metal oxide semiconductor (MOS), electrochemical cell (EC), nondispersive infrared (NDIR), and lighter scattering sensors [1,6]. The primary target pollutants of the light scattering sensors are particulate matter (PM). Optical scattering sensors measure the light (generally IR) refracted by particulate matter while coursing through an optical chamber [6]. Temperature, pressure, and relative humidity are factors that affect optical sensors [1,7,8]. The operating principle behind all low-cost PM sensors available for commercial use is light scattering [8]. Optical sensors include built-in sensors to measure relative humidity and temperature, and protective shells to encase the sensors [6]. The chance of damage from weather conditions is reduced, but they are still prone to extreme meteorological conditions. Therefore, quality control ensues with correction formulas and/or calibrations with the LCSs [9].
Conventionally, ensuring the accuracy of air monitoring results involves implementing quality assurance (QA) and quality control (QC) procedures to guarantee reliable performance and produce trustworthy results [4]. The U.S. Environmental Protection Agency (EPA) processes ambient air monitoring, with standards such as Federal Reference Methods (FRM) and Federal Equivalent Method (FEM), to assure compliance and reliability [4,9]. FRM and FEM sites follow the QA/QC standards, so they are most commonly used as reference instruments to test LCSs standards [4]. FEM instruments use optical, beta attenuation monitors (BAM) and tapered element oscillation (TEOM) for PM2.5 concentration measurements [4,10]. BAM is not strongly influenced by relative humidity since the monitors contain a heated sampler inlet that reduces the moisture deposition in the system [11]. Air quality monitoring stations (AQMSs) abide by these implements of FRM and/or FEM to measure PM2.5 concentrations under the EPA [9,11,12]. AQMS are equipped for exposure assessments but are limited to more secluded locations away from human interactions, ultimately hindering the spatial coverage and adequacy [9,13].
In the Air Quality Sensor Performance Evaluation Center (AQ-SPEC), LCSs are tested for their power, connectivity, and mobility and are evaluated in field testing protocols [2,14]. This study includes some of the listed manufacturers AQ-SPEC has tested on: AQMesh, Alphasense, PurpleAir, Shinyei, Dylos Co., TSI, Hanvon, Kaiterra, HabitatMap, SainSmart, IQAir AirVisual, uHoo, Aeroqual, Met One, Foobot, and AirThinx [14]. The evaluations and studies carried out under AQ-SPEC take place both in laboratory and real-world settings, with the aim of providing the public with comprehensive assessments of the LCSs [14,15].
Commercial particulate matter monitors may have acceptable performance abilities but are not convenient in cost or size [6]. Researchers are deploying new methods and technology with various LCSs, while facilitating new means to improve PM spatiotemporal characterization [13]. The qualities which make LCSs conducting air pollution-related studies easier are their flexibility, affordable price, and convenient size [1,5,15]. Such monitors grant real-time data without the hindrance of physically visiting the located site. Data is acquired by network transmission or an SD card. The LCSs are set to be pre-calibrated by the manufacturer, but additional testing against reference instruments is advised for precision and accuracy [15]. Thus, calibrations to those of FRM and/or FEM instruments are encouraged [4,9]. Introducing different meteorological conditions in a short period of time can affect LCSs’ long-term stability and robustness [16]. The performance of the sensors was better in controlled laboratory conditions, in contrast to real-world field conditions, due to variations in pollutant composition and concentrations, as well as different meteorological conditions [16]. Field performance was observed to be better in winter months compared to the summer [16], due to the higher concentrations of pollution during winter, which allowed the sensors to perform better. On the other hand, testing the monitor at multiple locations will only further expose the instrument to different pollutant types in ambient conditions [4,10]. Calibrating devices at different locations can improve the ability to distinguish between sites by providing a more accurate air quality measurement at each location. By calibrating devices at various sites, differences in the readings between the sites can be attributed to actual variations in air quality, rather than instrument defects or performance and measurement inaccuracies. This increased accuracy in measurement can lead to a more robust understanding of air quality across different sampled sites. Calibration at different sites, therefore, allows for necessary adjustments to be incorporated in the data analyses, further improving the accuracy of the results. Prior testing of LCSs will be best tested in the field under actual field conditions, rather than in a controlled setting to accelerate the sensor’s “drift to harsher conditions in the field” [16].
Providing insight and awareness of ambient air quality levels to the public is very important and can be achieved by increasing the number of studies involving LCSs [8]. LCSs present high-resolution temporal and spatial indoor and/or outdoor data [1,8,9,17,18,19,20]. There is potential for multiple studies to stem from the convenience of LCS, granting more opportunities and growth in air quality research [5].
1.1. Particulate Matter Sources
Particulate matter is liquid and solid particles in the air and can be classified as primary or secondary [21]. Primary PM is released right into the atmosphere, whereas secondary PM is the product of chemical reactions in the atmosphere [22]. Chemical constituents of particulate matter primarily consist of inorganic ions that can be expanded further with organic and elemental carbon, metals, and particle-bound water [23]. Organics from VOCs, sulfates, and nitrates are all examples of secondary PM [22]. Common anthropogenic sources are highly variable, including biomass and fuel combustion [23]. The majority of PM stems from fuel combustion derived from vehicular and traffic emissions; therefore, PM levels and traffic emissions are heavily correlated [22]. Similarly, industrialized urban areas with fossil fuel combustions are commonly found with higher levels of PM [22]. Urban air quality is generally affected by traffic-related emissions and indirectly affected by photochemical reactions [24]. Urban air pollution gradients are correlated with the increase in human population and traffic emissions [24]. Urban areas consist of intersections, busy streets, and high buildings, resulting in poor ventilation buildup of primary air pollutants. Therefore, the spatial variability and exposure to primary PM is high in urban areas, whereas secondary pollutants are regional in scale and driven by meteorology [24].
1.2. Particulate Matter Classification
Particulate matter is categorized by size, or the aerodynamic equivalent diameter (AED), to determine the transportability in the atmosphere and the ability to be inhaled through the respiratory tract [23]. Fine particulate matter (PM2.5) has an AED of 2.5 μm and can travel 100–1000 km [21,23]. Common sources for PM2.5 draw from the transformation of NOx, SO2, and organics, as well as the combustion of oil, coal, and gasoline. Coarse particulate matter (PM10) has an AED of 10μm and can travel 1–10 km [21,22,23]. While, during dust storms, medium-sized particles (16–31 μm) can travel up to 1600 km, the smallest dust particles of size less than 16 μm have the ability to spread globally [25]. PM10 is composed of the suspension and resuspension of soils and industrial dust [22]. The distribution of particulates depends on the amount and size (or mass) of the particles. The classification of particles from the number distribution would depend on the count of particles, whereas the mass distribution relies on the mass of the particles at each size [22]. Particulate matter in urban environments tends to mostly distribute fine aerosols [22].
1.3. Human Health Concerns
Indoor activities (i.e., cooking, heating with natural gas, and the use of office equipment) can generate a number of PM concentrated particles [20,23,26]. Most of someone’s day (80–90%) is spent indoors, exposing them to indoor generated PM and ambient infiltrated PM [26]. Finer particles suspend in the air for longer periods of time, weeks, or months, due to their size [23]. Thus, finer particles between 1 μm and 5 μm are able to be inhaled deeper and deposit themselves further into the respiratory system, likely in the respiratory bronchioles and alveoli [23]. Larger aerodynamic diameters between 5 μm and 10 μm can be filtered easier and thus, are settled in the upper throat, trachea, or bronchi [23]. Due to the collection of particulates in the respiratory system, the body counter reacts with coughing and sneezing [21,23]. Particulate matter has proven to have several adverse health effects, due to both chronic and acute exposures. Significant health problems occurring after acute exposure will increase visits to the hospital, with a risk of cardiovascular and/or respiratory diseases, respiratory symptoms, premature mortality, heart attacks, and lung inflammation [22,23,26]. Chronic exposures to particulate matter result in a decrease in lung function, stunt lung growth, development of asthma, and overall damage to the lungs [22]. Finer particles have a stronger correlation with short-term exposures and hospital visits for respiratory disease. On the other hand, coarse particles have a weaker correlation with short-term exposures and hospital visits for respiratory disease [22,26].
2. Materials and Methods
Recent studies have used a variety of LCSs to analyze data of PM levels to monitor pollutant exposures, indoors and outdoors. More precisely, this review focuses on LCSs’ performance while collecting PM real-time data/non-real-time data. Such literature will be analyzed and noted.
2.1. Study Section Criteria
This review considered articles published after January 2000 till the present year, 2022. As the use of LCSs is increasing with time, the majority of the studies are after the year 2015 [27]. All studies involving characterizing, assessing, and analyzing particulate matter with LCSs were included in the search. Indoor and outdoor studies from different parts of the world were included to compare the low-cost sensor manufacturers. Literature measuring other aerosol species was not included. The focus is only on particulate matter. Literature evaluating and comparing different LCSs was also included in the review [26,28,29]. The search did find a review evaluating LCSs against reference measurements [30]. Another review study focused on the research of low-cost PM sensors in southeast Asian countries [5].
2.2. Search Methods
A complete search of all literature was centered on multiple key terms, similar to low-cost sensors (low-cost air sensor) or (low-cost sensor) or (low-cost air quality Monitors) or (low-cost monitors) and Particulate Matter (PM2.5) or (Particulate Matter) or (PM). The databases used to search for relevant literature included PubMed, ProQuest, and ScienceDirect.
2.3. Selection of Studies
The key terms related to LCSs and PM were limited to title fields and/or abstracts during searching. Studies that were not published in English were excluded. All literature identified as applicable for the purpose of the review was added to a reference manager (EndNote X9). Literature not pertaining relevance to this review was excluded. Databases and search terms used are summarized in Table 1.

Table 1.
Databases and search terms used for review.
2.4. Literature Retrieval and Study Characteristics
Initially, the combined search comprised 1576 articles. Titles and abstracts from the articles were skimmed to be further considered. Overall, 68 articles were reviewed, and 51 articles underwent full text review to analyze low-cost monitor studies with PM concentrations [1,2,4,6,7,8,9,10,11,12,15,16,17,18,19,20,21,22,24,26,28,31,32,33,34,35,36,37,38,39,40,41,42,43,44,45,46,47,48,49,50,51,52,53,54,55,56,57,58,59]. Figure 1 shows the number of papers reviewed and their year of publication. There was a surge in the number of studies from 2018 to 2019 and 2020. The possibility of a correlation between PM and the spread of the COVID-19 pandemic has resulted in the growth of interest in this subject in recent years [60].
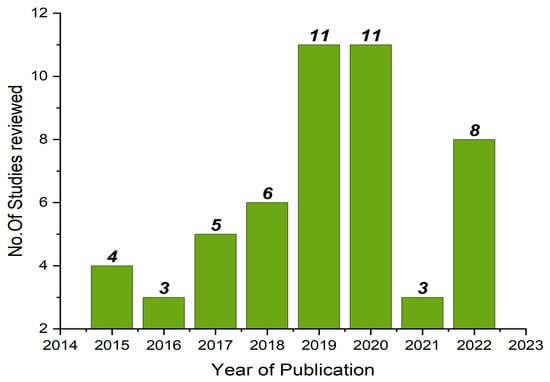
Figure 1.
Graph showing number of papers reviewed and their date of publication.
2.5. Primary Outcome Examined
Different types of LCSs, ranging from multiple manufacturers, include Plantower Technology (Beijing, People’s Republic of China), AQMesh(Stratford-upon-Avon, UK), Alphasense (Great Notley, UK), PurpleAir (Draper, UT, USA), E-MOTEs (Newcastle, UK), Shinyei (Chuo-ku, Kobe, Japan), Dylos Co. (Riverside, CA, USA), TSI (Shoreview, MN, USA), Hanvon (Beijing, People’s Republic of China), Airboxlab (San Francisco, CA, USA), Kaiterra (Crans Montana, Switzerland), HabitatMap (Brooklyn, NY, USA), SainSmart (Las Vegas, NV, USA), IQAir AirVisual (La Mirada, CA, USA), uHoo (Milford, OH, USA), Aeroqual (Auckland, New Zealand), Met One (Grants Pass, OR, USA), Foobot (San Francisco, CA, USA), AirSENSE (Vaughan, ON, Canada), Sharp (Osaka, Japan), AirSpeck (Edinburgh, UK), AirThinx (Philadelphia, PA, USA), AirBeam (Brooklyn, NY, USA) and Airveda (Ghaziabad, UP, India). Studies compared different manufactured LCSs with other sensors and/or with publicly available data from EPA’s station monitoring air quality, near the area of such study, for further validation. Results of the selected studies, including emission sources, type of site, PM type, sampling region, sampling period, LCS’s manufacture, and number of sensors, were summarized in the study.
3. Results
The summarization of characteristics for LCSs evaluating particulate matter is demonstrated in Table 2. Overall, there were 51 different studies from 14 countries, comprised of Australia, China, Norway, the United Kingdom, Oman, Portugal, Greece, India, Spain, Taiwan, South Korea, Japan, Canada, and the U.S. All studies focused on LCSs that measure any type of PM (PM1, PM2.5, PM4, PM10). Out of the fifty-one studies, all of them employed air quality monitoring systems that measured PM2.5, and twelve of them measured PM1, two studies measured PM4, nineteen measured PM10, and two studies measured all sizes of PM (Table 2).
Table 2.
Summarization of characteristics for LCSs evaluating particulate matter.
Sites of the sampling region classify the environment the study took place in, in order to get an idea of the emission sources. The sites ranged from indoor (with four studies under controlled lab conditions [7,22,42,48]) to outdoor in urban, suburban, rural, semi-rural, or semi-urban environments. In all, there were ten indoor sites, thirty-eight urban sites (including the semi-urban locations), six suburban, and six rural (including the semi-rural locations). Emission sources are based on the location of the site and the region. Two studies [15,56] deployed their LCS in urban locations near residential non-smoking environments. The most common emissions in urban and suburban sites are industrial, traffic exhaust, and vehicular emissions [1,2,3,4,6,8,9,10,11,12,13,15,16,17,21,28,31,32,33,34,35,36,37,38,39,40,41,43,44,45,46,47,49,50,51,52,53,55,56,57,58,59]. Transportation (or traffic) emissions, including gas, vehicle, and diesel combustions, were exposed in forty-three of the studies. Indoor emissions would include human activities (i.e., cooking [19,34,43,48,54] and using office equipment [20]), air conditioning for cooling and heating [43], incense burning [22,54], wood smoke [42], or cigarettes [22,43].
During the studies, the sampling period varied from long-term to short-term, depending on the desired results of the researcher. The long-term may be considered 6 months and older, while the short-term would be classified as any duration under 6 months. As a result, there are 21 long-term studies and 30 short-term studies.
The most common low-cost sensor manufacturer used in these studies is Plantower, with eight studies. Each of the thirteen studies using the PurpleAir PA-II unit contained two Plantower particulate matter sensors (PMS5003 sensors, Plantower Technology, Beijing, People’s Republic of China) [10]. Other manufacturers, AirThinx (Philadelphia, PA, USA), KOALA (QUT, Brisbane, Australia), and AS-LUNG-P (Taipei, Republic of China), also included a Plantower particulate matter sensor. In total, with the considerations of the other monitors, including Plantower, 24 studies used Plantower PM sensors. In the remaining studies, one study included an AQMesh, six from Alphasense (Great Notley, UK), one from E-MOTEs (Newcastle, UK), six from Shinyei (Chuo-ku, Kobe, Japan), five from Dylos Co. (Riverside, CA, USA), six from TSI (Shoreview, MN, USA), two from Hanvon (Beijing, People’s Republic of China), three from Airboxlab (San Francisco, CA, USA), two from Kaiterra (Crans Montana, Switzerland), three from HabitatMap (Brooklyn, NY, USA), two from SainSmart (Las Vegas, NV, USA), four from IQAir AirVisual (La Mirada, CA, USA), two from uHoo (Milford, OH, USA), three from Aeroqual (Auckland, New Zealand), one from Met One (Grants Pass, OR, USA), two from Foobot (San Francisco, CA, USA), one from AirSENSE (Vaughan, ON, Canada), one from Sharp (Osaka, Japan), two from AirSpeck (Edinburgh, UK), one from AirThinx (Philadelphia, PA, USA), one from AirBeam (Brooklyn, NY, USA), and finally, one from Airveda (Ghaziabad, UP, India).
OPC—optical particle counters were the most widely used sensors, as per this review [1,2,3,4,6,7,8,9,10,11,12,13,15,16,18,19,20,21,22,24,27,32,33,34,36,37,38,39,40,41,42,43,44,48,49,50,53,54,55,56], followed by Nephelometer [2,15,17,20,22,27,46,51]. Other types of instruments or sensors include electrochemical based [31], ultrasonic personal aerosol sampler [47], and MO—metal oxide [2,27]. Most of the studies that used the LCSs for different indoor/outdoor studies in different sites, including rural, urban, and semi-urban, have reported that the raw data reported by LCSs is required to be calibrated for analysis. When the FEM/FRM instruments were used as reference instruments, studies found that there was a considerable amount of difference between the sensor measurements and these FEM/FRM instruments [6,8,10,11,12,15,16,17,21,22,32,33,37,40,41,55]. Some studies, which used PurpleAir sensor, found the raw data to be highly correlated with the reference instruments [3,13,39,41,42], with the R2 value more than 0.83 in all cases.
Reference instruments were used in 40 of the studies. Other studies were nonapplicable; they did not use a reference instrument during their procedure, due to limited resources. Twenty-nine of the studies referenced their LCSs to FEM or FRM reference instruments for their calibrations [2,3,10,11,12,13,16,24,28,31,33,36,37,38,39,40,41,42,43,44,47,49,50,51,53,54,55,56,58]. FEM monitors, such as tapered element oscillating microbalance (TEOM), were used in these studies [33,36,42,43,51], while beta attenuation monitors (BAM) were used in these studies [2,28,33,37,38,39,41,44,49,50,54,57,58]. GRIMM (Grimm Aerosol Technik GmbH & Co. KG, Ainring, Germany) [1,7,13,20,55] and DustTrak DRX (TSI Inc., Shoreview, MN, USA) [20] were also found as calibration and reference instruments. A recent study in Dallas, TX compared LCSs to the EPA’s Texas Commission on Environmental Quality (TCEQ) Continuous Ambient Monitoring Stations (CAMS) [8]. In India, ambient PM levels were assessed with reference-grade instruments from Continuous Ambient Air Quality Monitoring Stations (CAAQMS) [18]. The only study which reported that the raw values are capable of accurately capturing the spatiotemporal trend of PM2.5 was the one manufactured by AirBoxlab [4]. It is an OPC based sensor and the study was conducted for 61 days to capture vehicular, traffic activities. Various reasons for the differences between the measurements of LCSs and the reference instruments include the effect of meteorological parameters, like relative humidity (RH) and temperature, on the values [2,6,8,15,40,41,53], winter season [16], rainy weather, or significant levels of hygroscopic salt levels [20].
4. Discussion
The goal of this review was to summarize the studies that included LCSs measuring PM concentrations. The studies were conducted in both indoor and outdoor micro-environments, in a variety of countries and states, during specific sampling periods. Additionally, the review was able to take note of the reference instruments being used to evaluate and calibrate the overall performance of LCSs in PM ambient monitoring.
Providing information for future reviews would include the co-located tests with the appropriate manufacturer and model, on top of the information gathered in Table 2. Based on the search performance through PubMed, ProQuest, and ScienceDirect, LCS studies are rapidly growing, and studies are focusing on the concerns and effects of PM on human health. Therefore, the information gathered from LCSs needs to be validated to provide the public with true data, as seen in calibrations [2,3,10,11,12,13,16,24,28,31,33,36,37,38,39,40,41,42,43,44,47,49,50,51,53,54,55,56,58]. The season in which the study duration proceeds should also be noted when reviewing literature for LCSs. Season variability can determine PM concentration fluctuations, as well as the monitor’s performance level [13].
Literature analyzing PM ambient data generally used regression models for statistical calibration, as seen in various studies [12,35,48]. For instance, the generalized additive model (GAM) is a non-parametric regression method used in a couple of studies [4,35], while data from other studies was referenced back to AQ-SPEC and their methods [3,11].
Based on the search, a limitation throughout the studies was associated with the short-term duration, where sampling was a couple of hours [7,22,42,43,44], while some were a little less than an hour [46,48]. Depending on the research objective to study long-term or short-term exposures, the length of the LCS performance varies. Additionally, various studies have demonstrated that weather conditions, like temperature, relative humidity, and other environmental factors, can impact the output of low-cost PM sensors. Temperature and relative humidity had variable impacts on the sensor response in a study from Hong Kong [61]. In another Chilean study, a weak correlation was observed between low-cost sensors and traditional instruments at study sites where PM10 dominated. Therefore, the size and composition of particles can also impact the accuracy of PM sensors [62]. Hence, these meteorological factors are considered, and algorithms are implemented to reduce the interference [20,26]. The growing development of LCSs and calibration techniques has improved data quality from the sensors [5].
PM ambient air pollutants in the urban area, with roads and highways, result in a significant emission source from traffic and vehicular exhaust [1,2,3,4,6,8,9,10,11,12,13,15,16,17,21,28,31,32,33,34,35,36,37,38,39,40,41,43,44,45,47,49,50,51,52,53,55,56,57,58,59]. With the influx of in-vehicle use in the city, PM (a common pollutant from vehicle use) is exposed more frequently, resulting in chronic and acute human health effects [13]. Assessing the current studies, researchers are focusing on LCS studies to better assess human exposures to PM with high spatial resolution [1,8,9,17,18,19,20].
Using LCSs enables the characterization of real-time measurements at a reduced expense, thereby extending the spatial coverage of air pollutant measurements beyond what is achievable with existing federal reference methods [30]. The selection of LCS for any study should consider multiple factors, such as the sampling period, cost and size of sensor, study site, emission sources to be studied, and meteorological factors at the site for the sampling period. Studies have reported that the LCSs are more accurate in specific environments. A study, which used the Plantower sensor for the assessment of cooking emissions on indoor air quality, concluded that the sensor produces data acceptable for residential air [54]. Koala monitor is powered by a small solar panel and a rechargeable Li-ion battery [16]. It operates effectively with as little as 5 h of sunlight each day and can continue to function for a few days, even in the absence of direct sunlight, once it has been fully charged. This sensor can be very useful in studies which use locations with little or no electricity supply. A study used a sensor manufactured by Dylos Co. to examine the personal exposure monitoring of PM2.5 in indoor and outdoor microenvironments. It documented that the sensor is not specifically designed for mobile measurements [43]. In a 5-day field evaluation and calibration study of AirBeam2 by Huang et al., it was suggested that the accuracy of PM concentration measurement might be affected by high levels of relative humidity and hydroscopic salts [20]. As a result, the sensor may not be suitable for use in studies conducted near the seashore. In a 320 day study by Sayahi et al. [36], which evaluated the Plantower particulate matter sensors in the field, the raw data collected by the sensors had a high correlation of R2 > 0.858 in the winter season. Hence, multiple factors need to be taken into consideration to finalize a suitable sensor for an air pollution study.
5. Conclusions
In the last few years, low-cost sensor usage to measure various air pollutants, such as PM, has increased substantially throughout the world. These sensors are crucial in assessing the air pollution exposure burden of the local population in any urban or rural environment. Federally monitored Continuous Ambient Monitoring Sites are not ubiquitous in any landscape; therefore, air pollution exposure misclassification is a major issue in this field. This review paper provides a thorough and succinct presentation of low-cost sensors to measure particulate matter pollution across the globe.
There is a growing demand for LCSs due to their practical features, such as smaller size and lower cost, compared to traditional instruments used in the field of air quality monitoring. The quality and uses of LCSs is increasing rapidly across all corners of the world. This review paper highlighted studies determining LCSs performances to assess ambient PM. The study also highlighted the merits and limitations of the sensors. This evaluation is relevant today in addressing human respiratory health issues after the global COVID-19 pandemic. Results from this and other such reviews can assist with future studies for LCSs and assist with other research related to PM assessment.
Author Contributions
Conceptualization: A.U.R., D.W., K.S. and O.T. Analysis and Interpretation of Results: E.M., S.D.P. and A.U.R. Draft Manuscript Preparation: E.M. Manuscript Reviewing and Editing: A.U.R., S.D.P., D.W., K.S. and O.T. All authors provided valuable comments and ideas while drafting the manuscript. All authors have read and agreed to the published version of the manuscript.
Funding
Graduate assistantship for E.M. and S.D.P. was kindly provided by School of Earth, Environment, and Marine Sciences, UTRGV.
Institutional Review Board Statement
Not applicable.
Informed Consent Statement
Not applicable.
Data Availability Statement
Not applicable.
Acknowledgments
The authors would like to express their gratitude to the administrators at the College of Science, UTRGV.
Conflicts of Interest
The authors declare no conflict of interest.
References
- Gómez-Suárez, J.; Arroyo, P.; Alfonso, R.; Suárez, J.I.; Pinilla-Gil, E.; Lozano, J. A Novel Bike-Mounted Sensing Device with Cloud Connectivity for Dynamic Air-Quality Monitoring by Urban Cyclists. Sensors 2022, 22, 1272. [Google Scholar] [CrossRef] [PubMed]
- Feenstra, B.J. Development of Methodologies for the Use and Application of Air Quality Sensors to Enable Community Air Monitoring. Ph.D. Thesis, University of California, Los Angeles, CA, USA, 2020. [Google Scholar]
- Wang, Z.; Delp, W.W.; Singer, B.C. Performance of low-cost indoor air quality monitors for PM2.5 and PM10 from residential sources. Build. Environ. 2020, 171, 106654. [Google Scholar] [CrossRef]
- Lee, C.H.; Wang, Y.B.; Yu, H.L. An efficient spatiotemporal data calibration approach for the low-cost PM2.5 sensing network: A case study in Taiwan. Environ. Int. 2019, 130, 104838. [Google Scholar] [CrossRef] [PubMed]
- Lung, S.-C.C.; Thi Hien, T.; Cambaliza, M.O.L.; Hlaing, O.M.T.; Oanh, N.T.K.; Latif, M.T.; Lestari, P.; Salam, A.; Lee, S.-Y.; Wang, W.-C.V.; et al. Research Priorities of Applying Low-Cost PM2.5 Sensors in Southeast Asian Countries. Int. J. Environ. Res. Public Health 2022, 19, 1522. [Google Scholar] [CrossRef]
- Mykhaylova, N. Low-cost Sensor Array Devices as a Method for Reliable Assessment of Exposure to Traffic-related Air Pollution. Ph.D. Thesis, University of Toronto (Canada), Toronto, ON, Canada, 2018. [Google Scholar]
- Oluwadairo, T.; Whitehead, L.; Symanski, E.; Bauer, C.; Carson, A.; Han, I. Effects of aerosol particle size on the measurement of airborne PM2.5 with a low-cost particulate matter sensor (LCPMS) in a laboratory chamber. Environ. Monit. Assess. 2022, 194, 56. [Google Scholar] [CrossRef]
- Khreis, H.; Johnson, J.; Jack, K.; Dadashova, B.; Park, E.S. Evaluating the Performance of Low-Cost Air Quality Monitors in Dallas, Texas. Int. J. Environ. Res. Public Health 2022, 19, 1647. [Google Scholar] [CrossRef] [PubMed]
- Lu, Y.; Giuliano, G.; Habre, R. Estimating hourly PM2.5 concentrations at the neighborhood scale using a low-cost air sensor network: A Los Angeles case study. Environ. Res. 2021, 195, 110653. [Google Scholar] [CrossRef]
- Ardon-Dryer, K.; Dryer, Y.; Williams, J.N.; Moghimi, N. Measurements of PM2.5 with PurpleAir under atmospheric conditions. Atmos. Meas. Tech. 2020, 13, 5441–5458. [Google Scholar] [CrossRef]
- Wallace, L.; Bi, J.; Ott, W.R.; Sarnat, J.; Liu, Y. Calibration of low-cost PurpleAir outdoor monitors using an improved method of calculating PM. Atmos. Environ. 2021, 256, 118389. [Google Scholar] [CrossRef]
- Datta, A.; Saha, A.; Zamora, M.L.; Buehler, C.; Hao, L.; Xiong, F.; Gentner, D.R.; Koehler, K. Statistical field calibration of a low-cost PM2.5 monitoring network in Baltimore. Atmos. Environ. 1994, 2020, 242. [Google Scholar] [CrossRef]
- Chen, Y.-H. Applying Low-Cost Air Sensors for Spatiotemporal Variability of Particulate Matter in a Local Community Adjacent to Interstate Highway. Master’s Thesis, University of California, Los Angeles, CA, USA, 2020. [Google Scholar]
- AQ-SPEC- Air Quality Sensor Performance Evaluation Center. Available online: http://www.aqmd.gov/aq-spec/evaluations/summary-pm (accessed on 7 January 2023).
- Zamora, M.L.; Rice, J.; Koehler, K. One Year Evaluation of Three Low-Cost PM2.5 Monitors. Atmos Environ. 1994, 2020, 235. [Google Scholar] [CrossRef]
- Liu, X.; Jayaratne, R.; Thai, P.; Kuhn, T.; Zing, I.; Christensen, B.; Lamont, R.; Dunbabin, M.; Zhu, S.; Gao, J.; et al. Low-cost sensors as an alternative for long-term air quality monitoring. Environ. Res. 2020, 185, 109438. [Google Scholar] [CrossRef] [PubMed]
- Wu, T.-G.; Chen, Y.-D.; Chen, B.-H.; Harada, K.H.; Lee, K.; Deng, F.; Rood, M.J.; Chen, C.-C.; Tran, C.-T.; Chien, K.-L.; et al. Identifying low-PM2.5 exposure commuting routes for cyclists through modeling with the random forest algorithm based on low-cost sensor measurements in three Asian cities. Environ. Pollut. 2022, 294, 118597. [Google Scholar] [CrossRef]
- Pawar, H.; Sinha, B. Residential heating emissions (can) exceed paddy-residue burning emissions in rural northwest India. Atmos. Environ. 2022, 269, 118846. [Google Scholar] [CrossRef]
- He, J.; Huang, C.-H.; Yuan, N.; Austin, E.; Seto, E.; Novosselov, I. Network of Low-cost Air Quality Sensor for Monitoring Indoor, Outdoor, and PersonalPM2.5Exposure in Seattleduring the 2020 Wildfire Season. Atmos. Environ. 2022, 285, 119244. [Google Scholar] [CrossRef]
- Huang, J.; Kwan, M.-P.; Cai, J.; Song, W.; Yu, C.; Kan, Z.; Yim, S.H.-L. Field Evaluation and Calibration of Low-Cost Air Pollution Sensors for Environmental Exposure Research. Sensors 2022, 22, 2381. [Google Scholar] [CrossRef] [PubMed]
- Dausman, T.B.C. Low Cost Air Quality Monitors in Agriculture. Master’s Thesis, The University of Iowa, Iowa City, IA, USA, 2017. [Google Scholar]
- Burton, R.K. Analysis of Low-Cost Particulate Matter Shinyei Sensor for Asthma Research. Master’s Thesis, University of Maryland, College Park, MD, USA, 2017. [Google Scholar]
- Kim, K.H.; Kabir, E.; Kabir, S. A review on the human health impact of airborne particulate matter. Environ. Int. 2015, 74, 136–143. [Google Scholar] [CrossRef]
- Orlando, P.J. Modeling Spatiotemporal Patterns of PM 2.5 at the Sub-Neighborhood Scale Using Low-Cost Sensor Networks. Master’s Thesis, Portland State University, Portland, OR, USA, 2019. [Google Scholar]
- Jugder, D.; Shinoda, M.; Sugimoto, N.; Matsui, I.; Nishikawa, M.; Park, S.-U.; Chun, Y.-S.; Park, M.-S. Spatial and temporal variations of dust concentrations in the Gobi Desert of Mongolia. Glob. Planet. Chang. 2011, 78, 14–22. [Google Scholar] [CrossRef]
- Wang, Z. Long-Term Evaluation of Low-Cost Air Sensors in Monitoring Indoor Air Quality at a California Community. Master’s Thesis, University of California, Los Angeles, CA, USA, 2020. [Google Scholar]
- Aguilera, J.; Whigham, L.D. Using the 13C/12C carbon isotope ratio to characterise the emission sources of airborne particulate matter: A review of literature. Isot. Environ. Health Stud. 2018, 54, 573–587. [Google Scholar] [CrossRef]
- Feenstra, B.; Papapostolou, V.; Hasheminassab, S.; Zhang, H.; Boghossian, B.D.; Cocker, D.; Polidori, A. Performance evaluation of twelve low-cost PM2.5 sensors at an ambient air monitoring site. Atmos. Environ. 2019, 216, 116946. [Google Scholar] [CrossRef]
- Wang, Y.; Li, J.; Jing, H.; Zhang, Q.; Jiang, J.; Biswas, P. Laboratory Evaluation and Calibration of Three Low-Cost Particle Sensors for Particulate Matter Measurement. Aerosol Sci. Technol. 2015, 49, 1063–1077. [Google Scholar] [CrossRef]
- Karagulian, F.; Barbiere, M.; Kotsev, A.; Spinelle, L.; Gerboles, M.; Lagler, F.; Redon, N.; Crunaire, S.; Borowiak, A. Review of the Performance of Low-Cost Sensors for Air Quality Monitoring. Atmosphere 2019, 10, 506. [Google Scholar] [CrossRef]
- Castell, N.; Dauge, F.R.; Schneider, P.; Vogt, M.; Lerner, U.; Fishbain, B.; Broday, D.; Bartonova, A. Can commercial low-cost sensor platforms contribute to air quality monitoring and exposure estimates? Environ. Int. 2017, 99, 293–302. [Google Scholar] [CrossRef]
- Pang, X.; Chen, L.; Shi, K.; Wu, F.; Chen, J.; Fang, S.; Wang, J.; Xu, M. A lightweight low-cost and multipollutant sensor package for aerial observations of air pollutants in atmospheric boundary layer. Sci. Total Environ. 2021, 764, 142828. [Google Scholar] [CrossRef] [PubMed]
- Kelly, K.E.; Whitaker, J.; Petty, A.; Widmer, C.; Dybwad, A.; Sleeth, D.; Martin, R.; Butterfield, A. Ambient and laboratory evaluation of a low-cost particulate matter sensor. Environ. Pollut. 2017, 221, 491–500. [Google Scholar] [CrossRef]
- Zhang, F. Monitoring Indoor Air Quality Using Low-cost Sensors at a Community Scale. Master’s Thesis, University of California, Los Angeles, CA, USA, 2019. [Google Scholar]
- Munir, S.; Mayfield, M.; Coca, D.; Jubb, S.A.; Osammor, O. Analysing the performance of low-cost air quality sensors, their drivers, relative benefits and calibration in cities-a case study in Sheffield. Environ. Monit. Assess. 2019, 191, 94. [Google Scholar] [CrossRef]
- Sayahi, T.; Butterfield, A.; Kelly, K.E. Long-term field evaluation of the Plantower PMS low-cost particulate matter sensors. Environ. Pollut. 2019, 245, 932–940. [Google Scholar] [CrossRef]
- Borrego, C.; Costa, A.M.; Ginja, J.; Amorim, M.; Coutinho, M.; Karatzas, K.; Sioumis, T.; Katsifarakis, N.; Konstantinidis, K.; De Vito, S.; et al. Assessment of air quality microsensors versus reference methods: The EuNetAir joint exercise. Atmos. Environ. 2016, 147, 246–263. [Google Scholar] [CrossRef]
- Carvlin, G.N.; Lugo, H.; Olmedo, L.; Bejarano, E.; Wilkie, A.; Meltzer, D.; Wong, M.; King, G.; Northcross, A.; Jerrett, M.; et al. Development and field validation of a community-engaged particulate matter air quality monitoring network in Imperial, California, USA. J. Air Waste Manag. Assoc. 2017, 67, 1342–1352. [Google Scholar] [CrossRef]
- Gupta, P.; Doraiswamy, P.; Levy, R.; Pikelnaya, O.; Maibach, J.; Feenstra, B.; Polidori, A.; Kiros, F.; Mills, K.C. Impact of California Fires on Local and Regional Air Quality: The Role of a Low-Cost Sensor Network and Satellite Observations. GeoHealth 2018, 2, 172–181. [Google Scholar] [CrossRef]
- Jayaratne, R.; Kuhn, T.; Christensen, B.; Liu, X.; Zing, I.; Lamont, R.; Dunbabin, M.; Maddox, J.; Fisher, G.; Morawska, L. Using a Network of Low-Cost Particle Sensors to Assess the Impact of Ship Emissions on a Residential Community. Aerosol Air Qual. Res. 2020, 20, 2754–2764. [Google Scholar] [CrossRef]
- Stavroulas, I.; Grivas, G.; Michalopoulos, P.; Liakakou, E.; Bougiatioti, A.; Kalkavouras, P.; Fameli, K.M.; Hatzianastassiou, N.; Mihalopoulos, N.; Gerasopoulos, E. Field Evaluation of Low-Cost PM Sensors (Purple Air PA-II) Under Variable Urban Air Quality Conditions, in Greece. Atmosphere 2020, 11, 926. [Google Scholar] [CrossRef]
- Wells, H. Assessing Low-Cost Purple Air Particulate Matter Sensors. 2020. Available online: https://www.lib.ncsu.edu/resolver/1840.20/37490 (accessed on 9 January 2023).
- Steinle, S.; Reis, S.; Sabel, C.E.; Semple, S.; Twigg, M.M.; Braban, C.F.; Leeson, S.R.; Heal, M.R.; Harrison, D.; Lin, C.; et al. Personal exposure monitoring of PM2.5 in indoor and outdoor microenvironments. Sci. Total Environ. 2015, 508, 383–394. [Google Scholar] [CrossRef]
- Austin, E.; Novosselov, I.; Seto, E.; Yost, M.G. Laboratory Evaluation of the Shinyei PPD42NS Low-Cost Particulate Matter Sensor. PLoS ONE 2015, 10, e0137789. [Google Scholar] [CrossRef]
- Arvind, D.K.; Mann, J.; Bates, A.; Kotsev, K. The AirSpeck Family of Static and Mobile Wireless Air Quality Monitors. In Proceedings of the 2016 Euromicro Conference on Digital System Design (DSD), Limassol, Cyprus, 31 August–2 September 2016; pp. 207–214. [Google Scholar]
- Alvarado, M.; Gonzalez, F.; Fletcher, A.; Doshi, A. Towards the Development of a Low Cost Airborne Sensing System to Monitor Dust Particles after Blasting at Open-Pit Mine Sites. Sensors 2015, 15, 19667–19687. [Google Scholar] [CrossRef]
- Wendt, E.A.; Quinn, C.W.; Miller-Lionberg, D.D.; Tryner, J.; L’Orange, C.; Ford, B.; Yalin, A.P.; Pierce, J.R.; Jathar, S.; Volckens, J. A low-cost monitor for simultaneous measurement of fine particulate matter and aerosol optical depth–Part 1: Specifications and testing. Atmos. Meas. Tech. 2019, 12, 5431–5441. [Google Scholar] [CrossRef]
- Zervaki, O. Calibration and Evaluation of Low-cost Optical Dust Sensors and Monitors. Master’s Thesis, University of Cincinnati, Cincinnati, OH, USA, 2018. [Google Scholar]
- Jiao, W.; Hagler, G.; Williams, R.; Sharpe, R.; Brown, R.; Garver, D.; Judge, R.; Caudill, M.; Rickard, J.; Davis, M.; et al. Community Air Sensor Network (CAIRSENSE) project: Evaluation of low-cost sensor performance in a suburban environment in the southeastern United States. Atmos. Meas. Tech. 2016, 9, 5281–5292. [Google Scholar] [CrossRef]
- Zheng, T.; Bergin, M.H.; Johnson, K.K.; Tripathi, S.N.; Shirodkar, S.; Landis, M.S.; Sutaria, R.; Carlson, D.E. Field evaluation of low-cost particulate matter sensors in high- and low-concentration environments. Atmos. Meas. Tech. 2018, 11, 4823–4846. [Google Scholar] [CrossRef]
- Marto, J.P. Field Evaluation of Portable Air Quality Monitors and Evaluation of Short-lived Plume Events of Atmospheric Pollutants. Master’s Thesis, State University of New York at Albany, Albany, NY, USA, 2018. [Google Scholar]
- Hartin, K. Fine Particle (PM2.5) Composition of Indoor and Outdoor Air Samples Collected in Xuanwei County, China. Master’s Thesis, University of Washington, Washington, DC, USA, 2015. [Google Scholar]
- Al Hanai, A.H. Methods to Investigate Fine PM in Developing Countries: Spatial Distribution and Biological Responses. Ph.D. Thesis, The University of Wisconsin-Madison, Madison, WI, USA, 2019. [Google Scholar]
- Levy Zamora, M.; Xiong, F.; Gentner, D.; Kerkez, B.; Kohrman-Glaser, J.; Koehler, K. Field and Laboratory Evaluations of the Low-Cost Plantower Particulate Matter Sensor. Environ. Sci. Technol. 2019, 53, 838–849. [Google Scholar] [CrossRef]
- Williams, R.; Vallano, D.; Polidori, A.; Garvey, S. Spatial and Temporal Trends of Air Pollutants in the South Coast Basin Using Low Cost Sensors; EPA/600/R-17/463; U.S. Environmental Protection Agency: Washington, DC, USA, 2018.
- Tsou, M.-C.M.; Lung, S.-C.C.; Shen, Y.-S.; Liu, C.-H.; Hsieh, Y.-H.; Chen, N.; Hwang, J.-S. A community-based study on associations between PM2.5 and PM1 exposure and heart rate variability using wearable low-cost sensing devices. Environ. Pollut. 2021, 277, 116761. [Google Scholar] [CrossRef]
- Malings, C.; Tanzer, R.; Hauryliuk, A.; Saha, P.K.; Robinson, A.L.; Presto, A.A.; Subramanian, R. Fine particle mass monitoring with low-cost sensors: Corrections and long-term performance evaluation. Aerosol Sci. Technol. 2019, 54, 160–174. [Google Scholar] [CrossRef]
- Magi, B.I.; Cupini, C.; Francis, J.; Green, M.; Hauser, C. Evaluation of PM2.5 measured in an urban setting using a low-cost optical particle counter and a Federal Equivalent Method Beta Attenuation Monitor. Aerosol Sci. Technol. 2019, 54, 147–159. [Google Scholar] [CrossRef]
- Tian, Y.; Desouza, P.; Mora, S.; Yao, X.; Duarte, F.; Norford, L.K.; Lin, H.; Ratti, C. Evaluating the Meteorological Effects on the Urban Form–Air Quality Relationship Using Mobile Monitoring. Environ. Sci. Technol. 2022, 56, 7328–7336. [Google Scholar] [CrossRef]
- Alfano, B.; Barretta, L.; Del Giudice, A.; De Vito, S.; Di Francia, G.; Esposito, E.; Formisano, F.; Massera, E.; Miglietta, M.L.; Polichetti, T. A Review of Low-Cost Particulate Matter Sensors from the Developers’ Perspectives. Sensors 2020, 20, 6819. [Google Scholar] [CrossRef] [PubMed]
- Wei, P.; Ning, Z.; Ye, S.; Sun, L.; Yang, F.; Wong, K.; Westerdahl, D.; Louie, P. Impact Analysis of Temperature and Humidity Conditions on Electrochemical Sensor Response in Ambient Air Quality Monitoring. Sensors 2018, 18, 59. [Google Scholar] [CrossRef]
- Gramsch, E.; Oyola, P.; Reyes, F.; Vásquez, Y.; Rubio, M.A.; Soto, C.; Pérez, P.; Moreno, F.; Gutiérrez, N. Influence of Particle Composition and Size on the Accuracy of Low Cost PM Sensors: Findings From Field Campaigns. Front. Environ. Sci. 2021, 9, 751267. [Google Scholar] [CrossRef]
Disclaimer/Publisher’s Note: The statements, opinions and data contained in all publications are solely those of the individual author(s) and contributor(s) and not of MDPI and/or the editor(s). MDPI and/or the editor(s) disclaim responsibility for any injury to people or property resulting from any ideas, methods, instructions or products referred to in the content. |
© 2023 by the authors. Licensee MDPI, Basel, Switzerland. This article is an open access article distributed under the terms and conditions of the Creative Commons Attribution (CC BY) license (https://creativecommons.org/licenses/by/4.0/).