1. Introduction
Induction motors are used in a broad scope of industrial applications: electric vehicles, gearmotors, etc. It is important to keep induction motors operational via fault identification, i.e., fault detection and isolation (FDI) of their key components. One of the key components that essentially impacts induction motor functions is its rolling bearings. Fault identification and prognosis for bearings are the subjects of many research works that provide viable results [
1,
2,
3,
4,
5,
6,
7,
8,
9,
10,
11,
12,
13,
14,
15,
16,
17,
18,
19].
A new technique for early fault detection and diagnosis in rolling-element bearings, based on vibration analysis is presented [
1]. After normalization and the wavelet transform of vibration signals, the standard deviation as a measure of average energy and the logarithmic energy entropy as a measure of the degree of disorder are extracted in sub-bands of interest as representative features.
Then, the feature space dimension is optimally reduced to two, using scatter matrices. In the reduced two-dimensional feature space, the fault diagnosis is performed by quadratic classifiers.
A new bearing fault diagnosis method is proposed [
2], based on structural feature selection. In contrast to most of common fault diagnosis methods, the proposed method transfers the problem of fault diagnosis into a new multi-objective programming problem, and then uses the numerical algorithm to exploit the structural relationship among heterogeneous fault features. A method, allowing fault detection and diagnostic for critical components of the gear reducer, in particular gear and bearing defects, is developed [
3], based on a new indicator, extracted from electrical signals. It allows characterizing different states of the gear reducer, such as healthy state, bearing faults, gear faults, and combined faults.
A new motor square current signature analysis (MSCSA) fault diagnosis is presented [
4]. The proposed technique is based on three main steps: first, the induction motor current is measured; secondly, the square of the current is computed; and, finally, a frequency analysis of the square current is performed. This technique allows more information to be obtained from a motor with a rotor fault, than the classical current analysis.
A new method for the fault detection of bearing outer raceway fault in motors is proposed [
5]. The method is based on the analysis of the instantaneous frequency (IF) of current using Hilbert transform, and spectrum analysis is used to detect the frequency associated with the bearing outer raceway fault. The proposed method can significantly reduce the negative influence of the supply frequency component spectrum leakage, and thus, can enhance the fault features to detect bearing outer raceway fault under lower load conditions. The authors proposed [
6] a motor bearing monitoring tool, which leverages on stator currents signals, processed with a deep learning. The authors exploit a deep learning, able to extract from the stator current signal a compact and expressive representation of the bearings state. Investigation of the efficacy of current monitoring for bearing fault detection by correlating the relationship between vibration and current frequencies caused by incipient bearing failures is performed [
7]. The effects on the stator current spectrum are described and the related frequencies determined.
A new approach is proposed [
8] for fault identification, based on two effects of a bearing fault: (1) the introduction of a particular radial rotor movement and (2) load torque variations, caused by the bearing fault. Six wavelets are considered for bearing fault diagnosis via stator current [
9] out of which three are real valued and the remaining three are complex valued. Base wavelet has been selected on the basis of wavelet selection criteria-maximum relative wavelet energy. A similar method is developed [
10], a base wavelet has been selected out of four real valued wavelets, using energy-based criterion. To characterize faults in time-frequency domain, 2-D and 3-D wavelet scalograms have also been presented.
A method is developed [
11], based on squared envelope spectrum to detect localized bearing faults through the stator current analysis of a three-phase induction motor. The fast kurtogram and the wavelet kurtogram are also applied to improve the envelope analysis. The originality of work [
12] relies on the use of high-resolution methods to detect modulations in the stator current. Stator current modeling for defective induction motor rolling bearings, based on magnetic equivalent circuits, is carried out [
13]. An iterative numerical integration method is presented to solve the stator current model.
Following the wavelet decomposition of vibration signals into a few sub-bands of interest, the standard deviation of obtained wavelet coefficients is extracted as a representative feature [
14]. Then, the feature space dimension is optimally reduced to two using scatter matrices. In the reduced two-dimensional feature space, the fault detection and diagnosis are carried out by quadratic classifiers. The authors [
15] evaluated the effectiveness of the bispectrum to assess the machine faults for selected signals: stator current, voltage proportional to the unipolar stream, vibration, and acoustic pressure. The authors [
16] have developed an algorithm that generates a pseudo-spectrum of square of current, using multiple signal classification techniques. A novel detection algorithm is introduced [
17], based on the analysis of the internal signals from the control structure: controller outputs and control path decoupling variables. The spectral analysis of these signals is used to detect the stator-winding incipient damages.
High effectiveness of early bearing diagnostics has been experimentally revealed. A novel diagnosis technology [
18], combining the benefits of the spectral kurtosis and the wavelet transform, is validated for early defect diagnosis of rolling bearings. A systematic procedure for feature estimation is proposed and rules for the selection of technology parameters are defined. The bicoherence analysis [
19] on both simulated and rig-generated vibration data from a rub-effected rotor–stator system shows diagnosis effectiveness on industrial data from final tailing pumps to detect impeller wear in an oil-sands plant.
The drawback of a vibration fault identification is that it requires expensive accelerometers. This, in turn, is not cost effective, especially in fault identification of big number of electrical motors. The majority of off-the-shelf systems require installation of vibration sensors on induction motor casing. For accurate measurements, sensors should be screwed to a body of the diagnosed motors; this requires drilling and rifling in a body of a motor; that is not always possible. Another problem of vibration sensor installation arises, if a motor is in an enclosed installation with a limited access or even without an access to a motor. Such installations: e.g., deep underground pumps or offshore enclosed systems do not allow direct access to motor, and that makes vibration fault identification systems unusable.
Technologies that are cheaper and allow fault identification to be taken in the above-mentioned enclosed installations are based on electrical data processing, namely, on motor current signature analysis. They employ remote current measurements, taken at a power source of a motor, instead of contact access vibration measurements. Motor current signature analysis technologies are widely used for fault identification of components of induction motors such as stator, rotor, etc. [
14,
16,
20,
21,
22]. However, these technologies are not yet widely used for fault identification of motor bearings in industrial applications.
Due to low cost of motor current signature analysis, applications of this technique for fault identification of motor bearings have become popular in the recent years. The classic Fourier transform is normally employed for fault identification of motor bearing, e.g., [
7,
10,
14], by transferring time domain signals of a motor current into the power spectral density. Characteristic components, related to motor bearing faults, are usually sought in the power spectral density of motor current.
This approach is not effective for identification of early stage of bearing fault development. Therefore, more effective second order data processing techniques are employed for fault identification of motor bearing by motor current signature analysis, as follows: the Park vector approach and the extended Park vector approach [
13,
21,
23], the spectral entropy [
1], a fuzzy feedback observer [
2], deep learning technology [
1,
6], the wavelet transform [
9,
10,
11], and the spectral kurtosis [
11,
18]. However, all these advanced techniques are still the second order techniques and, therefore, not effective for identification of early stage of bearing fault development.
It is known that the advanced data processing technique and the nonlinear higher order spectra [
24] are more effective [
24,
25,
26,
27] for the identification of early fault than the second order data processing techniques.
Therefore, the higher order spectra that are widely used for vibration fault identification in various electromechanical systems are becoming popular for motor fault identification via motor current signature analysis [
15,
19,
28,
29]. These works are related to simultaneous usage of multiple spectral narrowband components, generated by a fault, for higher order spectra estimation and fault identification.
From definition of the higher order spectra [
24], it is clear that all the analyzed spectral components must exhibit phase coupling (e.g., quadratic phase coupling, cubic phase coupling, etc.), in order to obtain a non-zero result that is associated with asset faults. The higher order spectra techniques and the 3rd order bicoherence require a strict choice of spectral components, generated by faults in electromechanical systems. Specifically, the highest frequency, taken into consideration by the higher order spectra, has to be a sum of remaining lower frequencies: i.e., in the case of 3rd order bicoherence
[
24].
This requirement will be fulfilled in some cases, in which fault related spectral components are presenting explicit harmonic signatures. However, this higher order spectra requirement may not be met for all spectral components that are carrying important information for fault identification. Therefore, this higher order spectra requirement is limited spectral components, generated by faults, that could be used for fault identification via motor current signature analysis, and, thus, limited fault types, that could be effectively identified by the higher order spectra.
Another drawback of the higher order spectra technologies is that the higher order spectra do not represent the correlations between complex spectral components, generated by faults in electromechanical systems, and, therefore, are not allowed to achieve the highest possible effectiveness at an early stage of fault identification.
These two essential drawbacks clearly show a need to develop higher order technologies for fault identification for electromechanical systems.
In order to mitigate these drawbacks, it is proposed in this research novel higher order spectral technologies, based on multi-dimensional higher order spectral multiple correlation of order n, higher order triple correlation, and higher order fourth correlation, for fault identification via signature analysis. The technologies are preserving positive features of higher order spectral analysis. However, they allow to take into account statistical dependencies between all needed combinations between the multiple spectral components, appearing due to a fault, without any limitations: i.e., regardless of dependencies between their frequencies. This technology feature will essentially enlarge the identification capabilities of the proposed technologies in comparison with the higher order spectra technologies.
The intensive literature search, performed by the authors, has shown that, in worldwide terms, nobody proposed the higher order multiple spectral correlations.
The spectral correlation, proposed in multiple references, e.g., [
30,
31,
32], related to the cyclic spectral analysis of the cyclo-stationary signals and the higher order multiple spectral correlations proposed here are two entirely different signal processing techniques. The only common feature between these two techniques is just the same name: the spectral correlation.
The spectral correlation in previous studies [
30,
31,
32] is related to a specific application for the cyclic spectral analysis for the cyclo-stationary processes and displays the power distribution of a signal with respect to both the spectral frequency
f, linked to the waveforms in the signal, and the cyclic frequency
a, linked to the cyclic evolution of the waveforms. Hence, contrary to the classical spectral analysis of stationary signals, the spectral correlation displays an additional dimension related to the nonstationarity of the signal.
Thus, the spectral correlation [
30,
31,
32] is the second order signal processing technique, a two-dimensional function and it is designed specifically for the cyclic spectral analysis of the cyclo-stationary signals.
The main concept of this research is the proposed spectral correlations that are the higher order techniques, multi-dimensional functions, which depend on
n independent frequencies and present exact correlations between
n complex spectral components. They are related to the general cases of complex stationary and non-stationary random signals, including the cyclo-stationary signals. Mathematical equations of the higher order spectral multiple correlations, proposed here and described in
Section 2 below, are entirely different from the mathematical equation, proposed in previous studies [
30,
31,
32] for the spectral correlation for the cyclic spectral analysis.
Other novelties of the research are, as follows:
Validation of the proposed spectral triple correlation technology via modelling trials
Experimental validation of the proposed spectral triple correlation technology via experimental trials
Comparison of the proposed technology with the higher order spectra technology via modelling trials
Experimental comparison of the proposed technology with the higher order spectra technology
The objectives of the research are, as follows:
Develop and investigate for the first time in worldwide terms fault identification technology, based on the higher order spectral correlation for electromechanical systems via signature analysis
Perform a validation of the proposed spectral triple correlation technology via modelling trials for pristine and faulty mechanical components
Perform a comparison of the proposed technology with the higher order spectra technology via modelling
Perform an experimental validation of the proposed spectral triple correlation technology via experimental trials for pristine and faulty motor bearings, using electrical data processing
Perform a preliminary experimental comparison of the proposed spectral triple correlation technology with the higher order spectra technology for pristine and faulty motor bearings, using electrical data processing
2. The Proposed Technologies
According to the classical statistical multivariate correlation analysis [
33,
34,
35], the normalized multiple cross-correlation (MCC) of order
n between
n complex stochastic variables
is expressed as
where
is the mean value of variable
,
denotes the complex conjugation,
is the standard deviation operator, and
is the mean value operator.
i = 1,
n.
It is proposed here for the first time in worldwide terms a generic fault identification technology for electromechanical systems, the higher order spectral multiple correlation (MC) of order
n, obtained via Equation (1) as
where
describes complex time-frequency transforms at frequency
and specific time
t for non-stationary random signals and complex frequency transforms at frequency
and any time
t for stationary random signals.
New particular technologies of the generic multiple correlation technology (2), the higher order spectral triple correlation of order 3 and the higher order spectral fourth correlation of order 4 are also proposed here and are obtained via Equation (2) as
The proposed technologies are applicable for stationary random signals, related to a stationary operation of electromechanical systems by employing appropriate frequency transforms (e.g., the complex Fourier transform, the Hartley transform, the Cosine transform, etc.) in Equations (2)–(4). It is proposed here the application of the technologies for non-stationary random signals, related to a transient operation of electromechanical systems, via employing appropriate time–frequency transforms (e.g., the short time chirp–Fourier transform [
36], the chirp–Wigner transform [
37], etc.) in Equations (2)–(4).
The spectral multiple correlation (2) and spectral triple and fourth correlations (3)–(4) are multi-dimensional complex functions, estimated for stationary and non-stationary random signals at multiple n frequencies, three and four frequencies, respectively, and depend on multiple n frequencies, three and four frequencies, respectively. The importance of the higher order multiple correlation (MC), the higher order triple correlation (TC), and the higher order fourth correlation (FC) is that they are measures of statistical dependencies between n, three and four complex spectral components, respectively. The proposed main concept of the MC, the TC, and the FC is applicable to both continuous and digital random signals.
The clear physical sense of the proposed technologies is that multiple complex spectral components that are appearing in the spectrum of measured signals due to a system fault, exhibit non-zero spectral correlations. Thus, the proposed technologies are sensitive to fault related spectral components. The normalization of the spectral correlations by the standard deviations allows avoidance of systematic errors due to amplitude changes of a time-frequency transforms: i.e., if an intensity of transform amplitudes will be changed, the normalized multiple correlations will be unchanged.
The higher order spectra of order n and their particular cases, the bicoherence, and the tricoherence do not represent the multiple correlations between multiple n complex spectral components, three and four complex spectral components, respectively.
The advantages of the proposed higher order technologies are that, while they are still preserving positive features of higher order analysis (i.e., a high sensitivity to system faults and an ability to suppress noise in the measured data), in contrast to the higher order spectra technologies, they could take into account statistical dependencies between all needed combinations between multiple spectral components, appearing due to a fault, regardless dependencies between their frequencies. Therefore, the technologies are not limited in combinations of spectral components that could be used for fault identification via signature analysis, and, thus, will allow fault identification of much more possible fault types, related to electromechanical systems, than the higher order spectra technologies. This advantage is obvious, as it is based on the MC, the TC, and the FC definitions (2–4).
If the proposed technologies are being applied to fault identification, then interval for the MC, the TC, and the FC is (0–1). The MC, the TC, and the FC magnitudes, closed to 0 (i.e., in cases of low correlations between multiple spectral components), are identifying no fault cases, while the MC, the TC, and the FC magnitudes, closed to unity (i.e., in cases of high correlation between multiple spectral components, that are related to a fault), are identifying fault cases.
The main novel contributions of the paper from theoretical development are data processing/fault identification technologies, the generic higher order spectral multiple correlation, the higher order spectral triple correlation, and the higher order spectral fourth correlation that are based on the multiple cross-correlation (1) of any complex stochastic variables. The intensive literature search has shown that nobody made such novel propositions.
Further novel contribution from theoretical development of the proposed technologies is made for non-stationary operation of electromechanical systems via applying various time-frequency transforms for the higher order spectral multiple cross-correlations.
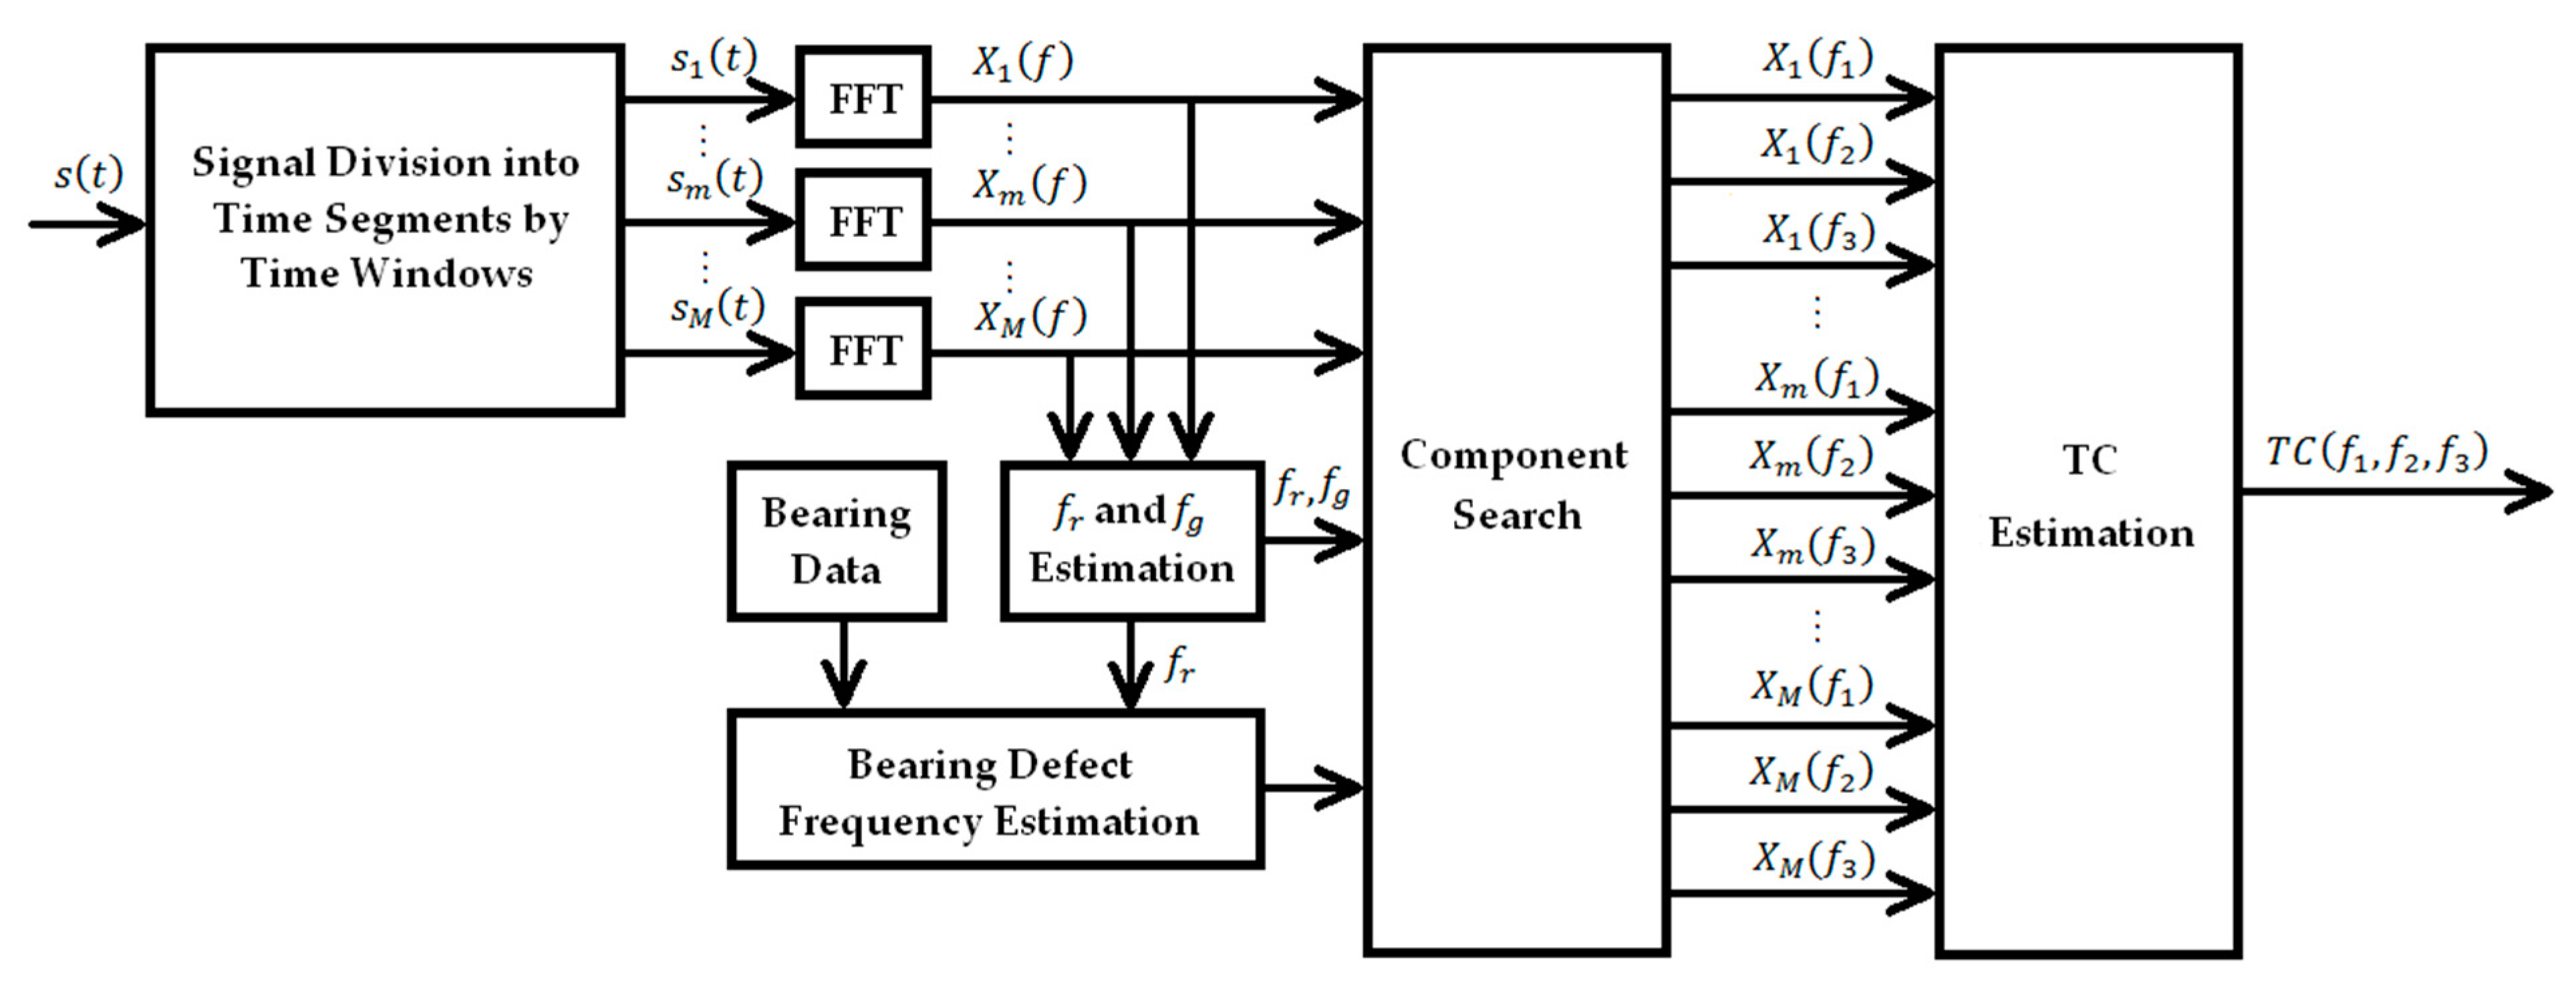
Considering application of the proposed spectral triple correlation technology to motor bearing fault identification in stationary conditions of motor operation, the complex Fourier transform is employed in Equation (3) for motor current signals. The block diagram of data processing, that realized the spectral triple correlation technology, is shown in
Figure 1, where
is time domain current signal, segment
is mth time segment,
M is the total number of segments,
m = 1,
M,
, and
are the Fourier transforms of mth segment for the selected frequencies
,
, and
respectively. The first step in estimation of the TC is to divide the digital domain motor current signal into the predefined number of time segments, using a time window. The next step is to perform the Fourier transform for each time segment and search for components with characteristic frequencies. The complex spectral amplitudes of three characteristic spectral components that are related to a specific bearing fault could be obtained from the complex Fourier spectra of motor current data. The final step is to estimate the TC of motor current data.
The characteristic frequencies of spectral components, which appear in the complex Fourier transform of motor current due to local bearing fault, are comprised [
13] of the bearing defect frequencies, the supply grid frequency, and, for some bearing local faults, also of the shaft rotation frequency. Research studies have confirmed, e.g., [
13], that spectral components, based on combinations of these characteristic frequencies, can be effectively used for identification of a variety of bearing faults in electrical motors.
Motor shaft rotation frequency
fr and supply grid frequency
fg are estimated from the power spectral density of motor current data. The bearing defect frequencies are described by the following equations [
23]:
where
is the defect frequency of rolling elements rolling over the outer ring,
is the defect frequency of rolling elements rolling over the inner ring,
is cage defect frequency,
is the defect frequency of rolling elements,
fr is a shaft rotation frequency,
is number of balls or rollers,
is diameter of balls or rollers,
is the pitch diameter of a bearing, and
is the angle of thrust.
Values of these defect frequencies are necessary in order to calculate the characteristic frequencies for the sought bearing faults.
The novel contribution from theoretical development is the estimation methodology for the proposed higher order spectral triple correlation for diagnosis of rolling element bearings via motor current signature analysis, presented in
Figure 1.
3. Technology Validation and Technology Comparison via Modelling
To validate that the proposed higher order spectral triple correlation technology could effectively diagnose faults and to compare the proposed technology with the higher order spectra, a component modelling with a fault and without a fault has been undertaken.
A generic dynamic bi-linear oscillator is widely employed for modelling of electromechanical components of industrial electromechanical systems and complex structures, e.g., for modelling of sub-harmonic resonances of offshore structures [
38], loading towers [
39], components with clearances [
40], and the following faulty components: rolling element bearings [
41,
42], gearboxes, blades, and shafts [
25,
26,
43,
44,
45,
46].
The dynamic equation of motion for the bi-linear oscillator is presented as follows [
46]:
where
x =
X/
m,
X is the displacement,
x is the normalized displacement,
,
h =
c/2
m,
h is damping,
m and
c are the mass and damping coefficient respectively,
and
are the stiffness for positive normalized displacement and the stiffness for negative normalized displacement respectively,
A =
A1/
m,
A1 is the constant amplitude of the input excitation,
A is the normalized constant amplitude of the input excitation,
is the constant angular frequency, and
is the random initial phase.
The random initial phase is uniformly distributed in the range [0; 2π]. Thus, an input random cosine excitation with constant amplitude, random initial phase, and constant frequency is exciting the bi-linear oscillator, as shown in Equation (9).
Equation (6) presents faulty and pristine components under the stationary random excitation. For the faulty components, the stiffness for positive normalized displacement and the stiffness for negative normalized displacement are different and a fault severity is presented by the fault severity ratio,
The resonance frequency of the faulty component is as follows [
46]:
For pristine components, the stiffness for positive normalized displacement and the stiffness for negative normalized displacement are the same and the resonance frequency of the pristine component is
[
46].
250 time domain realizations for the faulty component (i.e., the fault severity ratio is 5%) and 250 time domain realizations for the pristine component (i.e., fault severity ratio is 0) were generated via modelling of bi-linear oscillator, for validation of the proposed technology and comparison with the higher order spectra. The resonance frequency of the bi-linear oscillator without a fault is 14 Hz. According to Equation (10), the resonance frequency of the bi-linear oscillator with a fault is 13.82 Hz for the fault severity ratio of 5%; damping is 2.45.
For modelling of data, related to the faulty and the pristine components, the excitation frequencies are equal to the two resonance frequencies of faulty and the pristine components respectively. Duration of each simulated realization is 5 s. The Gaussian white noise was added to each realization in order to more closely simulate early stage of a fault. The signal to noise ratio is 30 dB. The sampling frequency is 210 Hz.
The following parameters and functions are employed for spectral triple correlation evaluation: segment size is 0.33 s, the frequency resolution is 3 Hz, number of non-overlapping segments on the duration of the simulated realizations is 15, time window is the Hamming window, and overlapping of segments is 50%.
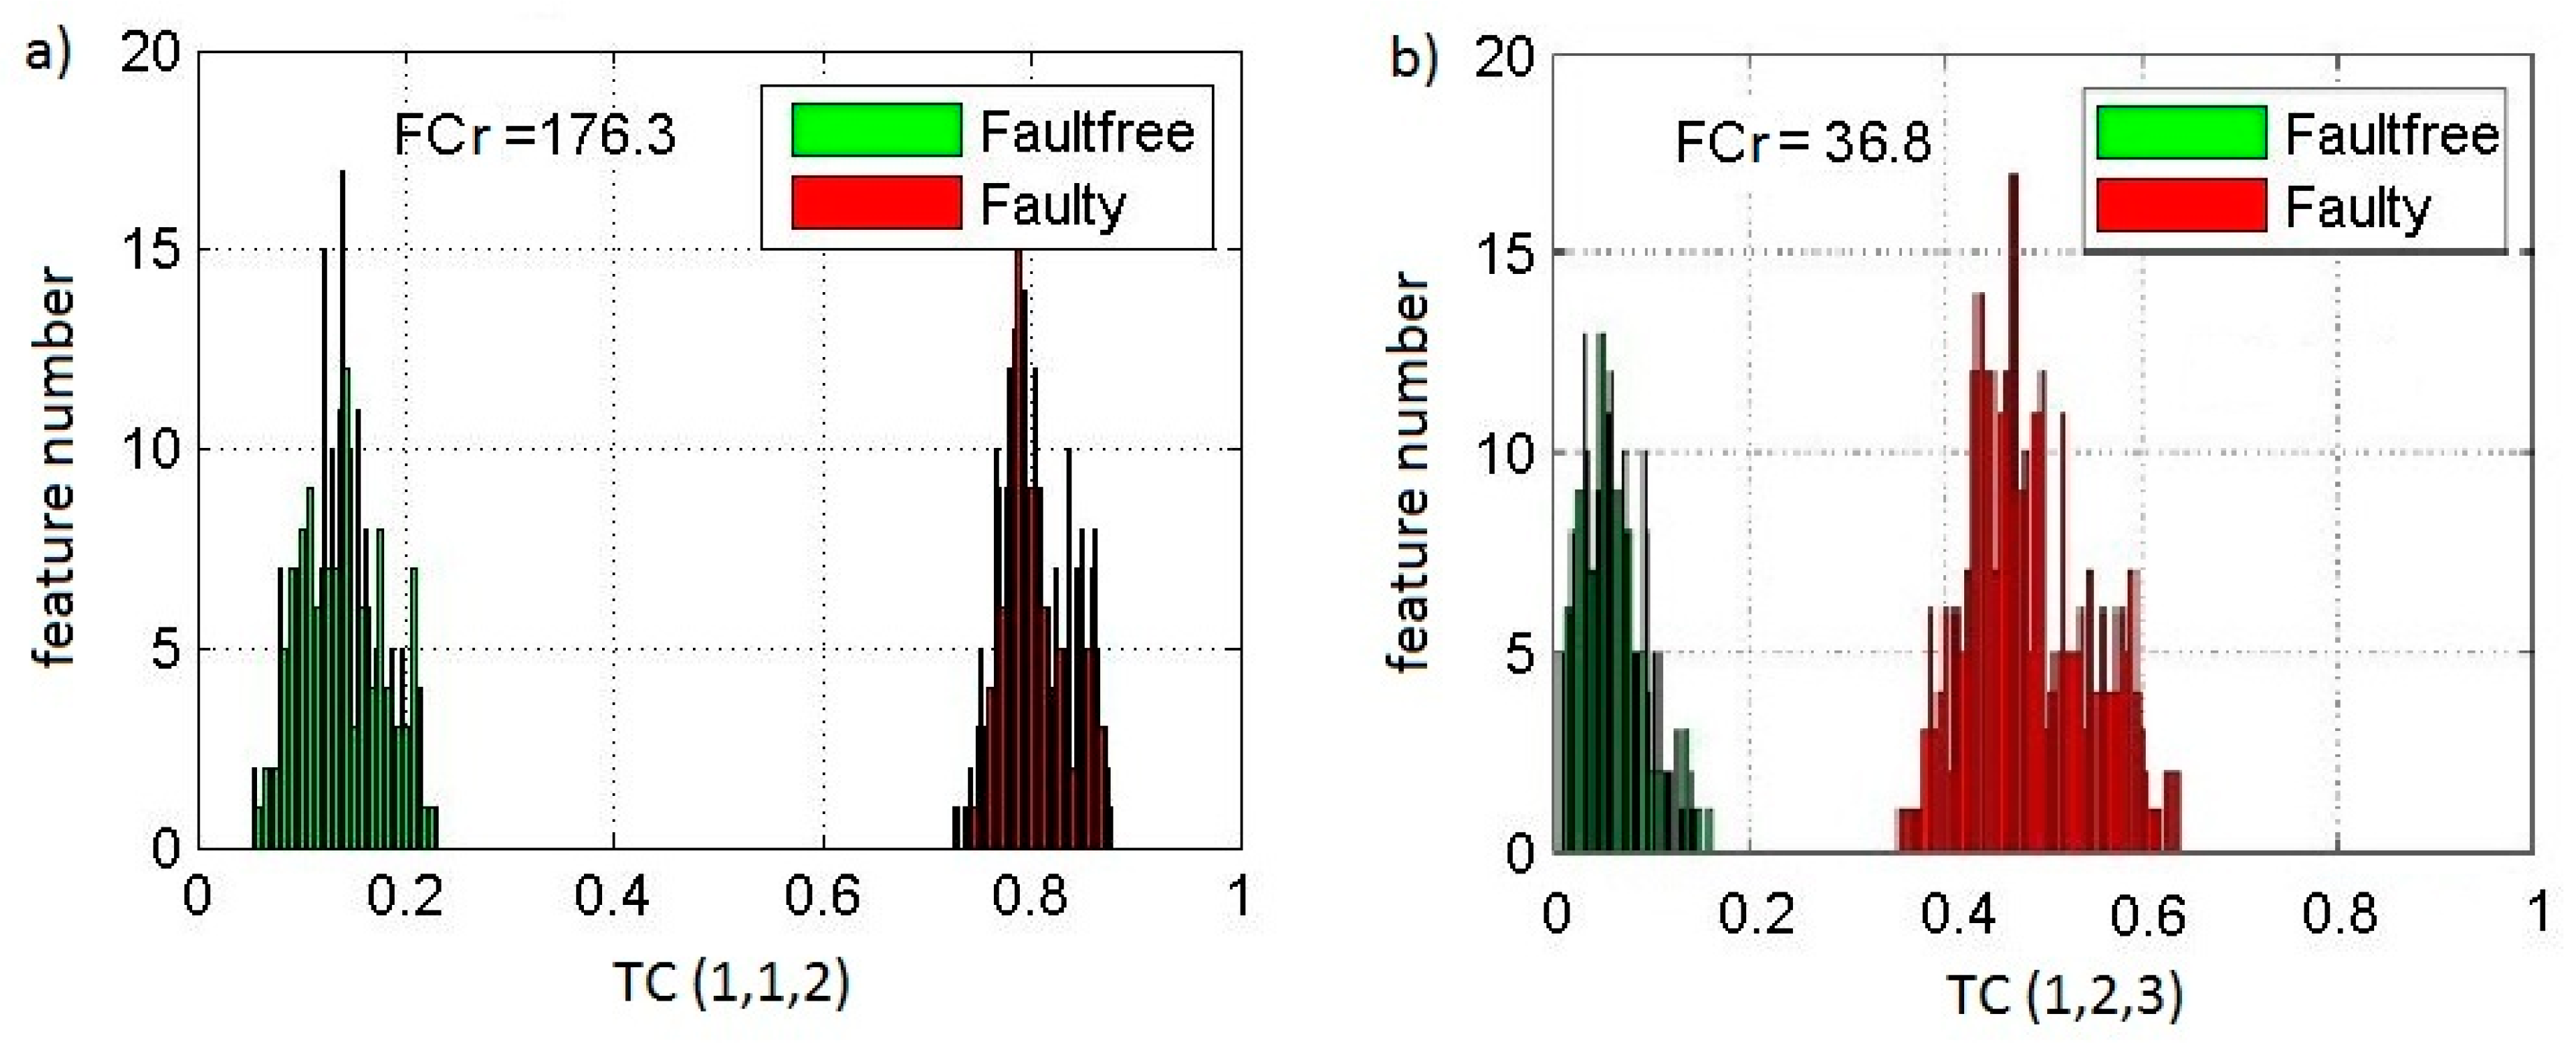
The following higher order spectral triple correlations were estimated, using the modelling data from the faulty and the pristine components: the triple correlation TC (1,1,2) and the triple correlation TC (1,2,3). The triple correlation TC (1,1,2) is estimated for three harmonics, according to Equation (3): the fundamental harmonic of component resonance oscillations, that is used two times, and the second harmonic of component resonance oscillations. The triple correlation TC (1,2,3) is estimated also for the three harmonics, according to Equation (3): the fundamental harmonic of component resonance oscillations, the second harmonic of component resonance oscillations and the third harmonic of component resonance oscillations.
As detection features, the magnitudes of the triple correlation TC (1,1,2) and the magnitudes of the triple correlation TC (1,2,3) are employed. The histograms of the detection features, the magnitudes of the triple correlation TC (1,1,2) and the magnitudes of the triple correlation TC (1,2,3), are shown in
Figure 2a,b, respectively.
It is observed from
Figure 2 that values of the detection features are higher for the faulty component compared with the pristine component, because, for the faulty component, it is a higher level of correlation of resonance spectral harmonics that are appearing due to a fault, compared with the pristine component. The histograms of the detection features display a full separation between the proposed detection features from the faulty and pristine components. Therefore, the estimates of the complete probabilities of correct detection are 100% and 100% for the considered two detection features. High values of the complete probabilities, obtained for the triple correlation TC (1,1,2) and the triple correlation TC (1,2,3), prove high detection effectiveness of the proposed technology.
Detection effectiveness of the proposed techniques is also evaluated by the one-dimensional Fisher criterion (FCr) [
47] that is widely employed for detection effectiveness evaluation for one-dimensional features [
47,
48,
49] and allows estimating the quality of separation between detection features for the faulty and the pristine cases:
where
and
are the mean values of the detection features for the pristine and the faulty components respectively;
and
are variances of the detection features for pristine and faulty components, respectively.
The obtained values of the FCr are 176.3 and 36.8 for the magnitudes of the triple correlation TC (1,1,2) and for the magnitudes of the triple correlation TC (1,2,3), respectively. The mean values for the magnitude of triple correlation TC (1,1,2) and the magnitude of triple correlation TC (1,2,3) are 0.8 and 0.54 for the faulty component and 0.14 and 0.074 for the pristine component, respectively.
High values of the FCr, obtained for the triple correlation TC (1,1,2) and the triple correlation TC (1,2,3) also prove high detection effectiveness of the proposed technology.
For comparison via modelling of fault detection effectiveness for the proposed technology and the higher order spectra technology, the Fourier bicoherences are employed, that are described by the following equation [
24]:
where
is the complex Fourier transform of motor current signal at frequency
,
is the complex Fourier transform of motor current signal at frequency
,
is the complex Fourier transform of motor current signal at frequency
, and |…| is the absolute value operator.
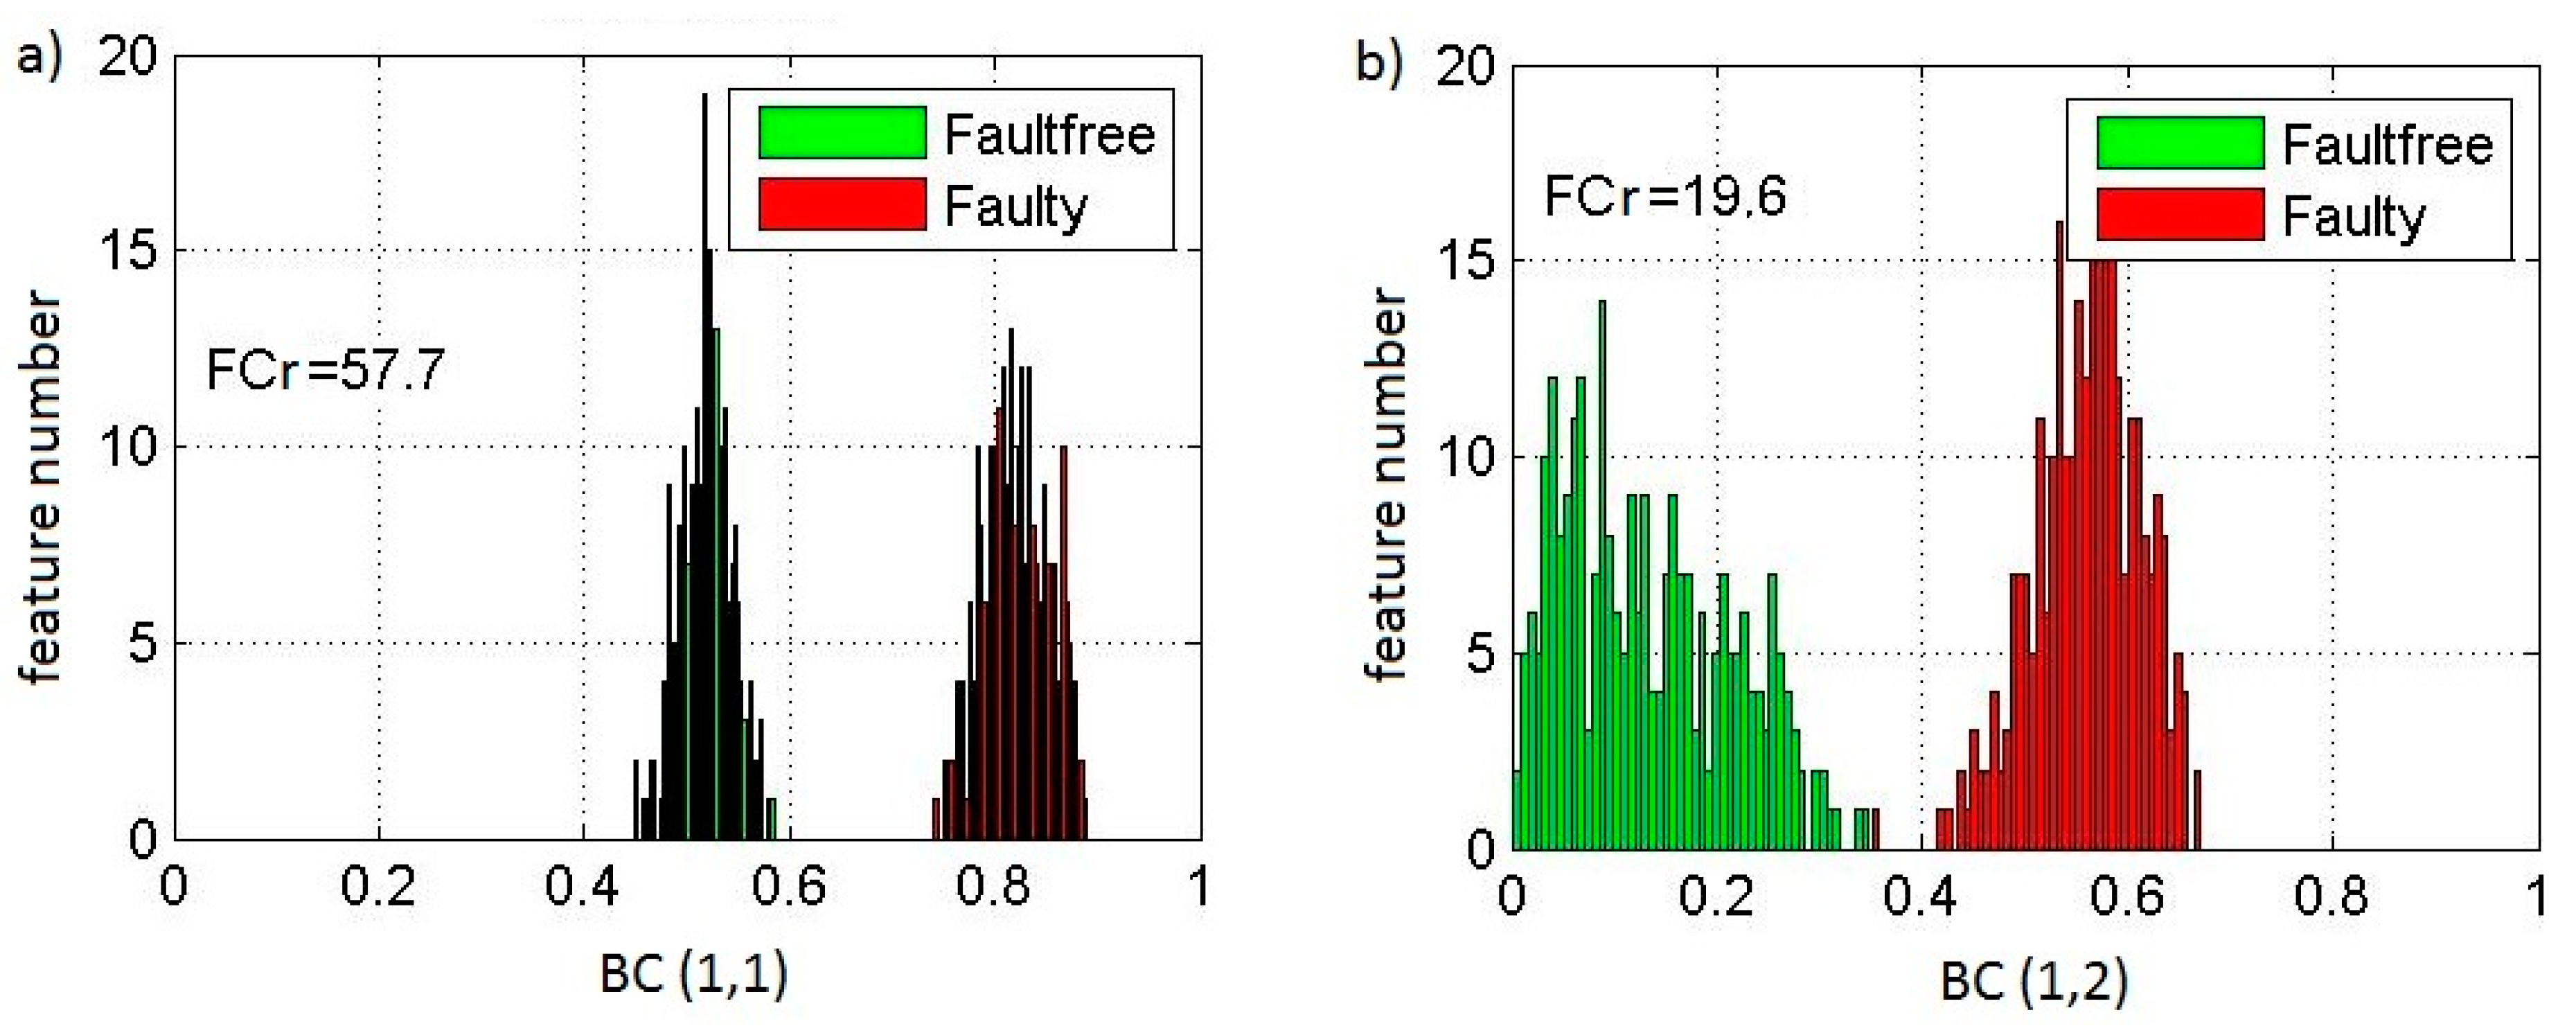
The bicoherence BC (1,1) is estimated for three harmonics, according to Equation (12): the fundamental harmonic of component resonance oscillations, that is used two times, and the second harmonic of component resonance oscillations. The bicoherence BC (1,2) is estimated also for the three harmonics, according to Equation (12): the fundamental harmonic of component resonance oscillations, the second harmonic of component resonance oscillations, and the third harmonic of component resonance oscillations.
The bicoherence BC (1,1) and the bicoherence BC (1,2) are estimated for the same 500 simulated realizations for the pristine and the faulty components, using the same parameters and functions that are used for the triple correlation TC (1,1,2) estimation and the triple correlation TC (1,2,3) estimation. It should be noted that the triple correlation TC (1,1,2) and the bicoherence BC (1,1) and the triple correlation TC (1,2,3) and the bicoherence BC (1,2) are estimated respectively for the same harmonics of component resonance oscillations. The histograms of the detection features, the magnitudes of the bicoherence BC (1,1), and the magnitudes of the bicoherence BC (1,2), are shown in
Figure 3a,b, respectively.
These histograms also display a full separation between the bicoherence detection features from the faulty and pristine components. However, the obtained values of the FCr for detection features, the magnitudes of the bicoherence BC (1,1), and the magnitudes of the bicoherence BC (1,2), are 57.7 and 19.6, respectively. The values of the FCr, obtained for the magnitudes of the bicoherence BC (1,1) and the magnitudes of the bicoherence BC (1,2), are much less, than the appropriate values of the FCr for the proposed detection features, the magnitudes of the triple correlation TC (1,1,2), and the magnitudes of triple correlation TC (1,2,3), respectively.
The mean values for the magnitude of the bicoherence BC (1,1) and the magnitude bicoherence BC (1,2) are 0.82 and 0.52 for the faulty component and 0.54 and 0.13 for the pristine component, respectively.
Identification effectiveness (
Table 1) of the proposed detection features and the bicoherence detection features is shown below.
It is known [
47] that a detection feature with higher values of the FCr provides better detection capability. The detection effectiveness gain is evaluated as the ratio of the Fisher criteria for the proposed techniques to the respective Fisher criteria for the bicoherence techniques. The proposed techniques provide the essential detection effectiveness gains: 3.1 for comparison of the proposed technique TC (1,1,2) with the bicoherence BC (1,1) and 1.9 for comparison of the proposed technique TC (1,2,3) with the bicoherence BC (1,2) for early fault stage: the fault severity ratio of 5%, and in a noisy environment. Thus, the comparison of the technologies by modelling shows the higher detection effectiveness of the proposed technology over the bicoherence technology.
The novel contribution from theoretical development is the identification feature, the triple correlation TC (1,1,2), that is not developed in the classical multivariate analysis. This identification feature is successfully validated via modelling.
4. Experimental Setup
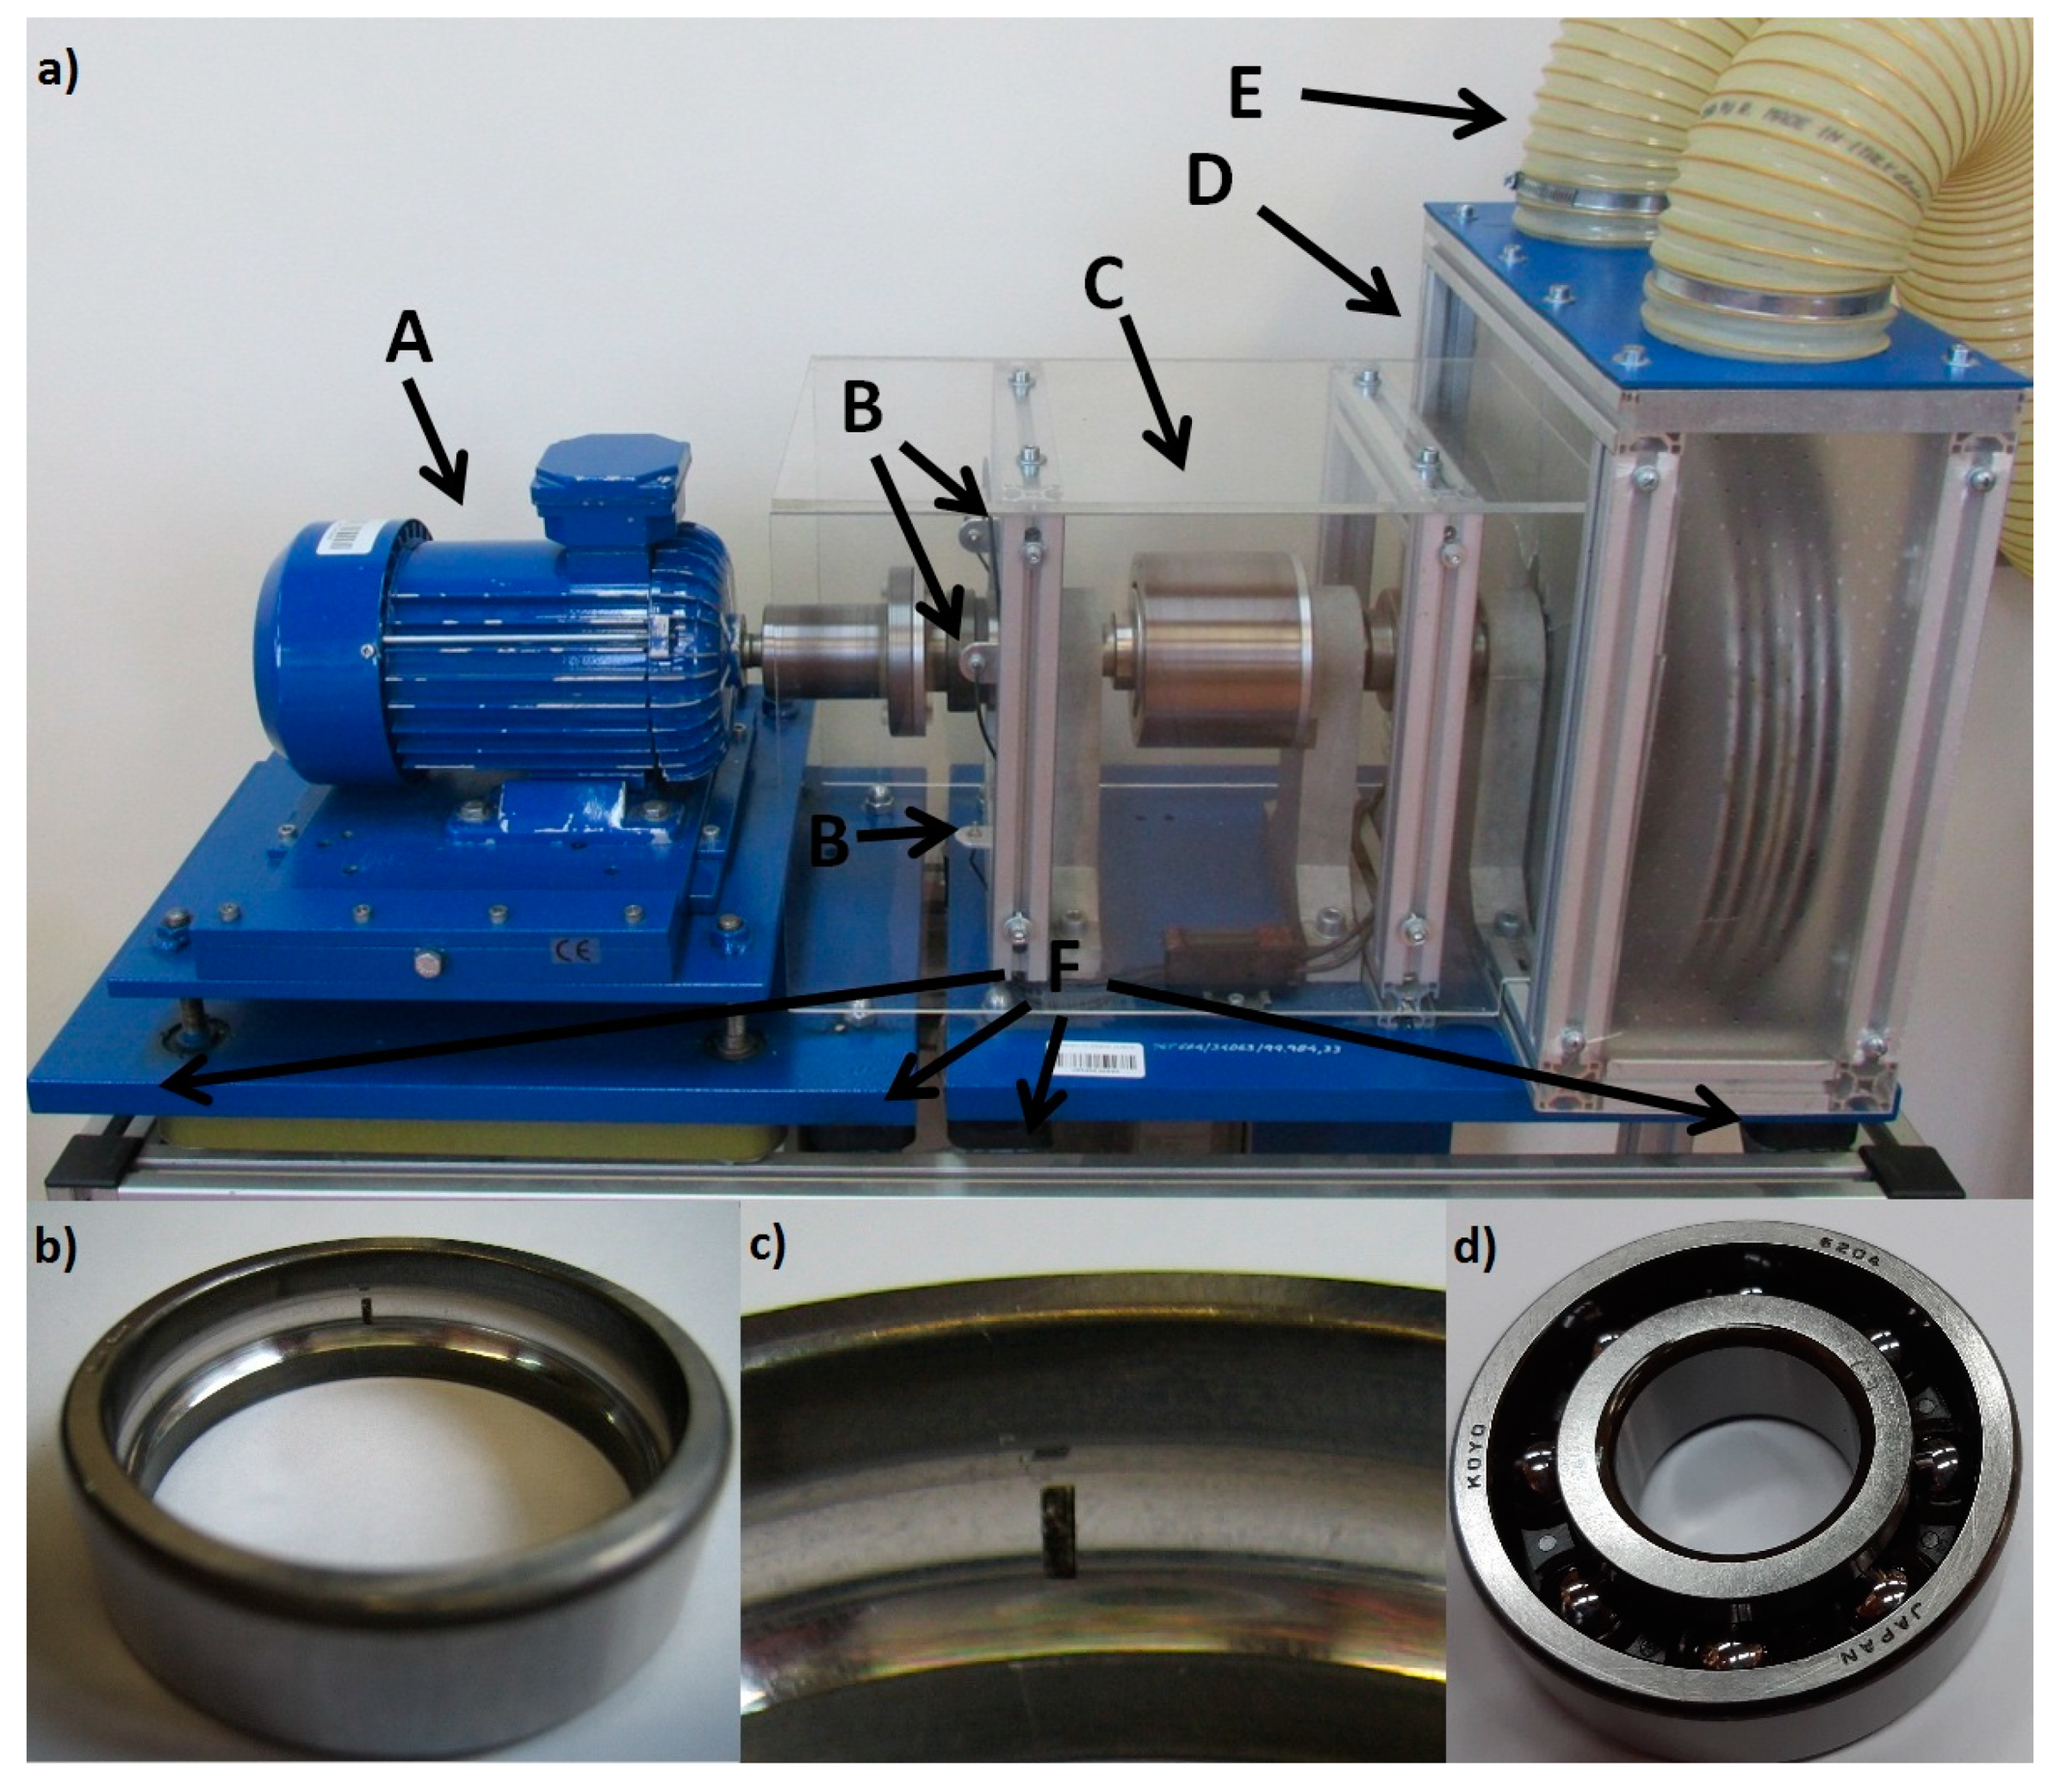
The laboratory test rig is shown in
Figure 4a, where arrow A directs to motor, arrows B direct to laser sensors, arrow C directs to magnetic coupling, arrow D directs to electromagnetic brake, arrow E directs to cooling hoses, and arrows F direct to vibration isolation pads. The induction motor, used for experimental tests, is a three phase Cantoni motor, Sh 80X-4C model, the nominal power is 1.1 kW, the nominal voltage is 400 V, the nominal rotational speed is 1380 RPM, the power factor is 0.76, the nominal current at full load is 2.9 A, and the weight is 11 kg. The motor was supplied directly from 50 Hz three phase supply grid, with 400 V nominal voltage.
All experimental tests were carried on 6204C3 Koyo open deep groove ball bearings (
Figure 4d) without seals, made from steel 52,100; outside diameter 47 mm, inside diameter 20 mm, width is 14 mm, and weight 106 g. The inner and the outer races of the bearings are hardened for an extended life and a wear protection.
Motor current captures were made for two bearing conditions: without fault in both shaft bearings and with the introduced local fault to the outer race of one shaft bearing. The introduced bearing outer race fault (
Figure 4b,c) is a local fault across the bearing rolling direction with fault length of 3 mm, fault depth of 0.7 mm, and fault width of 1 mm. The non-dimensional fault severity ratio of the outer race fault is 0.78% of the circumference [
18]; thus, it is an early stage of bearing local fault development. The essence of bearing fault identification is to identify a fault at an early stage of its development.
The laboratory test rig design is eliminating factors that could negatively influence the accuracy of motor current data. Special vibration isolation pads were installed underneath of the motor to damp the ambient vibrations and to reduce transfer of load vibrations to the tested motor through test rig construction base. Motor current data capture for the faulty bearing and the pristine bearing require disassembly and reassembly of a motor shaft. These procedures are normally causing motor shaft misalignment and, therefore, motor current data inaccuracy due to the misalignment.
To improve current data accuracy, an adjustment of a test rig, that is improving quality of the current capturing system, was made by installing into the system a special laser shaft alignment sub-system. Two accurate laser emitters and receivers were installed in X and Y axes in a midpoint of a motor shaft. Laser beams were directed tangentially to the shaft in both axes. If a misalignment occurred, laser beams were deflected. Special alignment screws were used to accurately adjust (align) a motor shaft to a load shaft.
Another important factor that could negatively affect accuracy of motor current data is load torque oscillations. In the literature, e.g., [
16], the most commonly used load is an electrical generator. The two main issues, arising from generator load application, are load vibration frequencies that could be very similar to the motor bearings defect frequencies, and load torque oscillations that are easily transferred via motor shaft to tested motor bearings. Due to these issues, it is uncertain whether motor vibrations are sourced from the bearing under identification or not.
To eliminate these issues, two adjustment solutions for the test rig that improve quality of the current capture system were implemented. The first adjustment solution was to use as a load an electromagnetic break, instead of a generator, that was installed into a test rig. Break torque oscillation frequencies are essentially different from motor bearing defect frequencies. The second adjustment solution was to isolate load shaft vibrations by a special magnetic coupling between a motor shaft and a load shaft. Besides isolation from vibrations, this coupling smoothens the load torque. The above-mentioned adjustment solutions were properly isolating the motor from external vibrations, including the load torque oscillations.
The system was prevented from an external magnetic field by special shielding cover in order to reduce current data inaccuracy due to external magnetic field. The self-noise of a complete current capture system was below −120 dB and flat in the analyzed frequency range.
To capture motor current, a special transducer is designed and manufactured. The main components of a transducer are a current transformer that is wound on a high-quality ferrite core, and a special low noise amplifier. A transformer works with the forced current; current flows through transformer primary winding. The transducer was powered by batteries to avoid errors due to fluctuations of the power grid voltage and frequency.
Voltage, that is linearly proportional to motor current signal from the transducer, was converted into digital domain by an analogue-digital data acquisition card.
5. Experimental Technology Validation and Technology Comparison
Fault identification results are obtained through digital data processing of captured motor current signals. Current signals were captured during 65 s of a stationary operation of a motor in order to obtain 13 non-overlapping time segments of 5 s and 11 non-overlapping time segments of 5.75 s for TC estimation. The sampling frequency was 65 kHz; the Blackman time window was employed for each time segment. Signal was captured for a motor with one pristine bearing and one the faulty bearing and signal was captured for two pristine bearings.
As the faulty bearing has an outer race fault, the following characteristic frequencies related to outer race fault and combined of bearing outer race defect frequency
and supply frequency
[
13] are used for TC estimation:
,
,
. Thus, the higher order spectral triple correlation, based on the complex Fourier transform and selected for experimental trial, has the same structure as the higher order spectral correlation TC (1,2,3), investigated in modelling trials in
Section 3.
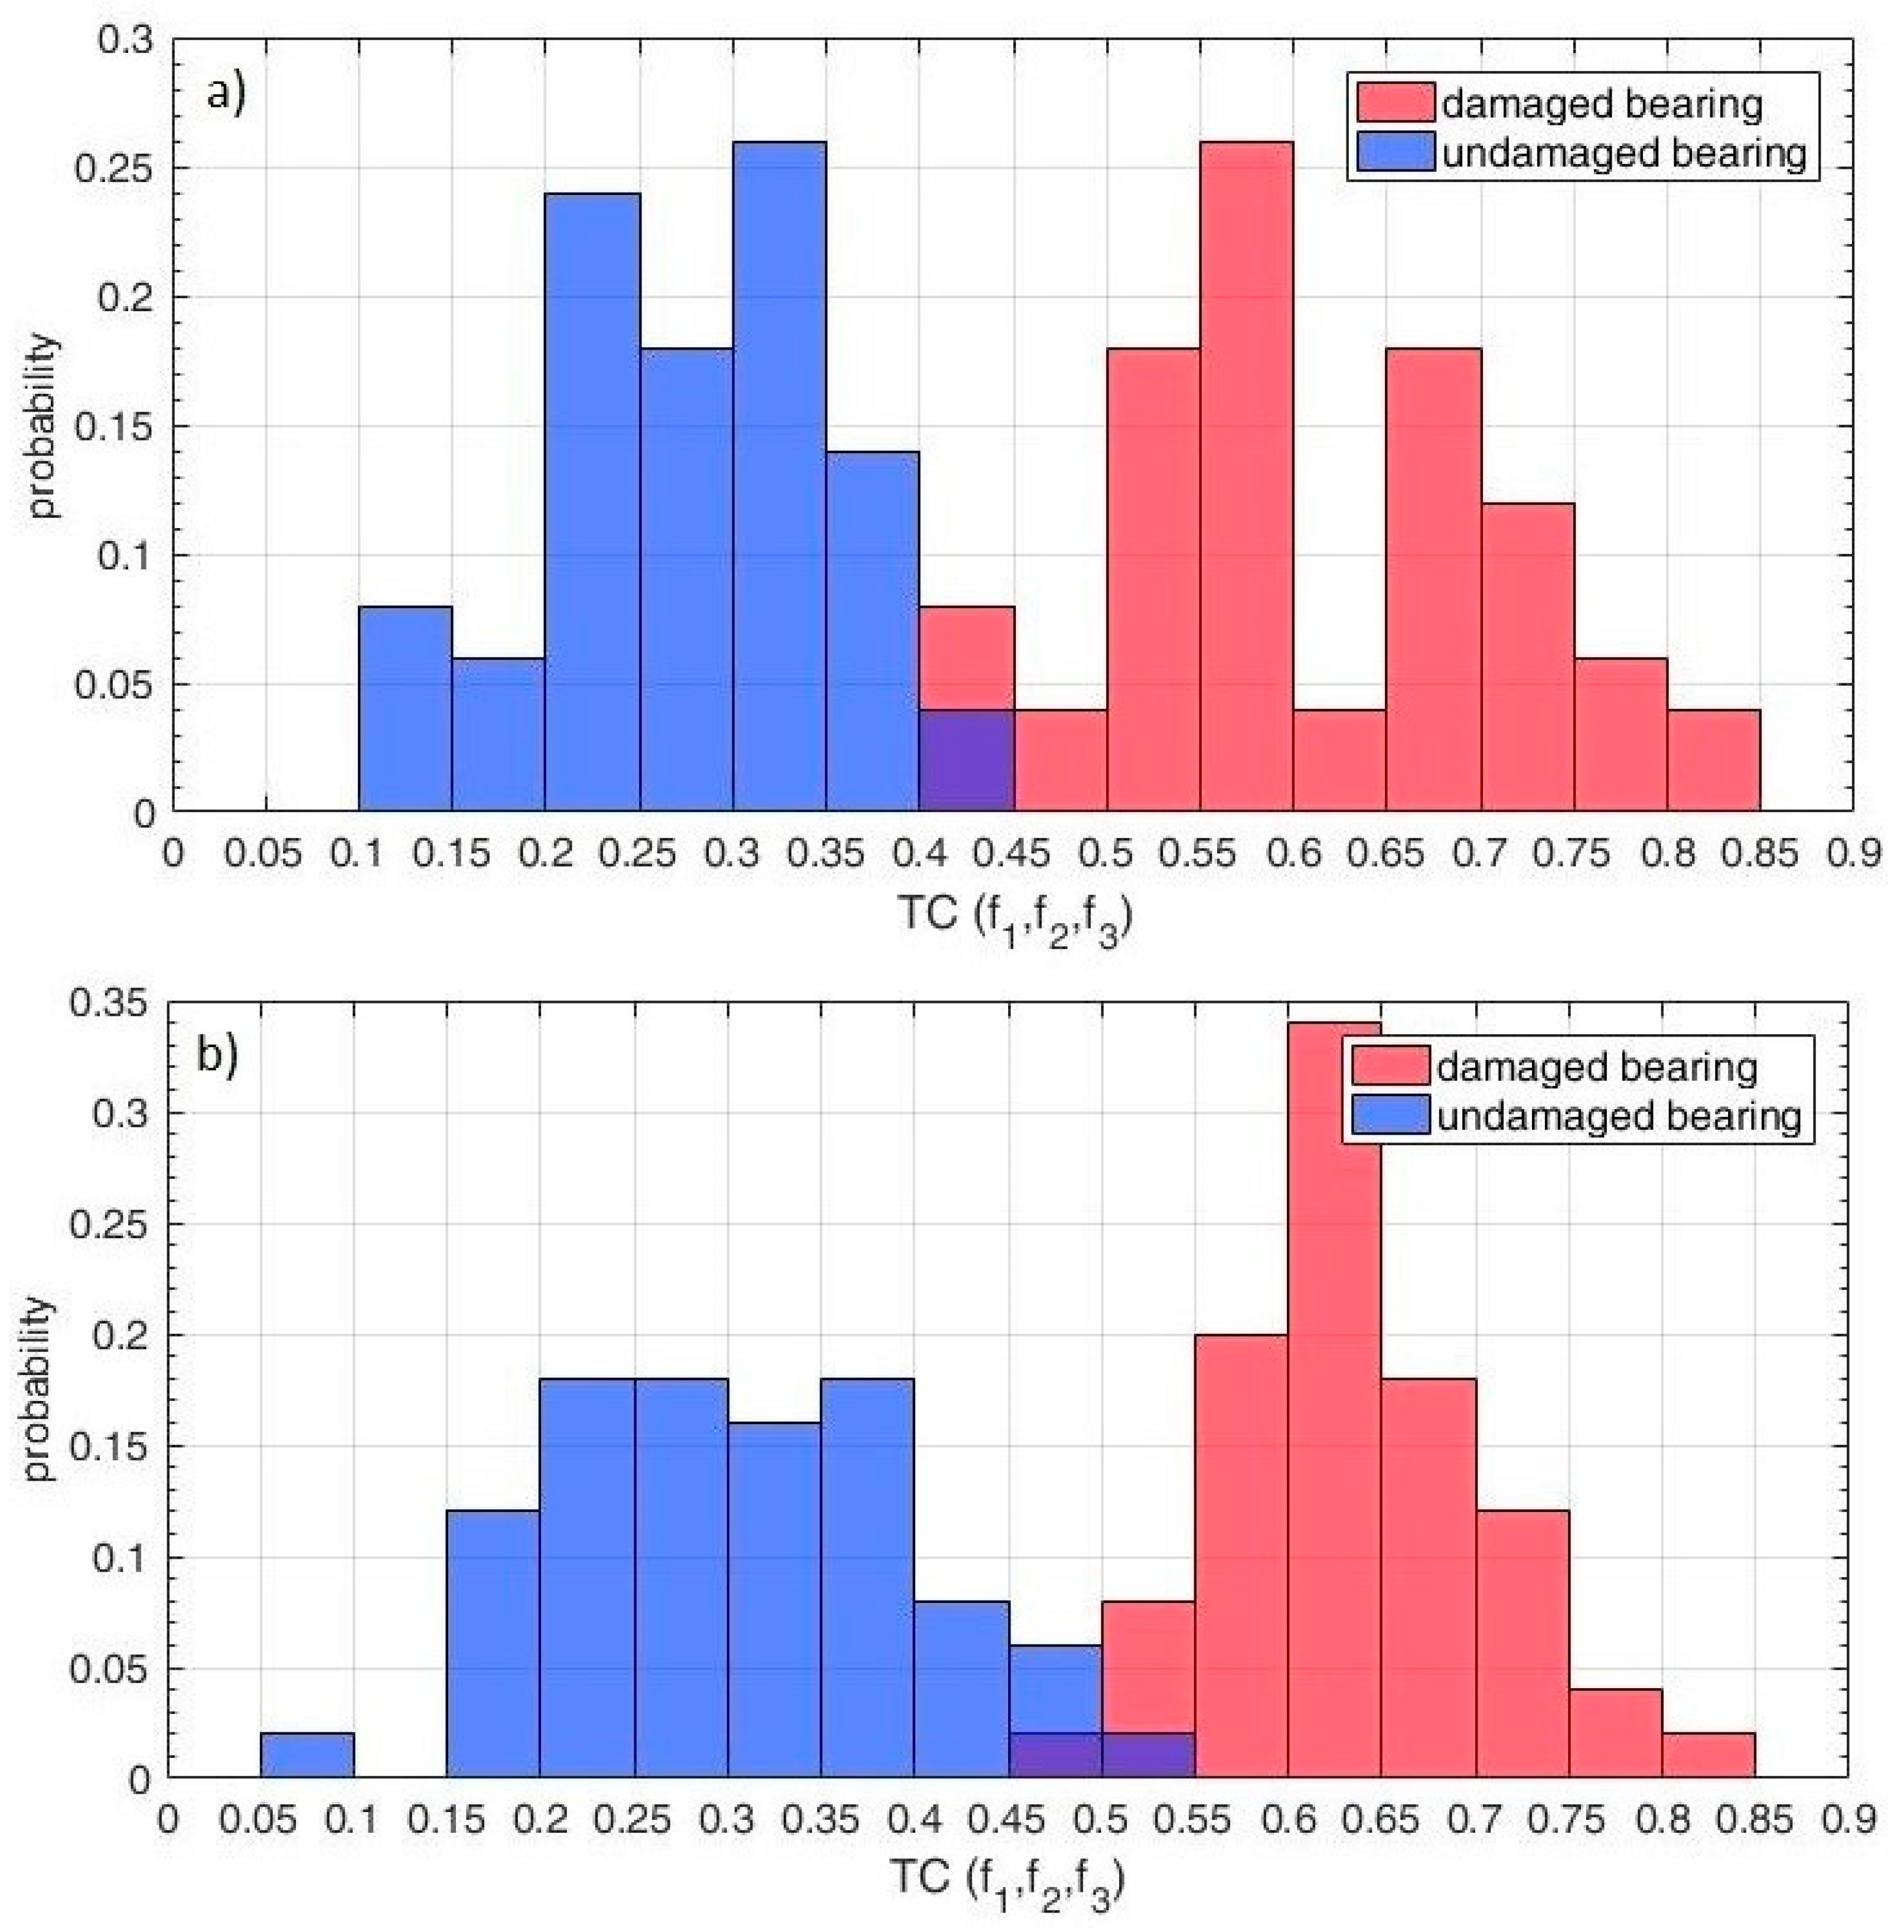
The histograms (
Figure 5) of identification features, the magnitudes of the spectral triple correlation TC for the two pristine bearings conditions and for the one pristine bearing and one faulty bearing conditions, are obtained from the experimental trials for 5-s and 5.75-s segment sizes. It is observed that values of the identification features are higher for the one pristine bearing and one faulty bearing compared with two pristine bearings, because the faulty bearing has a higher level of spectra triple correlation of characteristic spectral components, generated by the fault, compared with the two pristine bearings.
These histograms also show almost full separation between the identification features from the faulty bearing and the pristine bearings. Although it is clear from the histograms, that fault identification for bearing by the TC is successful, the effectiveness of the proposed technology is also evaluated by estimates of the complete probability of the correct fault identification and by the FCr.
The estimate of the complete probability of correct fault identification is as follows:
where
N and
pN are the total numbers of correct identifications for faulty bearing and pristine bearing, respectively;
Nt and
pNt are the total numbers of identification features for faulty bearing and pristine bearing respectively.
For decision-making for one-dimensional identification feature, a threshold-based decision-making rule is employed via the Bayesian criterion [
47].
One-dimensional identification feature, the TC, is employed and the estimates of the probability density functions of these features (
Figure 5) are clearly unimodal for the faulty and the pristine conditions. The simulation results confirm the unimodality of the probability density functions of the TC identification features (
Figure 2). Therefore, taking into account the unimodality property of the estimates of the probability density functions of the TC feature, a very simple and effective threshold-based decision-making rule [
47,
50,
51,
52,
53] is used.
This decision-making rule is effective and sufficient only for one-dimensional identification features with the unimodal probability density functions and it is not intended to be the most accurate method for all possible types of probabilities density functions even for one-dimensional identification features (e.g., multimodal probabilities density functions with multiple modes). However, for the unimodal probabilities density functions of one-dimensional identification features, it provides the same (not better) identification effectiveness, as more complicated the support vector machine (SVM), neural network, the nearest neighbors, etc.
The advantage of the threshold-based decision-making rule is, that the computational complexity of this rule is the lowest, comparing with other decision-making methods (e.g., the SVM, neural network, the nearest neighbors, etc.). This is an important advantage for various industrial applications of the proposed technology.
The estimates of the complete probability of correct fault identification and the FCr, evaluated by using 100 fault identification features, are 96% and 6.7, respectively, for segment size 5 s and 97% and 7.8, respectively, for segment size 5.75 s. Thus, the estimates of the complete probability of incorrect bearing fault identification are 4% and 3% respectively for segment size 5 s and for segment size 5.75 s. All these estimates confirm successful bearing fault identification by the TC technology.
For experimental comparison of bearing fault identification effectiveness between the proposed technology and the higher order spectra technology, the bicoherence [
24] is used that is higher order spectra technology of order 3. The bicoherence (Equation (12)) was estimated for the same captured signals
and
of the motor current and for time segment length of 5 s. As the bicoherence depends only on two frequencies,
and
, it was calculated for three characteristic frequency combinations: (1)
,
, (2)
,
, and (3)
,
. Therefore, the bicoherence selected for experimental trials has the same structure as the bicoherence B (1,2) investigated in modelling trials in
Section 3.
The bicoherence magnitude is used for bearing fault identification. The best identification results are achieved for the above option (3) of characteristic frequency combination.
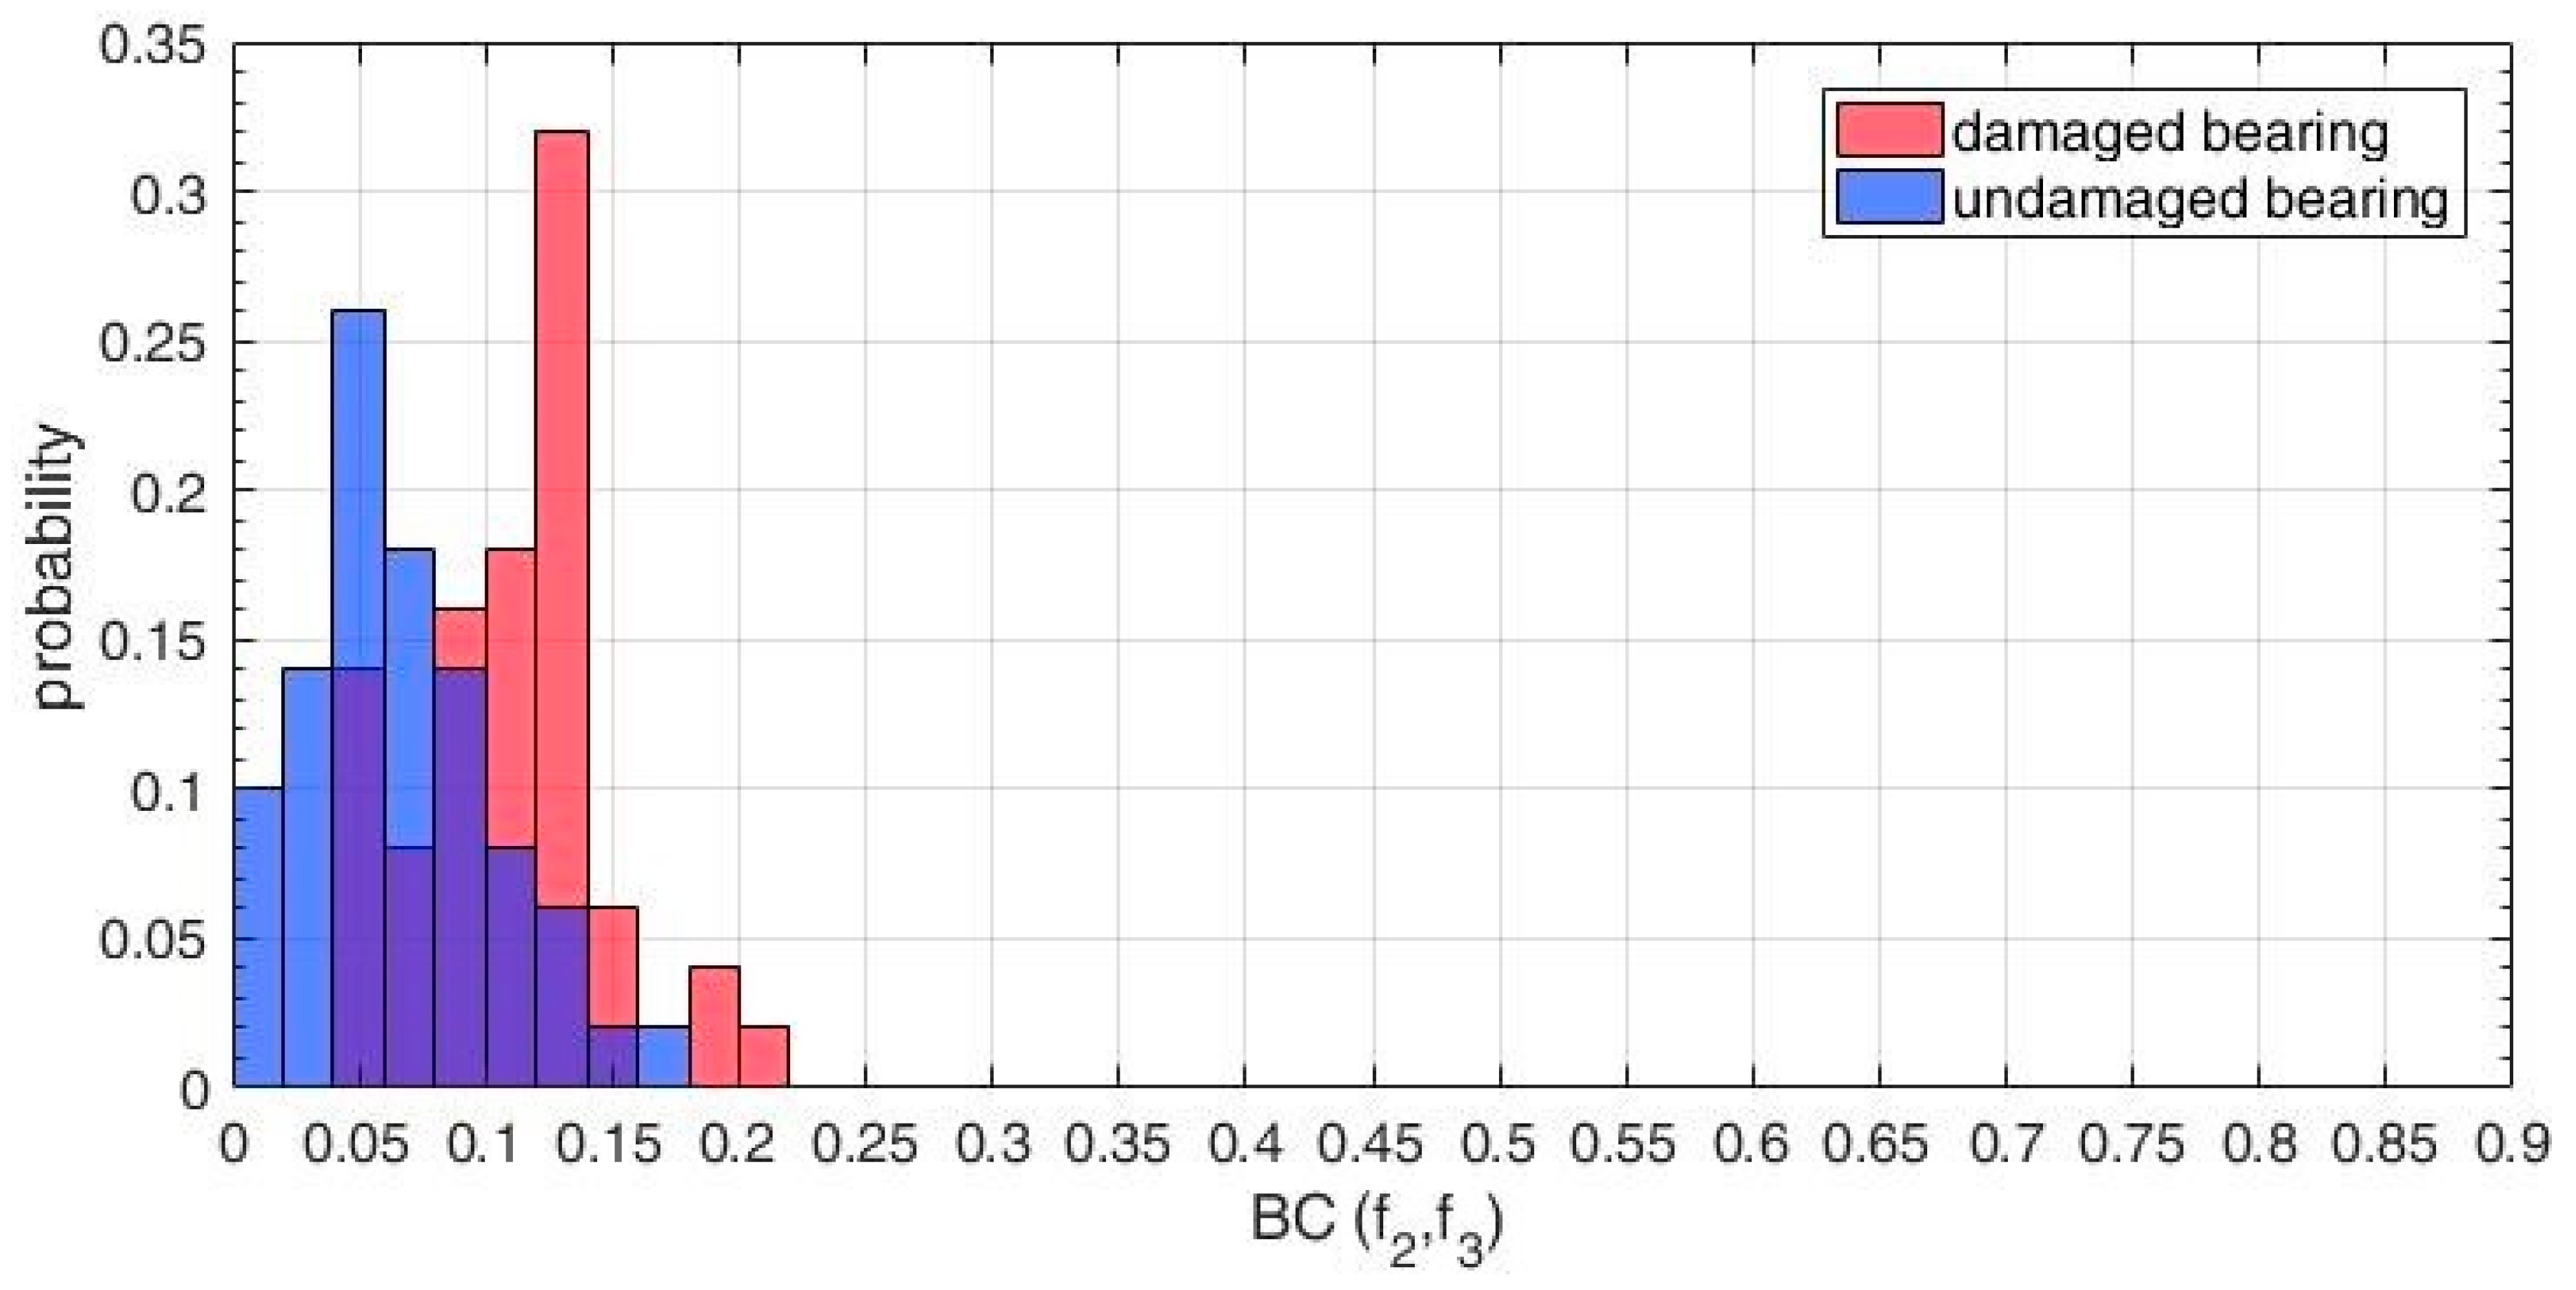
The histograms (
Figure 6) of identification features, the magnitudes of the bicoherence BC for the pristine, and the faulty bearing conditions are also obtained from the experimental trials. It is observed that values of the bicoherence identification features are higher for the faulty bearing compared with the pristine one, because the faulty bearing has a higher level of bicoherence of characteristic spectral components, generated by the fault, compared with the pristine bearing.
However, these histograms show essential overlapping between the bicoherence identification features from the faulty bearing and the pristine bearing. The effectiveness of the proposed technology is also evaluated by estimates of the complete probability of the correct fault identification and by the FCr. The estimates of the complete probability of correct identification and the FCr, evaluated by using 100 fault identification features, are 74% and 0.7, respectively; thus, the estimate of the complete probability of incorrect bearing fault identification is 26%. Identification effectiveness (
Table 2) of the proposed detection features and the bicoherence detection features is shown below.
To compare the TC technology and the bicoherence technology, both the estimates of the complete probability of incorrect bearing fault identification and the FCr were used. The effectiveness gain in the complete probability of incorrect bearing fault identification that is a ratio of the estimate of the complete probability of incorrect bearing fault dentification by the bicoherence technology to the estimate of the complete probability of incorrect bearing fault identification by the TC technology (the estimate of the complete probability for 5 s segment size is used) is 6.5. The effectiveness gain in the FCr, that is a ratio of the FCr, achieved by the TC technology to the FCr achieved by the bicoherence technology (the FCr for 5 s segment size is used), is 9.6.
The experimental fault identification effectiveness results and the preliminary experimental comparison of identification results confirm and match with the identification effectiveness results and the technology comparison results via modelling, presented in
Section 3, and clearly shows the higher bearing fault identification effectiveness by the proposed technology over the bicoherence technology. Thus, the TC data processing for motor bearing fault identification is far more effective in comparison to the bicoherence data processing.
Very serious limitation of the higher order spectra is related to selection of analyzed frequencies: i.e., in the case of the bicoherence, the highest analyzed frequency must equal to sum of two lower frequencies. The characteristic frequencies, chosen as important for fault identification, are not always fulfil the requirements of the bicoherence definition. This limitation usually has a very negative influence on quality of fault identification and limits fault types that could be effectively diagnosed by the higher order spectra.
The proposed technology allows analysis of any combination between freely chosen three spectral components; therefore, this technology significantly extends capabilities of the higher order spectra. As it is shown here, the proposed technology is also more effective than the higher order spectra, for early bearing fault identification. One of the important achievements of the proposed research is experimentally obtained high effectiveness level of identification of motor bearing local fault at very early stage: the fault severity ratio is 0.78%.
The superiority of the bicoherence technology over the second order transforms for fault identification at early stage is well known and described in multiple works, e.g., [
24,
25,
26,
27], related to fault identification by the bicoherence. The main reason of that superiority is that, unlike the traditional and novel second order techniques (e.g., the Fourier transform, the wavelet transform, the Wigner–Ville distribution, etc.), the bicoherence is employing simultaneously three spectral components, generated by a fault, in contrast to the second order techniques that are employing single spectral components. Therefore, the bicoherence is considering simultaneous interactions between these three spectral components: i.e., the quadratic phase coupling. The simultaneous use of three spectral components and the simultaneous interactions between these components provides an advantage of the bicoherence, comparing with the second order techniques, in terms of early fault identification. Another important advantage of the bicoherence, comparing with the second order techniques, is its ability to suppress noise in data [
24] and, thus, to improve the effectiveness of early fault identification in presence of noise.
Finally, it is shown in the present work by the modelling trials and by the experimental trials that the proposed higher order spectral triple correlation is superior over the bicoherence for local fault identification for motor bearings.
Considering all above-mentioned comparisons, it is concluded here on superiority of the proposed technology over the second order technologies and the bicoherence technology for fault identification in motor bearings via motor current signature analysis.
Future experimental validation of the proposed technologies is planned via test rig and in-field conditions for higher rotation speeds and variable loads, smaller fault severities (e.g., 0.25–0.5%), and less isolated components and systems.
6. Conclusions
It is proposed for the first time in worldwide terms new fault identification technologies, the generic higher order spectral multiple correlation of order n and particular technologies, the higher order spectral triple correlation and the higher order spectral fourth correlation of order 3 and 4, respectively, for stationary and non-stationary random signals, related to stationary and transient operations, respectively, of electromechanical systems. The higher order spectral triple correlation is applied for motor fault identification by motor current signature analysis.
The main novel contributions of the paper from theoretical development are the novel data processing/fault identification technologies, the generic higher order spectral multiple correlation, the higher order spectral triple correlation, and the higher order spectral fourth correlation. The intensive literature search has shown that nobody made such a novel proposition.
Further novel contribution from theoretical development of the proposed technologies is made for non-stationary operation of electromechanical systems via applying various time-frequency transforms for the higher order multiple cross-correlations.
Validation via modelling of 500 signals has shown that the spectral triple correlation technology successfully detects faults. The estimates of the complete probabilities of correct fault detection are 100% and 100% and the Fisher criteria are 176.3 and 36.8 for the proposed two detection features for early local fault: the fault severity ratio is 5% and in a noisy environment: the signal to noise ratio is 30 dB. The novel comparison of the proposed technology and the higher order spectra via modelling shows the higher fault identification effectiveness by the proposed technology over the bicoherence technology. The effectiveness gains in the Fisher criterion are 3.1 and 1.9 for the proposed two detection features.
The novel contribution from theoretical development is the identification feature, the triple correlation TC (1,1,2), that is not developed in the classical multivariate analysis. This identification feature is successfully validated via modelling.
The test rig, consisting of a motor/break assembly, was used for experimental trials of the proposed technology for two conditions of motor shaft operation with: (1) two pristine bearings, (2) one pristine, and one faulty bearing.
The novel contribution from theoretical development is the estimation methodology for the proposed higher order spectral triple correlation for diagnosis of rolling element bearings via motor current signature analysis. Experimental validation of the proposed technology, applied to fault identification for motor rolling bearing by motor current signature analysis, has shown that the proposed technology successfully identifies bearing fault.
The estimates of the complete probabilities of incorrect bearing fault identification are 4% and 3% and the Fisher criteria are 6.7 and 7.8 (these results obtained for two signal segment sizes) for very early stage of bearing local fault: the fault severity ratio is 0.78%. The preliminary novel experimental comparison of the proposed technology and the higher order spectra was performed, using both the complete probability of incorrect bearing fault identification and the Fisher criterion and shows the higher bearing fault identification effectiveness by the proposed technology over the bicoherence technology. The effectiveness gains in the probability of incorrect bearing fault identification and in the Fisher criterion are 6.5 and 9.6.
The experimental fault identification results and experimental fault identification preliminary comparison results confirm and match with technology effectiveness results and technology comparison results via modelling. Therefore, the proposed technology is superior over the bicoherence technology for bearing fault identification via motor current signature analysis, and is an important step towards early fault identification.
The performed research is promising and leading in the research area, related to fault identification via motor current signature analysis. The proposed spectral multiple correction, the spectral triple correlation, and the spectral fourth correlation technologies present a new concept and will make a major influence on fault identification by motor current signature analysis for electrical engineering and also can be effectively employed for other fault identification technologies.


