1. Introduction
Given their sustainability, efficiency and high performance, belt conveyor systems present one of the most popular types of conveyors used in industries. They are widely used in various applications such as mining, manufacturing, transportation, chemical industry and the building materials industry. They are used to transport bulk materials, packages, and parcels, as they save time and labor and can be used to transport a wide variety of objects of different shapes and sizes.
Typically, belt conveyor systems consist of a belt stretched across two or more pulleys. Mis-tracking, belt slippage, belt tear, belt deviation, and motor, gearbox, and idler faults are common defects encountered by conveyor belts in industrial applications. Idler and gearbox diagnosis are normally performed (e.g., Refs. [
1,
2,
3,
4,
5,
6,
7,
8],) via vibration signal analysis. Wavelet packet decomposition is used to decompose the signals, as in Refs. [
9,
10], and afterwards, the energy of every frequency band is computed. The energies are then used as features for the classification of data to diagnose idler faults. Magnetic field variation around defects is used to detect cuts, broken wires, and any corrosion of cords in the core of steel-cord belts in Ref. [
11]. A similar technique is utilized for monitoring the condition of splices between belt pieces of conveyors [
12]. Belt and motor failure detection of a belt conveyor system are achieved in Ref. [
13].
Belt mis-tracking is a tendency of a belt to pull to one side and to run off its intended track. In an industrial application, a belt mis-tracking is a constant and significant problem when running a conveyor system. A belt that keeps tracking off center causes the edge of the belt to become damaged. This can generate uneven belt wear, product damage, and disruption of the entire conveyor operation. Belt mis-tracking could also create damage to conveyor walls. There are normally strict regulations in many industries to avoid a conveyor belt mis-tracking. Hence, there is a need for an effective and robust early detection of a belt tracking.
An experiment and a simulation of a belt tracking are performed in Ref. [
14] to measure and calculate the lateral movement (mis-tracking) of conveyor belts. Kobayashi and Toya [
15] studied the effects of different factors, such as belt speed, which affect belt mis-tracking, and proposed an experimental expression to calculate the quantity of belt mis-tracking using the roller misalignment parameters.
Motor current signature analysis (MCSA), which is a relatively new diagnosis approach, is a reliable diagnosis technology. Despite all the benefits of MCSA, no previous work has taken advantage of these technologies for monitoring belt tracking. Ref. [
16] considers the slip and meander of conveyor belts using MCSA. The STFT and the Wigner transform are used for a belt slip and meander diagnosis. The approach of Ref [
16] is not applicable for belt tracking monitoring.
This paper proposes an original approach for belt tracking diagnosis in belt conveyor systems based on MCSA. The diagnostic feature, named as the “power feature”, i.e., the average power in a frequency range around harmonics of the supply frequency, is tested for the first time in this study as a diagnostic feature for conveyor belt tracking. The effectiveness of the considered feature is evaluated and compared, respectively, using current signals recorded for different tracking conditions of a belt conveyor system existing at the University of Huddersfield.
The main originality of this paper is a new proposition (by L. Gelman) for the first time ever in worldwide terms to use an intensity of the fundamental harmonic of the supply frequency of a motor for the diagnosis of belt tracking for belt conveyor systems. Other novelties are as follows:
A diagnostic technology based on the integro-differential approach, via the integrated power of the fundamental harmonic of the supply frequency, is proposed for the diagnosis of a conveyor belt’s tracking;
Novel experimental results for the diagnosis of a belt’s tracking via the proposed technology for two conveyor load conditions.
This paper has three sections.
Section 2 explains the proposed method, based on MCSA, for belt tracking diagnosis and describes the belt tracking experimental setup and the multiple experiments. The performance of the proposed technology is examined in
Section 3, using experimental data acquired from the belt conveyor system with and without tracking problems.
Section 4 concludes the main results.
2. Belt Tracking Diagnosis and Experimental Setup
The objective of this section is to establish an effective diagnostic technology to detect a conveyor belt mis-tracking based on MCSA. When a conveyor belt is subjected to a mis-tracking, friction occurs between a belt and one of the conveyor metal walls, resulting in an increase in a resistive load on a driving motor. All electric motors, when subjected to an increase in a load, attempt to develop more torque to counteract an increase in mechanical load, thus increasing their electrical energy consumption. Thus, it is proposed in this paper to investigate the effect of belt mis-tracking on the integrated power of the fundamental harmonic of the supply frequency of motor current signals. The diagnostic “power feature” [
17], which is the integrated power in a frequency range around the fundamental harmonic of the supply frequency, is proposed to be used for diagnostic technology for belt tracking:
where
is the estimate of the power spectral density of the current signal at a discrete frequency, and
is a frequency bandwidth that is centered around frequency
at the fundamental harmonic of the supply frequency
.
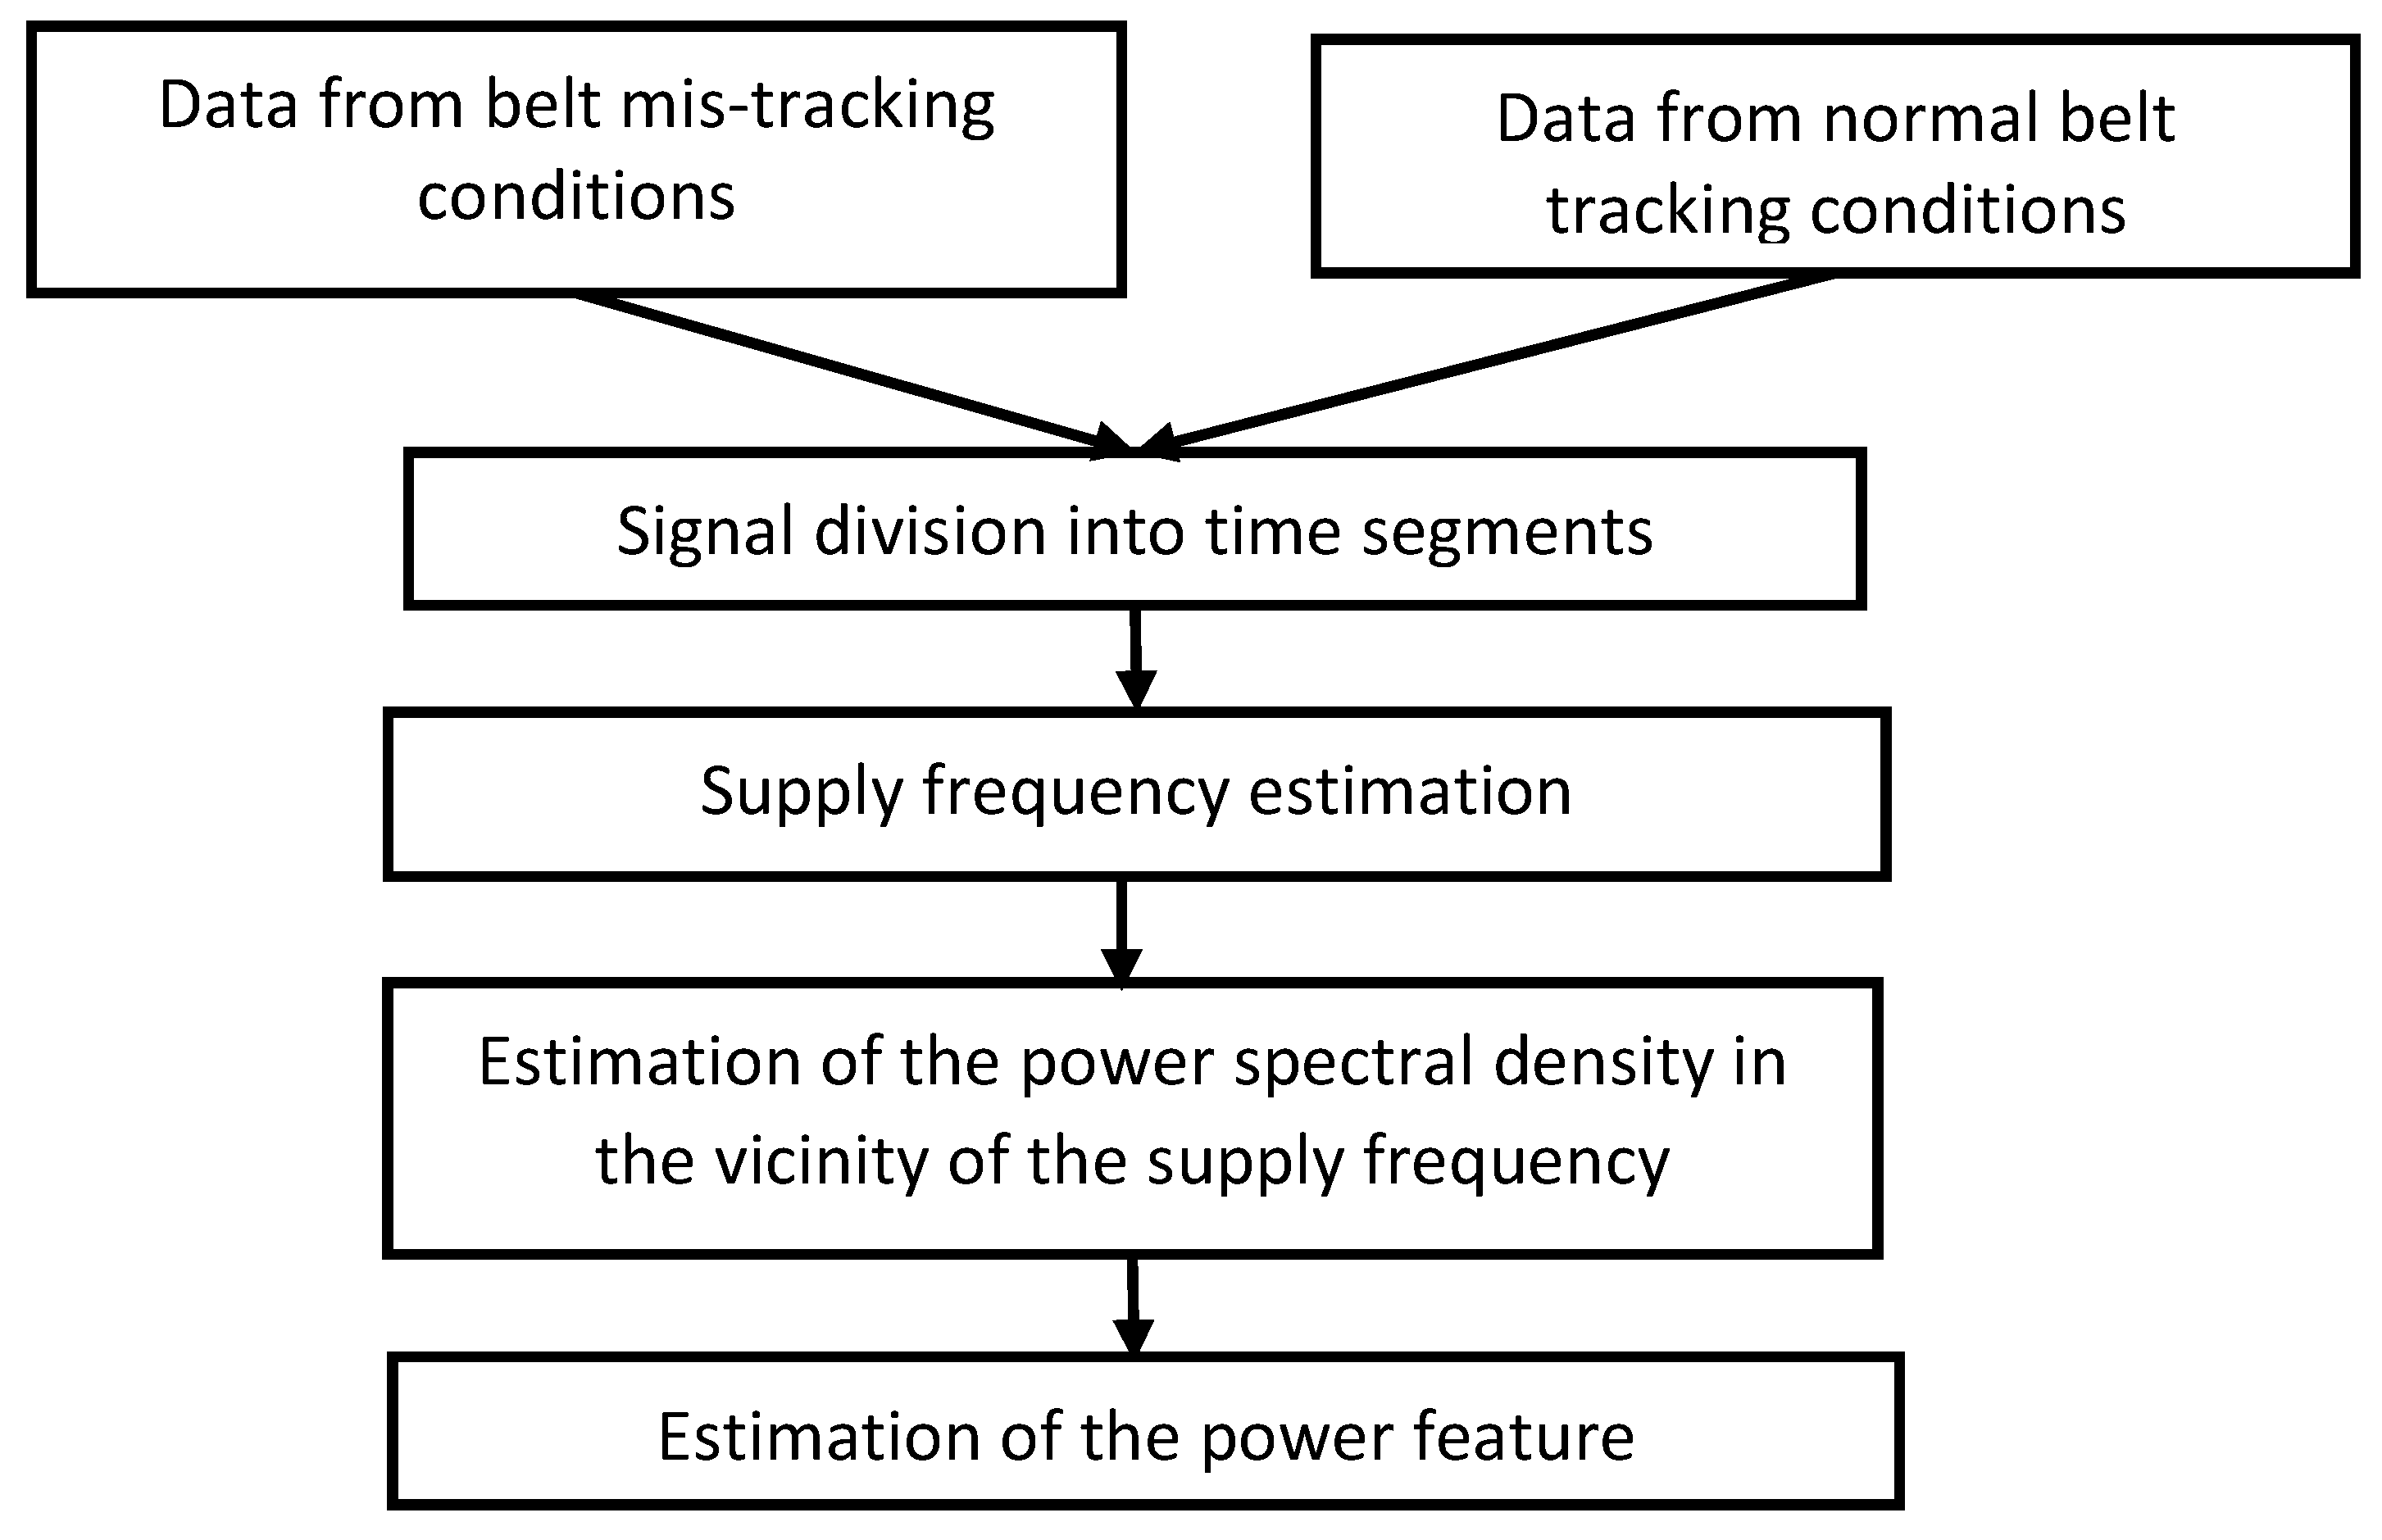
The proposed evaluation of the power feature is illustrated via a flow chart in
Figure 1. In this evaluation, two sets of current data from the conveyor, one under mis-tracking condition and the other under a pristine condition, were gathered separately and divided into time intervals. The integrated power was computed around the fundamental harmonic of the supply frequency.
The main advantage of the proposed diagnostic feature is that it uses the integro-differential approach. Differentiation is achieved via the spectral analysis of a high frequency resolution in the vicinity of the fundamental harmonic; integration is achieved by summing narrowband high frequency resolution spectral components The integrated power feature of the technology is calculated within a 1 Hz frequency band B, around the first harmonic of the supply frequency. The selected frequency band is relatively large, to include variations of the supply frequency over time; however, it is not too large, so the first harmonic of the supply frequency could be reliably isolated. For the multiple continuously acquired current signals for the different belt tracking conditions, every signal is divided into 20 s time segments and the power feature (1) is computed for each segment, so the power spectral density of the current data is evaluated via a frequency resolution of 0.05 Hz. A relatively high frequency resolution (i.e., 0.05 Hz) is selected in order to increase the signal-to-noise ratio of the fundamental harmonic of the supply frequency. In order to keep the selected frequency resolution, a rectangular time window is selected for time segments.
It should be mentioned that frequency fs in Equation (1) is set to the average of the instantaneous frequency (IF) of the supply frequency for each time segment; the IF is estimated using the Hilbert transform phase demodulation approach [
18].
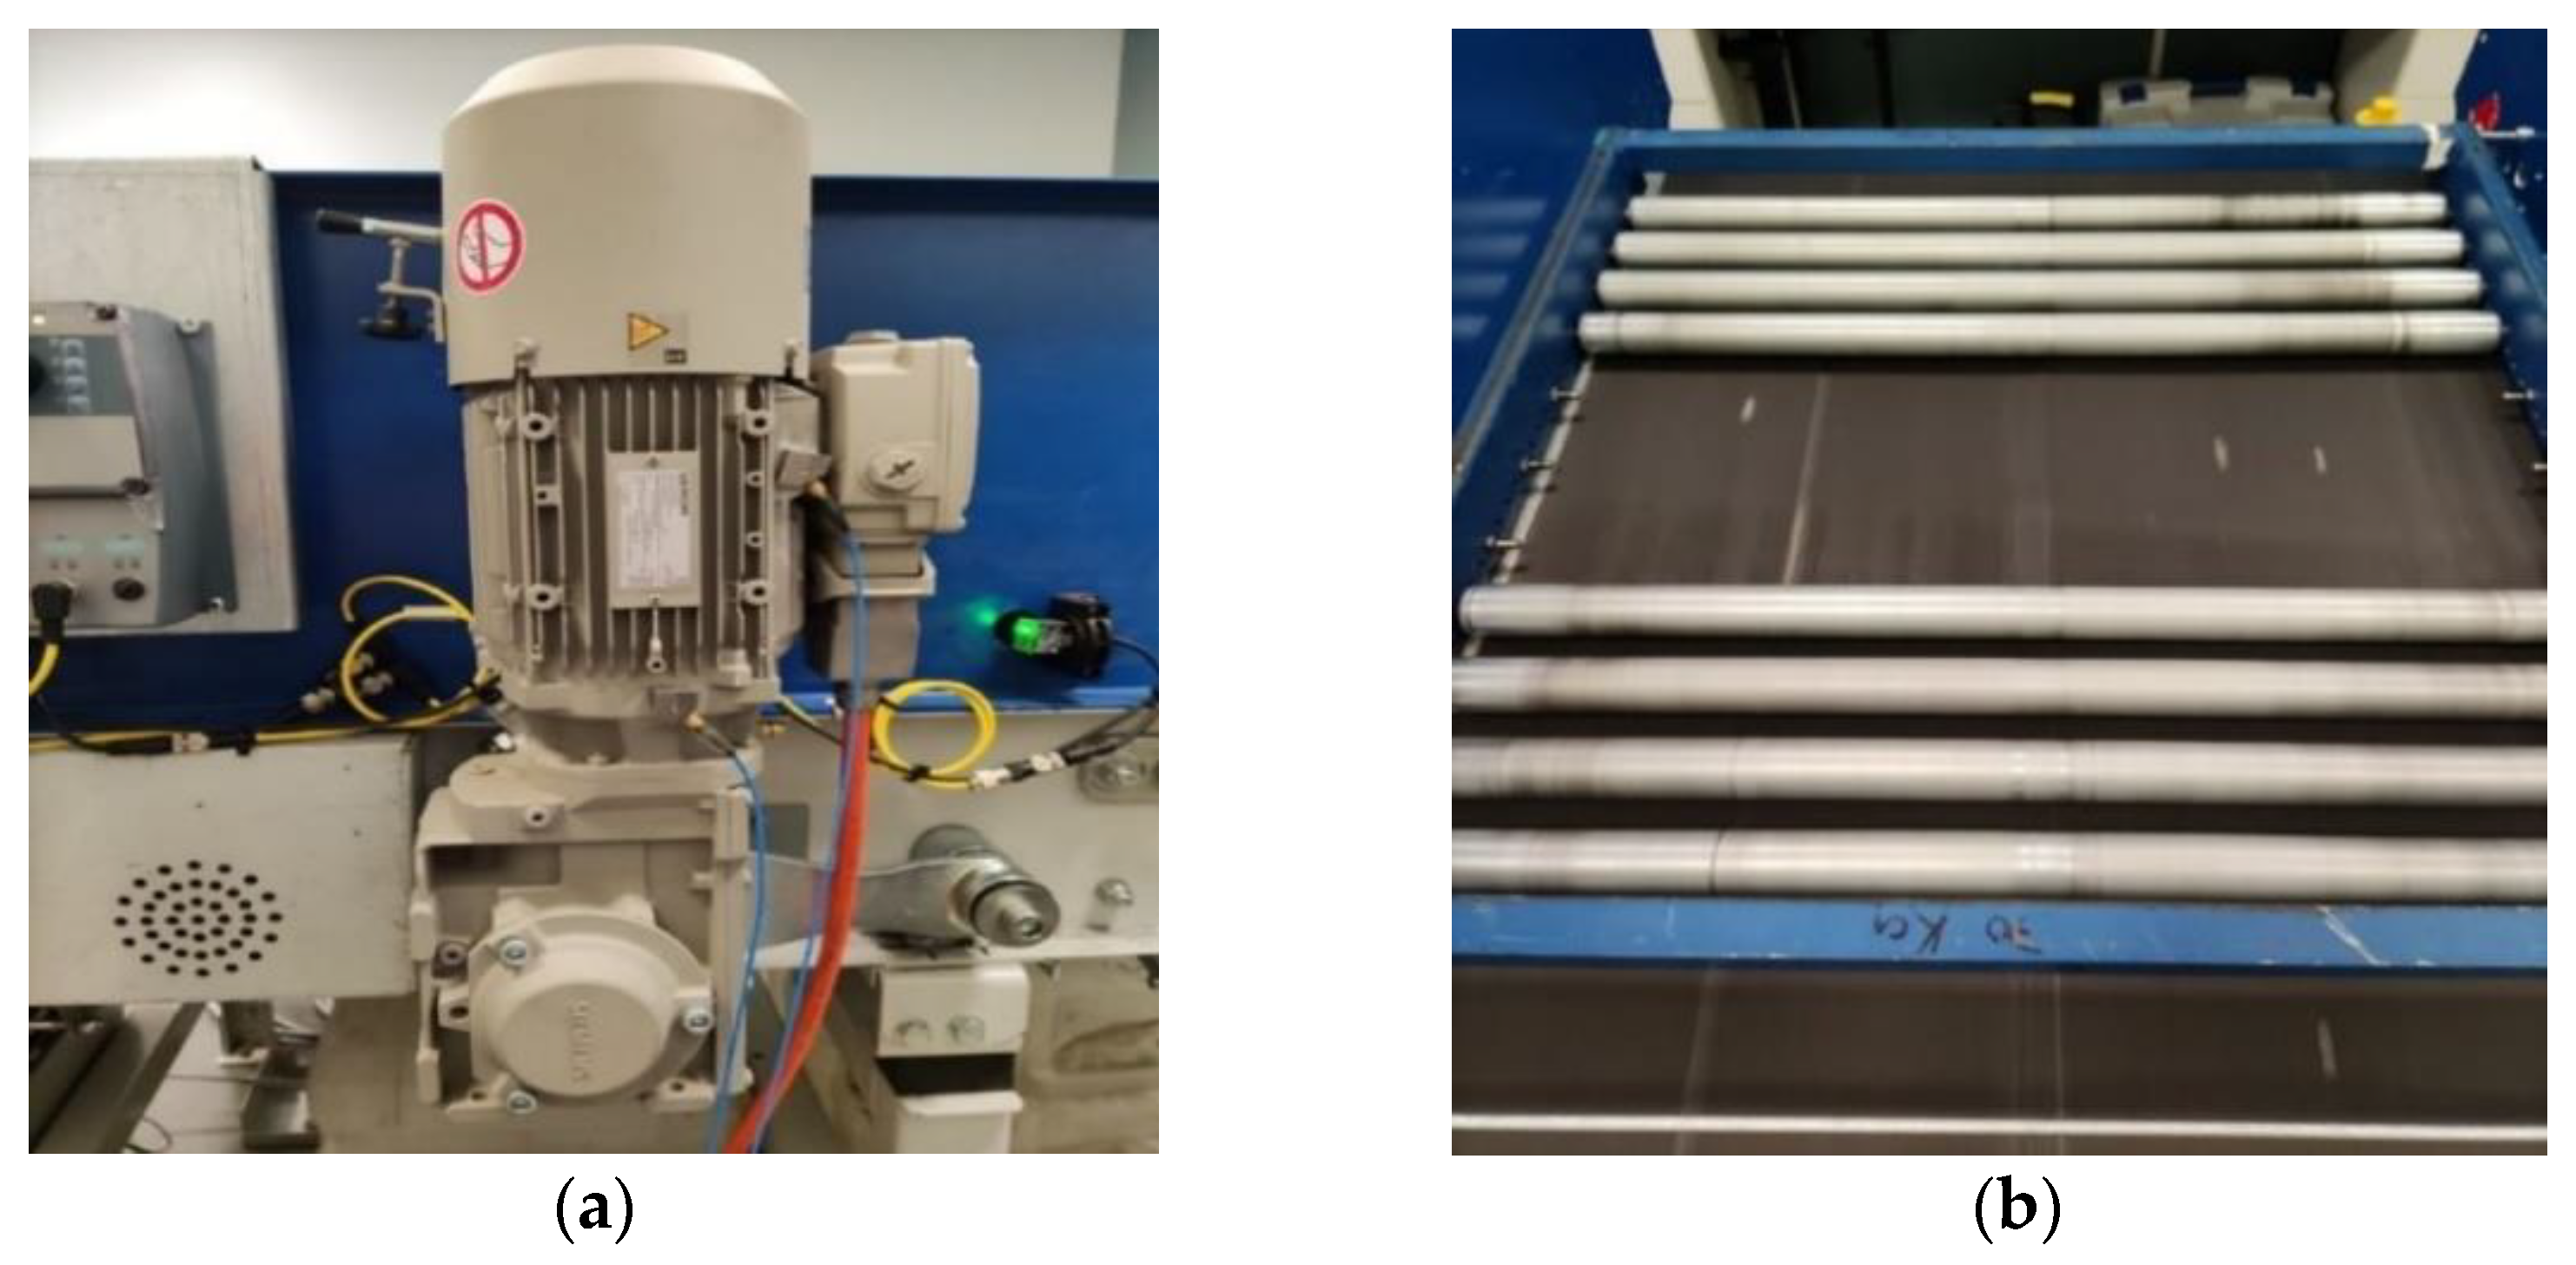
The machinery under investigation is the belt conveyor system depicted in
Figure 2. The conveyor is driven by a gear motor comprising a two-stage gearbox and a three-phase AC induction motor. The motor is connected to the power line with a nominal supply frequency of 50 Hz.
Figure 2a shows the gearmotor of the experimental setup, and
Figure 2b shows the 20 kg load configuration used for investigating a belt mis-tracking.
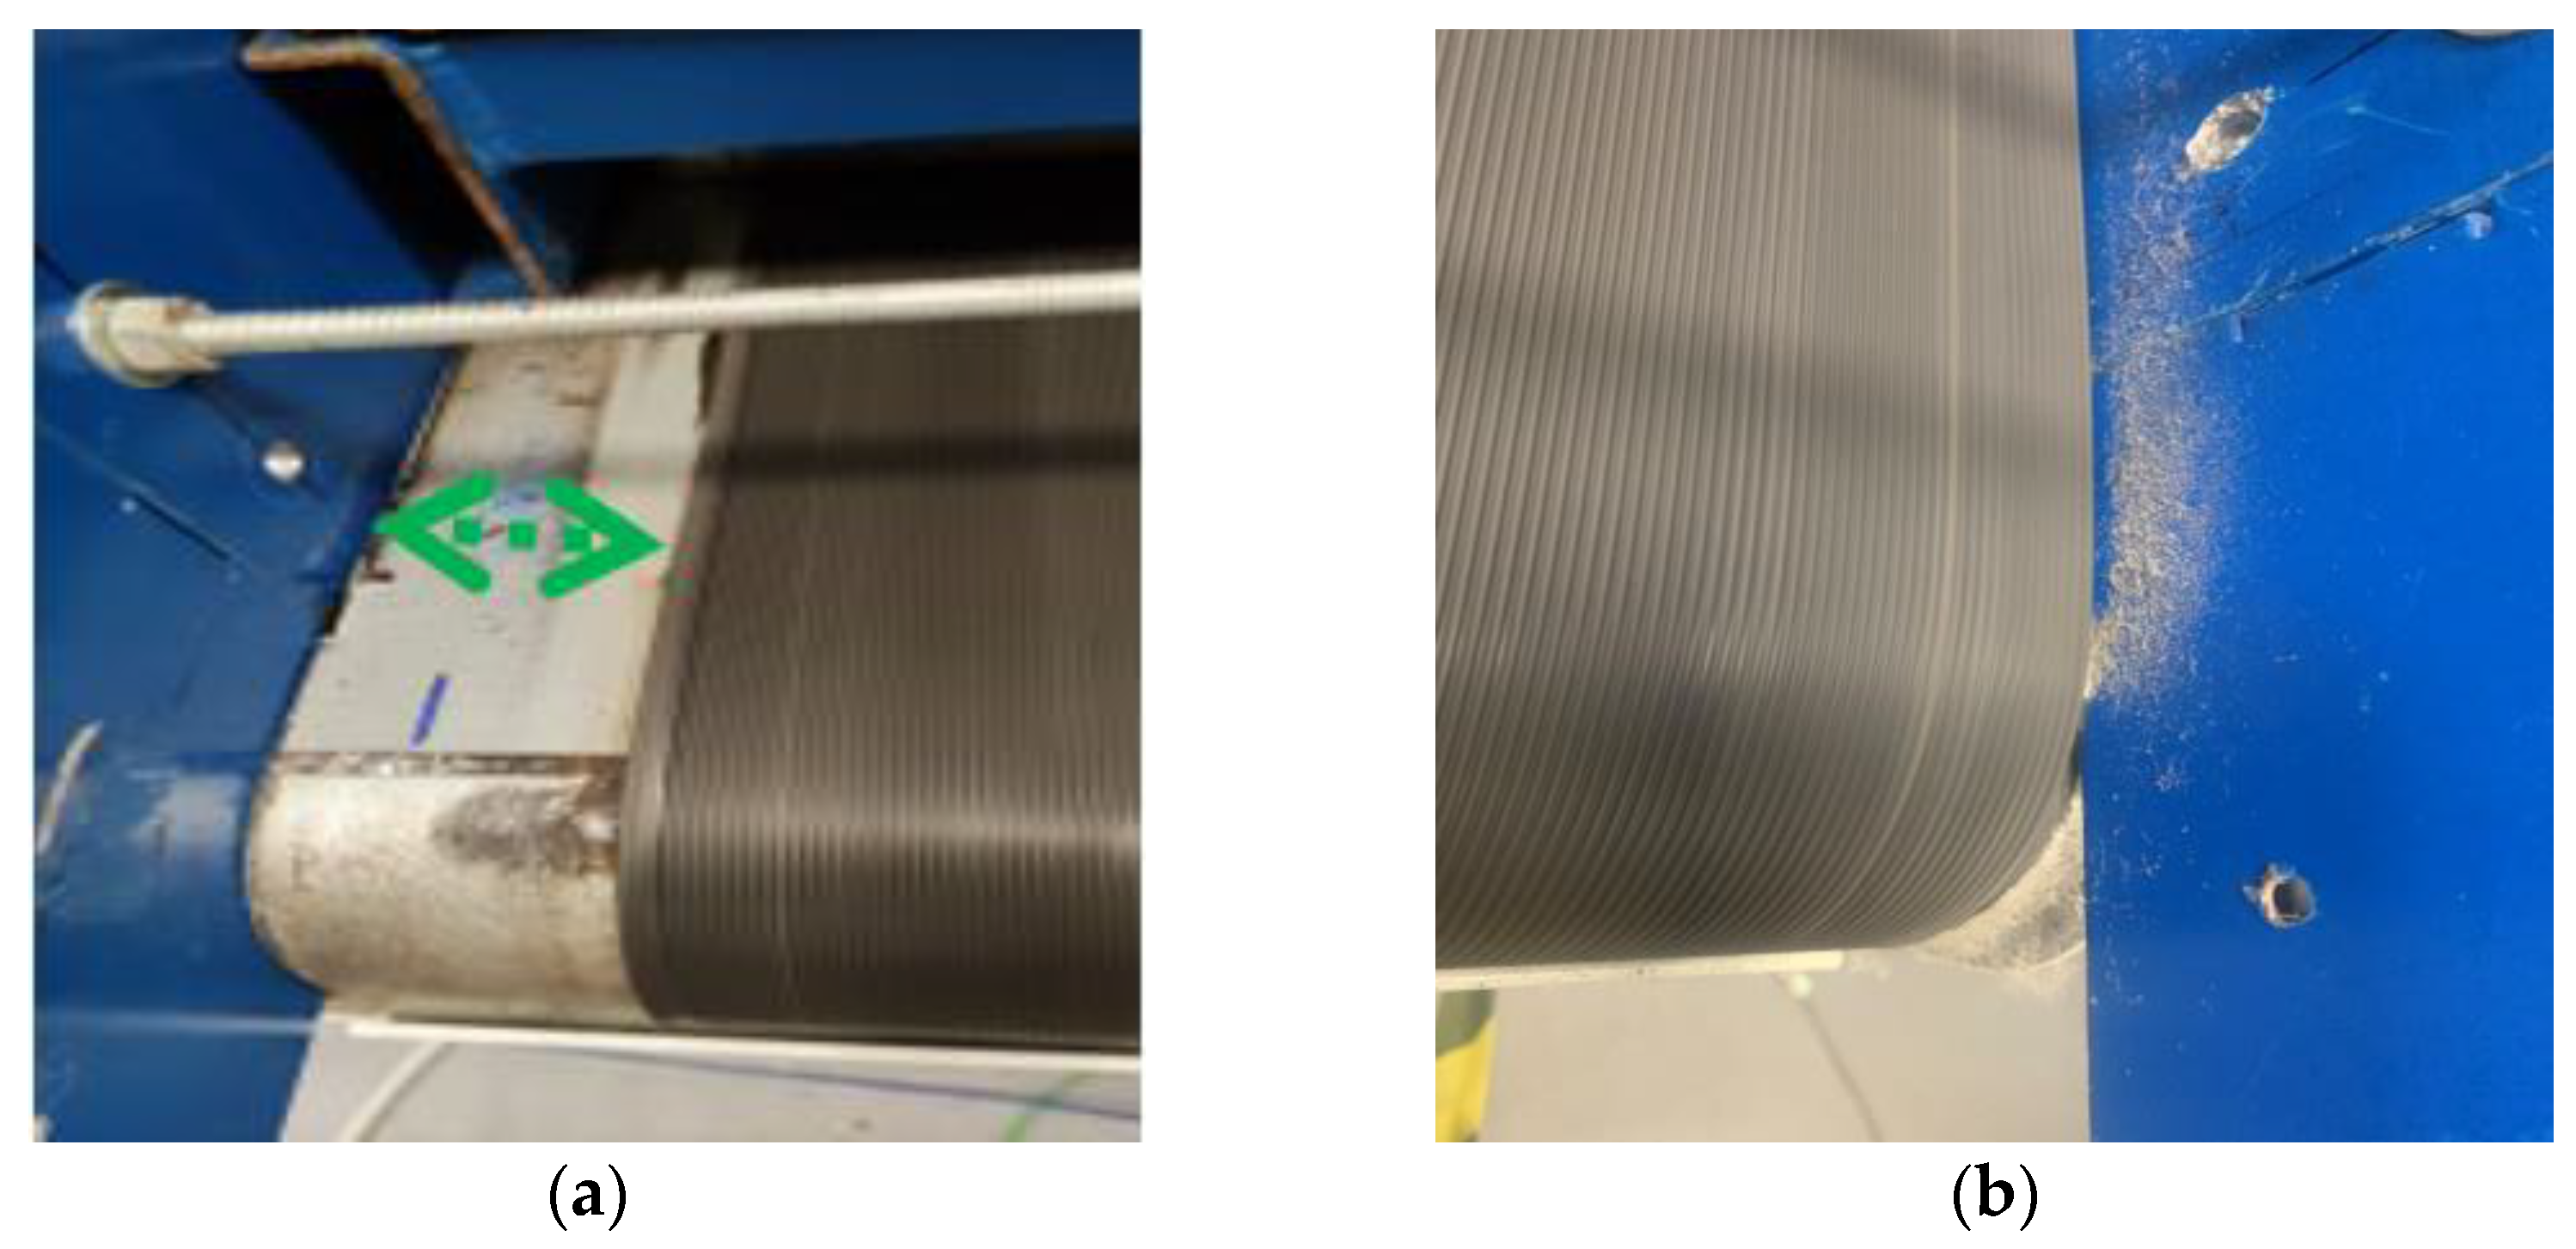
Figure 3a shows a side of the conveyor, where a suitable distance (shown by the green arrows) is provided between the conveyor metal wall and the belt. In contrast,
Figure 3b shows the case in which the metal wall is in contact with the belt (i.e., a belt mis-tracking), resulting in the loss of small pieces of the belt due to friction with the metal wall.
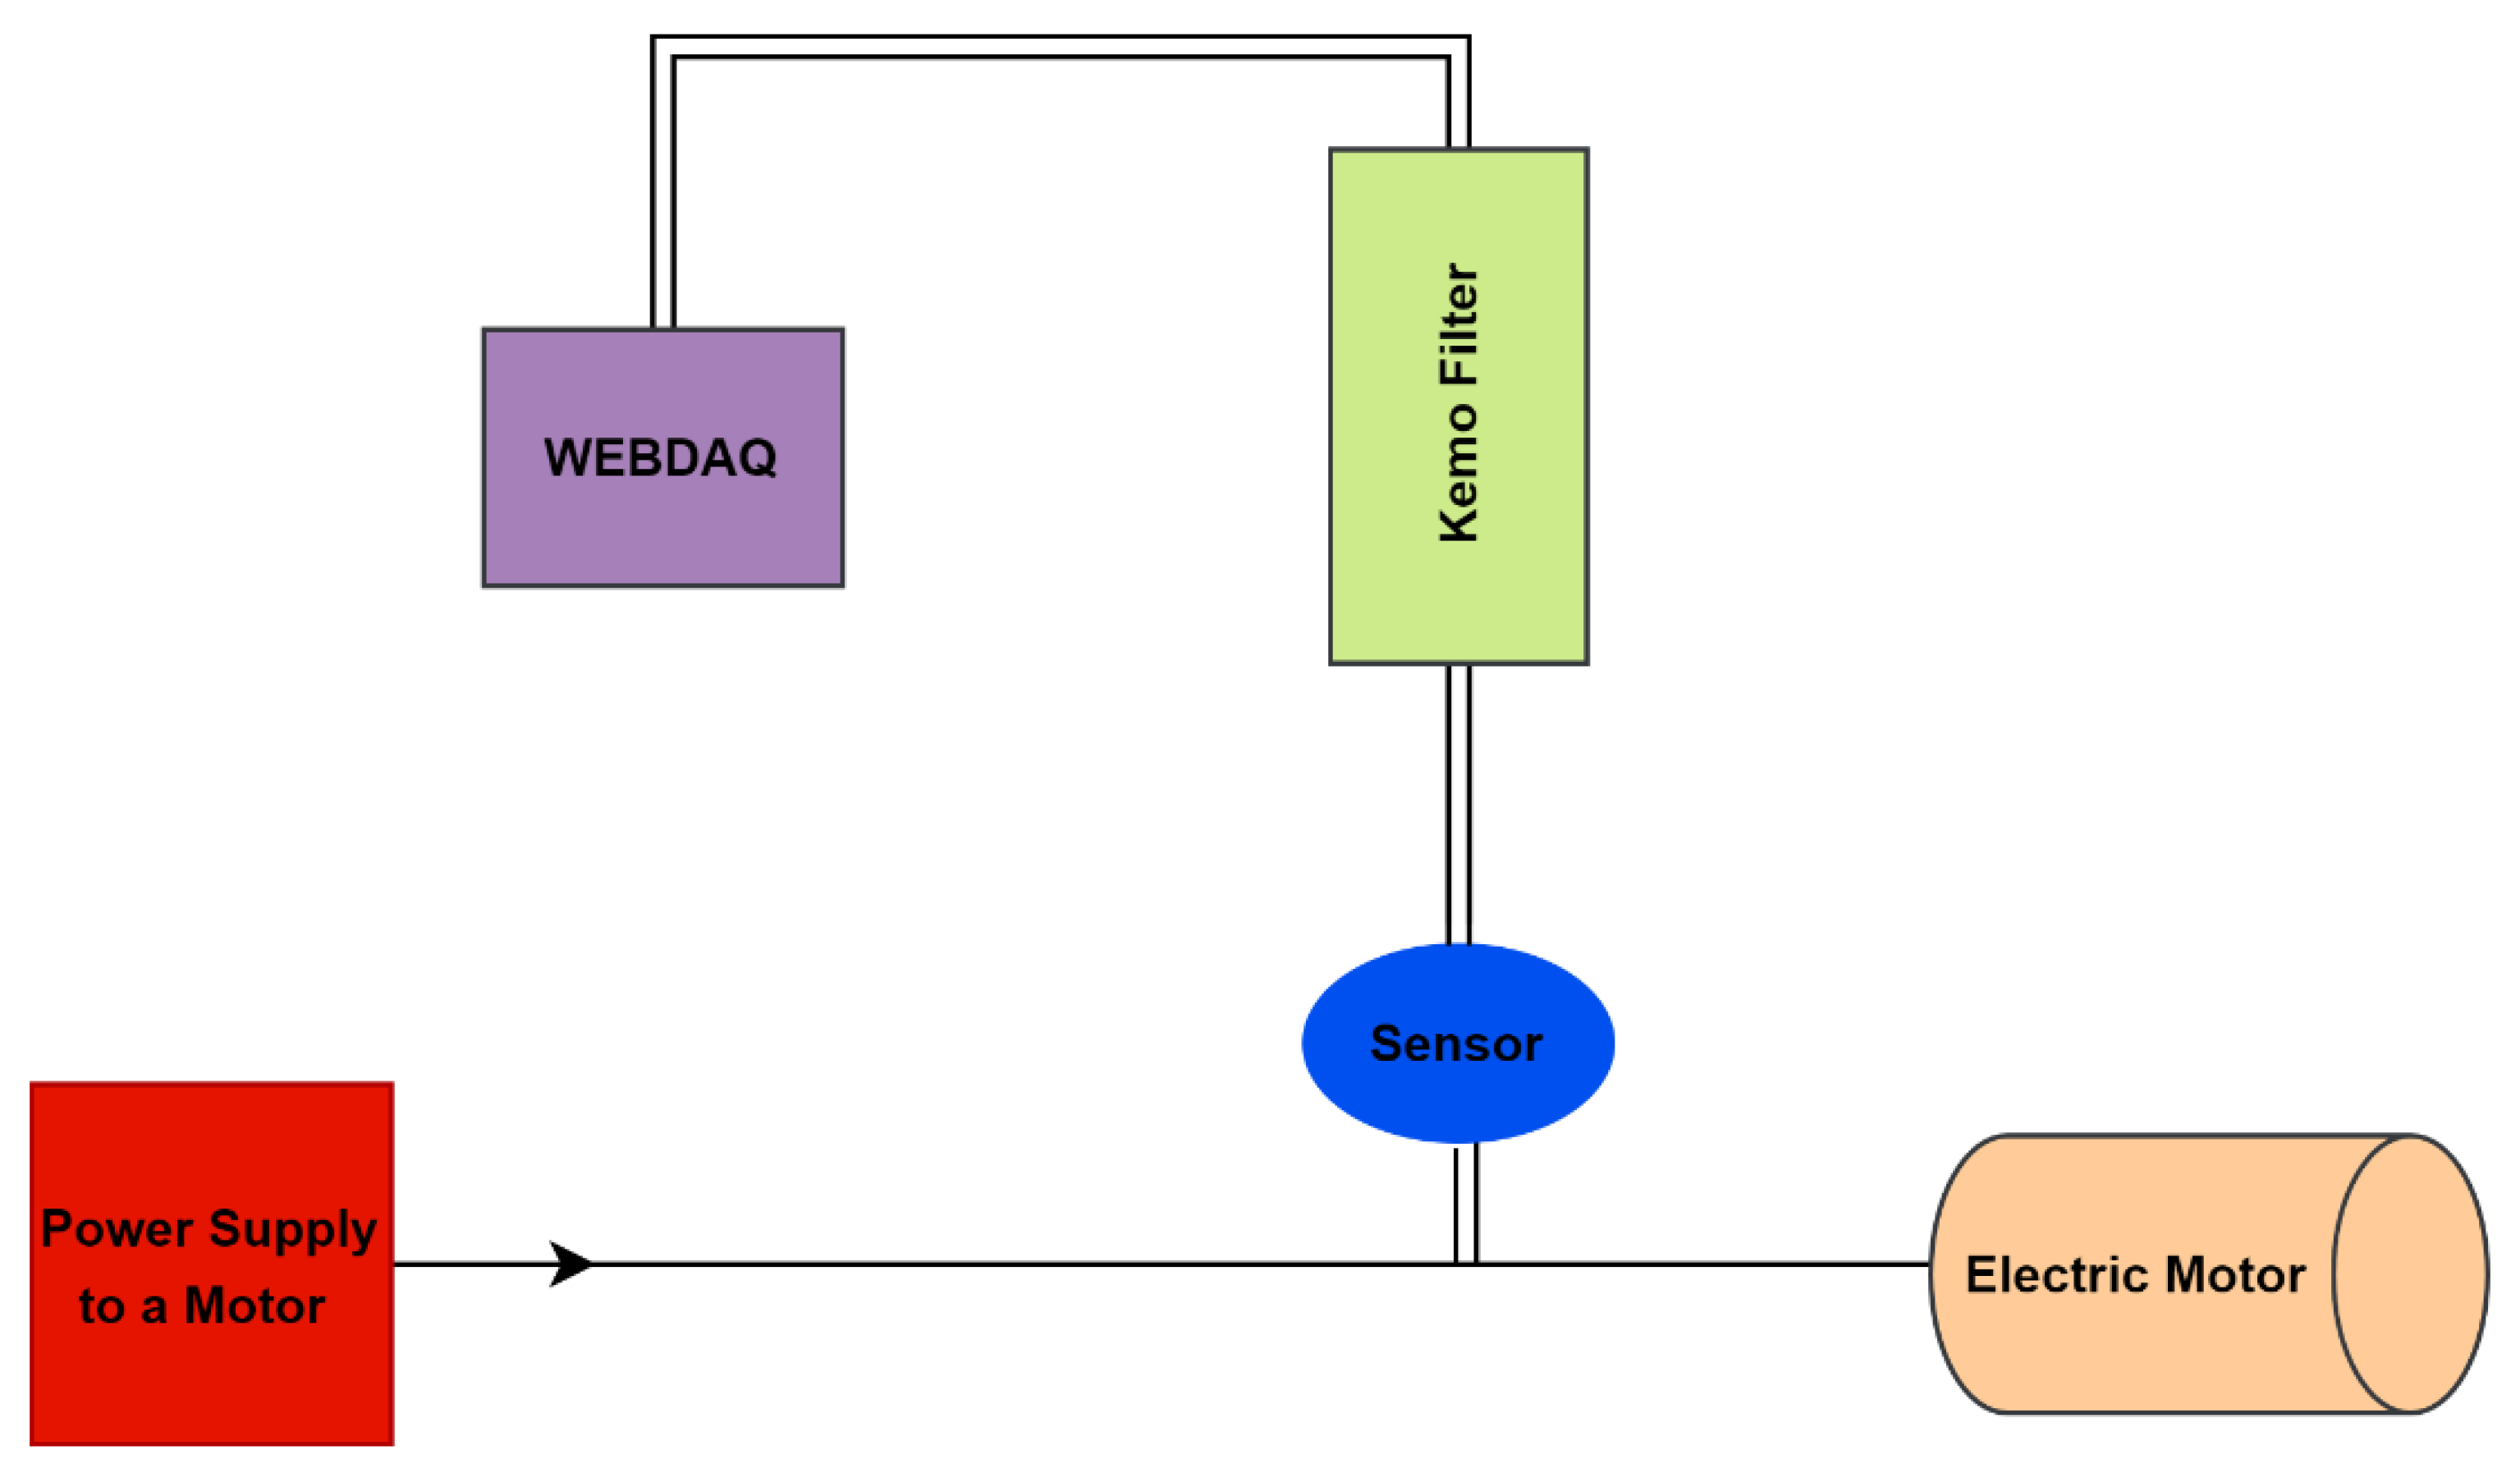
Figure 4 presents a schematic of the current signals acquisition system used in this study [
15]. The standard motor current signals were captured using an LEM ATO-B10 sensor. These signals were not normalized.
The continuously captured current signals were passed through KEMO anti-aliasing filters that were used to adequately amplify and limit the frequency bandwidth of the recorded signals. The gain and the cut-off frequency of the filters adopted in the experiments were ×20 and 8 kHz, respectively. To convert the analog signals (output of the KEMO filters) into digital signals, a WebDAQ 504 data acquisition card was used with four simultaneously sampled analog inputs, 24-bit resolution, and IEPE signal conditioning.
Tracking experiments were conducted under two loading conditions, namely, without load and with a 20 kg load on the conveyor. The load used consisted of a series of rollers contained in a frame placed on the conveyor belt, as shown in
Figure 1b.
For both loading conditions, motor current signals were recorded under a normal tracking condition and in the case of a mis-tracking, respectively, with a sampling frequency of 51,200 Hz.
At the beginning of each recording, we tilted the belt drive roller around the conveying axis by loosening or tightening its adjusting nut. This involves the belt sliding to one side during operation due to its self-centering behavior. Contact (i.e., mis-tracking) would, therefore, occur between the belt and one of the metal walls (depending on the inclination of the drive roller). The contact progressively increased until it reached a maximum level, then we readjusted the belt drive roller to the neutral position, which led to a progressive decrease in the contact until it disappeared (normal tracking). The timing of the three events, i.e., start of contact, maximum contact, end of maximum contact and end of contact, was documented for each recording.
In total, four current recording are considered in this study, corresponding, respectively, to:
Normal belt tracking under no-load condition;
Normal belt tracking under 20 kg load condition;
Belt mis-tracking under no-load condition;
Belt mis-tracking under 20 kg load condition.
3. Results and Discussion
The effectiveness of the considered technology is evaluated for MCSA-based belt tracking diagnosis.
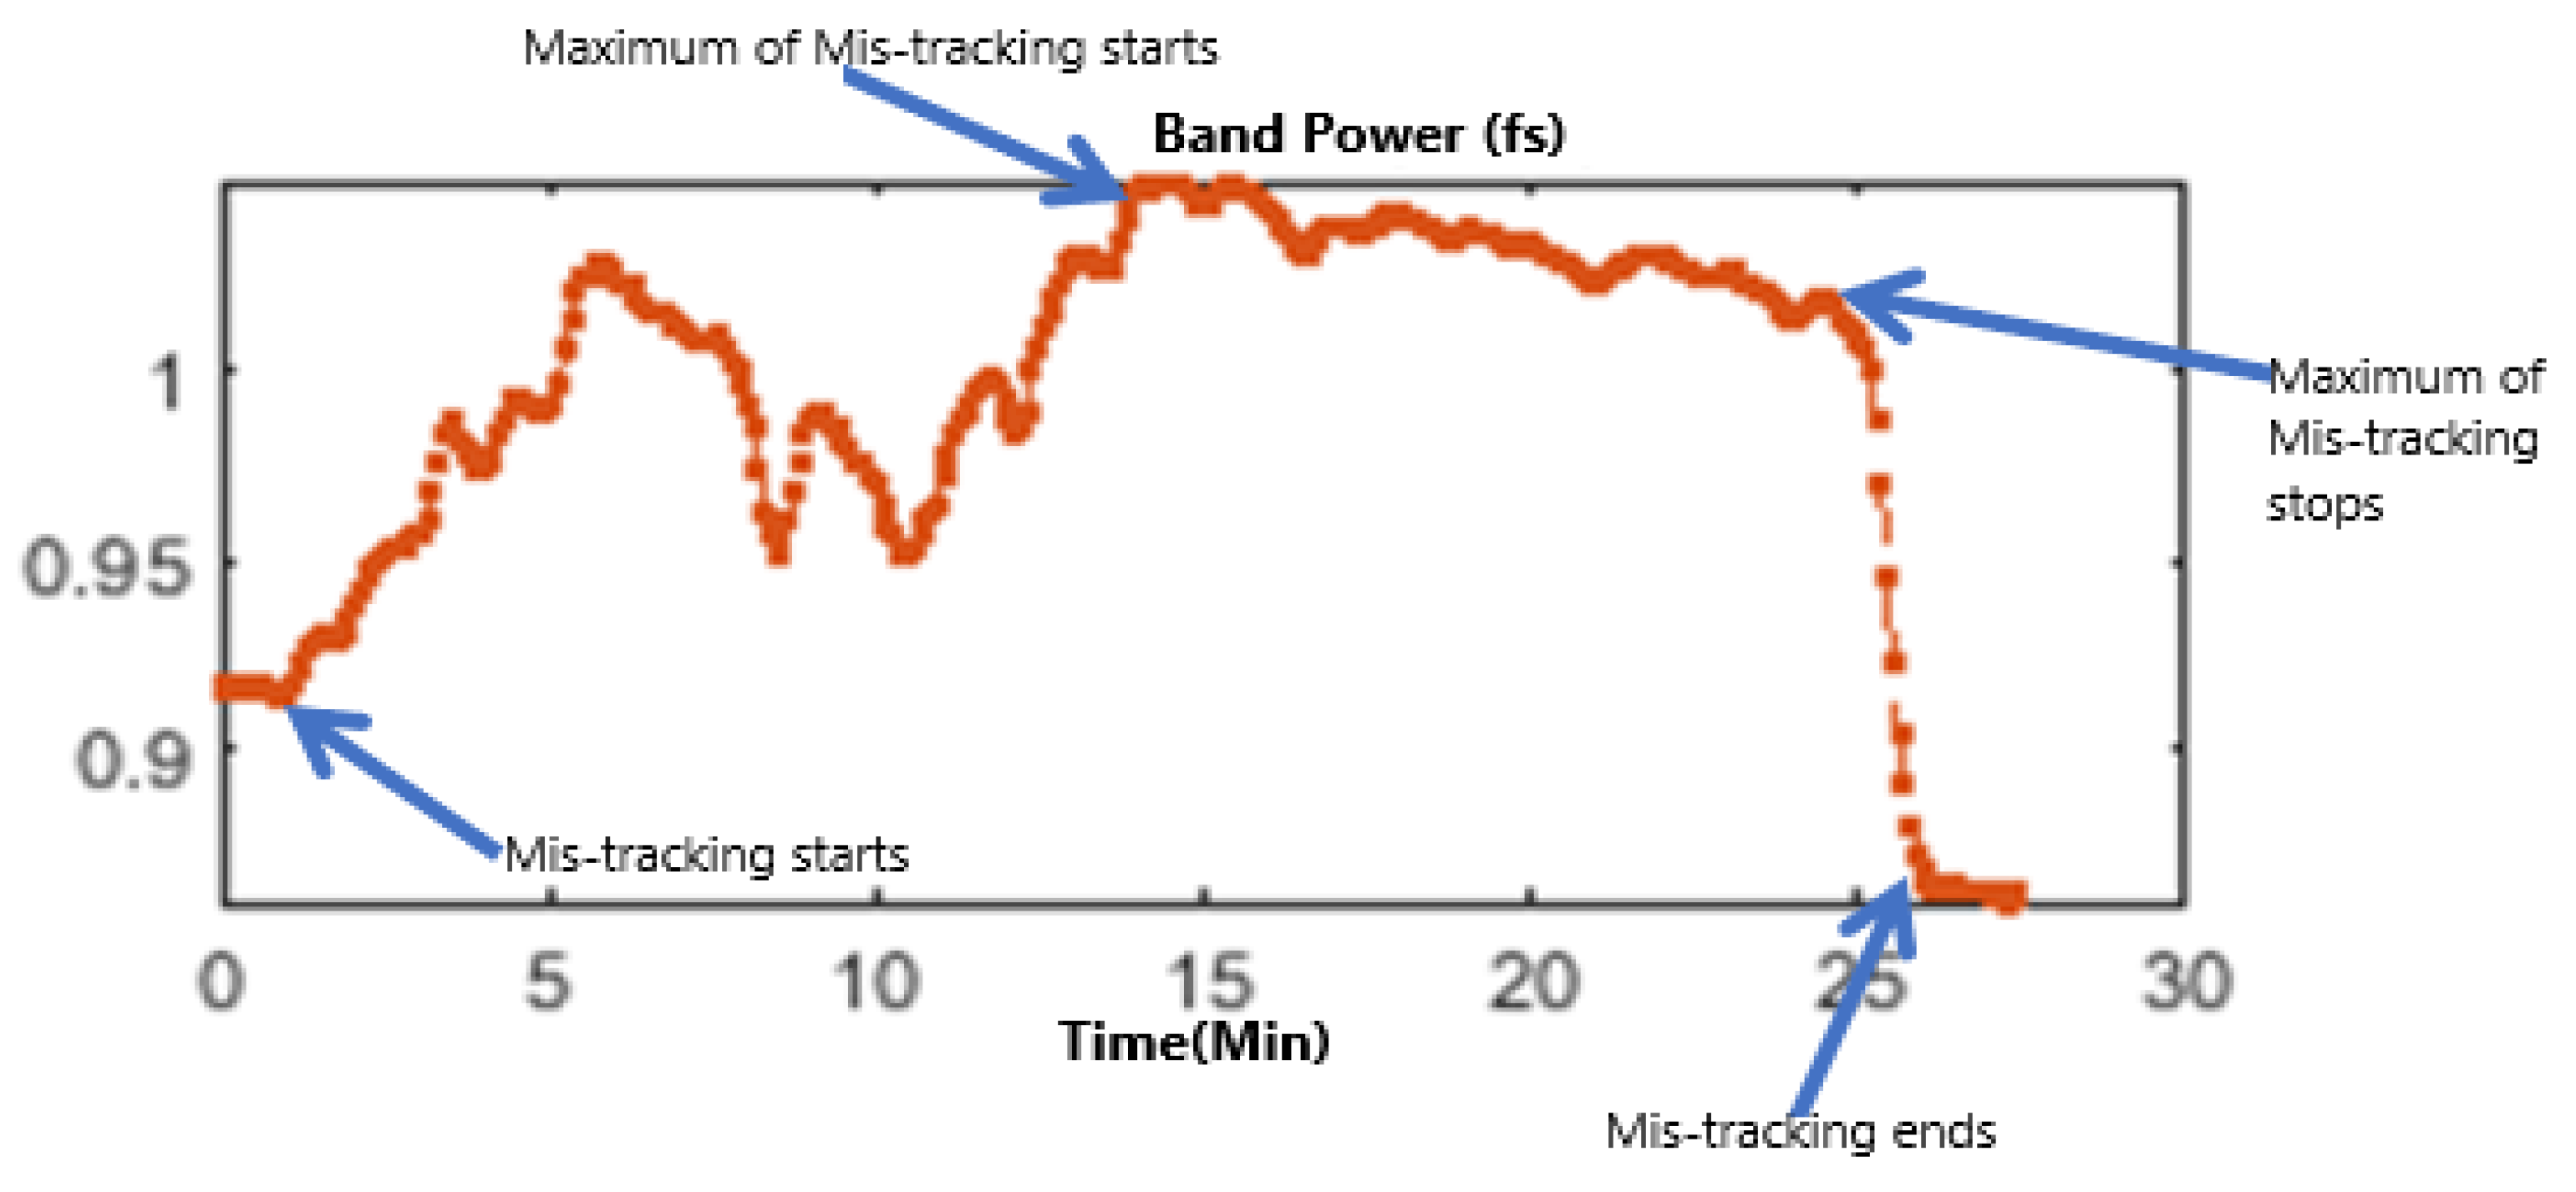
Eighty minutes of current data were investigated for two loading conditions. Longer experiments for mis-tracking were not conducted, as that could significantly damage the belt. To evaluate feature diagnosis effectiveness for a belt mis-tracking under a no-load condition, the values of the power feature for a belt mis-tracking are plotted in
Figure 5. The time of each event is also marked in the plot. In
Figure 5, the power feature has a higher value at the starting point of the belt mis-tracking compared to the normal belt tracking condition of operation. The power feature increased from the time of initiation of a mis-tracking/contact to the time the maximum belt mis-tracking started. During the maximum of a belt mis-tracking, the value of the power feature reached its maximum and was almost constant. It decreased as the experiment progressed from a belt mis-tracking condition to a normal belt tracking condition at the end of the experiment.
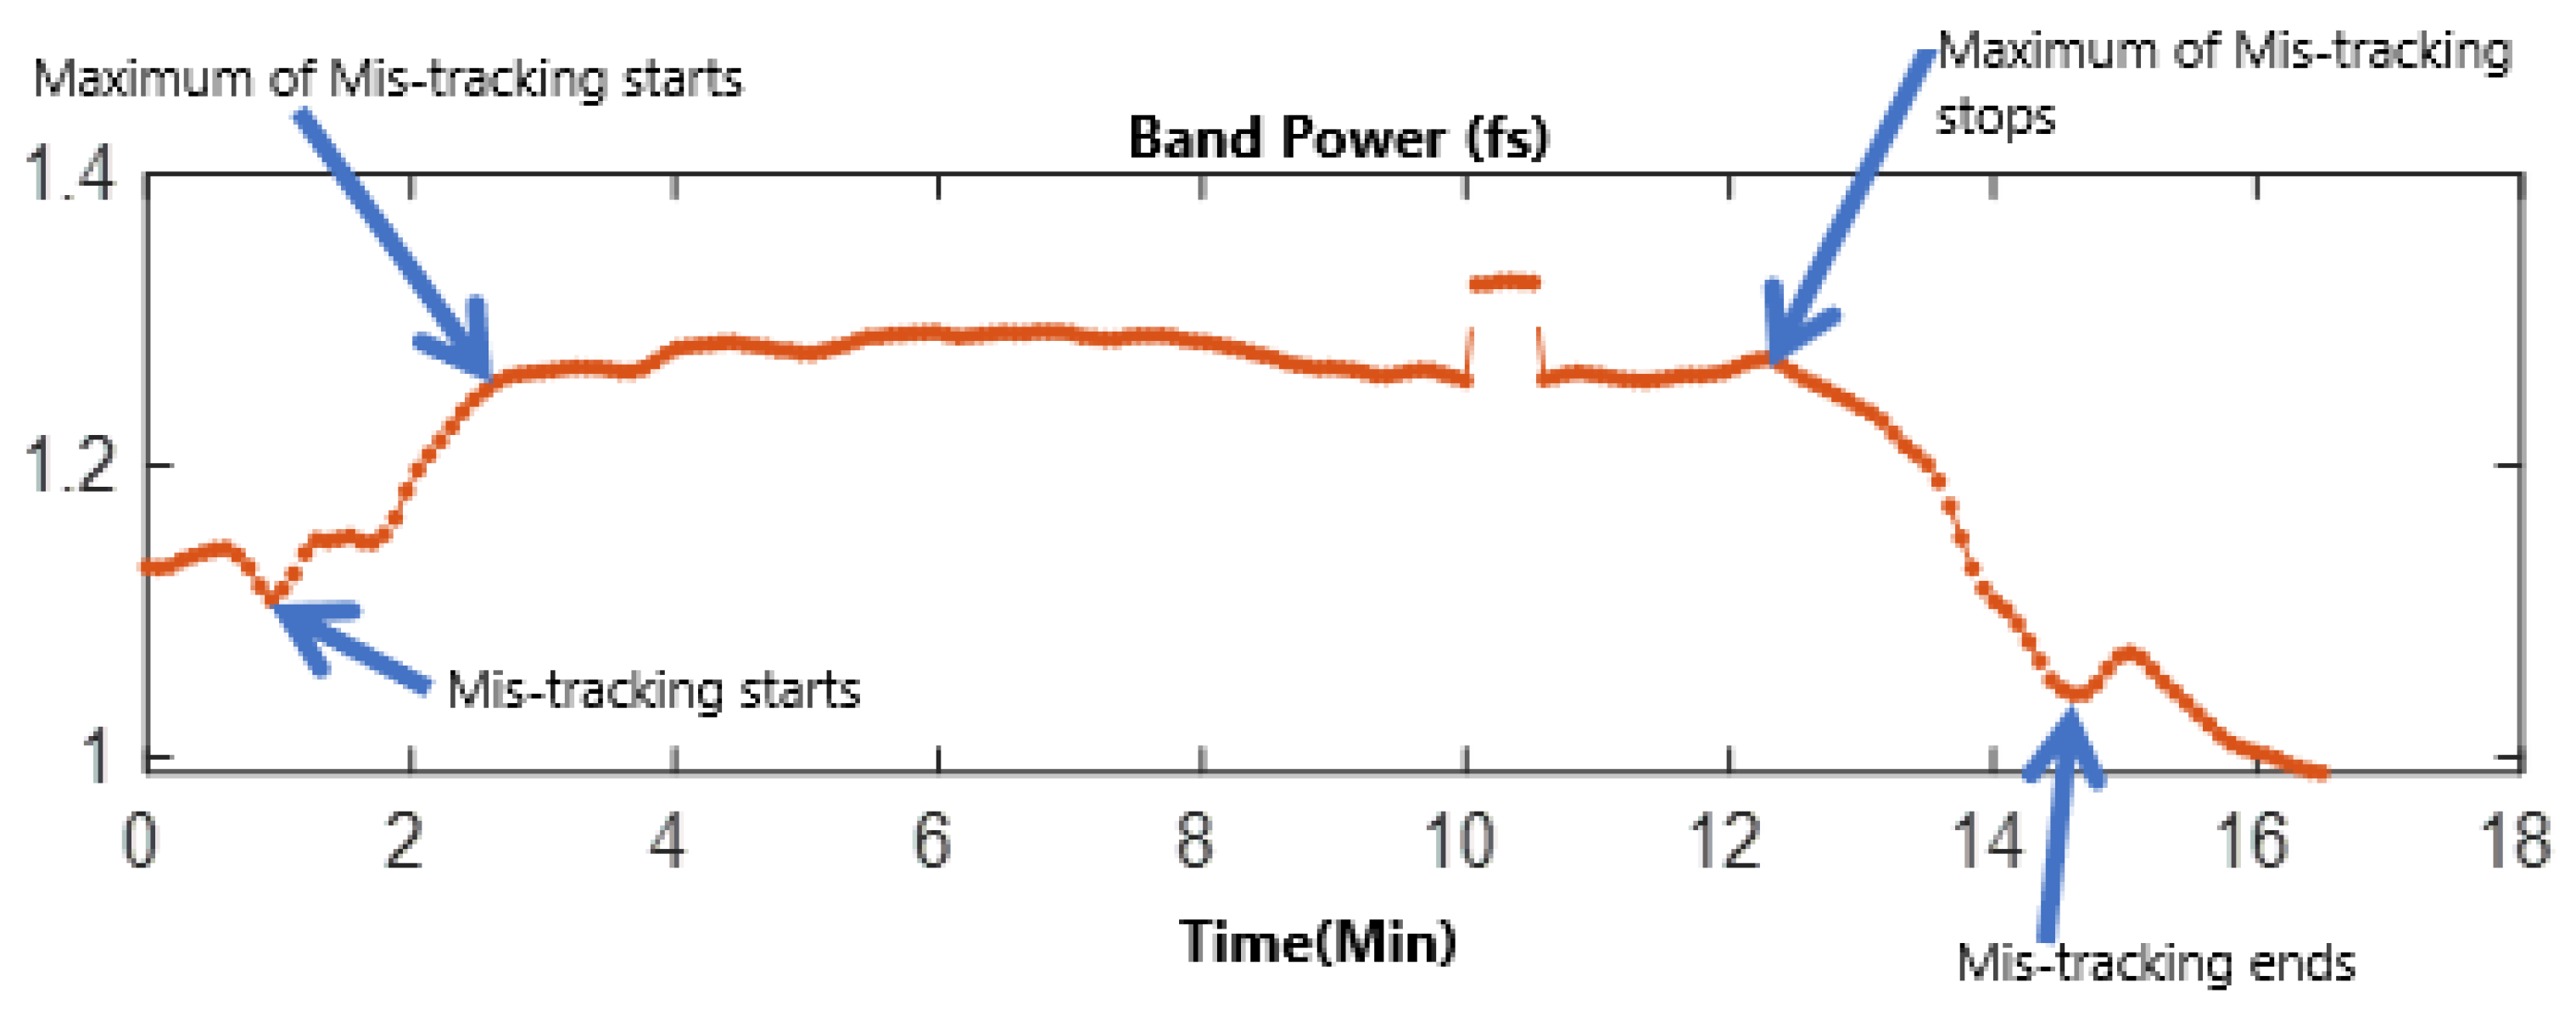
Figure 6 displays the results for the second loading condition of 20 kg. The pattern of the power feature variation was similar to the no-load case; i.e., when a belt mis-tracking started, the power feature started increasing and the highest value was related to the maximum level of a belt mis-tracking. The power feature decreased while the level of a belt mis-tracking reduced from the maximum of a belt mis-tracking to a normal belt tracking.
The above results for the studied cases show that it might be feasible to use the power feature for the diagnosis of belt tracking in belt conveyors. The effectiveness of a belt tracking diagnosis is investigated here by comparing the histograms of the power feature values for normal and belt mis-tracking conditions. Histograms are shown in
Figure 6 for 0 and 20 kg loads. It can be seen that these histograms are separated for normal belt tracking and a belt mis-tracking for both loads. It can be also seen that if a belt mis-tracking exists, the power feature shows higher values compared to the normal belt tracking for both loads.
Forty-five bins were used to generate the histograms. The bin number was selected to accurately extract the shape of the histograms, using the following methodology. For each pair of histograms, the total number of power features for a normal belt tracking and for a belt mis-tracking were 120 and 120, respectively. The standard “Rule of Thumb” is to divide a feature range into k equal bins, where k is the square root of a feature number. Therefore, for each histogram (i.e., for a normal tracking and for a mis-tracking), 11 bins are needed. Taking into account a distance between two histograms, a “safety factor” was applied and the total number of bins was obtained as 45. If we choose too big a bin number for a given feature number, a bar height at each bin will suffer significant statistical fluctuation due to the paucity of samples in each bin. If you choose too small a bin number, a histogram cannot represent the shape of the underlying distribution because the resolution is not good enough.
Bin size was different for the no-load condition and for the 20 kg load condition. For the no-load condition, bin size was 0.004 V2/Hz; for the 20 kg load condition bin size was 0.007 V2/Hz. The bin range for each load condition was defined based on a minimum power feature value for normal belt tracking and a maximum power feature value for a belt mis-tracking. The bin range was 0.2 V2/Hz for no-load conditions and 0.3 V2/Hz for a 20 kg load. There was a wider bin range for a 20 kg load because a 20 kg load for the belt conveyor acted as interference (i.e., noise) to the proposed diagnostic feature. It is well-known from pattern recognition theory that the addition of interference (i.e., noise) to a diagnostic feature increases the variance of a diagnostic feature and, therefore, makes a wider spread/span of a histogram of that diagnostic feature. Due to additional “load interference”, the diagnostic effectiveness of a belt mis-tracking by the proposed diagnostic technology is slightly decreased in the case of the 20 kg load compared with a no-load condition.
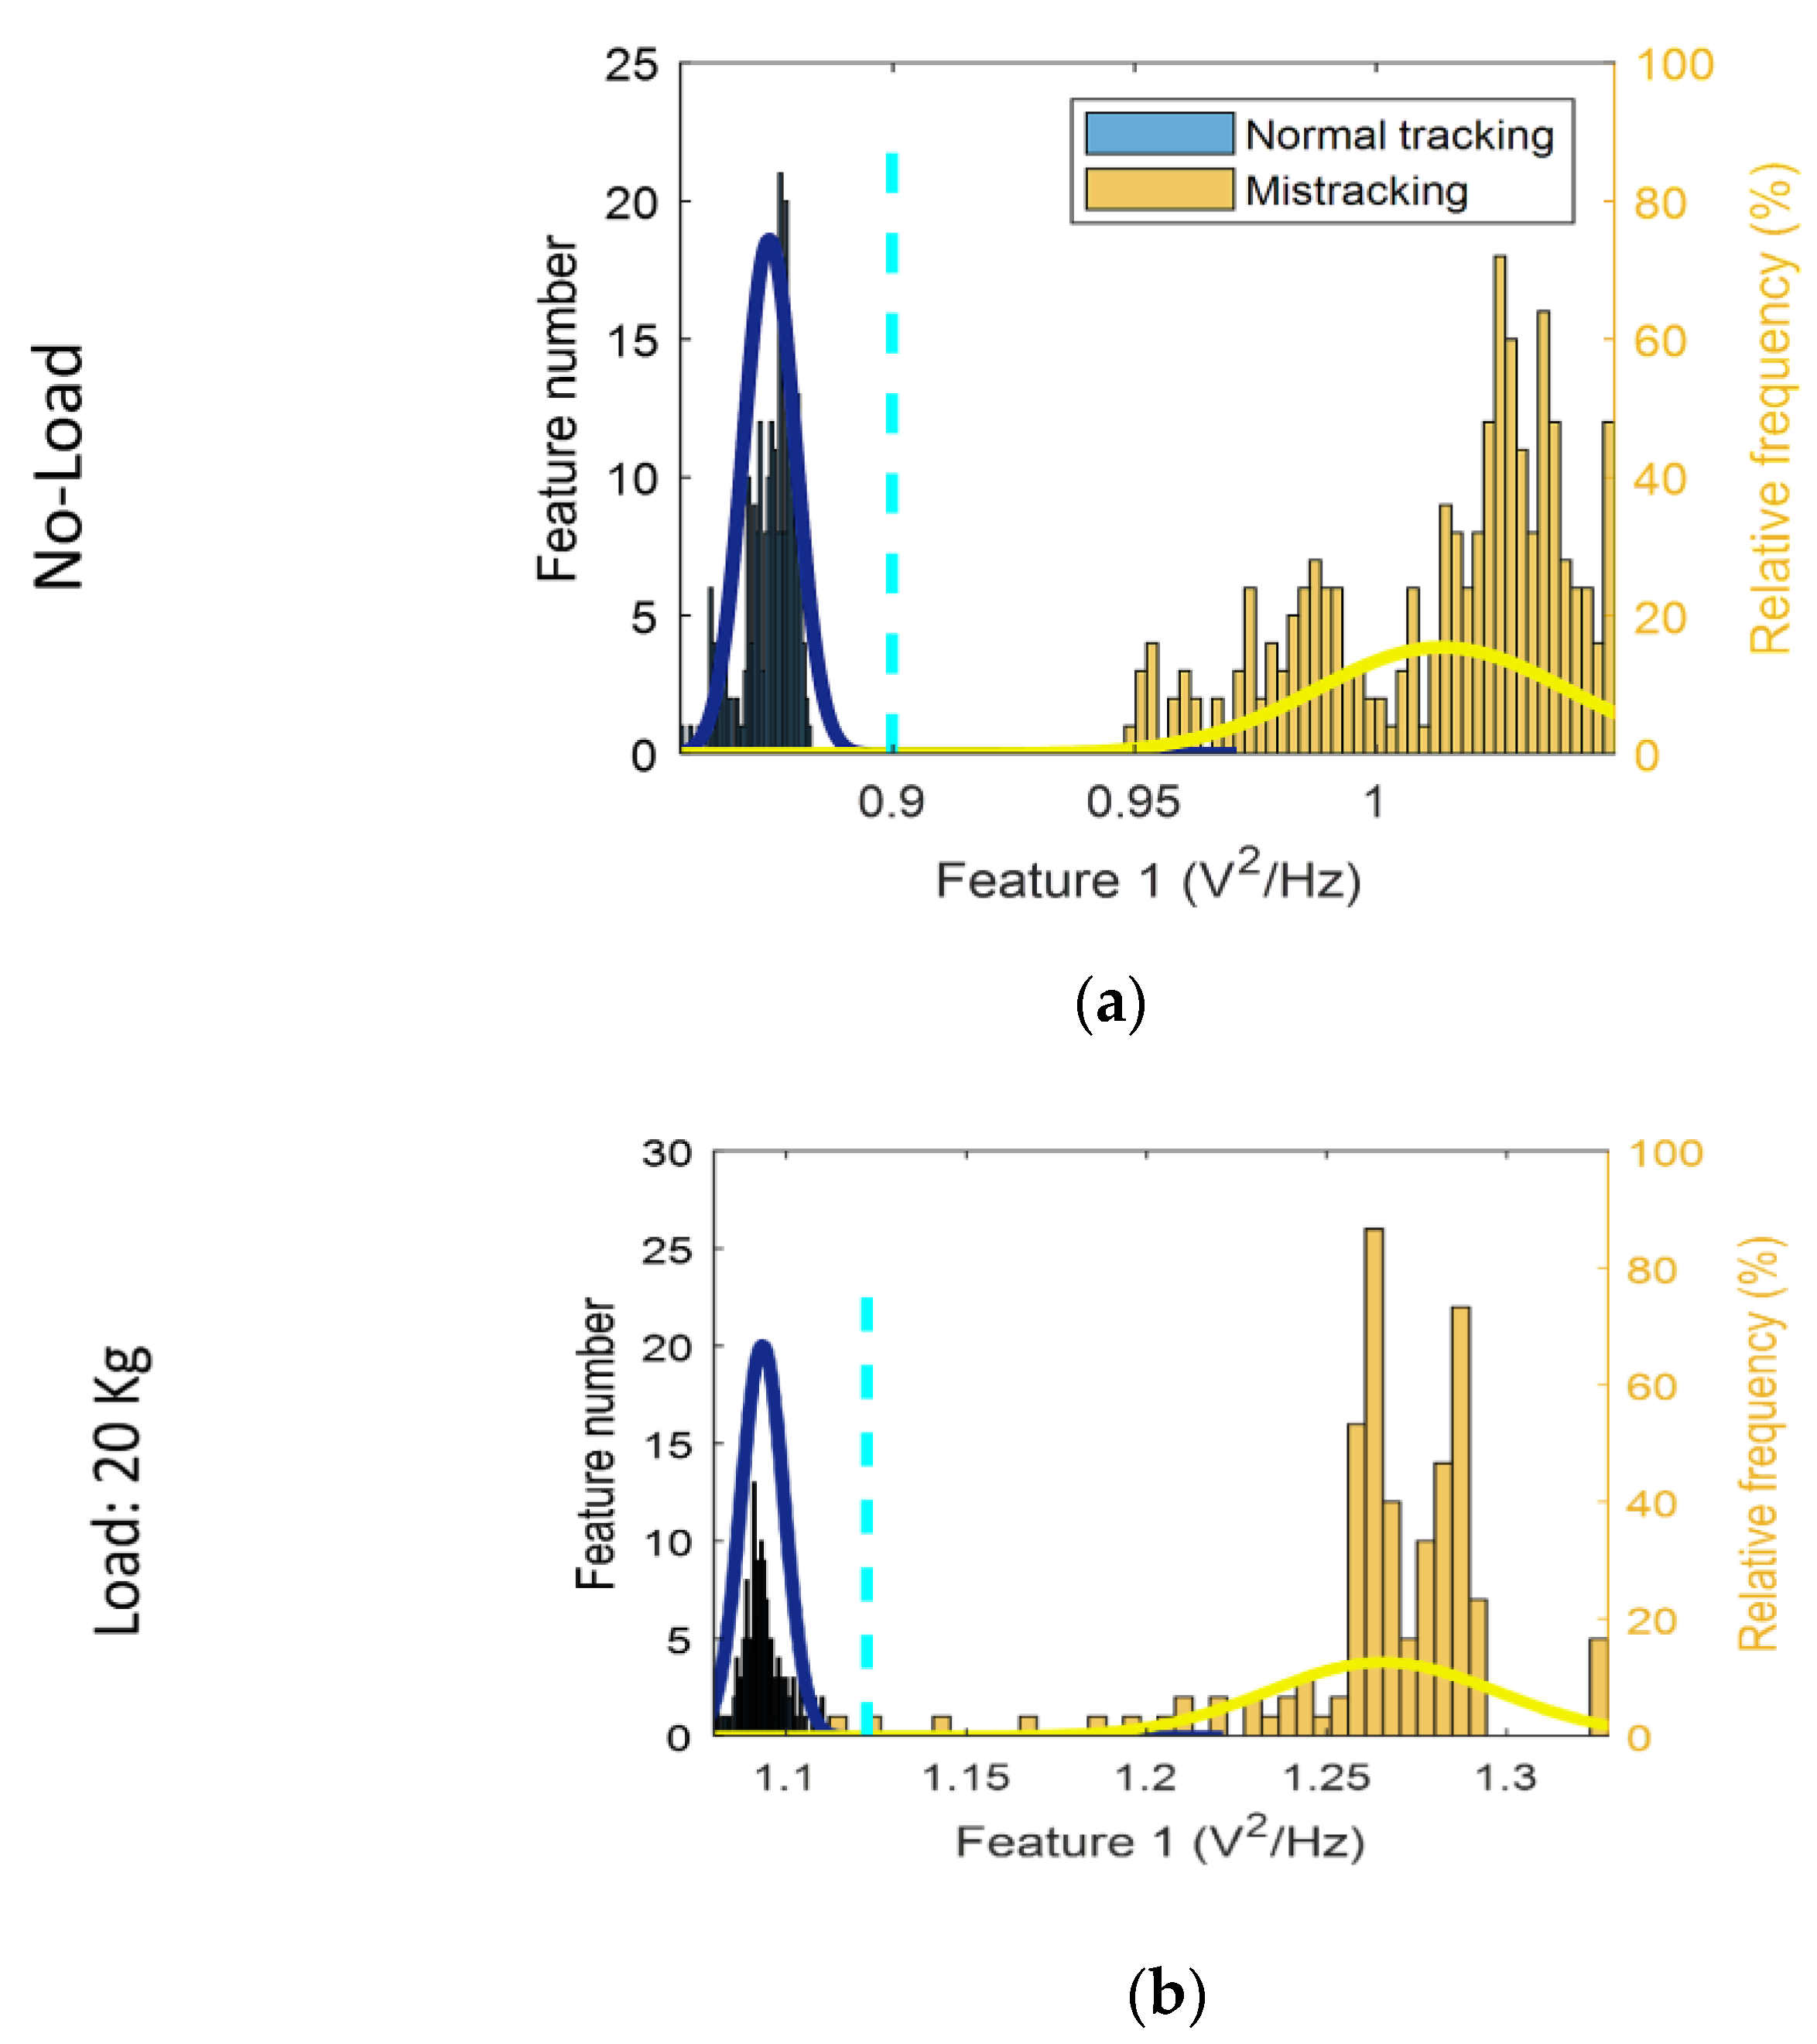
To compute the overall probability of true diagnosis, the normal (i.e., the Gaussian) probability density function (PDF) for each histogram was computed and the intersection points between two PDFs were selected as decision-making thresholds (i.e., the Bayesian rule, see
Figure 7, aqua dotted lines). If the power feature for a normal belt tracking condition has a lower value than the decision-making threshold, normal belt tracking is considered to be correctly diagnosed. If the power feature for a belt mis-tracking condition has a higher value than the decision-making threshold, belt mis-tracking is considered to be correctly diagnosed. The estimates of the total probabilities of correct diagnosis by the proposed technology are 100% and 99% for no-load and 20 kg load conditions, respectively see
Figure 7a and
Figure 7b respectively. It can be seen that the estimates of the total probabilities of correct diagnosis were high, so the normal belt tracking and belt mis-tracking cases were successfully diagnosed.
The data diversity related to various operational scenarios of belt conveyors should be addressed by proper training of the proposed technology. In particular, taking into account possible multiple combinations of speed and load of a belt conveyor, one needs to obtain proper training data related to these combinations of speed and load in order to reliably diagnose belt mis-tracking.
The proposed technology/diagnostic feature is not applicable to a variation of load and speed conditions of a conveyor if a conveyor’s load and speed are not known a priori or measured during a conveyor operation. This is a limitation of the proposed technology and should be taken into account if the variation of a conveyor’s speed and load are applied. However, the proposed technology/diagnostic feature is applicable to a variety of load and speed conditions if a conveyor’s load and speed are known a priori (as in the research presented here) or measured during a conveyor operation. In the last two conditions, for each known/measured level of a conveyor load/speed, training data related to the power diagnostic feature could be obtained for normal belt tracking (i.e., without a belt mis-tracking) and a mis-tracking diagnostics could be made via an anomaly detection.
4. Conclusions
It was proposed, for the first time worldwide, to employ integrated power in a frequency range around the fundamental harmonic of the supply frequency of a motor for the diagnosis of conveyor belt tracking;
The current signals of a gearmotor, driving a belt conveyor system, were recorded while the conveyor was operating under two loading conditions (i.e., no-load and 20 kg load) for the cases of normal belt tracking and belt mis-tracking;
The experimental results show that the proposed power feature is sensitive to the state of belt tracking and there is a dependency between the level of a belt’s mis-tracking and feature values; i.e., feature value increases/decreases with the increase/decrease of a mis-tracking level. The highest values of the power feature were achieved when a mis-tracking level reached its maximum;
The histograms of feature values for normal and mis-tracking conditions were separated and the tracking conditions were successfully experimentally diagnosed, with high estimates of the total probability of correct diagnosis of 100% and 99% for no-load and 20 kg load, respectively;
The proposed technology/diagnostic feature is applicable to variations of load and speed conditions only if a conveyor’s load and speed are known a priori (as in the research presented here) or measured during a conveyor operation;
This research is important for conveyor belt tracking monitoring. The concept and the innovative online automatic monitoring technique will create an impact on conveyor belt tracking monitoring for the airport industry, mining industry, various manufacturing industries, transportation industry, etc.
Author Contributions
Conceptualization, L.G.; methodology, L.G., A.O.A., A.M., G.C., W.K. and A.B.; software, A.M.; validation, L.G., A.M., G.C., A.O.A., A.B. and W.K. formal analysis, L.G., A.O.A., A.M. and A.B. investigation, L.G., A.O.A., A.M. and A.B., resources, G.C. and W.K.; data curation, A.M. and A.O.A.; writing—original draft preparation, A.M.; writing—review and editing, L.G. and A.O.A.; visualization, A.M. and A.O.A.; supervision, L.G. All authors have read and agreed to the published version of the manuscript.
Funding
This research received funding by Innovate UK, grant number 105538.
Data Availability Statement
Data is unavailable due to a privacy.
Acknowledgments
The authors acknowledge with thanks the financial support of Innovate UK, project number 35195, the help of A. Legg, and the help of P. Eaton (Levertech Engineering Services Ltd., UK) and his colleagues J. Fogg, S. Fields, R. Peatman and G. Fenton in performing experimental trials for technology validation and valuable comments of paper reviewers.
Conflicts of Interest
The authors declare no conflict of interest.
References
- Li, W.; Wang, Z.; Zhu, Z.; Zhou, G.; Chen, G. Design of online monitoring and fault diagnosis system for belt conveyors based on wavelet packet decomposition and support vector machine. Adv. Mech. Eng. 2013, 5, 797183. [Google Scholar] [CrossRef]
- Liu, X.; He, D.; Lodewijks, G.; Pang, Y.; Mei, J. Integrated decision making for predictive maintenance of belt conveyor systems. Reliab. Eng. Syst. Saf. 2019, 188, 347–351. [Google Scholar] [CrossRef]
- Stefaniak, P.; Anufriiev, S. Method of defining diagnostic features to monitor the condition of the belt conveyor gearbox with the use of the legged inspection robot. In Proceedings of the 12th Asian Conference on Intelligent Information and Database Systems, Phuket, Thailand, 23–26 March 2020; Springer: Singapore, 2020; pp. 158–167. [Google Scholar]
- Gelman, L.; Soliński, K.; Ball, A. Novel Instantaneous Wavelet Bicoherence for Vibration Fault Detection in Gear Systems. Energies 2021, 14, 6811. [Google Scholar] [CrossRef]
- Gelman, L.; Soliński, K.; Ball, A. Novel higher-order spectral cross-correlation technologies for vibration sensor-based diagnosis of gearboxes. Sensors 2020, 20, 5131. [Google Scholar] [CrossRef] [PubMed]
- Kolbe, S.; Gelman, L.; Ball, A. Novel Prediction of Diagnosis Effectiveness for Adaptation of the Spectral Kurtosis Technology to Varying Operating Conditions. Sensors 2021, 21, 6913. [Google Scholar] [CrossRef] [PubMed]
- Gelman, L.M.; Kripak, D.A.; Fedorov, V.V.; Udovenko, L.N. Condition monitoring diagnosis methods of helicopter units. Mech. Syst. Signal Process. 2000, 14, 613–624. [Google Scholar] [CrossRef]
- Gelman, L.; Persin, G. Novel fault diagnosis of bearings and gearboxes based on simultaneous processing of spectral kurtoses. Appl. Sci. 2022, 12, 9970. [Google Scholar] [CrossRef]
- Gryllias, K.; Gelman, L.; Shaw, B.; Vaidhianathasamy, M. Local damage diagnosis in gearboxes using novel wavelet technology. Insight Non-Destr. Test. Cond. Monit. 2010, 52, 437–441. [Google Scholar] [CrossRef]
- Gelman, L.; Patel, T.H.; Persin, G.; Murray, B.; Thomson, A. Novel technology based on the spectral kurtosis and wavelet transform for rolling bearing diagnosis. Int. J. Progn. Health Manag. 2013, 4, 2153–2648. [Google Scholar] [CrossRef]
- Błażej, R.; Jurdziak, L.; Kozłowski, T.; Kirjanów, A. The use of magnetic sensors in monitoring the condition of the core in steel cord conveyor belts–Tests of the measuring probe and the design of the DiagBelt system. Measurement 2018, 123, 48–53. [Google Scholar] [CrossRef]
- Kozłowski, T.; Wodecki, J.; Zimroz, R.; Błażej, R.; Hardygóra, M. A diagnostic of conveyor belt splices. Appl. Sci. 2020, 10, 6259. [Google Scholar] [CrossRef]
- Li, X.; Li, Y.; Zhang, Y.; Liu, F.; Fang, Y. Fault diagnosis of belt conveyor based on support vector machine and grey wolf optimization. Math. Probl. Eng. 2020, 2020, 1367078. [Google Scholar] [CrossRef]
- Otto, H.; Katterfeld, A. Belt Mistracking—Simulation and Measurements of Belt Sideways Dynamics. In Proceedings of the 13th International Conference on Bulk Materials Storage, Handling and Transportation, Gold Coast, QLD, Australia, 9–11 July 2019. [Google Scholar]
- Kobayashi, Y.; Toya, K. Effect of belt transport speed and other factors on belt mistracking. Microsyst. Technol. 2007, 13, 1325–1330. [Google Scholar] [CrossRef]
- Horihata, S.; Kitagawa, H.; Shirakawa, Y. Conveyor-Belt Diagnostic System using Time-Frequency Analysis. In Advances in Manufacturing: Decision, Control and Information Technology; Springer: Berlin/Heidelberg, Germany, 1999; pp. 123–132. [Google Scholar]
- Farhat, M.H.; Gelman, L.; Conaghan, G.; Kluis, W.; Ball, A. Novel Diagnosis Technologies for a Lack of Oil Lubrication in Gearmotor Systems, Based on Motor Current Signature Analysis. Sensors 2022, 22, 9507. [Google Scholar] [CrossRef] [PubMed]
- Combet, F.; Gelman, L. An automated methodology for performing time synchronous averaging of a gearbox signal without speed sensor. Mech. Syst. Signal Process. 2007, 21, 2590–2606. [Google Scholar] [CrossRef]
| Disclaimer/Publisher’s Note: The statements, opinions and data contained in all publications are solely those of the individual author(s) and contributor(s) and not of MDPI and/or the editor(s). MDPI and/or the editor(s) disclaim responsibility for any injury to people or property resulting from any ideas, methods, instructions or products referred to in the content. |
© 2023 by the authors. Licensee MDPI, Basel, Switzerland. This article is an open access article distributed under the terms and conditions of the Creative Commons Attribution (CC BY) license (https://creativecommons.org/licenses/by/4.0/).


 ,
, 


