Abstract
In view of the problems in planning and recommending tour routes, this paper constructs a feature text mining (FTM) method and spatial accessibility model (SAM) as the key factors for scenic spot recommendation (SSR) and tour route recommendation (TRR). The scenic spot clustering algorithm (SSCA) based on FTM was constructed by tourists’ text evaluation data mining. Considering the spatial attributes of scenic spots, the scenic spot topology tree algorithm (SSTTA) based on dynamic buffer spatial accessibility (DBSA) was constructed. The optimal scenic spots were recommended based on interest matching and spatial accessibility optimization. As to the recommended scenic spots, this paper proposes an optimal tour route recommendation algorithm (TRRA) based on SSTTA, which aims to determine the optimal adjacent section path structure tree (ASPST) with the lowest cost under travel constraints and transportation modes. The experiment verifies that the proposed algorithm can recommend scenic spots that match tourists’ interests and have optimal spatial accessibility, and the optimal tour routes with the lowest costs under certain travel constraints. Compared with the searched sub-optimal tour routes, the optimal tour route recommended by the proposed algorithm produces the lowest travel costs, and all the scenic spots in the tour route meet the tourists’ interests. Compared with the commonly used BDMA and GDMA methods, the proposed algorithm can determine the optimal routes with lower travel costs.
1. Introduction
1.1. Research Background and Problem Analysis
The core aim of intelligent tourism recommendation systems is to provide scenic spots and routes for tourists. There are many ways to recommend scenic spots, for instance, predicting tourists’ interests based on their browsing activities on tourism websites, and recommending scenic spots based on the click frequencies. The recommendation system searches for users who have similar behavior habits to the tourists and recommends similar users’ favorite scenic spots to the current users. In addition, scenic spots can be recommended through the user’s subjective evaluation scores. Based on tourism big data, the system recommends the popular routes with high scores evaluated by previous tourists. However, existing tourism recommendation systems have certain deficiencies and limitations [1,2]. The user’s behavior when browsing tourism websites is random, and the clicking frequencies that really represent tourists’ interests account for a small proportion of a large number of clicking behaviors. Meanwhile, tourists have relatively low awareness of unfamiliar tourism cities and urban scenic spots. Clicking behaviors only indicate that tourists have a certain preference for the scenic spot’s name and introduction, which does not represent whether the feature attributes of the scenic spot can really meet the tourists’ interests. By evaluating previous tourists whose behaviors are similar to the current tourists, the system recommends the scenic spots and tour routes that the previous tourists have visited. This method is designed on user similarity, and the recommendation results may not meet the tourists’ requirements. Because of the individual differences, the behaviors of previous tourists cannot directly represent the real interests of the current tourists. The method to recommend scenic spots by users’ evaluation scores takes scenic spots as the basic unit. Tourists’ scoring on scenic spots relies on their subjective judgments, since they lack knowledge of scenic spots, such as the tourism functions and feature attributes of the scenic spots. The recommended scenic spots may not match the tourists’ interests [3,4].
1.2. Related Theoretical Foundations
For the target of scenic spot recommendation, it is necessary to consider the tourist interest features and scenic spot attributes, including feature attributes and spatial attributes. By constructing the matching relationship between tourist interest needs and scenic spot attributes, a matching model between tourist demand data and scenic spot functions could be directly established, thereby recommending the optimal scenic spots for tourists. On the basis of recommending the best scenic spots, the proposed algorithm integrates urban geospatial data and searches for the most cost-effective tour routes according to different travel modes, which can minimize travel costs and improve tourist satisfaction. According to the research objectives, the theoretical foundations involved in constructing the model mainly include the following aspects.
- (1)
- Text-mining method. We use the text-mining algorithm to obtain the feature attributes of scenic spots. Text information, such as descriptions of scenic spots, evaluations of tourists, and related literature, serves as the data source for mining the attributes of scenic spots. The label attributes are quantified by using the text statistics method to obtain the clustering features of text labels in the different attribute categories and obtain the attribution of scenic spots.
- (2)
- Clustering method. The clustering method is an unsupervised learning method in data mining that clusters objects with similar attribute relationships into one class, while objects with distant attribute relationships are dispersed into different classes. By using text statistics and label quantification, the clustering degree of each scenic spot on the text attribute in each cluster is obtained, thereby achieving scenic spot clustering.
- (3)
- Spatial accessibility model. Spatial accessibility describes the difficulty of traveling from a certain point to a destination point, which is usually measured by the straight-line distance or travel distance between two points. We adopted the spatial accessibility method to measure the accessibility difficulty between the current starting point and the target scenic spot in order to dynamically search for the scenic spot with the best spatial accessibility.
- (4)
- Graph theory method. Graph theory is a method of abstracting real-world problems into graphics and solving the problems via geometric calculation methods. The urban road network used in our proposed route algorithm is suitable for abstracting as a graph. Scenic spots and road nodes can be abstracted as vertices of the graph, and the roads connecting scenic spots and nodes can be abstracted as edges of the graph. According to the algorithm definition, the constructed graphs are all closed graphs, and the weighted edges are all unidirectional flowing edges.
- (5)
- Route-planning method. The route-planning method is a type of method that mainly plans routes that meet preset conditions based on the spatial points as the framework. Our proposed route-planning method aims to minimize travel costs, including two categories: minimizing time costs and minimizing the cost of expenses. By searching for road nodes between the starting point and target point, we constructed the sub-intervals between points and searched for the shortest path in each sub-interval, which could iteratively generate a route with the lowest cost in the entire domain.
1.3. The Structure and Research Content of the Work
Based on the analysis of the background and theoretical foundations, we constructed an intelligent route-recommendation algorithm based on feature text mining and the spatial accessibility model. The structure and research content of this work are as follows.
- (1)
- Introduction. Elaborates on the background of the problem, theoretical foundations, and work structure;
- (2)
- Related work analysis. Summarizes and analyzes the literature closely related to the research content in recent years, compare the research content with relevant literature, and summarize the advantages of our study;
- (3)
- Methodology. The research methodology consists of three parts:
- ①
- Constructing an unsupervised clustering algorithm for scenic spots based on feature text mining and implementing a text-mining algorithm to cluster scenic spots in feature attributes within the research domain, which provides preconditions for the scenic spot recommendation;
- ②
- Constructing a scenic spot topology tree algorithm based on spatial accessibility dynamic buffer searching to recommend scenic spots for tourists from the perspectives of feature attribute matching and optimal spatial accessibility;
- ③
- Constructing an optimal tour route planning algorithm based on the scenic spot path structure tree, which searches for the route with the lowest travel cost for tourists based on the recommended scenic spots.
- (4)
- Experiment and result analysis. Designs a sample experiment using the tourism city of Chengdu to verify the feasibility of the proposed algorithm. At the same time, the comparative experiment is designed and compared with the electronic maps commonly used for planning tourism routes, and obtain the advantages of the proposed algorithm;
- (5)
- Conclusion and prospect. Summarizes the research content of the whole study and discusses the limitations of the proposed method and the improvements in the next steps of research.
2. Related Work
2.1. Analysis of Related Work
Yun et al. [5] used the Naive Bayes model to evaluate users’ interests. This method finally improved the collaborative filtering algorithm’s performance and increased the recommendation accuracy. Lin [6] proposed a depth CTR recommendation model based on the gradient lifting tree and factor decomposer, which improved the performance of the recommendation system. Pacheco et al. [7] brought forward a deep-learning recommendation system on scenic spots based on the Internet of Things and improved the system’s performance. Han [8] proposed a scenic spot recommendation method, combining geographical labeled photos with time, space, and visual embedding. Zheng et al. [9] proposed a two-stage greedy algorithm based on crowd sensing to solve the problem of TRR. The crowd sensing score mechanism was used to explore the locations of POIs surrounding scenic spots and the influence of user evaluations of scenic spots, by which the tour routes were planned. Lyu [10] used the convolutional neural network to construct a tour route-planning algorithm, which had good learning control ability and convergence performance. It could improve the reliability of tour route planning. Niu [11] proposed a smart tour guide system based on attraction positioning and recommendation. The RankSVM + time algorithm and K-means clustering algorithm were used to obtain the scenic spot recommendation, and the route algorithm was then set up to plan tourist routes. Finally, a smart tour guide system was set up. Li et al. [12] constructed a tour route algorithm based on an improved knowledge ant colony algorithm, taking the maximization of the overall satisfaction of all tourist groups as the objective function. The algorithm can determine the optimal route with higher efficiency.
Based on the above analysis, the current research on SSR and the TRR mainly focuses on optimizing the algorithm performance and efficiency, or increasing the recommendation accuracy, searching tour routes with high algorithm efficiency, etc. Therefore, SSR and TRR still have the following problems.
- (1)
- They usually ignore the studies on tourists’ interests and focus on mathematical issues, such as algorithm optimization and computational speed. This type of research mode has certain significance for improving the recommendation algorithm’s performance, but it is difficult for individual tourists to obtain the maximum motive benefits by recommending scenic spots and tour routes while ignoring their interests;
- (2)
- The research on the functional attributes of scenic spots is insufficient, especially on the scenic spot categories and the scenic spots’ capacities to match tourists’ interests. This problem results in the fact that the recommended scenic spots do not fully match tourists’ interests, further causing the planned tour routes to not satisfy their needs, which greatly reduces the tourists’ motive benefits. The core issue of tour route planning is always to meet the tourists’ satisfaction. However, some research has not fully considered the core issue, as well as urban geospatial conditions, urban traffic conditions, and other factors.
2.2. The Superiority of the Proposed Method
To solve the problems, we constructed an intelligent geo-tour route-recommendation algorithm (TRRA) based on feature text mining (FTM) and the spatial accessibility model (SAM). The scenic spot clustering algorithm (SSCA) was constructed by text data mining, and the scenic spots were clustered by SSCA. Using the text labels as the interest data standard, we constructed the tourist interest tendency model to obtain the matching relationship between the scenic spots and the tourists’ interests, and then determined the recommended category and scenic spots for the tourists. In view of the particularity and complexity of the urban geospatial environment, and considering the tourists’ travel conditions, the spatial distribution and spatial accessibility of urban scenic spots were considered as the important factors for recommending scenic spots and planning tour routes. Combined with the tourists’ preferences in choosing transportation modes, the TRRA based on SAM was constructed. Through the proposed method, the tour routes could not only meet the tourists’ interests, but also have an optimal geospatial distribution. On the premise of meeting tourists’ interests, the recommended tour routes could reduce travel costs and improve tourists’ motive benefits [13,14].
2.2.1. Comparison with Literature Work
Based on the analysis of existing studies, the proposed algorithm has significant advantages over the literature [5,6,7,8,9,10,11,12].
Reference [5] used the Naive Bayes method and collaborative filtering method to recommend scenic spots. The Naive Bayes classification algorithm itself has flaws. In the case of a missing quantity or score of certain attribute features, it might cause the calculation result of conditional probability to be 0, resulting in sample classification error and causing interest matching bias. The collaborative filtering algorithm is essentially a recommendation based on the similarity of users or scenic spots, and it does not set up the algorithm from the perspective of the current tourists’ interest matching. The advantage of the proposed algorithm lies in obtaining accurate interest evaluations of tourists, and then recommending scenic spots with the best-matched feature attributes. It has no defects and higher accuracy.
The algorithms constructed in references [6,7] aim to improve the AUC (area under the ROC curve), cross entropy, recall, accuracy, etc. of recommendation algorithms, and they still make improvements from the perspective of optimizing algorithm performance, ignoring the core issues of interest matching and maximizing dynamic benefits. The advantage of our proposed algorithm lies in its exploration of tourist interests, scenic feature attributes, and route optimization, with the goal of searching for the global optimal solution. From the perspective of satisfying tourist interests and motive interests, it searches for the best-matched scenic spot and the most cost-effective route.
Reference [8] adopted the method of mining geographical photos to obtain the historical tourism positioning and interests of tourists, thereby optimizing the tourism recommendation model. The mode of mining and collecting historical photos still relies on mining historical data to obtain recommendations that approximate interests; it cannot represent the current tourists’ interests, which is a flaw in mining historical data for interest research. The advantage of our proposed algorithm lies in avoiding the mining of historical data and directly using current tourist interest data and current tourism city geospatial data as sources for matching the best scenic spots and searching for the best routes, resulting in higher accuracy.
Reference [9] recommended tour routes based on crowd perception, without recommending scenic spots from the perspective of individual tourist interest and matching with feature attributes, nor did it present a complete specific algorithm for planning the lowest-cost route based on the best-matched scenic spots. The advantage of our proposed algorithm lies in recommending the best-matched scenic spots based on tourist interests, and searching for the lowest-cost routes based on the current geographical and spatial constraints of tourism cities. It not only meets the personalized needs, but also minimizes the travel costs.
The method constructed in reference [10] aims to optimize the learning control ability and convergence performance of the route-planning algorithm, while the algorithm constructed in reference [11] aims to improve the speed and accuracy. Essentially, it is still an improvement on the computer algorithm, without considering the personalized needs of tourists and the attributes of scenic spots, and without considering the geospatial constraints to search for the route with the lowest cost. The advantage of our proposed algorithm is that it can search for the optimal scenic spots and routes to meet the interests of tourists and reduce costs.
The method constructed in reference [12] aims to meet the needs of tourist groups and improve the revenue of tourism enterprises without considering the personalized needs of individual tourists. When constructing a route algorithm, the goal is to improve the algorithm’s computational speed, which is essentially optimizing the algorithm, rather than improving tourist satisfaction. The advantage of our proposed algorithm lies in meeting the interests of individual tourists and searching for the global lowest-cost route.
2.2.2. Comparison with the Commonly Used Route-Planning Methods
In actual tourism activities, the route-planning tool used by tourism enterprises, travel agencies, or tourists is an electronic map. The most commonly used electronic maps are Baidu Map, Gaode Map, etc. Due to the influence of the GPS navigation hardware usage environment and the limitations of software map data, there are some insurmountable problems in using electronic maps to plan routes:
- (1)
- In order to avoid certain factors, such as traffic lights, intersections, and congested road conditions, electronic maps sometimes recommend longer routes to users without considering transportation modes, resulting in increased travel costs;
- (2)
- The recommended route is the overall route and cannot change the shortest path and ferrying mode between route nodes based on user needs and changes in transportation modes;
- (3)
- It is easy to overlook secondary roads and road nodes with identical functions, resulting in the searched route potentially not being the shortest. Especially for those cities with very complex road structure networks, the recommended number of routes is generally limited to 3–4, and due to the complexity of the road network and many nodes, other alternative optimal routes might be ignored. The map-searching algorithm may output local or approximate optimal solutions, rather than global optimal solutions.
In comparison, the proposed algorithm can effectively solve these problems. It considers two modes: the optimal travel time and the lowest route cost. It takes the subspace between two scenic spots as the local area of the searching route and collects all nodes within the subspace and traverses all nodes to search for the global optimal solution. The algorithm considers different transportation modes. The experiment shows that, when the transportation modes are “taxis” and “buses + shared bicycles (or walking)”, the overall performance of the algorithm is stable, and it can determine routes with lower costs than Baidu Map and Gaode Map in each sub-interval, making the overall output route cost the lowest. According to the calculation results, when the transportation mode is “taxi”, the cost weight of the proposed algorithm is 1.079 higher than Baidu Maps and 1.051 higher than Gaode Maps; When the transportation mode is “bus + shared bicycles (or walking)”, the cost weight of the proposed algorithm is 1.126 higher than Baidu Maps and 0.943 higher than Gaode Maps. The higher the weight is, the lower the total cost of the line will be. By comparison, it can be seen that the proposed algorithm is more cost-effective than Baidu Maps and Gaode Maps in terms of travel costs.
3. Methodology
Tourists usually have a habit of evaluating their travel experience after visiting scenic spots. They often provide subjective and genuine text evaluations. The text evaluations of a scenic spot by tourists imply their interest preferences for scenic spots and can reflect the basic functional attributes of the scenic spot. By mining and analyzing a large number of historical tourists’ text evaluations, we used the unsupervised learning method to build the SSCA and obtain the functional categories of scenic spots in the form of clustering. The purpose of the SSCA is to determine the functional attributes of scenic spots to meet tourists’ interests and provide structured data for matching the tourists’ interests and designing the scenic spot recommendation algorithm. Therefore, the design of a tourist interest evaluation matrix based on FTM can help in obtaining the tendencies of tourists’ interest in the functional attributes of tourism. Through mining the interest tendencies for the functional attributes and matching with the functional attributes of scenic spots, the SSRA based on tourists’ interests was constructed. In the urban geospatial environment, tourists will be constrained by the geospatial conditions when traveling. Therefore, optimal tour route planning based on the recommended scenic spots must consider the real-world tourism conditions. Urban scenic spots are distributed in different geographical locations, with different spatial attributes and accessibilities. The higher accessibility a scenic spot has, the easier it is for tourists to get to, and the lower the travel cost will be, and vice versa. The spatial accessibilities of scenic spots have a direct impact on travel costs. For two scenic spots that both satisfy tourists’ interests, the scenic spot with higher accessibility has superiority in distance and cost. Thus, considering the actual travel conditions, it is necessary to combine the spatial attributes and accessibilities as factors to construct the SSRA to ensure that the recommended scenic spots are optimal in functional attributes and spatial accessibilities, and can well match the tourists’ interests and travel conditions [15,16,17]. Based on the recommended scenic spots, the TRRA was constructed with the different transportation modes selected by tourists.
3.1. The Modeling of the SSCA Based on FTM
Historical tourists’ text evaluations of scenic spots contain massive interest knowledge. Mining scenic spot evaluation text can obtain the interest tendency for the scenic spot category [18,19,20,21,22]. The principle of modeling is as follows: Divide several unknown clusters based on the features and functional attributes of the urban scenic spots, and each cluster will contain a certain number of scenic spots. According to the clustering features and functional attributes, expand the feature text of each unknown cluster, which represents its internal features. Based on the feature text of the different unknown clusters, the interest mining algorithm for the scenic spot evaluation text was constructed to obtain the functional attribute tendency for the scenic spots, and then finally obtain the cluster for each scenic spot.
Definition 1.
Unknown scenic spot cluster , scenic spot in cluster , and cluster capacity . The categories used to distinguish the features and functional attributes of the scenic spots are defined as the unknown scenic spot cluster , , , and is the number of cluster . A sample scenic spot in the research domain is grouped into an unknown cluster , and the scenic spot is defined as a cluster of scenic spots in cluster , where is the cluster number and is the scenic spot number in cluster . The number of scenic spots included in the cluster after the clustering process is defined as the clustering capacity .
Definition 2.
Cluster feature text , cluster feature text vector , and cluster feature text matrix . Regarding the unknown scenic spot cluster , confirm the number of text keywords that can stand for the functional attributes and scenic spot features of cluster . Define the text keyword as the cluster feature text, noted as , , , where corresponds to cluster and represents No. feature text of cluster . The dimension vector is constructed based on cluster and feature text . The vector contains number of elements, and each element stores one cluster feature text . This vector is defined as the cluster feature text vector. Footmark order of unknown cluster is the row of vector , and footmark of feature text is the column. A dimension matrix is constructed to store feature vectors , which is defined as the cluster feature text matrix.
According to the definition, , , and meet the following constraints:
- (1)
- All of are the text elements, and and are the text vector and the text matrix respectively, , , and ;
- (2)
- Any element of and can satisfy the condition ;
- (3)
- The vector must be fully ranked, and the rank satisfies ;
- (4)
- The row rank and the column rank of satisfy and , and any two rows and any two columns are nonlinearly correlated. The no. row of the matrix corresponds to the vector .
Formula (1) is constructed from , , and .
Definition 3.
Feature text word frequency , feature text word frequency vector , and feature text word frequency matrix of the sample scenic spot . For any scenic spot , a large amount of evaluation text on tourism websites is obtained and stored in a structured format to form an original text dataset . The frequency of the cluster feature text of the sample in the text dataset is defined as the word frequency of the feature text. A dimension vector is constructed corresponding to a feature text vector of an unknown cluster. The vector contains elements, and each element stores one feature text word frequency of vector . This vector is defined as the feature text word frequency vector. Relating to , a dimension matrix is constructed to store feature text word frequency vectors . The cluster footmark order is set as the vector row and the feature text footmark is set as the column.
Regarding the definition, , , and meet the following constraints:
(1) is a numerical element. and are the numerical vector and matrix, , , ;
(2) Vector must be a full rank, and the rank of the column satisfies ;
(3) The row rank and the column rank of matrix satisfy and . Row no. of the matrix corresponds to vector .
Formula (2) is constructed as the relationship among , , and .
The sample scenic spots in the urban geographical space are evaluated by the tourists to obtain the textual expression of their functional attributes. Usually, the tourists evaluate the functional attributes of the scenic spots from the perspective of interests, so that the functional attributes and categories of the scenic spots can be determined by the text knowledge. As to the sample scenic spots , massive text evaluations are mined and then their feature text word frequencies are obtained. By modeling the feature text word frequency, the function categories of the sample scenic spots can be obtained and the scenic spots can be classified into certain unknown clusters as cluster elements .
Definition 4.
The scenic spot cluster absolute objective function and the scenic spot cluster relative objective function . The scenic spot cluster absolute objective function reflects the feature text word frequency statistics of unknown cluster corresponding to the sample scenic spots , and it represents the absolute tendency of the sample scenic spots being gathered to cluster . The scenic spot cluster relative objective function reflects the proportion of the feature text word frequency corresponding to the unknown cluster of the sample scenic spots in the total statistical amount of feature text word frequency of the total number of clusters . It represents the relative tendency of the sample scenic spots being gathered to cluster .
The scenic spot cluster absolute objective function and scenic spot cluster relative objective function based on FTM and feature text word frequency are constructed as Formulas (3) and (4).
Definition 5.
Scenic spot cluster tendency vector . The dimension descending order vector is constructed based on the scenic spot cluster relative objective function . The vector stores the relative function value in the form of the maximum heap, and it is defined as the scenic spot cluster tendency vector, noted as . The vector element is noted as .
The vector storage mode meets the maximum heap condition:
- (1)
- The vector is full-rank, and the rank is ;
- (2)
- For any of and , if there is , there must be ;
- (3)
- The element corresponds to the maximum function value and the element corresponds to the minimum function value .
The SSCA based on FTM is constructed as follows (Algorithm 1). Figure 1 shows the algorithm flow of the SSCA based on FTM.
| Algorithm 1: The SSCA based on FTM | |
| Input: Samples , text data set . Output: Cluster with number of samples . | |
| Step 1 | Preset clusters , , and . Confirm number of for each . Initialize and . |
| Step 2 | For , search for row no. 1’s text of in set , traverse . |
| 2.1 | Search for of , store in of relating to . |
| 2.2 | Search for of , store in of relating to . |
| 2.3 | Search for of , store in of relating to , till . End. |
| 2.4 | Calculate for . |
| Step 3 | For , search for row no. 2’s text of in set , traverse . |
| 3.1 | Repeat 2.1–2.3, search for of , store in of relating to , till . End. |
| 3.2 | Calculate for . |
| Step 4 | Repeat Step 3–Step 4. For , search for row no. ’s text of in set , traverse , , . Search for of , store in the related of relating to . Generate and calculate for . |
| Step 5 | Based on and , calculate and store in . |
| 5.1 | Compare and : |
| (1) If , store in and in . (2) If , store in and in . | |
| 5.2 | Compare , , and : |
| (1) Store the maximum in . (2) Store the sub-maximum in . (3) Store the minimum in . | |
| 5.3 | Repeat 5.1–5.2, store and traverse , till . End. |
| 5.4 | Take the no. 1 as the , sample is clustered into of the . Store into and note it as . |
| Step 6 | Repeat Step 2–Step 5, and calculate and cluster all samples into related . Note in each , , and . End. |
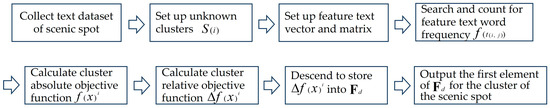
Figure 1.
The algorithm flow of the SSCA based on FTM.
3.2. Modeling of the SSTTA Based on the DBSA
The scenic spot cluster knowledge and tourist features mined from the historical tourists’ text evaluations reflect the degree to which the tourists prefer an unknown cluster in the aspect of the interest tendency and also reflect the capacity of the scenic spots’ functional attributes to match tourists’ interests. First, based on the cluster feature text vector , the feature text is used as the quantitative label. The current tourists select and score the quantitative labels, by which the current tourists’ interest tendencies for the scenic spot cluster are obtained. Second, in the aspect of recommending scenic spots, it is necessary to further explore the tourists’ interests in a single scenic spot in each cluster. Regarding the feature text of the vector , the feature text function measurement values of the sample scenic spots are obtained from the urban tourism information service platform and the geographic information service platform. It is then matched with the tourists’ scoring on the feature text so as to obtain the matching degree of the functional attributes between a single scenic spot and the tourists’ interests. From the perspective of spatial features, the research domain is a certain geospatial range and the distributed scenic spots have spatial attributes, such as coordinates, azimuth, straight-line distance, travel distance, etc. Therefore, the spatial attributes must be taken into account when recommending tour routes. The process of tourists traveling among scenic spots will arouse time and fee costs, which are determined by the spatial accessibility of scenic spots [23,24,25,26,27,28]. Regarding the modeling idea, the relationship model between the tourists’ interests and the cluster of scenic spots is constructed, and the scenic spot searching model based on DBSA is constructed.
Definition 6.
Tourist feature evaluation matrix and cluster scoring function . Based on the cluster feature text matrix , the feature text corresponding to each cluster feature text vector in matrix is assigned by the hundred percentage point system score of 100 for pre scoring. The score is , , . Construct a dimension matrix with the same dimensions as matrix . Row no. of matrix corresponds to the scoring of cluster No. ’s feature text vector , and column no. represents the scoring of feature text no. in cluster no. . The matrix is defined as the tourist feature evaluation matrix. The scores in matrix are normalized and iterated to obtain the average statistical score of the tourists on the cluster. The function to obtain the average statistical score is defined as the cluster-scoring function, noted as . The cluster-scoring function value determines the tourists’ degree of interest in cluster . Formulas (5) and (6) are constructed as the tourist feature evaluation matrix and the cluster scoring function .
Definition 7.
Scenic spot feature measurement matrix . Based on the cluster feature text matrix , the feature text function measurement values of the sample scenic spots are obtained from the urban tourism information service platform and the geographic information service platform. Each value is scored by the hundred percentage point system, , . Construct a dimension matrix with the same dimensions as matrix . Row no. of matrix corresponds to the measurement value of the no. cluster feature text vector of the sample scenic spot , and column no. represents the measurement value of feature text no. in cluster no. . Matrix is defined as the feature measurement matrix of scenic spot .
Definition 8.
Scenic spot feature-measurement function . The number of scenic spots in cluster is . When the sample scenic spot is listed as a cluster element , the measurement value of its cluster is extracted from the determined scenic spot feature-measurement matrix . The measurement value in row no. of matrix expresses the feature attribute of scenic spot in its cluster. The measurement value that satisfies the tourists’ interests is defined as the feature measurement function of scenic spot .
Function is constructed in Formula (7). By calculating the function values, the ability of each scenic spot in the same cluster to match tourists’ interests can be obtained. According to the definition, the higher the measurement function value is, the stronger the ability of a scenic spot to match tourists’ interests will be, and vice versa.
In the tour route, each scenic spot can be regarded as a space point . When searching for scenic spots in a tour route, the current scenic spot is reference point when the tourists have finished visiting it and are preparing to search for the next scenic spot. Therefore, on the basis of ensuring that the scenic spot meets the tourists’ interests, the current scenic spot is taken as the reference point to search for the next one, which both meets the tourists’ interests and has the best spatial accessibility. According to the determinants of spatial accessibility, tourists are constrained by the urban geospatial conditions when they travel in an urban area. When tourists choose different kinds of transportation modes, the travel time, travel distance, and fee costs will be different.
Definition 9.
Dynamic spatial accessibility function . In urban space, the straight-line distance between space point and space point is . According to Definition 1, the number of scenic spots in the city meets . The sample scenic spot in the city is noted as , , . If the current reference point is an arbitrary scenic spot , then the dynamic spatial accessibility function for scenic spot in the scenic spot set is constructed as Formula (8), , , and .
When the reference scenic spot changes dynamically, the function value will change. The search for the best scenic spot is a dynamic process, with the optimal value eliminating the sub-optimal one. Function value reflects the accessibility measurement between point and reference point . The higher the function value is, the weaker the accessibility of point will be, and vice versa. When the dynamic reference point is always the same point, it is a special case for the spatial accessibility function ; that is, the dynamic reference point is permanent for each iteration.
Definition 10.
Dynamic searching buffer radius . When searching for the scenic spots for tour route, the current reference point is taken as the circle center, the radius is taken as the range to radiate the circular buffer, and the next point is searched in the buffer. When the best reference point cannot be found in the buffer, the radius is expanded to continue searching.
Definition 11.
Reference point dynamic storage vector . Starting from point , the dynamic searching is carried out for the number of scenic spots in all clusters . Under the constraints of cluster , the feature measurement function and the dynamic space accessibility function , a vector with dimension is constructed according to the tourists’ expected number of scenic spots. The vector is used to store the qualified reference scenic spots, and it is defined as the reference point dynamic storage vector. Finally, the scenic spots stored in the vector will be recommended to the tourists.
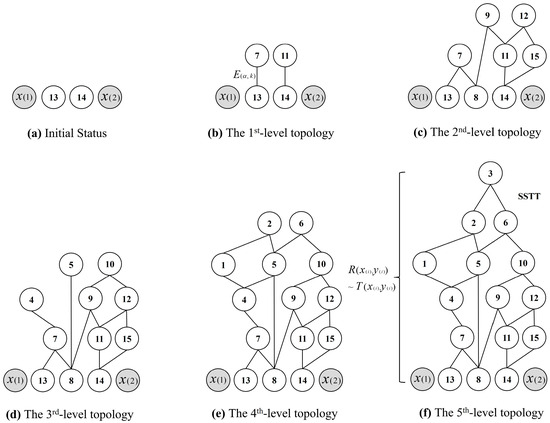
According to the modeling idea and the above definitions, the SSTTA based on DBSA is constructed as follows (Algorithm 2). Figure 2 is the modeling process to construct the SSTTA. Figure 2a represents the scenic spot distribution map, Figure 2b represents the extracted scenic spots and starting point, Figure 2c is the constructed SSTT found by the searching algorithm, and Figure 2d–f represent the process to search the SSTT in multiple layers of buffers. Figure 3 shows the algorithm flow of the SSTTA based on DBSA.
| Algorithm 2: The SSTTA based on DBSA | ||
| Input: Clusters , scenic spots , matrix , radius , number of to be visited scenic spots, and starting point . Output: Vector . | ||
| Step 1 | Based on , tourists make scores on to form . Calculate for , traversing , . Select number of scenic spots to be visited in each . | |
| Step 2 | In , confirm for each . Calculate of based on . | |
| Step 3 | Input , , , and , search for the feasible . | |
| 3.1 | Confirm no. 1 buffer with and . Mark the number of in the buffer. is the number, is the number for in , is the number of in buffer , , . | |
| 3.2 | Calculate for the number of . | |
| 3.3 | Search for and make judgement: | |
| ||
| 3.4 | Search for and make judgement: | |
| ||
① If :
| ||
| ||
| 3.5 | Search no. . Judge , number of scenic spots, and and , traversing , . | |
| ||
① reaches the maximum.
| ||
| ||
| ① reaches ; ② reaches the maximum. | ||
| 3.6 | Confirm no. 2 buffer with and , . Mark the number of in the area between and . In , is the cluster number, is the number of in , is the number of in the area, , . Repeat 3.1~3.5, search scenic spots, and store in . | |
| ||
| Step 4 | Output , extract number of scenic spots. The scenic spots in vector meet the conditions: | |
| ||
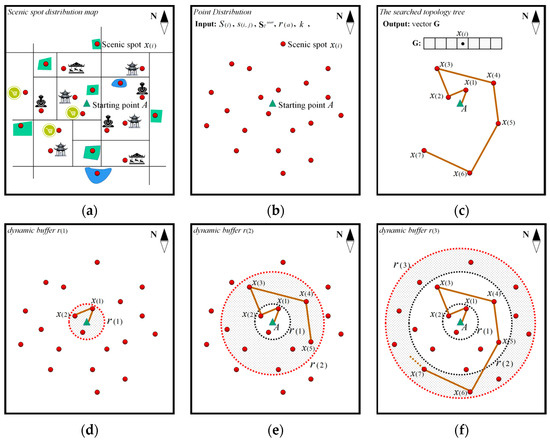
Figure 2.
Modeling process for constructing the SSTTA.
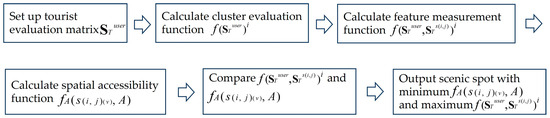
Figure 3.
Algorithm flow of the SSTTA based on DBSA.
3.3. Modeling of the OTRA Based on SSTTA
Urban scenic spots are located at different geographical coordinates in the city. When tourists start from starting point to visit scenic spots, they are constrained by urban geospatial factors, including:
(1) The urban roads between the points;
(2) The transportation mode chosen by the tourists;
(3) Travel time;
(4) Travel fees.
The tour route recommendation algorithm (TRRA) is constructed based on the constraints of urban geographical space, and the time cost and fee cost are taken into account. According to the vector , the tourists determine one kind of travel sequence according to their interests. The travel sequence is constrained by the geographical conditions and cost factors. When the tourists consider the time cost or fee cost, the tour routes will be different, or the costs will be different [28,29,30,31]. According to the analysis, the tour route issue could be transformed into the issue of searching for the route with the lowest time cost or the lowest fee cost under the condition of the travel sequence, the geospatial factors as well as the tourists’ travel budgets. The travel sequence is as follows: visit scenic spot first, then scenic spot , until the following scenic spots are visited. The footmark in the scenic spot represents an arbitrary scenic spot selected by the tourists, , .
Definition 12.
Tour route structure chain and structure chain-adjacent section . From the starting point , a chain is formed by the points from to in the travel sequence; it is defined as the tour route structure chain . If element in chain is the current scenic spot, then the next scenic spot to be visited is . The section composed of and is defined as the structure chain-adjacent section . The adjacent section is the basic unit of the route chain, which is composed of the urban roads and road nodes.
Definition 13.
Adjacent section control point and adjacent section control point set . The tourists pass through several urban roads and road nodes in the process of traveling from point to point . The key road nodes in the adjacent section of the structure chain between points and are defined as the adjacent section control points . A set of control points in section is defined as the adjacent-section control point set . Adjacent-section control points are determined by urban geospatial information, and their locations are abstracted from the city map.
Section which, is formed by the arbitrary two adjacent points and in chain , is regarded as the basic unit, and its coordinates on the map are confirmed. The number of control points in section are searched and confirmed, , . Then, search to confirm the connecting path of the adjacent control points and determine the travel distances between two control points. Abstract the section into the graph edge and abstract the points into the graph vertices. Map the graph onto the two-dimensional space.
Definition 14.
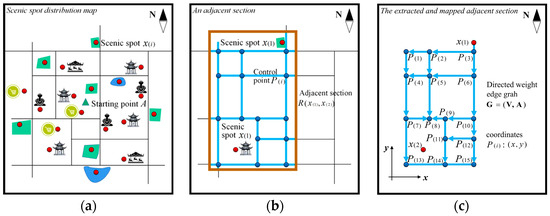
Adjacent-section-directed weighted-edge graph . The graph that is used to describe the relationship between points and paths, adjacent relationship, and quantitative relationship is defined as the adjacent-section-directed weighted-edge graph . The graph meets , . The adjacent points represent the urban path. Figure 4 shows the modeling process of the graph for the structure chain-adjacent section .
Figure 4.
Modeling of the directed-weight edge graph of the structure chain-adjacent section. (a) Original distribution of scenic spots and road network. (b) Adjacent section. (c) Adjacent section control point set.
Definition 15.
Adjacent section feasible path , adjacent section path structure tree , adjacent graph edge weight and path weight . The adjacent section is the basic unit. Based on the directed weighted graph , set the starting point as the root node and terminal point as the target node. One feasible path that is formed by the searching algorithm between and is defined as the adjacent section feasible path . Suppose that path has edge weights. The quantity of differs along with the path quantity, and the related weights will be different. The structure tree formed by all feasible paths is defined as the adjacent section path structure tree (ASPST), noted as . Figure 5 shows the modeling process of the ASPST of by using Figure 4c as an example.
Figure 5.
Modeling process of ASPST of .
Suppose the condition that the ASPST has kinds of feasible paths, then there is , in , in which there is only one path representing the optimal route with the minimum distance cost. In the weighted graph, if the travel distance between the two adjacent points and is set as , the edge weight between the two points is constructed as Formula (9), where represents the edge of the graph and represents . In a path , the total weight calculated by all edge weights is defined as the path weight , constructed as Formula (10). The weight for the tour route formed by adjacent sections is constructed as the Formula (11).
Definition 16.
Adjacent section feasible path vector . Based on , the searching algorithm will generate kinds of feasible paths. Store the path weights that relate to the kinds of feasible paths in a dimension vector according to the sorting algorithm, the vector is defined as the adjacent section feasible path vector . The vector reflects the path conditions between points and , and the optimal route is extracted from the vector.
According to the definition, after the tourists confirm the starting point , the reference point storage vector , number of scenic spots to be visited, and a kind of traveling sequence, the recommendation system will generate adjacent sections , corresponding to the number of trees . The number of adjacent sections forms a complete tour route. The optimal TRRA based on SSTTA is constructed (Algorithm 3). is the two-way pass, is the positive one-way pass, and is the reversal one-way pass. Figure 6 shows the algorithm flow of the optimal TRRA based on SSTTA.
| Algorithm 3: The optimal TRRA based on SSTTA | ||
| Input: Starting point , vector , and number of scenic spots to be visited. Output: Vector , the optimal , and . | ||
| Step 1 | Tourists confirm a tour sequence based on and , obtain . Output number of , , . | |
| Step 2 | For , take , confirm and . | |
| 2.1 | Confirm coordinates of and . Search urban roads connecting and . Confirm the number of . | |
| 2.2 | Map , , and onto 2D coordinate and form the basic structure . | |
| 2.3 | Search among , , and . Calculate of graph . | |
| 2.4 | Quantify the graph . The quantity vertex is , edge . | |
| Step 3 | Construct the tree . | |
| 3.1 | In , confirm the root node and the target node . | |
| 3.2 | Search nearby to , , and . Judge the between point and : | |
| ||
| 3.3 | Inspect , . | |
| (1) Take as a vertex, search all connecting , , and . Judge between and each : | ||
| ① If or , connect and to form the weight edge and assign value ; ② If , and do not form a positive weight edge and do not connect. | ||
| (2) Take as a vertex, search all connecting , , and . Judge between and each : | ||
| ① If or , connect and to form the weight edge and assign value ; ② If , and do not form a positive weight edge and do not connect. | ||
| (3) Take as a vertex, search all connecting , , and . Judge between and each : | ||
| ① If or , connect and to form the weight edge and assign value ; ② If , and do not form a positive weight edge and do not connect. | ||
| (4) Traverse , connect all lower level nodes with all . | ||
| 3.4 | Expand to the lower-level nodes. Inspect , , and . Search all lower-level nodes of each . Judge between and : | |
| ||
| 3.5 | Traverse all-level , , and until target is searched, End. Output kinds of . | |
| Step 4 | Store and form vector with the following steps. | |
| 4.1 | Initialize , element , , and . | |
| 4.2 | Find and , extract of and , calculate and . | |
| ||
| 4.3 | Find and calculate , compare , and . | |
| ||
| 4.4 | Find other and calculate . Descend to store in . Traverse . The path of relates to the optimal one in . | |
| Step 5 | Repeat Step 2–Step 4, traverse , and find of and optimal for each . All form an optimal tour route. | |
| Step 6 | Calculate formed by number of . | |
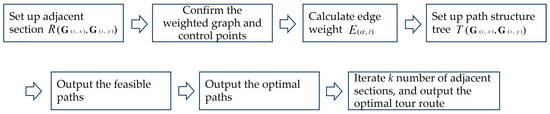
Figure 6.
Algorithm flow of the optimal TRRA based on SSTTA.
4. Experiment and Result Analysis
4.1. Basic Principle and Process of the Experiment
The minimum cost path generated by the ASPST of represents the minimum cost distance for the tourists to travel between points in the geographic space. When the tourists choose the traveling mode, the system will recommend different transportation modes and adopt the optimal path in each section. Tourists usually consider the time cost and fee cost in the traveling process, which can be divided into two modes:
(1) Only consider the lowest time cost, and do not consider the fee cost. The system recommends “Taxi” as the transportation mode. Based on the tour route structure chain and the route algorithm, it outputs the optimal distance path for the taxis in each adjacent section to determine the optimal route.
(2) Only consider the lowest fee cost, and do not consider the time cost. The system recommends the “shared bicycle” mode, and outputs the optimal distance path of the shared bicycle (or walking) in each adjacent section based on the tour route structure chain and route algorithm, and then outputs the overall optimal route.
We chose the two modes as examples. The experimental process is as follows.
(1) Confirm the starting point of the tour and the number of scenic spots to be visited. Collect the evaluation data of urban scenic spots, and the quantity of text evaluations or introductions is more than 1000 pieces. The constructed SSCA is used to cluster the urban scenic spots to obtain the cluster distribution and cluster capacity.
(2) The tourists score the feature text and the system calculates the cluster scoring function , collect the feature measurement matrix of each scenic spot and calculate their feature measurement function . By searching the geospatial data, the values of the spatial accessibility functions for scenic spots are calculated based on point . According to SSTTA, search for a total number of scenic spots to be visited in the clusters.
(3) The tourists confirm the route structure chain, the system collects the adjacent sections and control points of the structure chain. Generate directed weighted-edge graphs for each adjacent section based on the set of control points, build ASPSTs, and output the feasible path vectors based on the constructed optimal route algorithm to determine the optimal path for each adjacent section. Based on the transportation mode selected by tourists, the route decision schemes for tourists are finally confirmed.
4.2. Scenic Spot Clustering Result
Take the tourism city Chengdu as an example. The collected scenic spots are:
- : Kuanzhai Alley;
- : Chunxi Road;
- : Giant Panda Breeding Base;
- : Qinglong Lake;
- : Temple of Marquis;
- : Happy Valley;
- : Shengxian Lake Park;
- : Jinsha Site;
- : Wangjianglou Park;
- : East Lake Park;
- : Du Fu Cottage;
- : Chengdu Zoo;
- : GuoSeTianXiang Paradise;
- : Eastern Suburb Memory;
- : TaZiShan Park;
- : Jincheng Lake;
- : Sichuan Museum;
- : Chengdu Yongling Museum;
- : The People’s Park;
- : South Lake Amusement Park.
The feature text vector is:
- : Walking, flower appreciation, cruise, leisure, and drinking tea;
- : The knowledge, the history, the humanity, investigation, and culture;
- : Theme, entertainment, games, sports, and outdoor.
The feature text matrix is constructed with the feature text vector as the basic element. Collect the text evaluation data of each scenic spot from Ctrip, Tong Cheng, Qunar, and other tourism booking portals and gather them in the text dataset. Count the total number of vector word frequencies for each scenic spot and calculate the scenic spot clustering relative objective function value , shown in Table 1. From the values, the clustering tendency vector of each scenic spot is output and the cluster for each scenic spot is obtained, as shown in Table 2.

Table 1.
Result of scenic spot clustering relative objective function value .
Table 2.
Clustering result for scenic spot .
4.3. Recommendation Result of the Dynamic Buffer Optimal Scenic Spots
Condition 1: Tourists provide scores for the interest degree of each scenic spot text label, from which the system obtains the tourist feature evaluation matrix and then calculates the cluster scoring function values to obtain the tourists’ interest tendency for each cluster. Based on the feature measurement matrix of each scenic spot , the scenic spot feature measurement function is used to calculate the measurement function values of each cluster of scenic spots.
Condition 2: Taking the starting point selected by the tourists as the center, the spatial distance of each scenic spot is searched and the values of the spatial accessibility functions for the scenic spots are calculated. In the experiment, suppose that the starting point chosen by tourists is Tianfu Square, and the expected scenic spot quantity is .
The calculated results of the label quantitative scoring values for each scenic spot feature text and tourist feature evaluation function values corresponding to clusters are shown in Table 3. Table 4 presents the feature measurement function values of the scenic spots’ cluster and the spatial accessibility function values with starting point . In Table 4, value (1) is the function value and value (2) is the function value .
Table 3.
Calculated results of the label quantitative scoring values for each scenic spot feature text and tourist feature evaluation function values corresponding to clusters.
Table 4.
Feature measurement function values of the scenic spots’ cluster and spatial accessibility function values .
Based on the constructed DBSA, the interested clusters for the sample tourist are , , and . The output scenic spots that satisfy the sample tourist’s interests and have the optimal spatial accessibility are:
- : Wuhou Temple;
- : Chengdu Yongling Museum;
- : Kuan Zhai Alley;
- : Chunxi Road;
- : Sichuan Museum.
4.4. Result of the Optimal Tour Routes and Spatial Decision-Making
Based on the recommended five scenic spots, suppose that the sample tourist chooses one of the following sequences: : Tianfu Square, : the Temple of Marquis, : Chengdu Yongling Museum, : Kuan Zhai Alley, : Chunxi Road, and : Sichuan Museum. The starting point of the tour is the Tianfu Square. According to the traveling sequence selected by the tourist, the system determines five adjacent sections and determines the set of control points within each section according to the geographical relationship of the scenic spots and the distributions of urban roads. Then, the system outputs the directed weighted-edge graphs and ASPSTs. Figure 7 shows the location distribution, path structure, generated ASPSTs and the optimal path for each adjacent section.
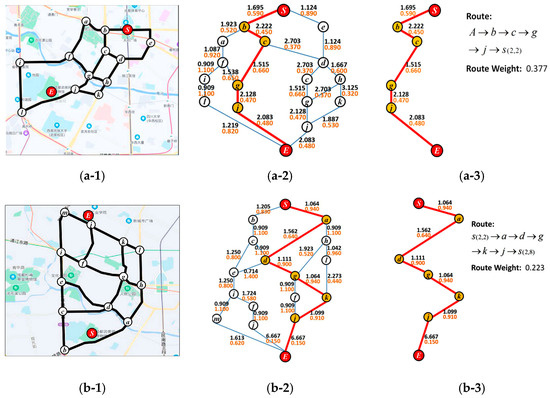
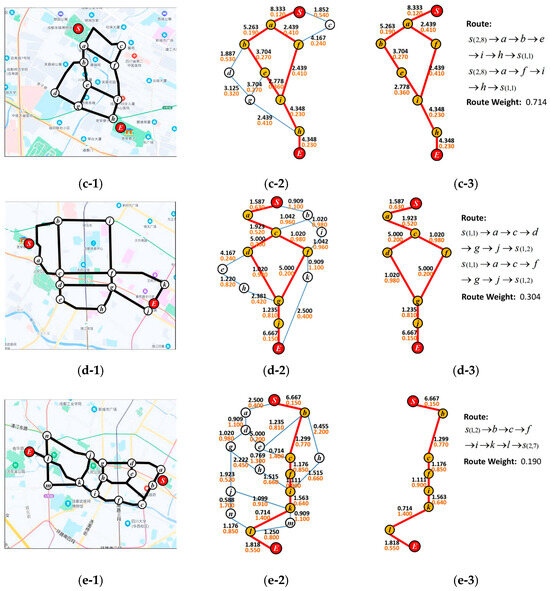
Figure 7.
Location distribution, path structure, ASPST, and optimal path for adjacent section.
(1) Figure 7(a-1)–(a-3) represent the distribution of starting point and control points, the path among points, the ASPST of , and the optimal path in section ;
(2) Figure 7(b-1)–(b-3) represent the distribution of starting point and control points, the path among points, the ASPST of , and the optimal path in section ;
(3) Figure 7(c-1)–(c-3) represent the distribution of starting point and control points, the path among points, the ASPST of , and the optimal path in section ;
(4) Figure 7(d-1)–(d-3) represent the distribution of starting point and control points, the path among points, the ASPST of , and the optimal path in section ;
(5) Figure 7(e-1)–(e-3) represent the distribution of starting point and control points, the path among points, the ASPST of , and the optimal path in section .
The control points in each ASPST are represented by letters a, b, c,…, etc. In each section, the initial point is : Tianfu Square or scenic spot , the terminal point is scenic spot , and the two scenic spots are determined by the section point mark. In each structure tree, the path drawn in red is the searched optimal path. Extract the optimal path to obtain the path model in each section, mark the path’s two endpoints and control points, and calculate the path weight for each ASPST. The optimal path weights are:
- Section : 0.377;
- Section : 0.223;
- Section : 0.714;
- Section : 0.304;
- Section : 0.190.
According to the ASPSTs and the optimal paths, the system makes the spatial decision for the tourist. Analyze the travel schedule as follows.
- Start from : Tianfu Square;
- Pass through the first section ;
- Arrive at the scenic spot : Wuhou Temple, pay a visit;
- Pass through the second section ;
- Arrive at : Chengdu Yongling Museum, pay a visit;
- Pass through the third section ;
- Arrive at : Kuanzhai Alley, pay a visit;
- Pass through the fourth section ;
- Arrive at : Chunxi Road, pay a visit;
- Pass through the fifth section ;
- Arrive at : Sichuan Museum, pay a visit. The tour ends.
In the whole tour, visiting the scenic spots will create a fixed cost, with fixed time and fee costs, but moving in each section will generate different costs depending on the transportation mode. According to the travel conditions, the system provides the following two modes:
(1) Only consider the lowest time cost, and do not consider the fee cost. It recommends “taxi” as the transportation mode and provides the optimal path in each section;
(2) Only consider the lowest fee cost, but do not consider the time cost. It recommends the “shared bicycle” as the transportation mode.
Table 5 shows tour routes I, II, and III composed of the optimal and sub-optimal paths in each section, as well as the path total weight for each section and tour route total weight. In each section, letters are used to express the control points to form the path. The endpoints of section are the two points and . We obtain the following conclusion: of the three tour routes, tour route I is the optimal route, while tour route II and tour route III are the sub-optimal routes.
Table 5.
Tour routes I, II, and III composed of the optimal and sub-optimal paths in each section, as well as the path total weight for each section and tour route total weight.
The travel time comparison of the optimal tour route and sub-optimal tour routes under the first mode in Table 6 and the fee cost comparison of the optimal tour route and sub-optimal tour routes under the second mode in Table 7 were obtained. The visiting time of each scenic spot is the optimal tour time recommended by the tourism information platform, and the visiting cost of each scenic spot is the minimum cost (i.e., ticket for scenic spot entrance). Taxis and shared bicycle modes are assessed based on the average speed and average price on the urban roads of Chengdu.
Table 6.
Time cost comparison of the optimal tour route and sub-optimal tour routes under the first mode (unit: hours).
Table 7.
Fee cost comparison of the optimal tour route and sub-optimal tour routes under the second mode (unit: yuan).
4.5. Comparison with Other Methods
We selected BaiDu Map (BDMA) and GaoDe Map (GDMA), which are commonly used in tour route planning, as the control group. The proposed algorithm (TRRA) was set as the experimental group. Under the constraint of the shortest travel time, search for the optimal route between the scenic spots by BDMA and GDMA. Based on the searched optimal route by BDMA and GDMA, confirm the rode nodes on the route and generate related ASPSTs. Calculate the weight of each road section and the total weight of the route by obtaining the distance between the road nodes. The comparison results are shown in Table 8, where represents the transportation mode “Taxi” and represents the transportation mode “shared bicycle”.
Table 8.
Comparison of the and the of the three methods.
4.6. Experimental Result Analysis
The constructed SSCA was used to cluster the representative scenic spots of the tourism city Chengdu and recommend scenic spots to the sample tourist based on their interests. According to the tourism mode selected by the tourist, tour routes are searched for the tourist based on the recommended scenic spots to meet the condition of an optimal traveling time or an optimal traveling cost for the tourist. The experimental results were analyzed based on the clustering results, SSR results, TRR results, and method comparison.
4.6.1. Analysis of the SSCA Results
The feature text vector collected in the experiment met the modeling conditions, and the selected feature text represented one kind of scenic spot clustering. It had obvious differentiation with the other clusters. By mining the evaluation text, the clustering relative objective function value of each scenic spot is calculated, and then each scenic spot’s tendency for the feature text clusters is obtained. Analyzing the calculation results of the clustering relative objective function values in Table 1 and the clustering results of scenic spots in Table 2, each scenic spot has an apparent tendency for one cluster feature text vector, and the tendency for its own cluster is the highest.
(1) Scenic spots : Kuanzhai Alley, : Chunxi Road, : Qinglong Lake, : Shengxian Lake Park, : Wangjianglou Park, : East Lake Park, : Tazishan Park, : Jincheng Lake, and : People’s Park have the highest tendencies for cluster , with values of : 0.657, : 0.659, : 0.701, : 0.660, : 0.581, : 0.620, : 0.493, : 0.676, and : 0.537, respectively.
(2) Scenic spots : The Giant Panda Breeding Base, : Wuhou Temple, : The Jinsha Site, : Du Fu Thatched Cottage, : Chengdu Zoo, : Eastern Suburb Memory, : Sichuan Museum, and : Chengdu Yongling Museum have the highest tendencies for cluster , which are : 0.653, : 0.739, : 0.840, : 0.810, : 0.624, : 0.393, : 0.825, and : 0.815 respectively.
(3) Scenic spots : Happy Valley, : Guose Tianxiang Paradise, and : South Lake Amusement Park have the highest tendencies for cluster , which are : 0.618, : 0.578, and : 0.577, respectively.
According to the clustering results, the capacity of cluster was , the capacity of cluster was , and the capacity of cluster was . We obtained the following conclusions:
(1) The clustering results indicate that our proposed algorithm can extract the feature attributes of scenic spots based on the tourist text evaluation data and can accurately cluster the scenic spots according to the feature attributes;
(2) The modeling process quantifies the tourists’ interests and matches them with the feature attributes of the scenic spots so that the scenic spots that meet a certain type of tourists’ interests can be grouped into one cluster;
(3) When the system recommends scenic spots, it takes the cluster as a basic unit to ensure that the recommended scenic spots are more accurate.
4.6.2. Analysis of the SSR Results
- Results Analysis of Table 3
Analyzing the quantitative value of the sample tourist’s label scoring on the scenic spot feature text in Table 3, we can conclude the following:
(1) The sample tourist provided different scores for the corresponding feature text labels for each cluster, indicating that the tourist had different interest degrees for each label;
(2) By calculating the tourist feature evaluation function values, the tourist’s interest tendency for each cluster is obtained. The evaluation function value of the cluster is the highest, with a value of 0.894, followed by cluster , with a value of 0.582, and finally cluster , with a value of 0.324;
(3) The sample tourist had the highest degree of the interest in cluster scenic spots, followed by cluster scenic spots, and had the lowest degree of interest in cluster scenic spots;
(4) It can be inferred that the tourist preferred parks and green land, leisure landscapes, museums, memorial halls, and similar scenic spots, but was not interested in amusement parks and theme parks.
- 2.
- Results Analysis of Table 4
Analyzing the feature measurement function values of the scenic spots in the clusters in Table 4 and the spatial accessibility function value of starting point : Tianfu Square, we can conclude the following:
(1) The feature measurement function value for each scenic spot was different. The larger the feature measurement function value is, the higher the matching degree between the scenic spot and the tourist interests will be. The smaller the spatial accessibility function value is, the stronger the accessibility of scenic spot will be, and vice versa;
(2) The scenic spots that best matched the sample tourist’s interests were:
- : Wuhou Temple;
- : Du Fu Thatched Cottage;
- : Sichuan Museum;
- : Chengdu Yongling Museum.
(3) The most accessible scenic spot was : The People’s Park. The system recommends scenic spots by confirming the interest matching degree and the spatial accessibility at the same time. Combined with the conditions proposed by the tourist, the final scenic spots recommended were:
- : Wuhou Temple;
- : Chengdu Yongling Museum;
- : Kuan Zhai Alley;
- : Chunxi Road;
- : Sichuan Museum.
Based on the comprehensive analysis, the recommended five scenic spots had the features of high feature measurement function values and strong spatial accessibility. The results verify that the algorithm can determine the scenic spots that best match tourists’ interests and have optimal space accessibility.
4.6.3. Analysis of the TRR Results
- Results Analysis of Figure 7
According to the constructed tour route searching algorithm, the tour route was divided into five adjacent sections based on the constraints provided by the sample tourist. Figure 7 shows the point distribution of each adjacent section, path structure, ASPST, and optimal path for each adjacent section output by the algorithm. The secondary icon letters a, b, c, d, and e in the figure represent adjacent sections. We can conclude the following:
(1) Figure 7(a-1,b-1,c-1,d-1,e-1) show the distribution of the section endpoints and the control points. The output results indicate that the control points cover all the key road nodes in the section and involve all roads;
(2) Figure 7(a-2,b-2,c-2,d-2,e-2) show the section of ASPST. The red circles in the figure represent the starting point and terminal point of the section, the white circles represent the control point, and the blue connecting lines represent the paths between points. Regarding the values on the lines, the black values represent the calculated section edge weights between two points and the brown values represent the distance of the path between two points on the map. The red lines represent the path with the shortest searching distance and the largest total route weight, corresponding to the optimal path between the starting point and the terminal point. The route will cause the lowest costs when the tourist travels along it;
(3) Figure 7(a-3,b-3,c-3,d-3,e-3) show the optimal path extracted from ASPST, and the corresponding path, nodes, and total path weight;
(4) The experimental results indicate that the algorithm covers all paths and control points in the sections, and can determine the optimal path.
- 2.
- Results Analysis of Table 5
Analyzing the output results of the tour routes in Table 5, we obtain the following conclusions:
(1) Under the condition of the selected travel sequence, tour route I is the optimal route searched by the algorithm, and tour route II and tour route III are the sub-optimal routes searched by the algorithm;
(2) In each route, the path total weight in any section of route I is larger than that of route II and route III, and the final result is that the total weight of route I is larger than that of route II and route III;
(3) The total weights of route I, route II, and route III were 1.808, 1.649, and 1.567, respectively. This indicates that the cost caused by the sample tourist when choosing route I was the lowest, followed by the route II and route III. The total weights of other routes in the ASPST were larger than those of route I, route II, and route III in the same section. If tourists choose other routes, it will cause higher costs. Therefore, route I is recommended by the system, followed by route II and route III.
- 3.
- Result Analysis of Table 6
Analyzing the data in Table 6, we obtain the following conclusions:
(1) Under the condition of the route recommendation results, the tourist choosing different tourism modes will generate different costs;
(2) When the tourist chooses the first mode and only considers the time cost while neglecting the fee cost, the traveling time cost generated by route I is 10.863 h, the traveling time cost generated by route II is 10.932 h, and the traveling time cost generated by route III is 10.956 h;
(3) Route II and route III cost 0.069 h and 0.093 h more than route I, respectively. At the same time, the fee cost of route I is 124.61 yuan, the fee cost of route II is 127.10 yuan, and the fee cost of route III is 127.64 yuan. The fee costs of route II and route III are 2.49 yuan and 3.03 yuan more than that of route I, respectively.
- 4.
- Result Analysis of Table 7
Analyzing the data in Table 7, we obtained the following conclusions:
(1) When the tourist chooses the second mode, only considering the fee cost while neglecting the time cost, the cost of the traveling fee generated by route I is 80.5 yuan, the fee cost of route II is 83.5 yuan, and the fee cost of route III is 83.5 yuan. The costs of route II and route III are 3.5 yuan and 3.5 yuan more than that of route I, respectively;
(2) The traveling time cost of route I is 11.422 h, the traveling time cost of route II is 11.545 h, and the traveling time cost of route III is 11.580 h. Route II and route III cost 0.123 h and 0.158 h more than route I, respectively;
(3) The optimal route is the one that causes the lowest time cost or the lowest fee cost, and the algorithm constructed in this study can recommend the optimal route to the tourists.
4.6.4. Analysis of the Algorithm Effectiveness and Performance
It can be concluded from the above analysis that, no matter which mode the sample tourist chooses, the time cost and fee cost of optimal tour route I are the lowest. The system recommends route I as the optimal tour route to the tourist for a tourism day. Both route II and route III generate more travel costs than route I, and the travel costs of other feasible routes are much higher. When the number of scenic spots and tourist days increases, the other routes will generate more time costs and fee costs than the optimal one.
(1) The proposed algorithm had good clustering ability. The scenic spot clustering was based on data mining of tourists’ text evaluations and the scoring on the feature text by the experimental sample tourist. The tourists’ interests were matched with the feature attributes of the scenic spots, which made the scenic spot clustering highly targeted and closely related to the tourists’ interest tendencies, finally improving the recommendation algorithm accuracy;
(2) The algorithm has the ability to accurately recommend scenic spots. The interest tendency is determined by the tourists’ evaluation scores, and is matched with the scenic spots in the cluster to obtain their abilities to meet the tourists’ interests in the aspect of feature attributes. The spatial distributions of the scenic spots that satisfy the interests are optimized by combining with spatial accessibility measurement. Then, the scenic spots satisfying the tourists’ interests and having the optimal spatial accessibility are obtained by the searching algorithm and recommended to tourists. The experiment proves that the algorithm constructed in this paper can recommend the best scenic spots for tourists, not only conforming to the tourists’ interests, but also being optimal in space accessibility, saving traveling costs;
(3) The algorithm can determine the optimal tour route that meets the needs of tourists under the constraint conditions, so that the time cost and fee cost of the tour route are both the lowest. The proposed tour route algorithm is based on the tourists’ interests and needs, the selected traveling modes, and the geospatial data. It can progressively determine the path with the lowest cost in each road adjacent section; thus, it has the characteristics of global searching. When the number of scenic spots and the traveling days increases, tourists will save much more traveling costs by choosing the optimal route, which will save the total energy consumed in the tour and help to achieve low-carbon and green tourism.
4.6.5. Analysis of the Comparison of Three Methods
Analyzing the results in Table 8, compared with BDMA and GDMA, when the transportation modes were “taxi” and “shared bicycle”, the TRRA had higher section weight in , , , and . Only in was the weight lower than BDMA and GDMA, indicating that the overall performance of the TRRA was stable and it could determine paths with lower costs than BDMA and GDMA in total.
From the perspective of algorithm logic, the TRRA adopts a greedy method when searching for the ASPST, traversing all road nodes in the ASPST, so it can always determine the ASPST with the lowest cost and obtain the global solution. BDMA and GDMA search for urban main road nodes, which might overlook the accessible secondary roads and certain road nodes; thus, the solution might not be the optimal one.
Regarding the optimal route weights output by the three methods, when , the TRRA was 1.079 higher than BDMA and 1.051 higher than GDMA; when , the TRRA was 1.126 higher than BDMA and 0.943 higher than GDMA. It can be concluded that the TRRA saves more travel costs than BDMA and GDMA.
4.6.6. Superiority of the Proposed Algorithm
Through analysis, it can be concluded that the proposed algorithm has significant advantages over the methods used in the literature [5,6,7,8,9,10,11,12] and the commonly used electronic map methods used in tour route planning, as follows:
(1) The algorithm can achieve precise clustering of scenic spots within the research scope based on feature attributes. It can group the scenic spots that meet approximate interests and needs into one category cluster. And it has high clustering accuracy;
(2) It can effectively capture the tourist interests and recommend scenic spots with interest data that best match their feature attributes, achieving accurate recommendations;
(3) It can determine the globally optimal route within the research scope, that is, the route with the lowest travel cost, to avoid outputting an approximate optimal solution;
(4) It overcomes the problems in electronic map route planning and can determine the optimal route from the perspective of meeting tourist demands and minimizing travel costs. Compared with the routes planned by electronic maps, it can save more travel costs.
5. Conclusions and Prospect
5.1. Conclusions of This Research
Based on the analysis of the existing problems for TRR, we constructed a tour route-recommendation algorithm based on feature text mining (FTM) and the spatial accessibility model (SAM). In this research, we introduce tourists’ text evaluation data mining and SA measurement into scenic spot recommendation (SSR). First, a scenic spot clustering algorithm (SSCA) based on FTM is constructed. The tendency of a scenic spot being grouped into an unknown cluster is obtained by evaluating text mining for tourists in each scenic spot, and then the category of each scenic spot is obtained based on tourists’ interest text mining. Regarding the SSCA, a scenic spot topology tree algorithm (SSTTA) based on dynamic buffer spatial accessibility (DBSA) was constructed, through which the scenic spot spatial distribution is obtained; then, the optimal scenic spots with the best-matched interests and spatial distributions are recommended to the tourists. Based on the recommended scenic spots, tourists confirm the travel sequence and transportation mode, and an optimal tour route recommendation algorithm (OTRRA) based on SSTTA was constructed to recommend optimal tour routes for tourists. The experiment showed that the proposed algorithm had good clustering ability and could obtain scenic spot clusters based on tourists’ interests. The algorithm has the ability to accurately recommend scenic spots, which relies on the spatial accessibility and ability to match tourists’ interests, resulting in high recommendation accuracy. At the same time, the algorithm can determine the optimal tour route that meets tourists’ needs under constraint conditions, making the travel time and travel costs the lowest.
5.2. Application Scenarios
The application areas of the proposed algorithm mainly include several aspects.
Firstly, it can be used as an embedded algorithm to build scenic spot recommendation systems and route-recommendation systems, and develop handheld APPs or PC application systems. It can provide process methods for developing urban smart tourism information service platforms and also provide technical support for improving the quality of tourism city services.
Secondly, it can be used for the design and development of intelligent tourism electronic maps. For urban tourism, the development of smart tourism electronic maps dedicated to urban scenic spots and route recommendations is relatively weak. The proposed algorithm can be directly used to develop smart tourism electronic maps for cities, providing exclusive services for tourists.
Thirdly, it can be deeply integrated with technologies such as the Internet of Things and the Internet of Vehicles. The constructed scenic spot recommendation algorithm and route-planning algorithm can be integrated into the intelligent connected vehicle navigation system as a necessary embedded algorithm for developing intelligent navigation vehicles in smart tourism.
5.3. Limitations and Improvement Direction
Based on the algorithm objectives and the modeling process, it can be concluded that the proposed algorithm has certain limitations, and corresponding improvements could be made in the next research step. For example, the algorithm is mainly applicable to the main urban areas of tourism cities, with transportation methods such as urban buses, taxis, and shared bicycles, which does not involve cross-city scenic spot recommendations and route planning. When expanding the research area to counties around cities or adjacent cities, it is necessary to further construct algorithms with a larger scope based on cross-city scenic spots, cross-city roads, and cross-city transportation modes. In addition, the proposed algorithm mainly generates the global optimal route for the selection of a certain fixed transportation mode and is not suitable for randomly changing transportation modes. In the next step of research, for different route intervals of random transportation modes chosen by tourists, randomly choosing methods of transportation could be considered to design the optimal route algorithm, which can improve the flexibility and application scope of the algorithm.
Author Contributions
Conceptualization, X.Z., Z.Z., X.L. and M.S.; methodology, X.Z. and Z.Z.; formal analysis, X.Z., X.L. and M.S.; writing—original draft preparation, X.Z. and Z.Z.; writing—review and editing, X.Z., Z.Z., X.L. and M.S.; funding acquisition, X.Z., Z.Z. and X.L. All authors have read and agreed to the published version of the manuscript.
Funding
This study was supported by the Project of Henan Provincial Natural Science Foundation Project (No. 242300420624), the Project of the Key Research Base of Region and Country of Sichuan Province, Center for Southeast Asian Economic and Culture Studies (No. DNY2301), the National 13th Five-Year Plan Key R&D Projects (No. 2016YFB0502300), the National 14th Five-Year Plan Key R&D Projects (No. SQ2021YFB3900025), and Leshan Science and Technology Plan Project (No. 22ZRKX025).
Data Availability Statement
Data are contained within the article.
Conflicts of Interest
The authors declare no conflicts of interest.
References
- Arif, A.; Du, J.T. Understanding collaborative tourism information searching to support online travel planning. Online Inf. Rev. 2019, 43, 369–386. [Google Scholar] [CrossRef]
- Zhang, Q.; Liu, Y.; Liu, L.; Lu, S.; Feng, Y.; Yu, X. Location identification and personalized recommendation of tourist attractions based on image processing. Trait. Du Signal 2021, 38, 197–205. [Google Scholar] [CrossRef]
- Sarkar, J.L.; Majumder, A. A new point-of-interest approach based on multi-itinerary recommendation engine. Expert Syst. Appl. 2021, 181, 115026. [Google Scholar] [CrossRef]
- Ahmad, S.; Ullah, I.; Mehmood, F.; Fayaz, M.; Kim, D. Astochastic approach towards travel route optimization and recommendation based on users constraints using Markov chain. IEEE Access 2019, 7, 90760–90776. [Google Scholar] [CrossRef]
- Yun, L.Y.; Jiao, H.H.; Lu, K. Tourist Attraction Recommendation Method Based on Megadata and Artificial Intelligence Algorithm. Wirel. Commun. Mob. Comput. 2022, 2022, 4461165. [Google Scholar] [CrossRef]
- Lin, S.Q. Implementation of Personalized Scenic Spot Recommendation Algorithm Based on Generalized Regression Neural Network for 5G Smart Tourism System. Comput. Intell. Neurosci. 2022, 2022, 3704494. [Google Scholar] [CrossRef]
- Cepeda-Pacheco, J.; Domingo, M. Deep learning and Internet of Things for tourist attraction recommendations in smart cities. Neural Comput. Appl. 2022, 34, 7691–7709. [Google Scholar] [CrossRef]
- Han, S.S.; Liu, C.M.; Chen, K.Y.; Gui, D.W.; Du, Q.Y. A Tourist Attraction Recommendation Model Fusing Spatial, Temporal, and Visual Embeddings for Flickr-Geotagged Photos. ISPRS Int. J. Geo-Inf. 2021, 10, 20. [Google Scholar] [CrossRef]
- Zheng, X.; You, H.; Huang, H.; Sun, L.; Yu, Q.; Luo, Y. Two-stage greedy algorithm based on crowd sensing for tour route recommendation. Appl. Soft Comput. 2024, 153, 111260. [Google Scholar] [CrossRef]
- Lyu, H.J.; Han, Z.K. Algorithm of Scenic Spot Tourism Route Planning Based on Convolution Neural Network. Wirel. Commun. Mob. Comput. 2022, 2022, 5330611. [Google Scholar] [CrossRef]
- Niu, H. The effect of intelligent tour guide system based on attraction positioning and recommendation to improve the experience of tourists visiting scenic spots. Intell. Syst. Appl. 2023, 200263. [Google Scholar] [CrossRef]
- Li, S.; Luo, T.Y.; Wang, L.; Xing, L.N.; Ren, T. Tourism route optimization based on improved knowledge ant colony algorithm. Complex Intell. Syst. 2022, 8, 3973–3988. [Google Scholar] [CrossRef]
- Yuan, W.J.; Yang, L.; Yang, Q.; Sheng, Y.H.; Wang, Z.Y. Extracting Spatio-Temporal Information from Chinese Archaeological Site Text. ISPRS Int. J. Geo-Inf. 2022, 11, 175. [Google Scholar] [CrossRef]
- Eldeeb, G.; Mohamed, M. Transit electrification state of the art: A machine-learning based text mining approach. Transp. Res. Part D Transp. Environ. 2011, 111, 103446. [Google Scholar] [CrossRef]
- Ogryzek, M.; Podawca, K.; Cienciała, A. Geospatial tools in the analyses of land use in the perspective of the accessibility of selected educational services in Poland. Land Use Policy 2022, 122, 106373. [Google Scholar] [CrossRef]
- Zhou, H.L.; Tian, Z.P. Population mobility network and spatial accessibility based on peer-to-peer interactive energy management. Sustain. Comput. Inform. Syst. 2022, 36, 100800. [Google Scholar] [CrossRef]
- Luo, S.J.; Jiang, H.P.; Yi, D.S.; Liu, R.H.; Qin, J.H.; Liu, Y.S.; Zhang, J. PM2SFCA: Spatial Access to Urban Parks, Based on Park Perceptions and Multi-Travel Modes. A Case Study in Beijing. ISPRS Int. J. Geo-Inf. 2022, 11, 488. [Google Scholar] [CrossRef]
- Hou, J.; Yuan, H.Q.; Pelillo, M. Towards Parameter-Free Clustering for Real-World Data. Pattern Recognit. 2023, 134, 109062. [Google Scholar] [CrossRef]
- Hu, X. Geographic landscape space and tourism planning of Longtan Ancient Village. Bol. Tec./Tech. Bull. 2017, 55, 627–632. [Google Scholar]
- Tlili, T.; Krichen, S. A simulated annealing-based recommender system for solving the tourist trip design problem. Expert Syst. Appl. 2021, 186, 115723. [Google Scholar] [CrossRef]
- Kolahkaj, M.; Harounabadi, A.; Nikravanshalmani, A.; Chinipardaz, R. DBCACF: A multidimensional method for tourist recommendation based on users’ demographic, context and feedback. Recomm. Syst. 2019, 4, 209–219. [Google Scholar]
- Huang, C.D.; Goo, J.; Nam, K.; Yoo, C.W. Smart tourism technologies in travel planning: The role of exploration and exploitation. Inf. Manag. 2017, 54, 757–770. [Google Scholar] [CrossRef]
- Joshi, S. Social network analysis in smart tourism driven service distribution channels: Evidence from tourism supply chain of Uttarakhand, India. Int. J. Digit. Cult. Electron. Tour. 2018, 2, 255–272. [Google Scholar] [CrossRef]
- Zhang, T.; Cheung, C.; Law, R. Functionality evaluation for destination marketing websites in smart tourism cities. J. China Tour. Res. 2018, 14, 263–278. [Google Scholar] [CrossRef]
- Nguyen, T.T.; Camacho, D.; Jung, J.E. Identifying and ranking cultural heritage resources on geotagged social media for smart cultural tourism services. Pers. Ubiquitous Comput. 2017, 21, 267–279. [Google Scholar] [CrossRef]
- Lei, W.; Chen, G.; Bei, Z.; Yong, L. Deep learning based social-aware location recommendation. J. Terahertz Sci. Electron. Inf. Technol. 2019, 17, 502–508. [Google Scholar]
- Bo, Y.; Fei, Z.P. Review of the art of recommendation algorithms. J. Shanxi Univ. (Nat. Sci. Ed.) 2011, 34, 337–350. [Google Scholar]
- Gao, M.T.; Xu, B.Y. Recommendation algorithm based on circular neural network. Comput. Eng. 2019, 45, 198–202. [Google Scholar]
- Yao, X.H.; Sun, Y.; Sun, B.W.; Huang, Y. The Impact of the Urban Forest Park Recreation Environment and Perceived Satisfaction on Post-Tour Behavioral Intention—Using Tongzhou Grand Canal Forest Park as an Example. Forests 2024, 15, 330. [Google Scholar] [CrossRef]
- Telonis, G.; Panteli, A.; Boutsinas, B. A Point-of-Interest Recommender System for Tourist Groups Based on Cooperative Location Set Cover Problem. Mathematics 2023, 11, 3646. [Google Scholar] [CrossRef]
- Yoon, J.H.; Choi, C. Real-Time Context-Aware Recommendation System for Tourism. Sensors 2023, 23, 3679. [Google Scholar] [CrossRef] [PubMed]
Disclaimer/Publisher’s Note: The statements, opinions and data contained in all publications are solely those of the individual author(s) and contributor(s) and not of MDPI and/or the editor(s). MDPI and/or the editor(s) disclaim responsibility for any injury to people or property resulting from any ideas, methods, instructions or products referred to in the content. |
© 2024 by the authors. Licensee MDPI, Basel, Switzerland. This article is an open access article distributed under the terms and conditions of the Creative Commons Attribution (CC BY) license (https://creativecommons.org/licenses/by/4.0/).