Article

Hydration and Barrier Properties of Emulsions with the Addition of Keratin Hydrolysate

1
Department of Polymer Engineering, Faculty of Technology, Tomas Bata University in Zlín, Vavrečkova 275, 760 01 Zlín, Czech Republic
2
Department of Fat, Tenside and Cosmetics Technology, Faculty of Technology, Tomas Bata University in Zlín, Vavrečkova 275, 760 01 Zlín, Czech Republic
3
Department of Processing Control and Applied Computer Science, Faculty of Applied Informatics, Tomas Bata University in Zlín, Nad Stráněmi 4511, 760 05 Zlín, Czech Republic
*
Author to whom correspondence should be addressed.
Cosmetics 2018, 5(4), 64; https://doi.org/10.3390/cosmetics5040064
Submission received: 6 September 2018 / Revised: 25 October 2018 / Accepted: 29 October 2018 / Published: 31 October 2018
(This article belongs to the Special Issue Skin Barrier Function)

Abstract

:
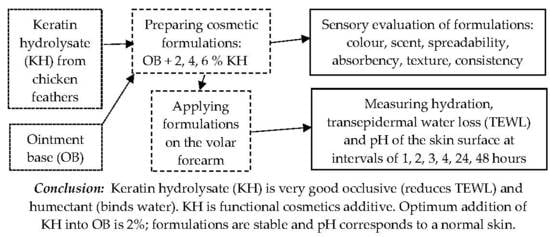
Although keratin hydrolysates (KH) are added to skin care agents, detailed studies on the moisturising effects of KH are lacking. The aim of this study is to test whether adding KH into an ointment base (OB) heighten hydration of the skin and diminish transepidermal loss of water (TEWL). Formulations containing 2%, 4%, and 6% of KH (based on OB weight) were prepared. Hydration, TEWL and skin pH were measured; intervals of measurements were as follows: 1, 2, 3, 4, 24 and 48 h. Testing was carried out on 10 men. In terms of hydration, supplementing the OB with 2% KH is optimal, as an 11–19% increase occurs in hydration of stratum corneum (SC). All the formulations with added KH as tested caused TEWL to decline after application. Keratin hydrolysate makes for an excellent occlusive; adding it to OB results in a 30–50% reduction in TEWL after application. KH functions as a humectant as well, as it helps to bind water from the lower layers of the epidermis to the SC. Formulations with additions of 2–6% of KH were stable in structure and did not cause phase separation even after 6 months storage.

Graphical Abstract

1. Introduction

The percentage for optimum content of water in the stratum corneum (SC) is up to 35% [1]. Water retention in the SC primarily depends on the presence of natural moisturising factors (NMF) to which part of the water is bound, but also on the presence of lipids. With everyday washing, by the use of tenside formulations, barrier function of the skin is disturbed and more water is evaporated from the SC; in addition to which UV irradiation has negative effects. Water is important for enzyme reactions in corneocytes associated with the periodical, regular renewal of the SC. In the absence of water, the SC becomes dry and hardened and peeling occurs. A portion of the water is not available, which instead is bound to proteins, i.e., does not constitute an environment for enzyme reaction. The dermis contains hyaluronic acid—glycosaminoglycan of high Mw, which heightens the hydration and elastic properties of the skin [2].
Usually, moisturisers are divided into substances which constitute part of the NMF, e.g., urea, lactic acid and its Na salt, and the Na salt of pyrrolidone carboxylic acid, as well as those not constituting part of the NMF, e.g., occlusives, humectants, emollients, rejuvenators, lipids, phospholipids, polyols, polysaccharides, ceramides and proteins including their hydrolysates. Glycerol is the cheapest moisturiser, which has the capability of retaining water when in contact with skin. Several cosmetics companies prefer natural substances as moisturisers, including vegetable proteins (soy protein, wheat gluten or maize zein) or those of animal origin (collagen, elastin or keratin) and their derivatives (hydrolysates). Protein extracts are also obtained from the leaves and root systems of plants and oilseeds (almonds, peanuts and sunflowers). For animal proteins, especially the aforementioned collagen, elastin and keratin, the occurrence of allergic skin reactions at an early stage is not widely documented, unlike vegetable proteins (e.g., wheat gluten), which may be contaminated with mycotoxins produced by certain fungi [3].
To incorporate protein into cosmetic products (e.g., gels, emulsions, lotions), it is appropriate that the proteins are water-soluble and re-aggregation of peptides (due to hydrophobic interactions) is avoided. Hydrolysates of proteins are often added into cosmetic products [4]. Collagen (or collagen hydrolysates) is very well established as a cosmetic material, and several studies [5,6,7,8,9] have highlighted its positive effects on water management of the SC, general protection of the structure of the skin and its function (including UV radiation), as well as improved appearance of the skin. Collagen is added to creams, lotions and ointments for skin care or facial masks. Collagen hydrolysates are obtained from the hides of cows or swine through controlled hydrolysis [10]. Very recently, there has been a trend towards frequent use of fish collagen. Elastin hydrolysates are obtained from tissues rich in elastin, for example, bovine ligamentum nuchae and keratin hydrolysates from parts of animal bodies containing keratin (claws, fur, feathers, wool and hooves). Conditions during hydrolysis can be adjusted to obtain low-molecular-weight fractions of the given Mw [11,12,13]. Production of the hydrolysates mentioned above is much easier than, for example, isolating catechins from plant sources, which is a highly complicated process, thereby making moisturisers with the latter extremely expensive [14,15,16].
At our departments, method for processing keratin by-products into keratin hydrolysates (KH) was developed, and active testing is in process on the properties of several cosmetic additives [17,18,19,20,21,22]. KH are applied, for example, in the food industry in the preparation of films, sheets, edible coatings and packaging materials for microcapsules, in addition to use in the textile, graphics, chemical and agricultural sectors. In the cosmetics industry, KH are incorporated in shampoos, hair conditioners, nutrient serums for tips of the hair, nail polish, mascara and more besides. In medicine, they are employed in the preparation of matrices used as substrates for cell culture and tissue engineering [23,24,25,26,27].
The purpose of the work: In addition to application in hair and nail cosmetics, KH are added to skin care agents. However, detailed studies on the moisturising effects of KH are lacking. Therefore, the aim of this paper was to test whether adding KH to the ointment base enhances hydration of the skin and skin barrier function, while decrease in TEWL was also investigated. Testing was carried out on men. Specific hypotheses: The authors suppose positive effect of an ointment base with added KH on men skin (increasing hydration and improving barrier function) as it was proved on women’s skin in our previous study [28].

2. Materials and Methods

2.1. Keratin Hydrolysate

KH was prepared from chicken feathers using proprietary technology developed by the authors [18]. Once ground and defatted, the feathers were first incubated for 24 h at 80 °C in 0.2% solution of KOH, then shaken at 50 °C at the pH of 9.0 for 8 h with the addition of 1% Savinase Ultra 16 L, a proteolytic enzyme (Novozymes A/S, Bagsvaerd, Denmark). Once filtrated, the KH solution was dialysed for 72 h via a cellulose membrane (Sigma-Aldrich D9402 (St. Louis, MO, USA); permeability of substances at molecular weight <12 kDa) against distilled water at 25 °C. Afterwards, the dialysed KH solution was initially dried into a thin film at 55 °C and then milled to form a fine powder (grain size < 300 μm). KH has stable wide molecular weight heterogeneity with the greatest proportion of low-molecular weight fractions (Mw = 12–27 kDa) and medium-molecular weight fractions (Mw = 27–66 kDa); high-molecular weight fractions (Mw > 66 kDa) are almost not represented at all.

2.2. Measuring of the Hydration and Barrier Properties of Formulations

When measuring of the hydration and barrier properties of formulations the methods described in our previous article [28] was followed. Moisturising properties of KH were tested on an MPA 5 station (Courage & Kazaka Electronic GmbH, Cologne, Germany), equipped with 3 probes. Corneometer CM 825 was used for measuring hydration of the skin; its measuring principle is based on the different dielectric constants of water and other substances. The probe was gently placed on the point of measurement at an angle of 90° and the resulting value was then recorded via software (CK MPA Multi Probe Adapter); 5 measurements were taken and when processing the data the lowest and the highest values were excluded. The Tewametr TM 300 is a probe for measuring the level of TEWL. Inside a hollow cylinder there are two sensors that measure temperature and relative humidity. A stable result of measurement is achieved quite rapidly when using the probes. Again, the probe was lightly placed on the area to be measured and the resulting value was recorded via the software. In total, 15 values were measured; the initial 5 values were omitted from the data set. So as to discern the level of pH, a membrane probe was used (pH meter PH 905, Courage & Kazaka Electronic GmbH, Cologne, Germany), assessing changes in the pH of the surface of the skin after applying a cosmetic product.
The ointment base (OB) used for testing was an o/w emulsion supplied by Fagron (Ltd., Olomouc, Czech Republic). The composition of emulsion is specified in arrangement with the International Nomenclature of Cosmetic Ingredients (INCI) in order from the substances in the highest representation to the substances in the lowest representation: aqua, paraffin, paraffinum liquidum, cetearyl alcohol, Laureth 4, sodium hydroxide, carbomer, methylparaben, propylparaben.
Formulations containing 2%, 4%, and 6% KH (based on the weight of the OB) were arranged according to procedure as follows. The amount of KH powder weighed was put into a PE vessel (7 cm in diameter, 10 cm high) and the OB was added, at an amount that confirmed the total weight of the formulation equalled 50 g. The mixture was subsequently homogenised for 10 min time at 2000 rpm using an RZR 2020 agitator (Ika, Staufen, Germany). Formulations prepared were kept at 5 ± 1 °C and conditioned at room temperature for 2 h prior to use.
Hydration and barrier properties of KH were tested on 10 men (average age of 25.4 years). The method of choosing the volunteers and the testing itself were accompanied in accordance with international ethical principles of bio-medical research using human subjects; all persons gave their informed agreement prior to their attachment to the study [29]. The volunteers were questioned to fulfil a survey on their health status. The volunteers devoted to avoid applying any cosmetic product to the test places and surrounding areas during the 24 h prior to and during the test period. Furthermore, the test places and surrounding areas were allowed to be washed with running water in the evenings. Measurements were done at the temperature of 23 ± 2 °C and the relative humidity of 56 ± 3%.
Firstly, 2 sites (2 × 4 cm size) were sketched on the volar forearm of the right upper limb, 3 sites of the same dimensions were sketched on the forearm of the left upper limb. An application of 0.5% solution of SLS (sodium lauryl sulphate) was applied to the sites to degrease the skin and eliminate individual characteristics of the skin at the area. Filter paper strips of a size 2 × 4 cm were placed into the SLS solution for approximately 1 min. Afterwards, the strips were applied to the marked places of the forearms and fixed with adhesive plasters. After 4 h, the strips with the SLS solution were removed, and 0.1 mL of tested formulations (applied with syringes) were spread over the marked area. On the left arm, the 1st site was left clear (as was control), the ointment base (OB) was applied to the 2nd site and OB + 2% KH was put on the third area. OB + 4% KH and OB + 6% KH were applied to the right arm. After applying of the formulations, all the sites were measured at intervals of 1, 2, 3, 4, 24, and 48 h. Furthermore, the measured values were processed via the software.

2.3. Sensory Evaluation of Formulations

This procedure was carried out in a sensory analysis room that met conditions defined by ISO 6658 and ISO 8586 [30,31]. The formulations were evaluated by 10 assessors at novice levels of sensory training (trained assessors), which corresponds to the sensory perception of an actual consumer. Prior to conducting the evaluation, the observers were briefed on the manner and implementation of each sensory test, including how to record the same using pre-prepared questionnaires. The formulations tested were randomly sorted to form four samples: Sample A = OB + 4% KH, Sample B = OB, Sample C = OB + 2% KH, Sample D = OB + 6% KH. Sensory analysis was performed and evaluated by an objective ranking test, arranged according to the intensity of characteristics [32]. The qualities evaluated comprised colour, scent, spreadability, absorbency, texture and consistency.

2.4. Statistical Analysis

Calculating data and making graphical outputs of measuring hydration properties and barrier functions of tested formulas were accompanied using Excel 2016 (16.0.4738.1000, Microsoft, Santa Rosa, CA, USA). Arithmetic means and standard deviations (SD) were calculated for the values obtained via corneometric, TEWL and pH skin measurements. The results from these sensory tests were statistically analysed by applying the Friedman test at 95% confidence, in addition to the Némenyi method.

3. Results

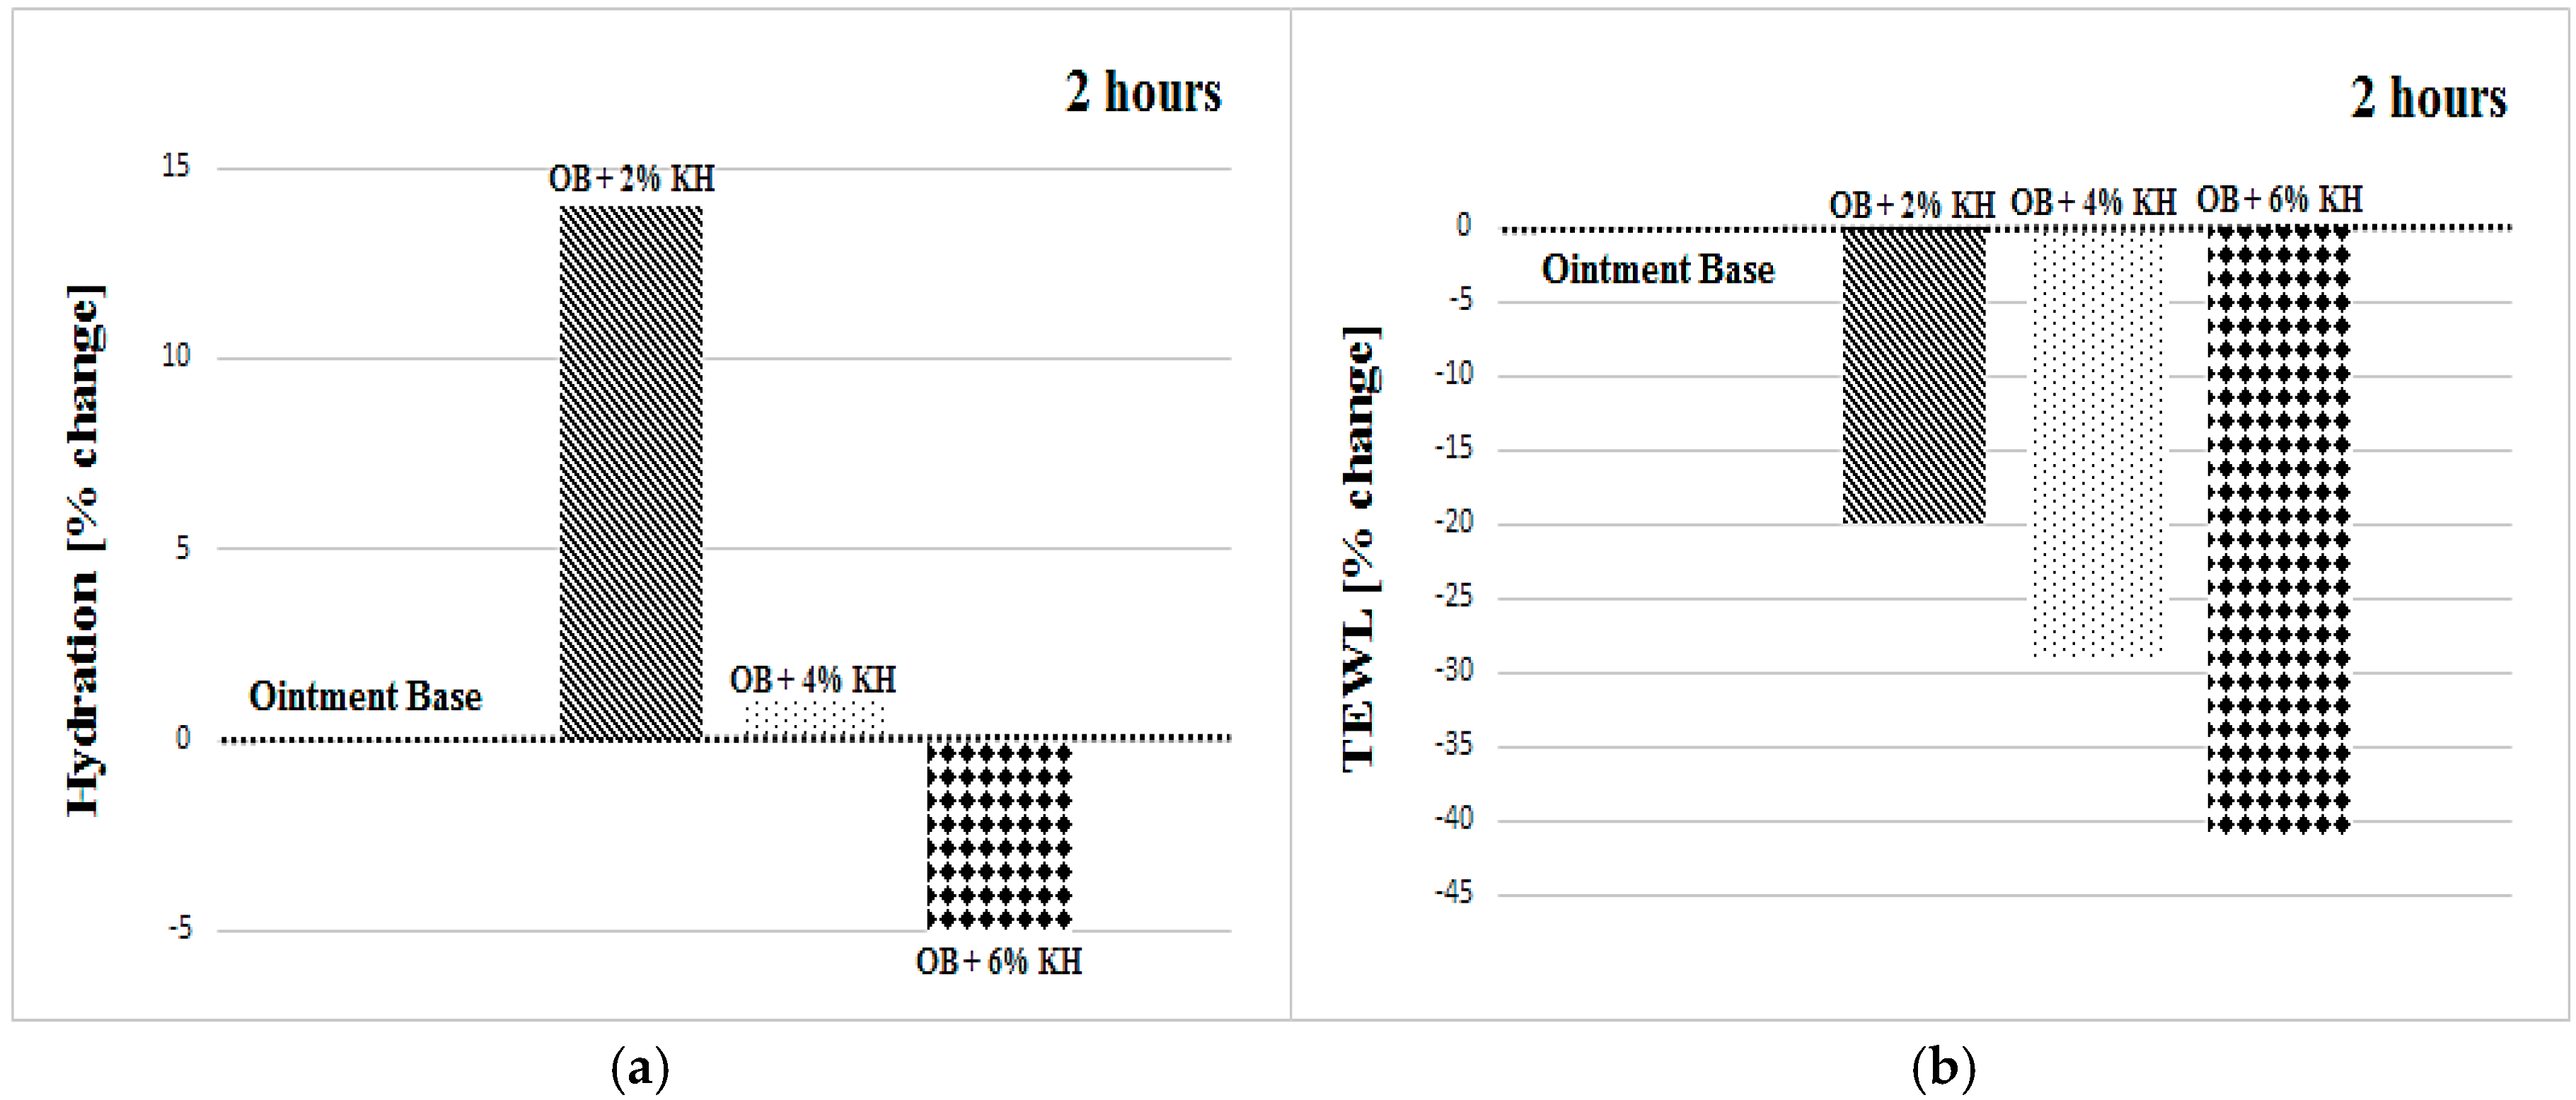
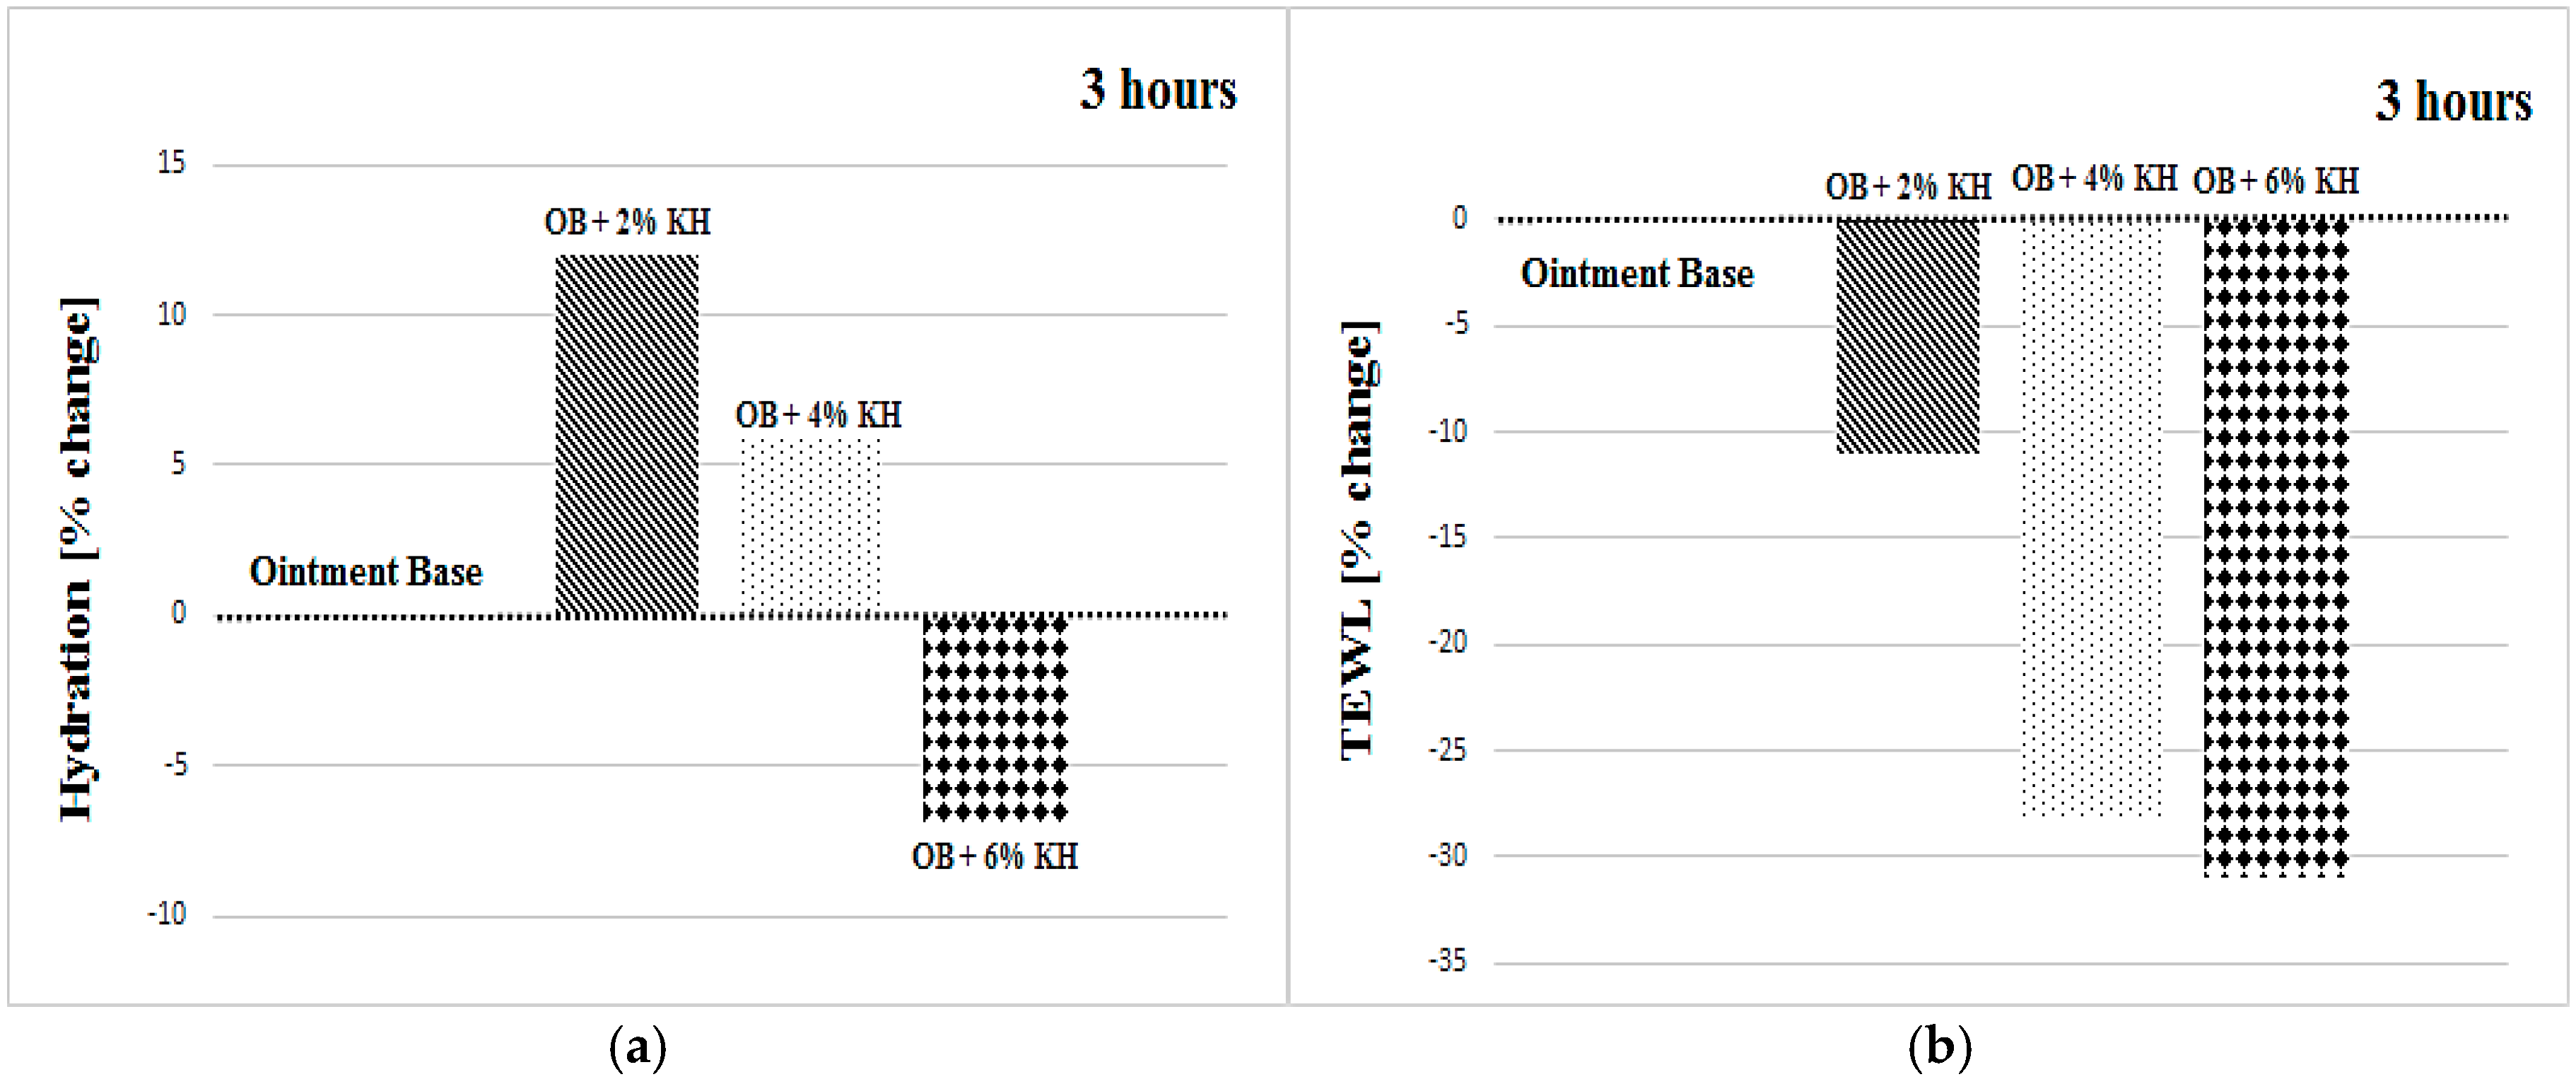
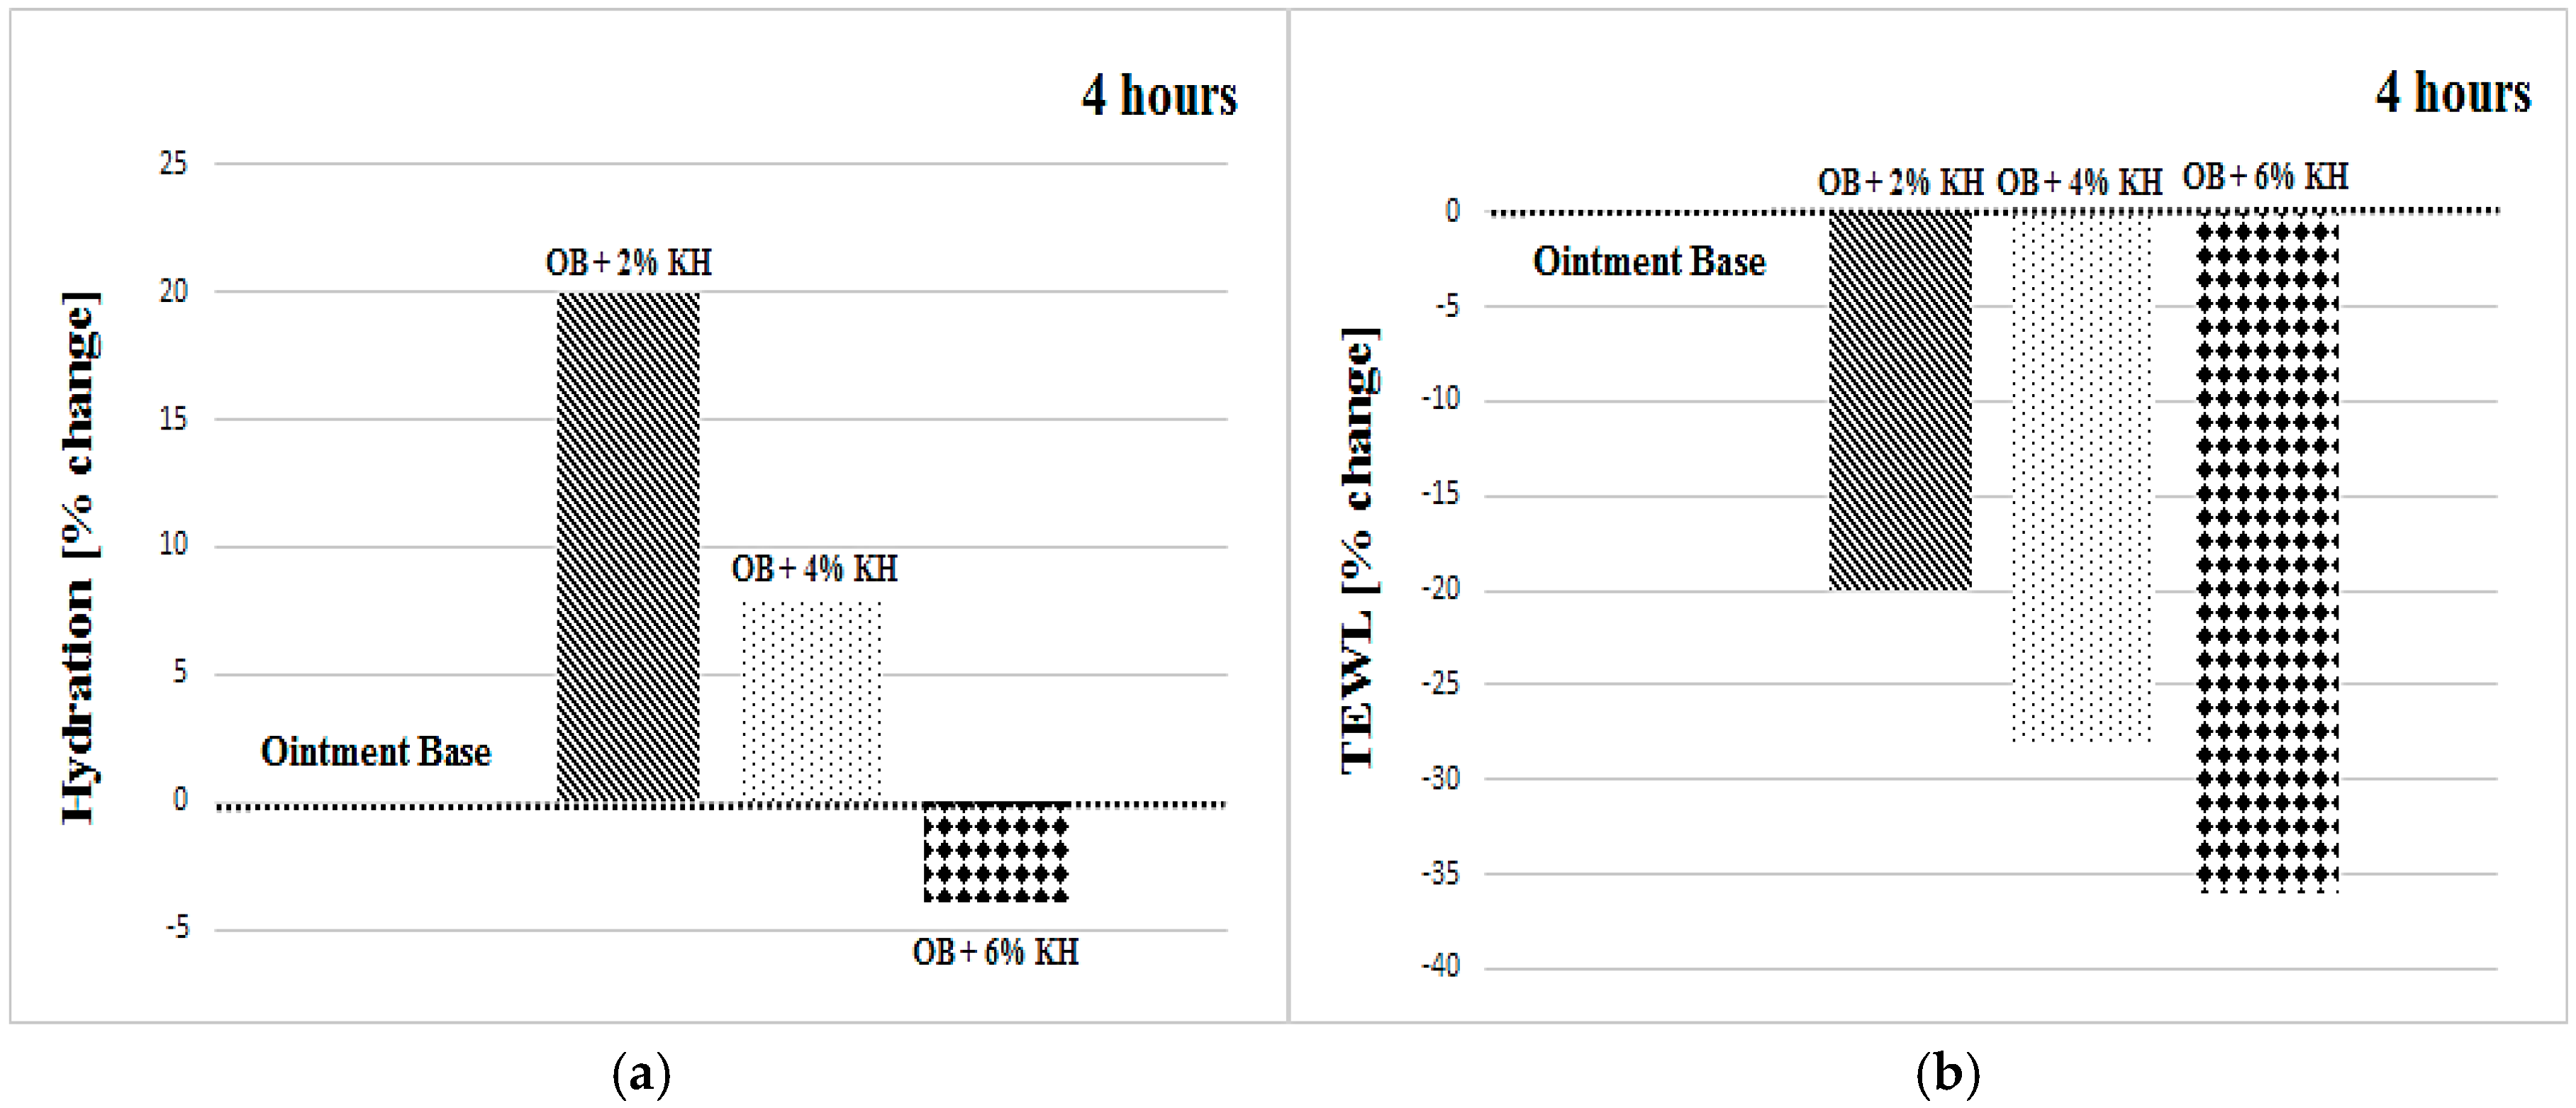
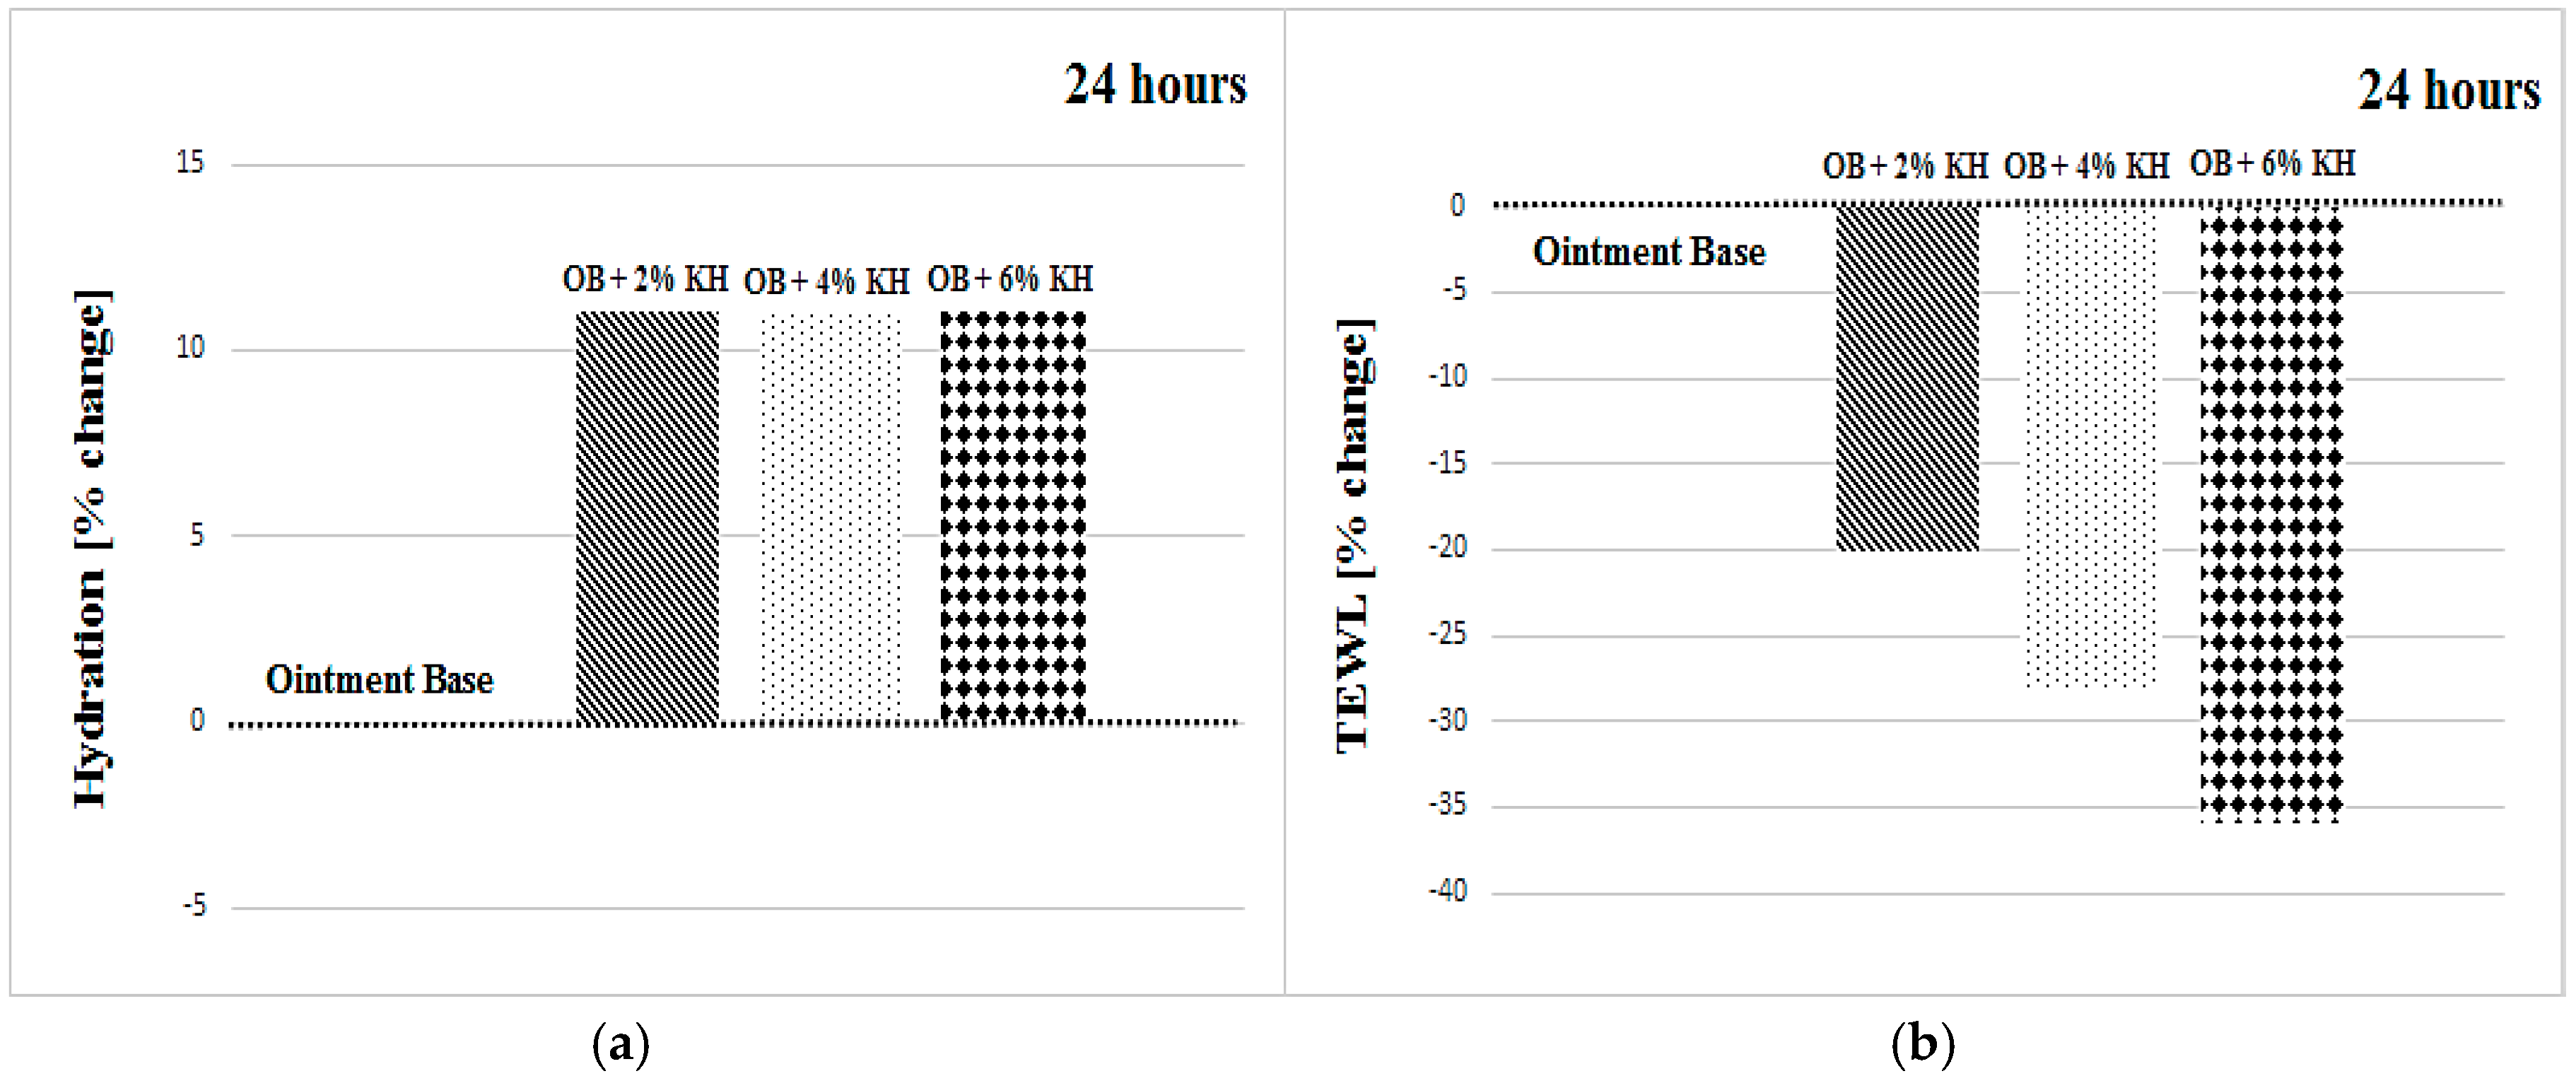
As the hydration and TEWL values were measured in different volunteers, they could not be compared to each other. Therefore, the values of hydration and TEWL (measured on the sites treated with the formulations containing 2%, 4% and 6% additions of keratin hydrolysate at intervals of 1, 2, 3, 4, 24 and 48 h) are converted into change in percent in comparison with the ointment base (OB). The pH values for skin for all volunteers are displayed as the arithmetic mean of the recorded values of skin pH. All the results are presented in Table 1. Figure 1, Figure 2, Figure 3, Figure 4, Figure 5 and Figure 6 graphically demonstrate change in percent in hydration and TEWL, as gauged at sites treated with formulations containing 2%, 4% and 6% additions of KH; OB is taken as the default value (100%).

3.1. Hydration

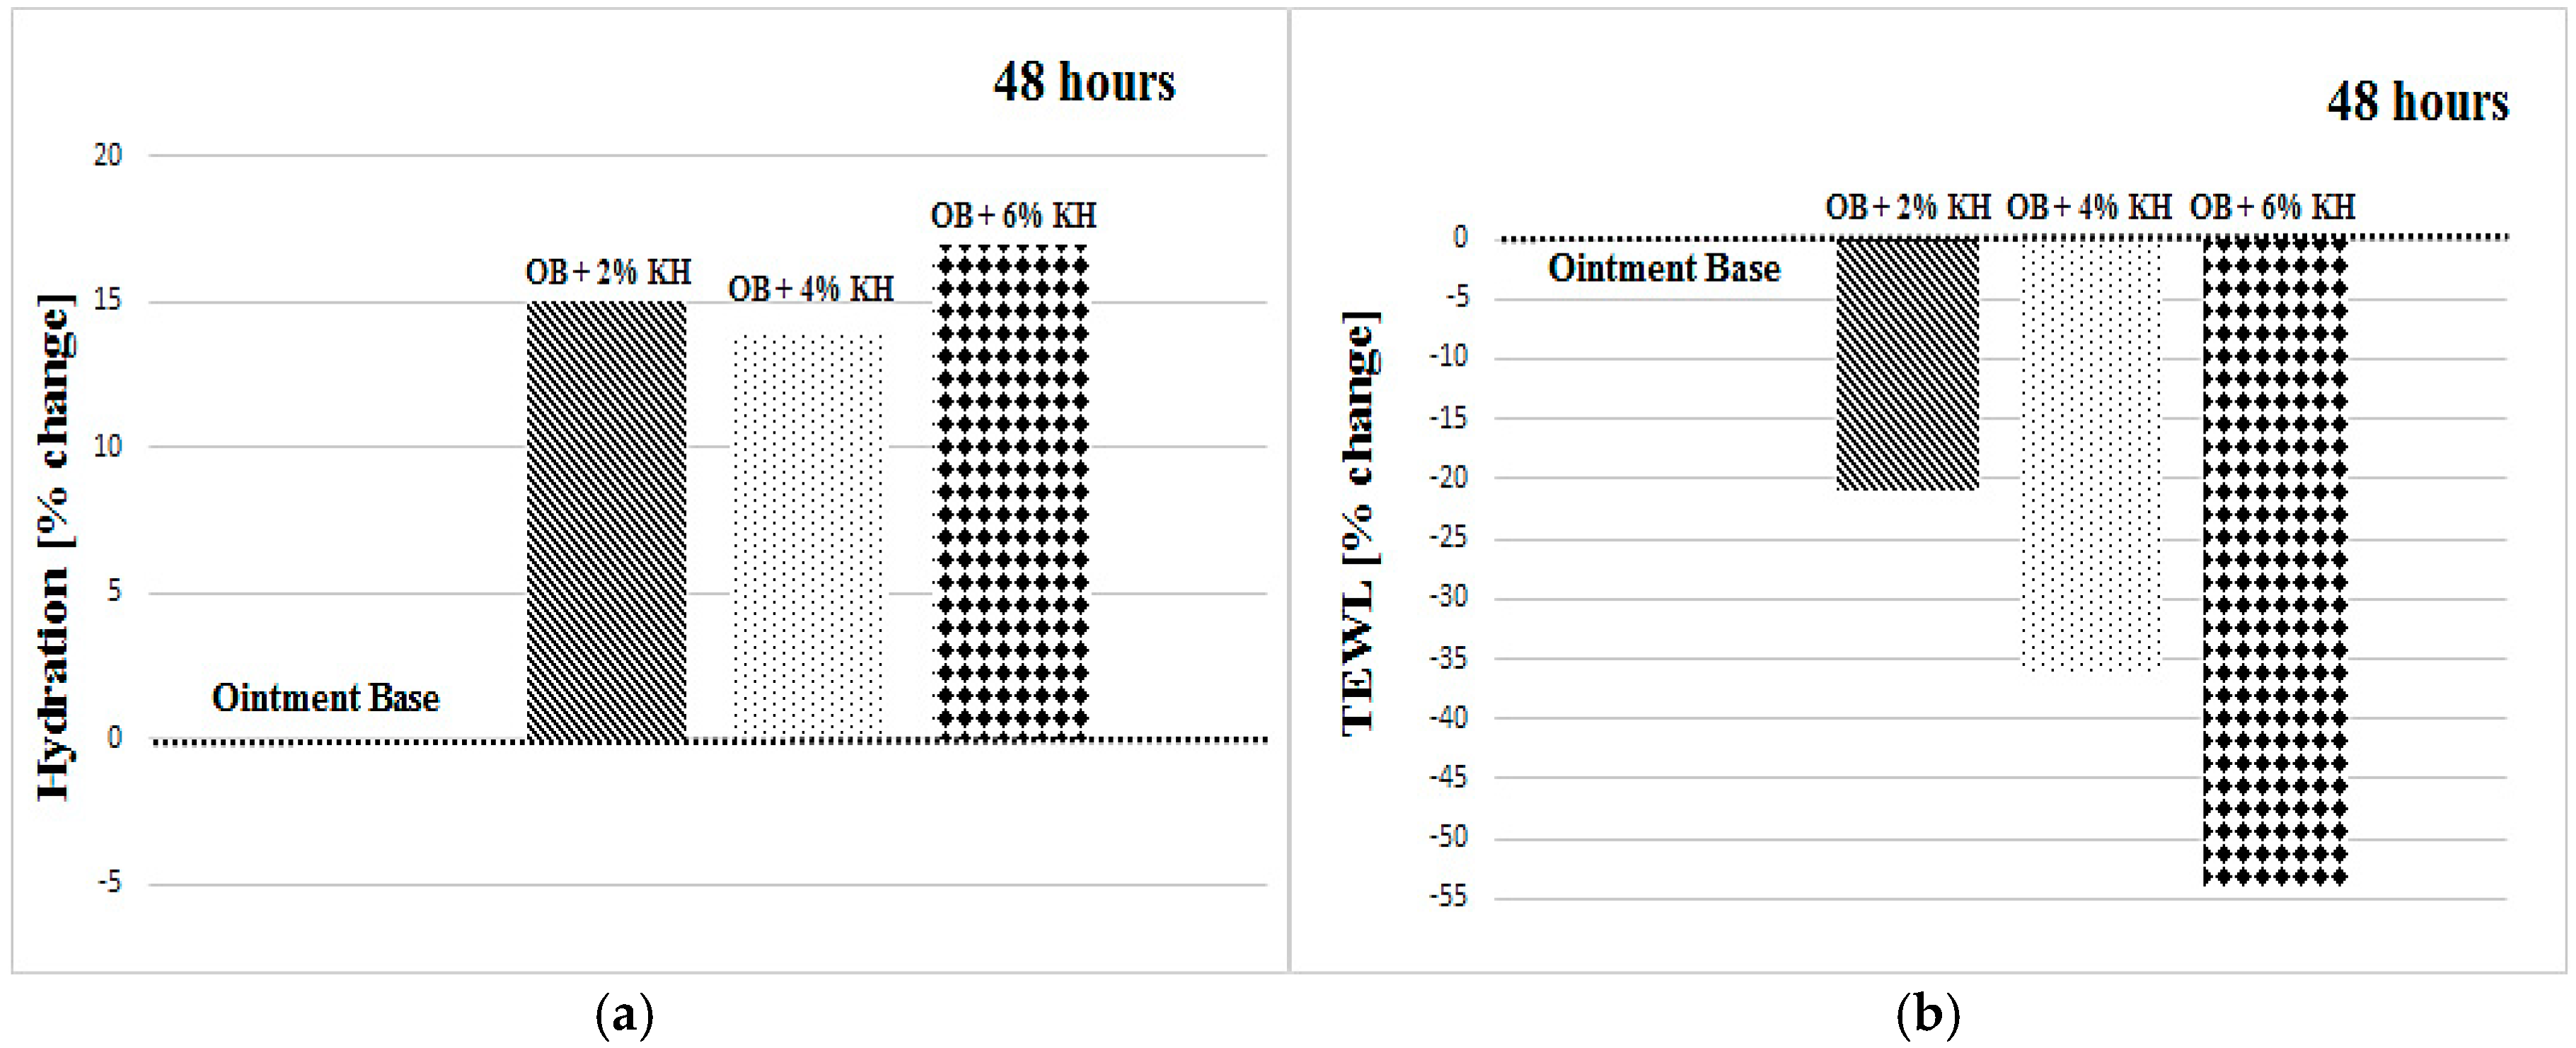
In terms of findings for SC hydration, several trends are noticeable. At early intervals of measurement (1–4 h) it is clear that the noticeable increases in hydration of the skin (12–19%) were recorded for formulations where the OB was supplemented with 2% of KH; the addition of 4% KH resulted in a lesser rise (1–7%) in hydration. On the other hand, 6% addition of KH into OB negatively influenced the values for SC hydration (3–7% decrease recorded). We suppose that at early intervals of measurement (up to 4 h) higher levels of KH may paradoxically result in lower levels of hydration of SC due the higher portion of high-molecular weight fractions (Mw > 66 kDa) which penetrate very slowly into the SC. An additional possible explanation about the non linearity of moisturisation measures is that the variable concentration of ionic material like KH may influence in a wayward manner the corneometric measure. After 24 h of measurement, all the additions of KH to the OB resulted in an increase of 11% in SC hydration. The same tendency remained even after 48 h, following which a slight increase in hydration still remained: a 15% increase for KH at 2%, 14% for the 4% addition of KH, and 17% for KH at 6%. The very similar tendency of changing SC hydration over the tested period on sites treated with formulations supplemented with the same amount of KH was proved in our previous study on women volunteers [28]. The KH added herein exhibits a broader distribution of Mw. We suppose that low Mw fractions of KH penetrate the epidermis once applied to the skin. A reason for improved hydration of the skin after applying creams enhanced with KH is that KH helps to bind water from lower layers of the epidermis to the structure of the SC leading to formation of H-bridges between the molecules of KH and water. The moisturising effect of KH is equivalent with wide-spread moisturisers (e.g., hyaluronic acid, glycerin and urea) that were tested in emulsion and gel formulations [22].

3.2. Transepidermal Water Loss

After applying the formulations with all tested additions of KH to the skin, a drop in TEWL was recorded, in comparison with pure OB. The higher the amount of KH the more positive the effect on the skin (lower values of TEWL). An hour after applying the formulations, a 20% drop in TEWL was recorded for a formulation with 2% KH (in comparison with pure OB); a visible 28% drop in TEWL for 4% addition of KH, whereas KH at 6% caused a significant 36% decrease in TEWL. Actually, reduced TEWL values were detected after 2, 3 and 4 h of measurement for formulations enhanced with KH as well. After 24 and 48 h, TEWL was considerably reduced on places treated formulations supplemented with KH. After 24 h, in comparison with pure OB, TEWL of the skin was 23% lesser for the OB enhanced with 2% of KH; KH at 4% resulted in a drop in TEWL by about 28%, while KH at 6% caused TEWL to drop by 36%. A comparable tendency is obvious after 48 h—the TEWL for skin cured with formulation having 2% KH was 21% lower than at the place for pure OB; a 36% lower TEWL was recorded in case of 4% added KH; KH at 6% even brought a drop of 54%. The tendency of decreasing of TEWL over the tested period on sites treated with formulations supplemented with 2% KH and 4% KH was the same as in our previous study on women volunteers [28]. While supplementing the OB with 6% KH did not cause a drop in TEWL on women, in case of men volunteers a more visible drop in TEWL was recorded. The meaningfully lower TEWL for OB enhanced with KH can be explained by forming a protective film (after applying the formulations to the epidermis) due to the presence of higher Mw fractions of keratin hydrolysate, which helps to prevent the loss of epidermal water. Actually, the very positive effect of KH on TEWL is analogous or even surpasses the values of TEWL verified for cosmetic gels or emulsions enhanced with 5–10% of glycerol and 1–5% of sericin. The barrier properties of KH are better than (for example) those for hyaluronic acid and urea; indeed, barrier properties have also been tested [22]. TEWL values alter depending on age and sex. For instance, Wilhelm et al. found a lower TEWL in the elderly [33], while Conti et al. observed higher TEWL values in men [34].

3.3. pH of the Skin Surface

It should be noted that an acidic skin surface refers to pH 3.5–4.3, neutral in this respect is pH 4.4–5.5, and a basic skin surface corresponds to pH 5.6–6.5 [35]. No noteworthy variations in the pH of the skin surface after applying tested formulations (OB + 2%, 4% and 6% KH) were observed; see Table 1. The pH of 4.6–5.0 resembles a normal skin surface. No significant changes of skin surface pH were found in our previous study on women volunteers as well [28].

3.4. Organoleptic Assessments

When evaluating colour, samples were ranked by the intensity of colour, from lightest (balanced, without any unfamiliar shades, glossy appearance) to the darkest shades (brownish to brown, dull appearance). With 95% confidence, there are statistically significant differences in preference between the 4 samples examined. Sample OB was identified as the lightest and the most glossy, followed by OB + 2% KH, OB + 4% KH and OB + 6% KH which was brownish. Statistically significant differences were found between the OB and OB + 4% KH samples, the OB and OB + 6% KH samples, and the OB + 2% KH and OB + 6% KH samples. For the remaining samples, statistically important differences were not identified at the 95% level of significance.
When evaluating scent, samples were ranked by intensity of odour, from the outstanding scent (without any dull smell) to the unacceptable scent (with the dull smell). With 95% confidence, there are statistically significant differences in preference between the four samples examined. Identified as the least pleasant scent was sample OB + 6% KH (with slight smell of hydrolysed keratin protein), followed by samples OB + 4% KH, OB + 2% KH, and finally OB. Statistically significant differences were only found between the OB and OB + 6% KH samples. For the other samples, statistically important differences were not identified at the 95% level of significance.
When evaluating spreadability, the samples were ranked by intensity of spreadability, from the best spreadability (viscous to molten samples) to the worst spreadability (difficult to spread to unspreadable). With 95% confidence, it can be said that there were no statistically significant differences in preference between the 4 samples examined. Identified as the worst spreadable (among the 4 tested samples) was sample OB + 6% KH, but with yet the optimal spreadability, followed by samples OB, OB + 4% KH and OB + 2% KH.
When evaluating absorbency, samples were ranked by intensity of absorbability, from the best absorption properties to the sample with difficulty to absorb. With 95% confidence, it can be stated that no statistically significant differences exist in preference between the 4 samples examined. Sample OB + 4% KH was identified as the least absorbable, followed by samples OB + 6% KH, OB + 2% KH and lastly OB.
When evaluating texture, the samples were ranked from the most pleasant (smooth and creamy) to the least pleasant (rough, lumpy). With 95% confidence, statistically significant differences in preference were recorded for the 4 samples examined. Identified as the least pleasant (slightly lumpy) was sample OB + 6% KH, followed by samples OB + 4% KH, OB and lastly OB + 2% KH. Statistically significant differences were only found between the samples OB + 2% KH and OB + 6% KH. For all other samples, statistically significant differences were not identified at the 95% level of significance.
When evaluating consistency, the samples were ranked according to the degree of consistency- from the excellent (homogenous) to the unacceptable (solid, nonhomogenous). With 95% confidence, statistically significant differences existed in preference between the four samples examined. Identified as the least consistent was sample OB + 4% KH, followed by samples OB + 2% KH, OB + 6% KH, and lastly OB. Statistically significant differences were only found between the samples OB and OB + 2% KH, and OB and OB + 4% KH. For the remaining samples, statistically significant differences were not identified at the 95% level of significance.

4. Conclusions

Keratin hydrolysate (KH) makes for an excellent occlusive because, after applying a formulation to the skin, it forms a protective film that reduces TEWL. For a 6% addition of KH to OB, decrease in TEWL was observed to be 1/3 to 1/2 lower within 48 h than for pure OB. Keratin hydrolysate also has a moisturising effect, since part of the keratin hydrolysate penetrates the skin and binds itself to the SC via non-covalent interactions, thus retaining water in the SC. The authors recommend adding 2% KH to OB for immediate improvement in skin hydration, i.e., during the first 4 h of application. To ensure prolonged hydration (more than 24 h after applying the formulation), no significant difference exists between the amounts of KH added. The pH of skin treated with formulations containing 2–6% supplementations of KH equaled 4.7–5.0, which corresponds to a neutral skin surface. Increasing the content of KH resulted in the colour of formulations darkening to the shade of dark green, while the characteristic smell of keratin protein was also more pronounced. The formulation with KH at 2% was rated as the best-spreadable option, followed by 4% KH and OB, whereas KH at 6% was assessed as the least spreadable variant. Sample OB was identified as the most highly absorbable option, followed by formulations with KH at 2% and at 6%. Identified as being the formulation with the least pleasant texture (slightly lumpy) was that with KH at 6%, followed by that with 4% KH and then OB. Judged as being the least consistent was the formulation with KH at 4% KH, then those containing 2% KH and 6% KH; meanwhile, OB was identified as the formulation boasting the best consistency. The ointment base supplemented with keratin hydrolysate has the same positive effect on men’s skin (increasing hydration and decreasing TEWL) as it was proved on women’s skin. In conclusion, keratin hydrolysate is a highly functional additive, and its addition to men’s as well as women’s cosmetic formulations can be recommended.

Author Contributions

Supervision, visualization, writing—original draft preparation, writing—review and editing: P.M.; methodology: P.M. and J.P.; formal analysis, resources, validation: J.P.; funding acquisition, project administration: D.J.; software: D.J. and J.P.; data curation, investigation: M.H.

Funding

This work was supported by the Ministry of Education, Youth and Sports of the Czech Republic within the National Sustainability Programme Project No. LO1303 (MSMT-7778/2014) and also by the European Regional Development Fund under the project CEBIA-Tech No. CZ.1.05/2.1.00/03.0089.

Acknowledgments

The authors thank to Julian Overall (the UK) for professional editing of the manuscript.

Conflicts of Interest

The authors declare no conflict of interest. The funders had no role in the design of the study; in the collection, analyses, or interpretation of data; in the writing of the manuscript, or in the decision to publish the results.

References

  1. Draelos, Z.D. Therapeutic moisturizers. Dermatol. Clin. 2000, 18, 597–607. [Google Scholar] [CrossRef]
  2. Verdier-Sévrain, S.; Bonté, F. Skin hydration: A review on its molecular mechanisms. J. Cosmet. Dermatol. 2007, 6, 75–82. [Google Scholar] [CrossRef] [PubMed]
  3. Rieger, M.M.; Deem, D.E. Skin moisturizers. II. The effects of cosmetic ingredients on human stratum corneum. J. Soc. Cosmet. Chem. 1974, 25, 253–262. [Google Scholar]
  4. International Nomenclature of Cosmetic Ingredients. Available online: http://library.essentialwholesale.com/inci-names-list/ (accessed on 25 May 2018).
  5. Li, G.Y.; Fukunaga, S.; Takenouchi, K.; Nakamura, F. Comparative study of the physiological properties of collagen, gelatin and collagen hydrolysate as cosmetic materials. Int. J. Cosmet. Sci. 2008, 27, 101–106. [Google Scholar] [CrossRef] [PubMed]
  6. Zague, V.; de Freitas, V.; da Costa Rosa, M. Collagen hydrolysate intake increases skin collagen expression and suppresses matrix metalloproteinase 2 activity. J. Med. Food 2011, 14, 618–624. [Google Scholar] [CrossRef] [PubMed]
  7. Han, Y.T.; Han, Z.W.; Yu, G.Y.; Wang, Y.J.; Cui, R.Y.; Wang, C.B. Inhibitory effect of polypeptide from Chlamys farreri on ultraviolet A-induced oxidative damage on human skin fibroblasts in vitro. Pharmacol. Res. 2004, 49, 265–274. [Google Scholar] [CrossRef] [PubMed]
  8. Hou, H.; Li, B.; Zhao, X.; Chen, L. The effect of Pacific cod (Gadus macrocephalus) skin gelatin polypeptides on UV radiationinduced skin photoaging in ICR mice. Food Chem. 2009, 115, 945–950. [Google Scholar] [CrossRef]
  9. Zhuang, Y.; Hou, H.; Zhao, X.; Zhang, Z.; Li, B. Effects of collagen and collagen hydrolysate from jellyfish (Rhopilema esculentum) on mice skin photoaging induced by UV irradiation. J. Food Sci. 2009, 74, H183–H188. [Google Scholar] [CrossRef] [PubMed]
  10. Hamada, Y.; Shirai, K.; Sato, C. Collagen Incorporating Cosmetics. U.S. Patent 20020150598 A1, 17 October 2002. [Google Scholar]
  11. Guoying, L.I.; Fukunaga, S.; Takenouchi, K.; Nakamura, F. Physicochemical properties of collagen isolated from calf limed splits. J. Am. Leather Chem. Assoc. 2003, 98, 224–229. [Google Scholar]
  12. Mohammad, A.W.; Suhimi, N.M.; Abdul Aziz, A.G.K.; Jahim, J.M. Process for production of hydrolysed collagen from agriculture resources: Potential for further development. J. Appl. Sci. 2014, 14, 1319–1323. [Google Scholar] [CrossRef]
  13. Selvakumar, P.; Ling, T.C.; Covington, A.D.; Lyddiatt, A. Enzymatic hydrolysis of bovine hide and recovery of collagen hydrolysate in aqueous two-phase systems. Sep. Purif. Technol. 2012, 89, 282–287. [Google Scholar] [CrossRef]
  14. Keller, K.L.; Fenske, N.A. Uses of vitamins A, C, and E and related compounds in dermatology: A review. J. Am. Acad. Dermatol. 1998, 39, 611–625. [Google Scholar] [CrossRef]
  15. Phillips, C.L.; Combs, S.B.; Pinnell, S.R. Effects of ascorbic acid on proliferation and collagen synthesis in relation to the donor age of human dermal fibroblasts. J. Investig. Dermatol. 1994, 103, 228–232. [Google Scholar] [CrossRef] [PubMed]
  16. Katiyar, S.K.; Ahmad, N.; Mukhtar, H. Green tea and skin. Arch. Dermatol. 2000, 136, 989–994. [Google Scholar] [CrossRef] [PubMed]
  17. Mokrejs, P.; Hrncirik, J.; Janacova, D.; Svoboda, P. Processing of keratin waste of meat industry. Asian J. Chem. 2012, 24, 1489–1494. [Google Scholar]
  18. Mokrejs, P.; Svoboda, P.; Hrncirik, J.; Janacova, D.; Vasek, V. Processing poultry feathers into keratin hydrolysate through alkaline-enzymatic hydrolysis. Waste Manag. Res. 2011, 29, 260–267. [Google Scholar] [CrossRef] [PubMed]
  19. Mokrejs, P.; Krejci, O.; Svoboda, P. Producing keratin hydrolysates from sheep wool. Orient. J. Chem. 2011, 27, 1303–1309. [Google Scholar]
  20. Mokrejs, P.; Krejci, O.; Svoboda, P.; Vasek, V. Modeling technological conditions for breakdown of waste sheep wool. Rasayan J. Chem. 2011, 4, 728–735. [Google Scholar]
  21. Polaskova, J.; Pavlackova, J.; Vltavska, P. Moisturizing effect of topical cosmetic products applied to dry skin. J. Cosmet. Sci. 2013, 64, 329–340. [Google Scholar] [PubMed]
  22. Polaskova, J.; Pavlackova, J.; Egner, P. Effect of vehicle on the performance of active moisturizing substances. Skin Res. Technol. 2015, 21, 403–412. [Google Scholar] [CrossRef] [PubMed]
  23. Moore, G.R.P.; Martelli, S.M.; Gandolfo, C. Influence of the glycerol concentration on some physical properties of feather keratin films. Food Hydrocoll. 2006, 20, 975–982. [Google Scholar] [CrossRef]
  24. Reichl, S. Films based on human hair keratin as substrates for cell culture and tissue engineering. Biomaterials 2009, 30, 6854–6866. [Google Scholar] [CrossRef] [PubMed]
  25. Tanabe, T.; Okitsu, N.; Tachibana, A.; Yamauchi, K. Preparation and characterization of keratin–chitosan composite film. Biomaterials 2009, 23, 817–825. [Google Scholar] [CrossRef]
  26. Tanabe, T.; Okitsu, N.; Tachibana, A.; Yamauchi, K. Fabrication and characterization of chemically crosslinked keratin films. Mater. Sci. Eng. C 2004, 24, 441–446. [Google Scholar] [CrossRef]
  27. Katoh, K.; Shibayama, M.; Tanabe, T.; Yamauchi, K. Preparation and physicochemical properties of compression-molded keratin films. Biomaterials 2009, 25, 2265–2272. [Google Scholar] [CrossRef]
  28. Mokrejs, P.; Hutta, M.; Pavlackova, J.; Egner, P.; Benicek, L. The cosmetic and dermatological potential of keratin hydrolysate. J. Cosmet. Dermatol. 2017, 16, e21–e27. [Google Scholar] [CrossRef] [PubMed]
  29. International Ethical Guidelines for Biomedical Research Involving Human Subjects; Council for International Organizations of Medical Sciences: Geneva, Switzerland, 2002.
  30. ISO 6658. Sensory Analysis—Methodology—General Guidance; International Organization for Standardization: Geneva, Switzerland, 2005. [Google Scholar]
  31. ISO 8586. Sensory Analysis—General Guidelines for the Selection, Training and Monitoring of Selected Assessors and Expert Sensory Assessors; International Organization for Standardization: Geneva, Switzerland, 2012. [Google Scholar]
  32. ISO 8587. Sensory Analysis—Methodology—Ranking; International Organization for Standardization: Geneva, Switzerland, 2006. [Google Scholar]
  33. Wilhelm, K.P.; Cua, A.B.; Maibach, K.I. Skin aging. Effect on transepidermal water loss, stratum corneum hydration, skin surface pH, and casual sebum content. Arch. Dermatol. 1991, 127, 1806–1809. [Google Scholar] [CrossRef] [PubMed]
  34. Conti, A.; Schiavi, M.E.; Seidenari, S. Capacitance, transepidermal water loss and causal level of sebum in healthy subjects in relation to site, sex and age. Int. J. Cosmet. Sci. 1995, 17, 77–85. [Google Scholar] [CrossRef] [PubMed]
  35. Information and Operating Instructions for the Multi Probe Adapter MPA and Its Probe; Courage and Khazaka electronic GmbH: Köln, Germany, 2013.
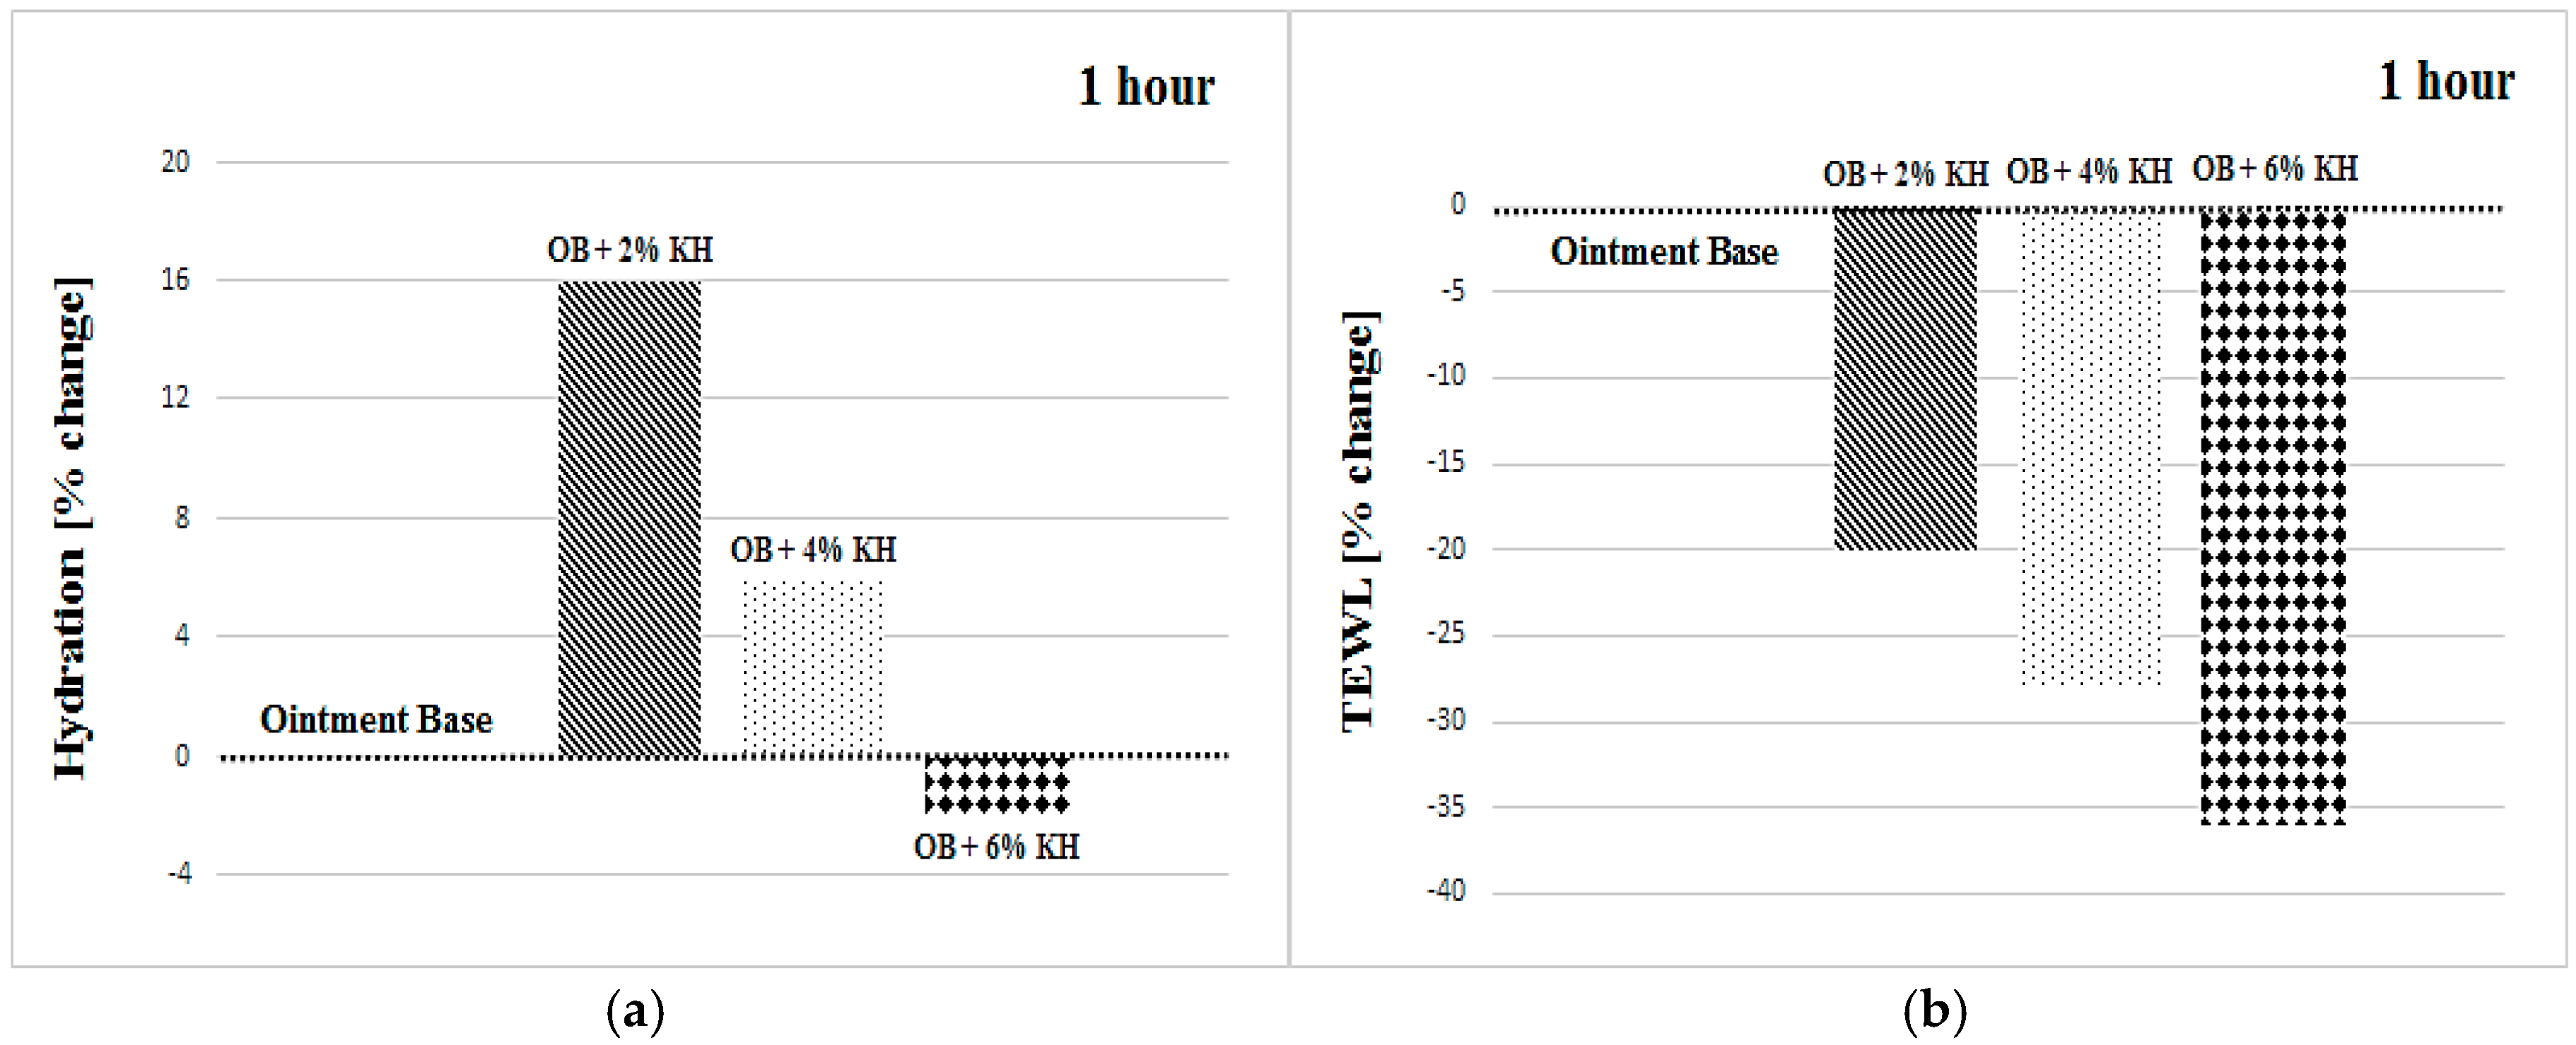
Figure 1. Change in per cent in hydration (a) and TEWL (b) of stratum corneum after 1 h of measurement at sites treated with formulations containing 2%, 4% and 6% additions of KH; compared to ointment base (OB) as a default value.
Cosmetics 05 00064 g001
Figure 2. Change in per cent in hydration (a) and TEWL (b) of stratum corneum after 2 h of measurement at sites treated with formulations containing 2%, 4% and 6% additions of KH; compared to ointment base (OB) as a default value.
Cosmetics 05 00064 g002
Figure 3. Change in per cent in hydration (a) and TEWL (b) of stratum corneum after 3 h of measurement at sites treated with formulations containing 2%, 4% and 6% additions of KH; compared to ointment base (OB) as a default value.
Cosmetics 05 00064 g003
Figure 4. Change in per cent in hydration (a) and TEWL (b) of stratum corneum after 4 h of measurement at sites treated with formulations containing 2%, 4% and 6% additions of KH; compared to ointment base (OB) as a default value.
Cosmetics 05 00064 g004
Figure 5. Change in per cent in hydration (a) and TEWL (b) of stratum corneum after 24 h of measurement at sites treated with formulations containing 2%, 4% and 6% additions of KH; compared to ointment base (OB) as a default value.
Cosmetics 05 00064 g005
Figure 6. Change in per cent in hydration (a) and TEWL (b) of stratum corneum after 48 h of measurement at sites treated with formulations containing 2%, 4% and 6% additions of KH; compared to ointment base (OB) as a default value.
Cosmetics 05 00064 g006
Table 1. Change in hydration and TEWL after 1, 2, 3, 4, 24 and 48 h of measurement and pH of the skin surface.
Time (h)12342448
Hydration (% change vs. Ointment base) ± SD
OB + 2% KH+16 ± 15+14 ± 16+12 ± 9+19 ± 14+11 ± 18+15 ± 9
OB + 4% KH+6 ± 19+1 ± 18+5 ± 10+7 ± 16+11 ± 9+14 ± 15
OB + 6% KH−3 ± 25−4 ± 14−7 ± 18−4 ± 17+11 ± 14+17 ± 14
TEWL (% change vs. Ointment base) ± SD
OB + 2% KH−20 ± 15−20 ± 22−11 ± 21−20 ± 21−23 ± 20−21 ± 17
OB + 4% KH−28 ± 12−29 ± 20−28 ± 20−28 ± 24−28 ± 20−36 ± 20
OB + 6% KH−36 ± 16−41 ± 21−31 ± 17−36 ± 17−36 ± 20−54 ± 17
pH
Ointment base (OB)4.8 ± 0.55.1 ± 0.34.9 ± 0.35.0 ± 0.44.6 ± 0.45.0 ± 0.6
OB + 2% KH5.0 ± 0.64.8 ± 0.44.9 ± 0.54.9 ± 0.54.7 ± 0.35.0 ± 0.6
OB + 4% KH4.8 ± 0.54.9 ± 0.34.8 ± 0.44.8 ± 0.34.7 ± 0.54.8 ± 0.5
OB + 6% KH4.7 ± 0.55.0 ± 0.24.9 ± 0.44.8 ± 0.44.8 ± 0.65.0 ± 0.6