
Olive Leaves and Citrus Peels: From Waste to Potential Resource for Cosmetic Products

 ,
,  ,
,  , ,
, ,  ,
,  and
and 
Abstract
1. Introduction
2. Materials and Methods
2.1. Materials
2.2. Extracts Preparation and Characterization
2.3. Total Phenolic Content
2.4. Total Flavonoid Content
2.5. Antioxidant Activity of the Extracts
2.6. HPLC Analyses
2.7. In Vitro Studies on NCTC2544 Cells
2.8. Preparation of Proposed Face Creams
2.9. Microrheological Evaluation of Empty and Citrus and Olive Leaf Extracts-Loaded Face Creams Using Diffusing Wave Spectroscopy (DWS)
2.10. Dynamic Rheological Characterization of Empty and Citrus and Olive Leaf Extracts-Loaded Face Creams Using Kinexus Rotational Rheometer
2.11. Stability Studies
2.12. Microscopy Studies
2.13. In Vivo Studies on Healthy Human Volunteers
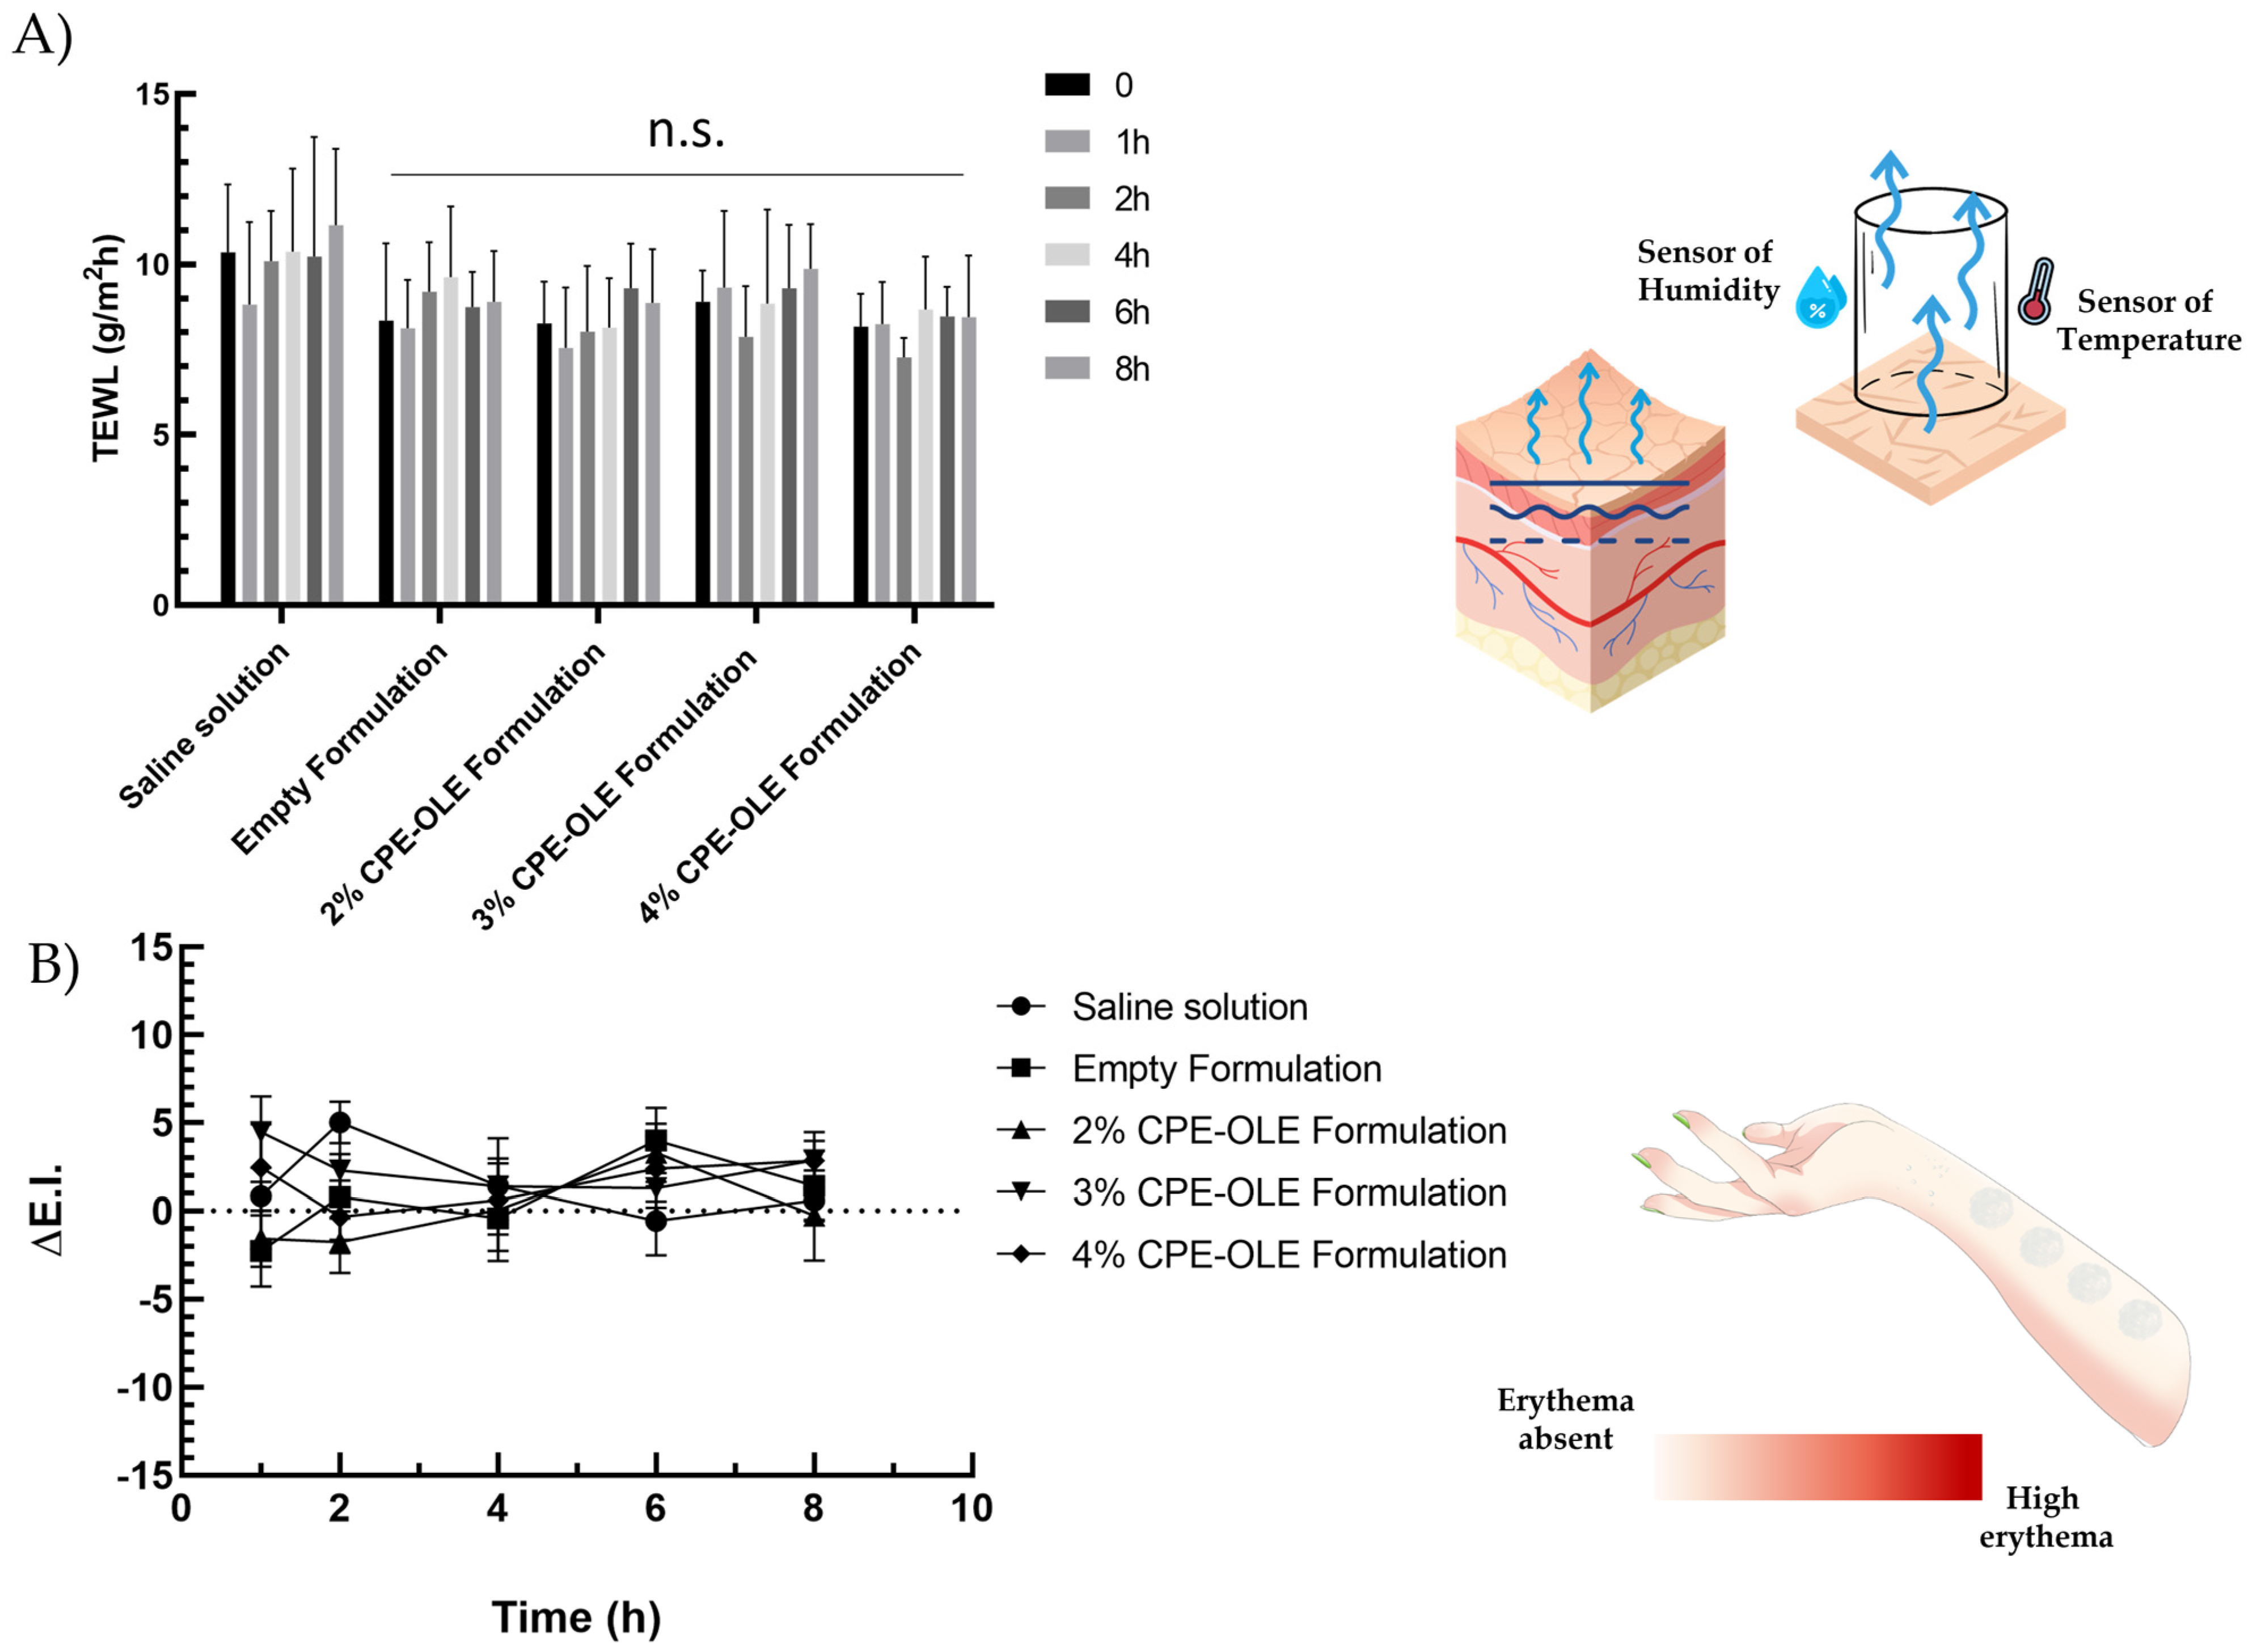
2.13.1. Transepidermal Water Loss (TEWL)
2.13.2. X-Rite
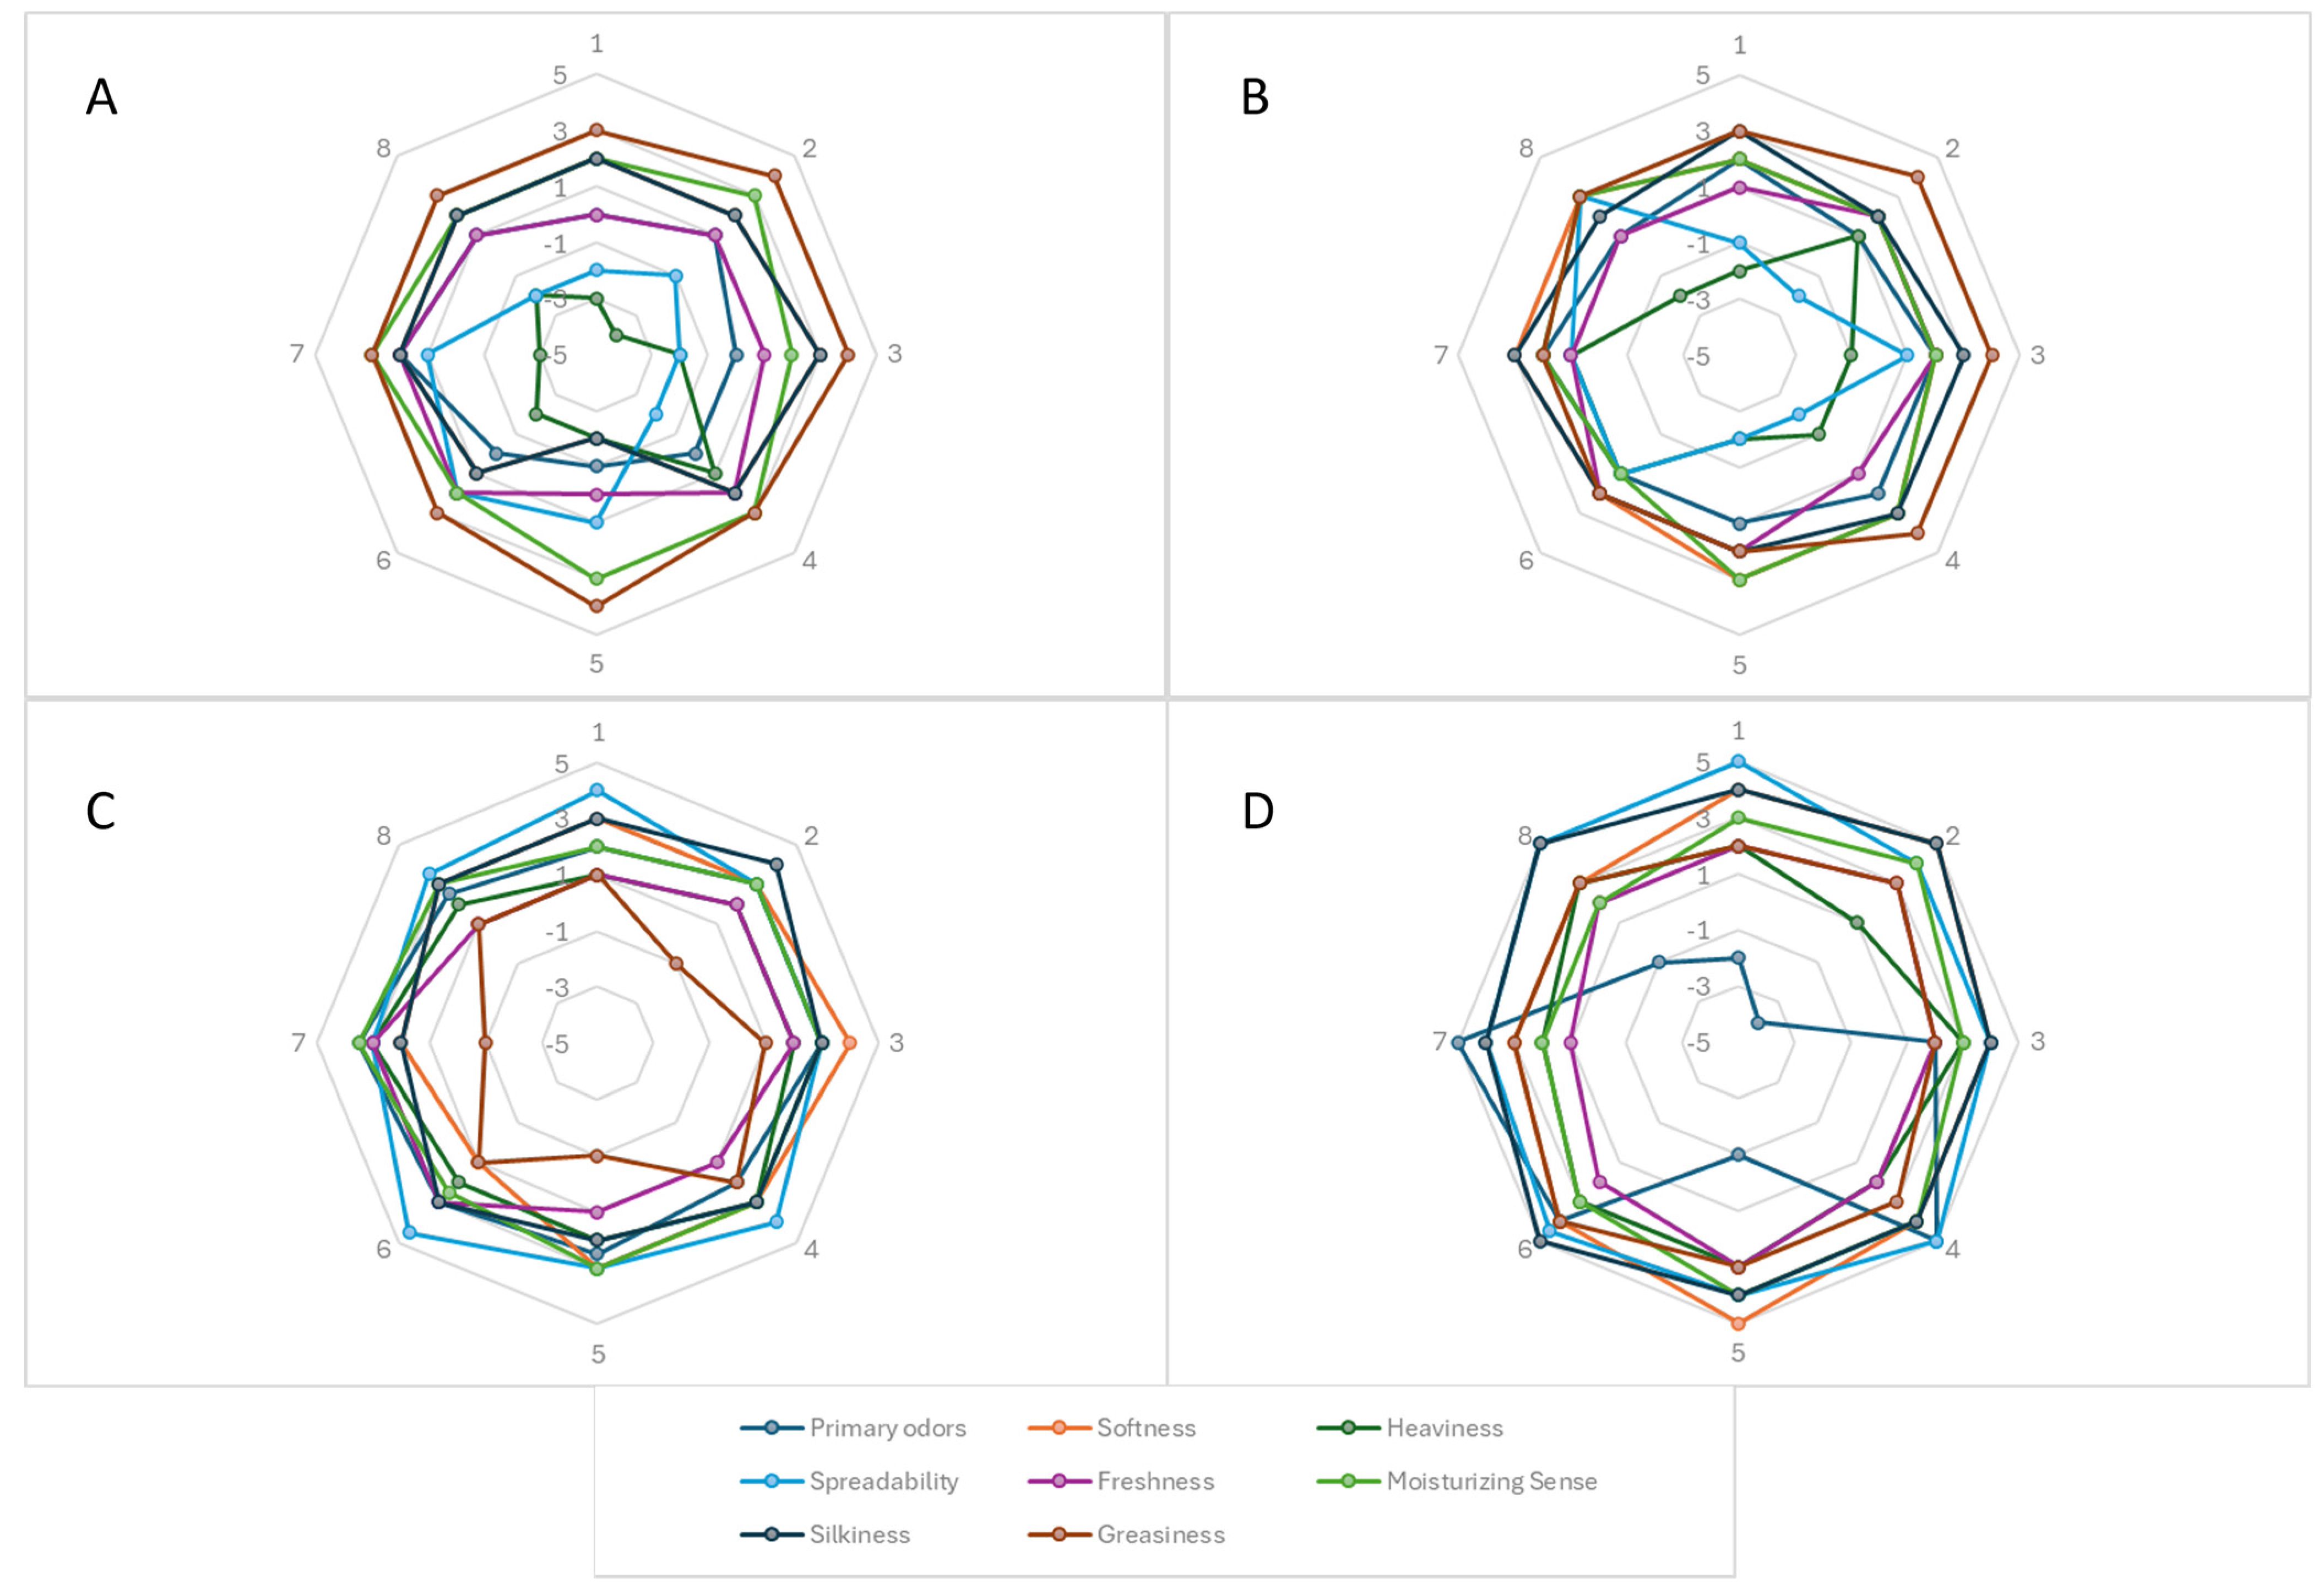
2.14. Skin Feeling
2.15. Statistical Analysis
3. Result and Discussion
3.1. Characterization of the Extracts
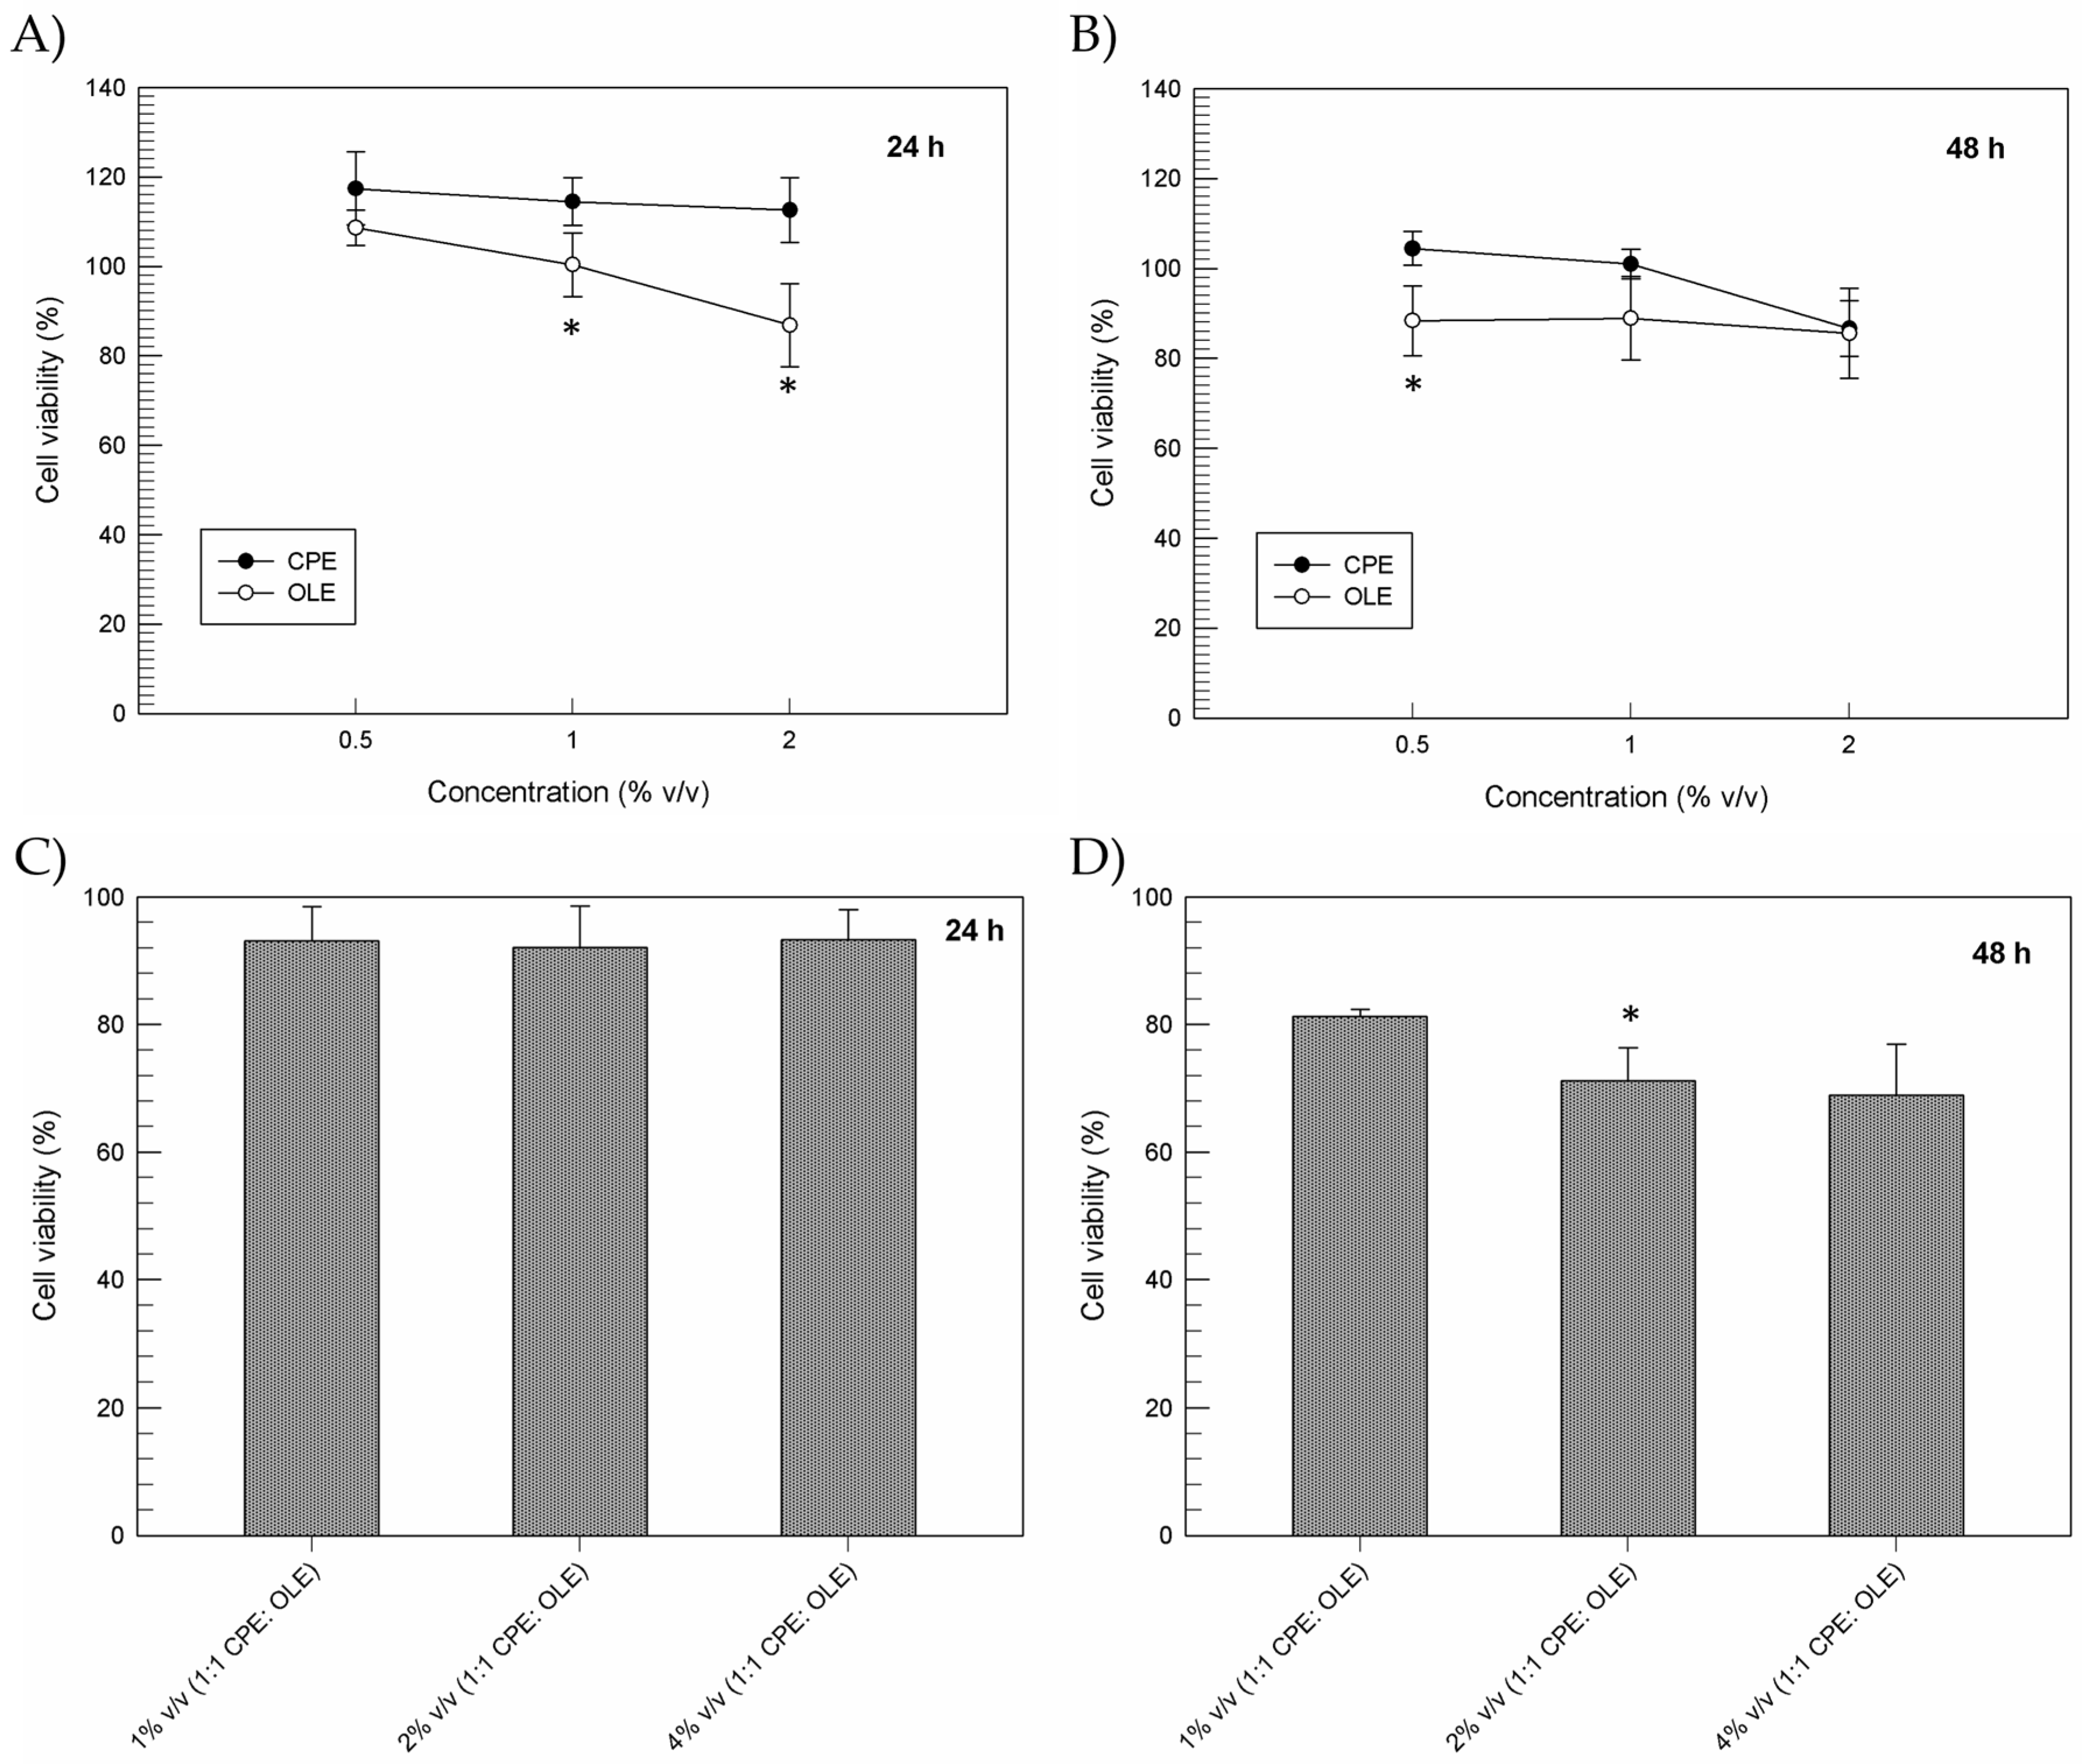
3.2. In Vitro Cytotoxic Effects
3.3. In-Depth Characterization of Empty and Citrus and Olive Leaf Extracts-Loaded Face Creams
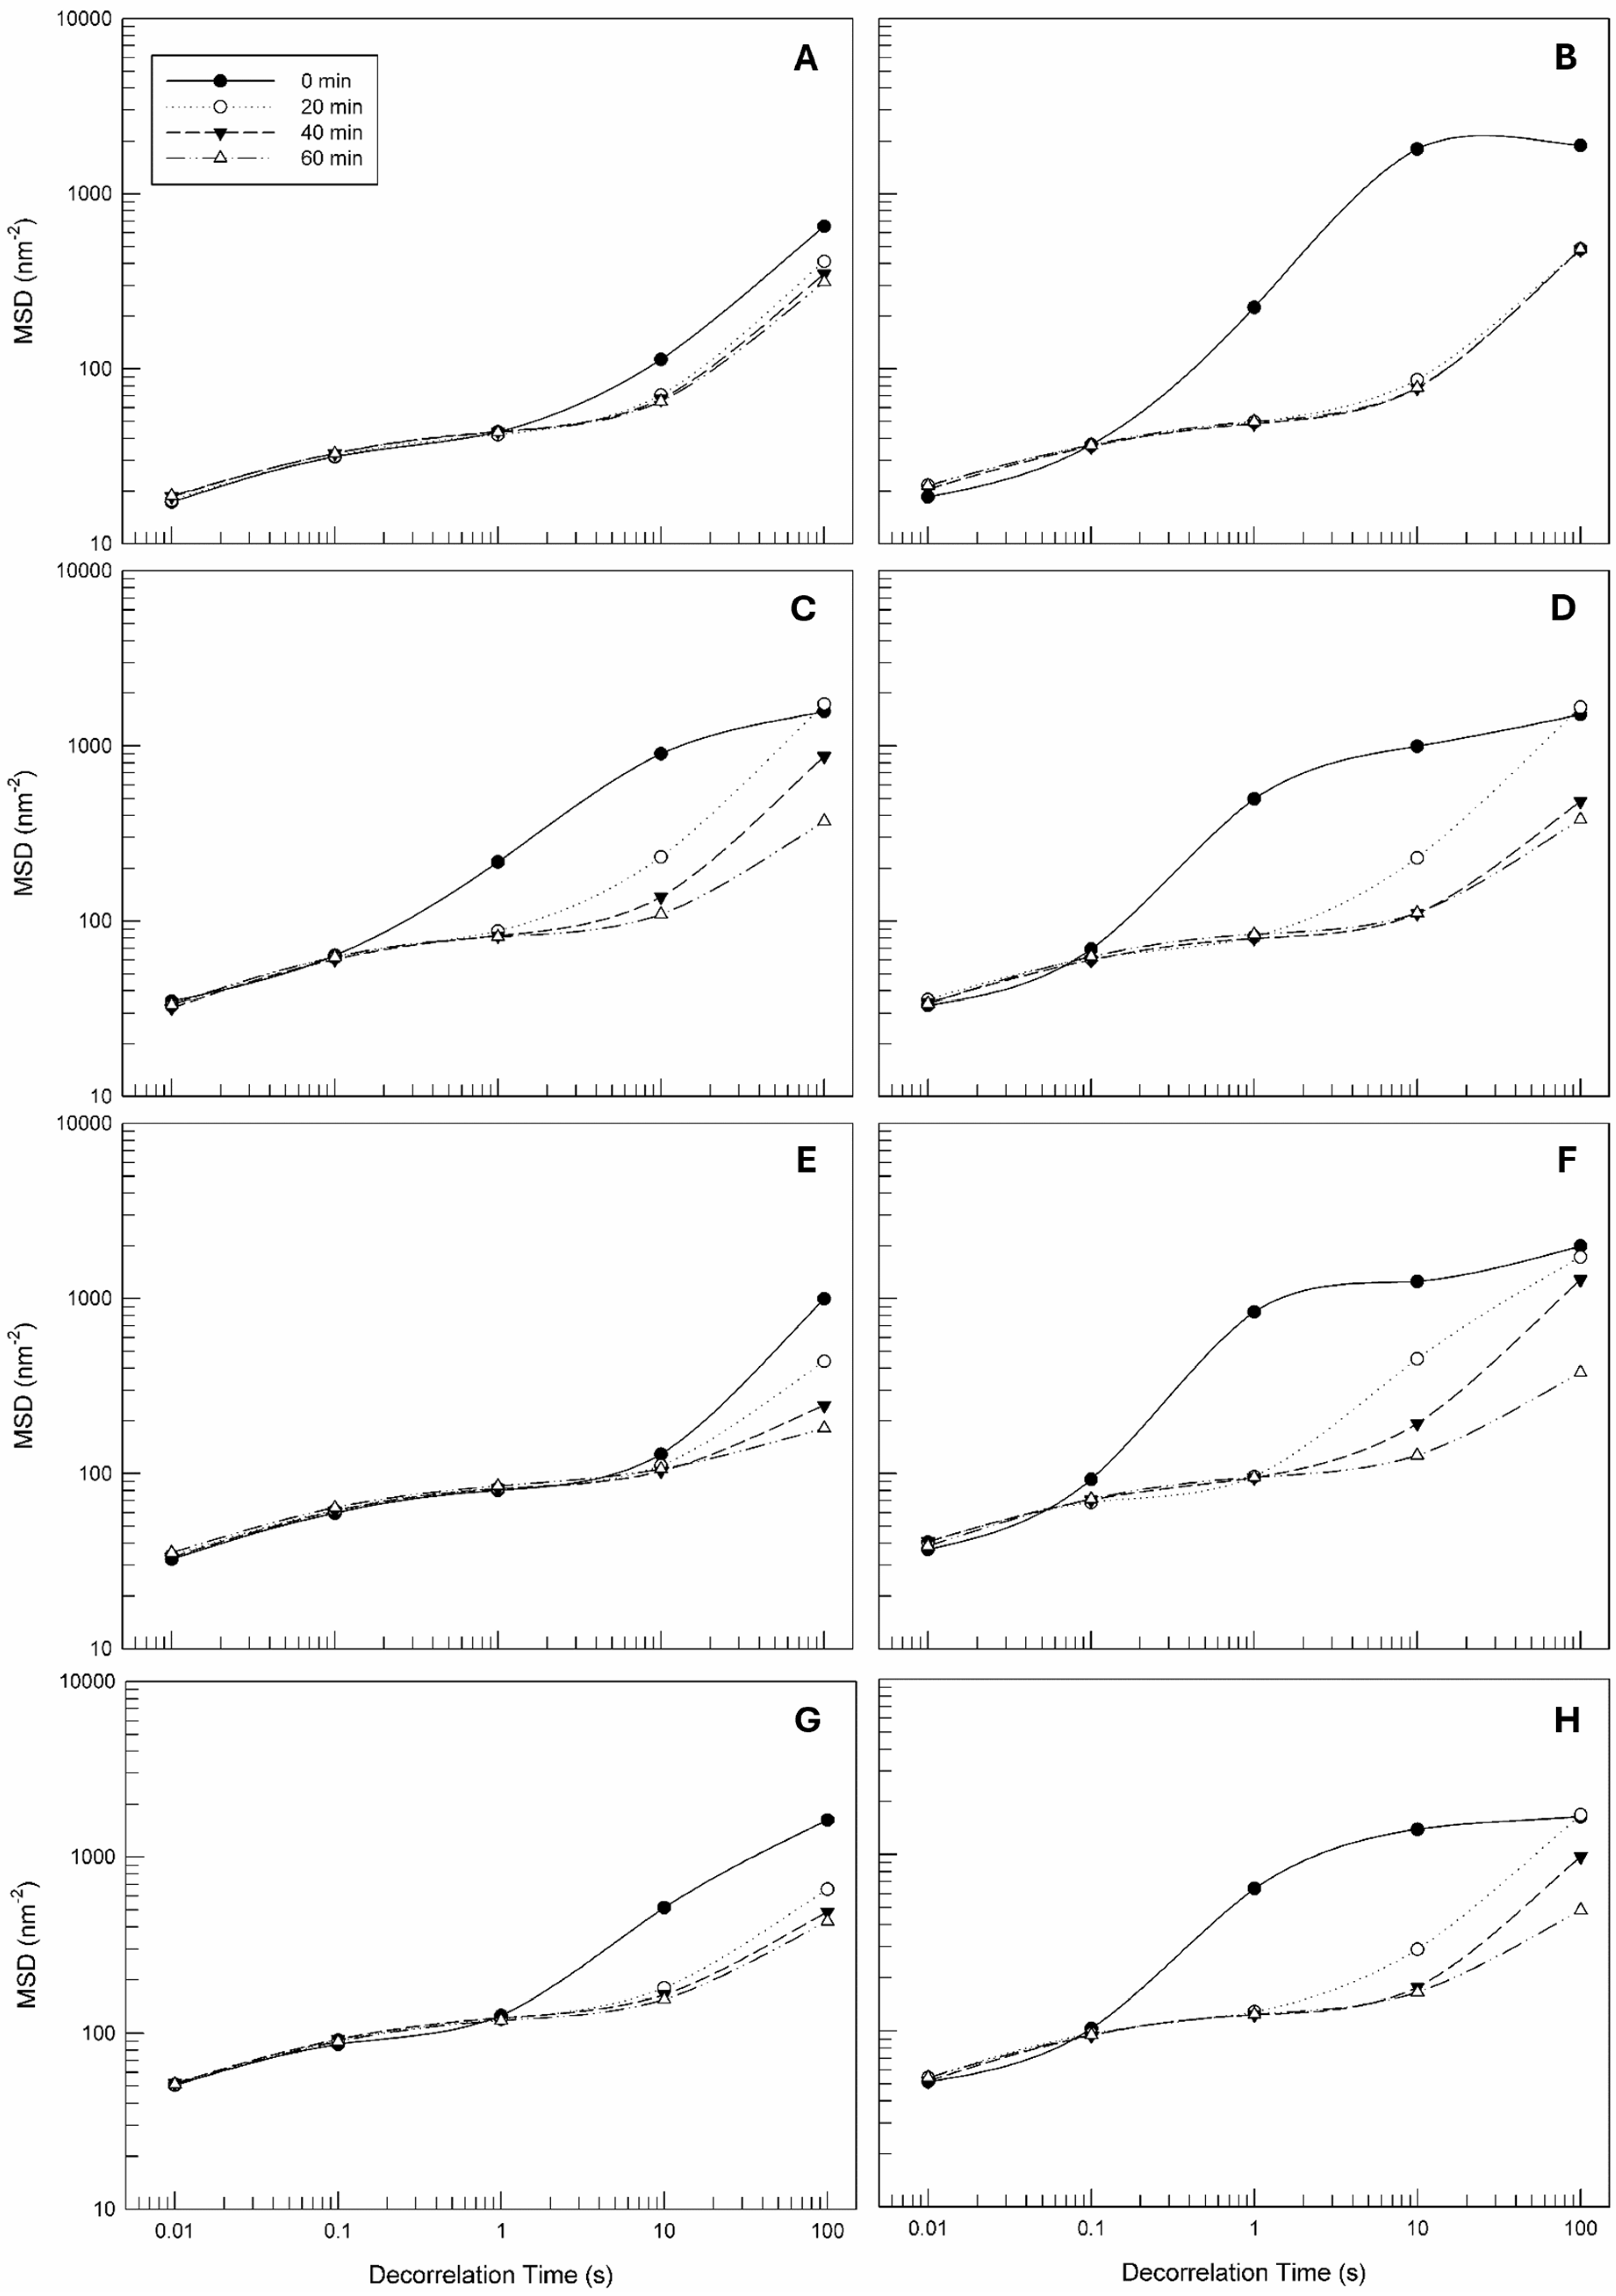
3.3.1. Microrheological Investigation of Empty and Clementine Peels and Olive Leaf Extracts-Loaded Face Creams
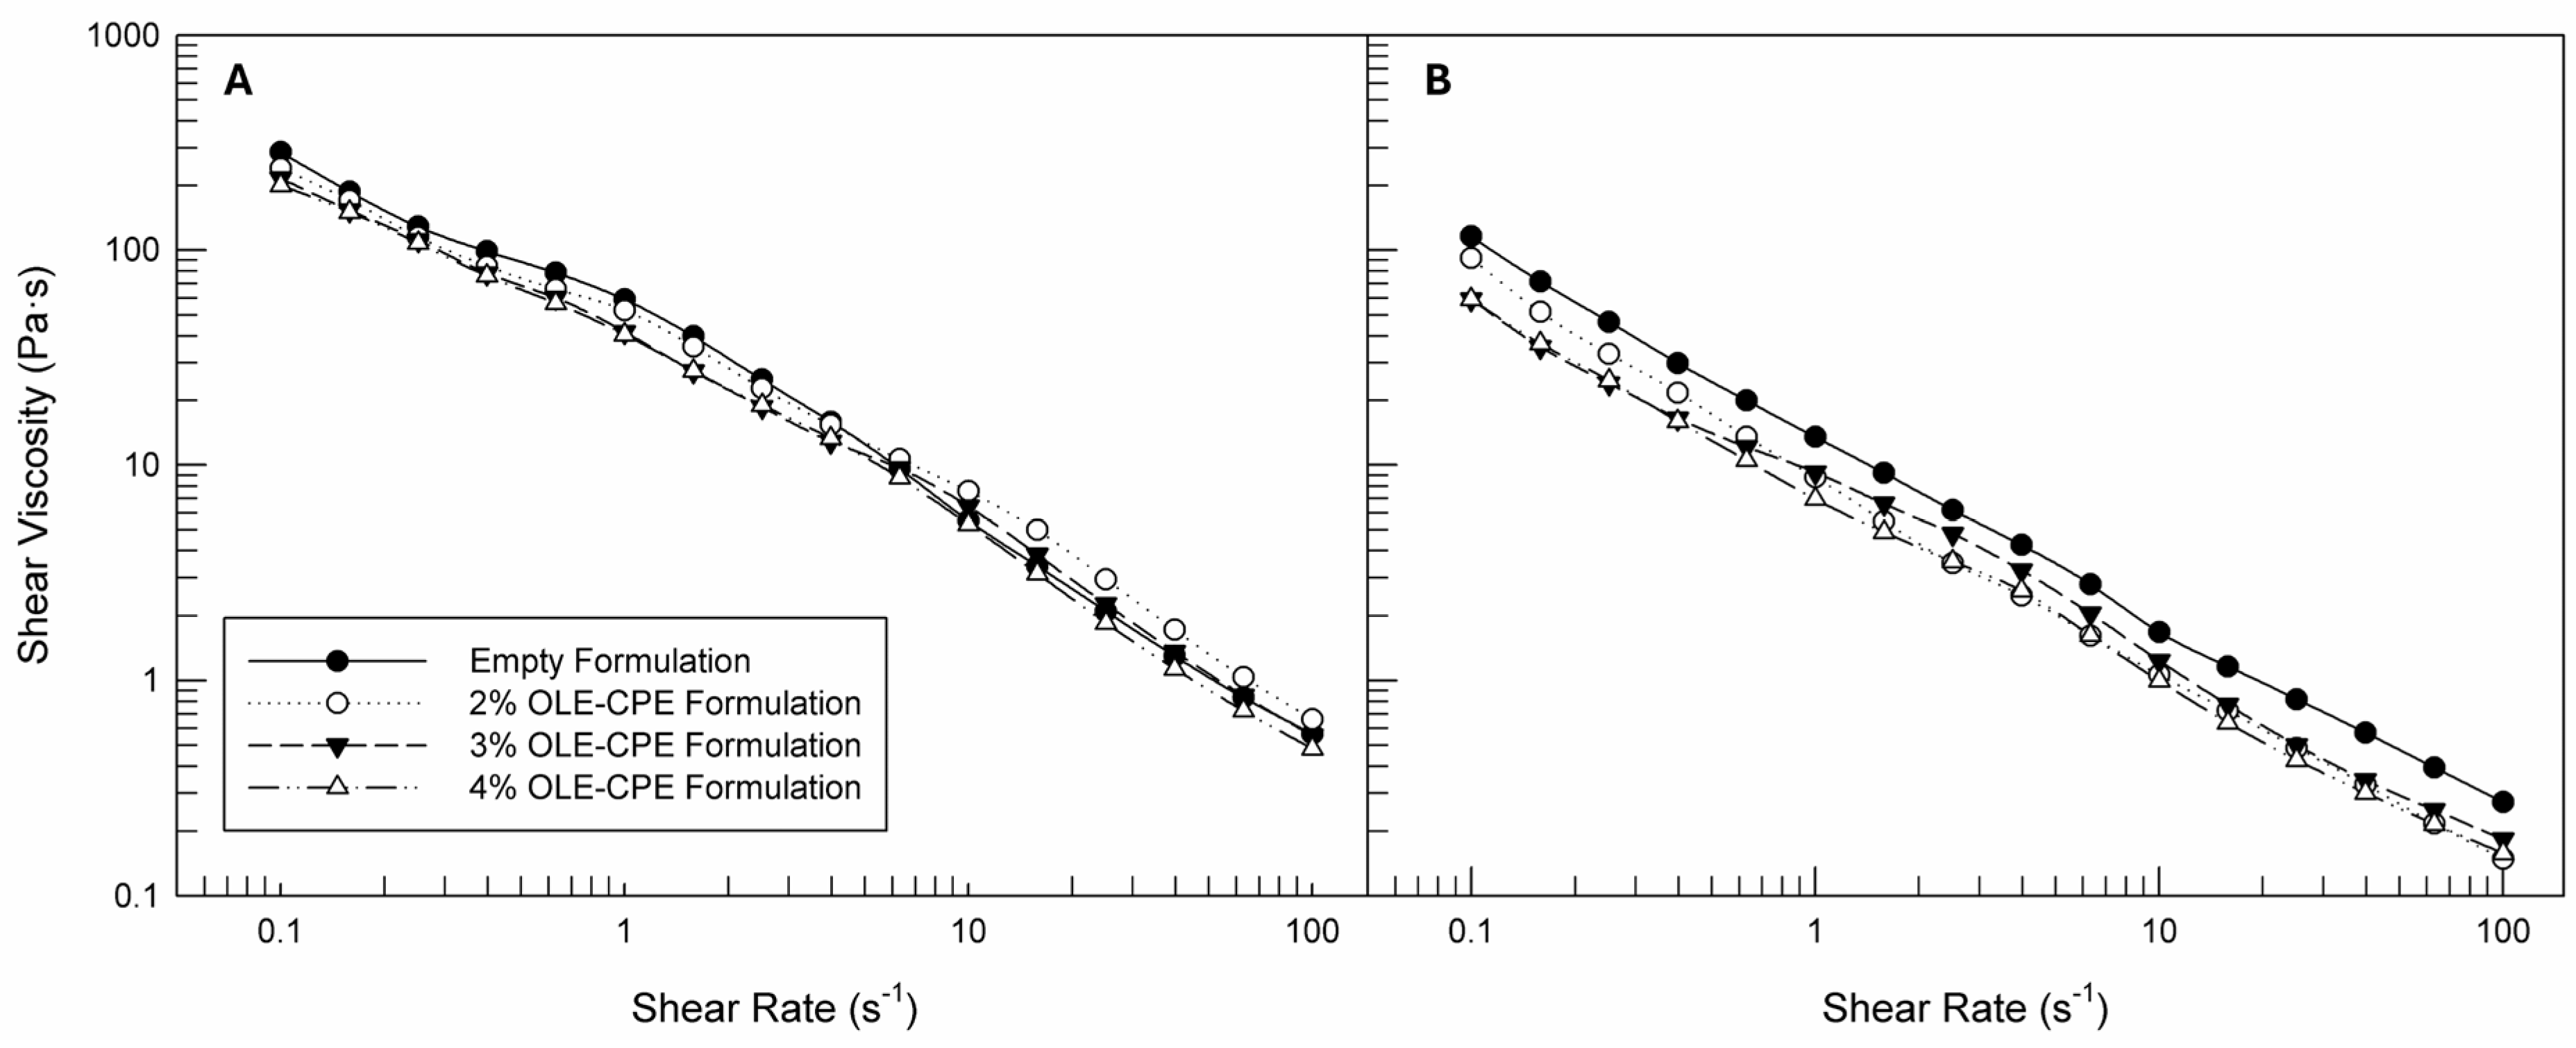
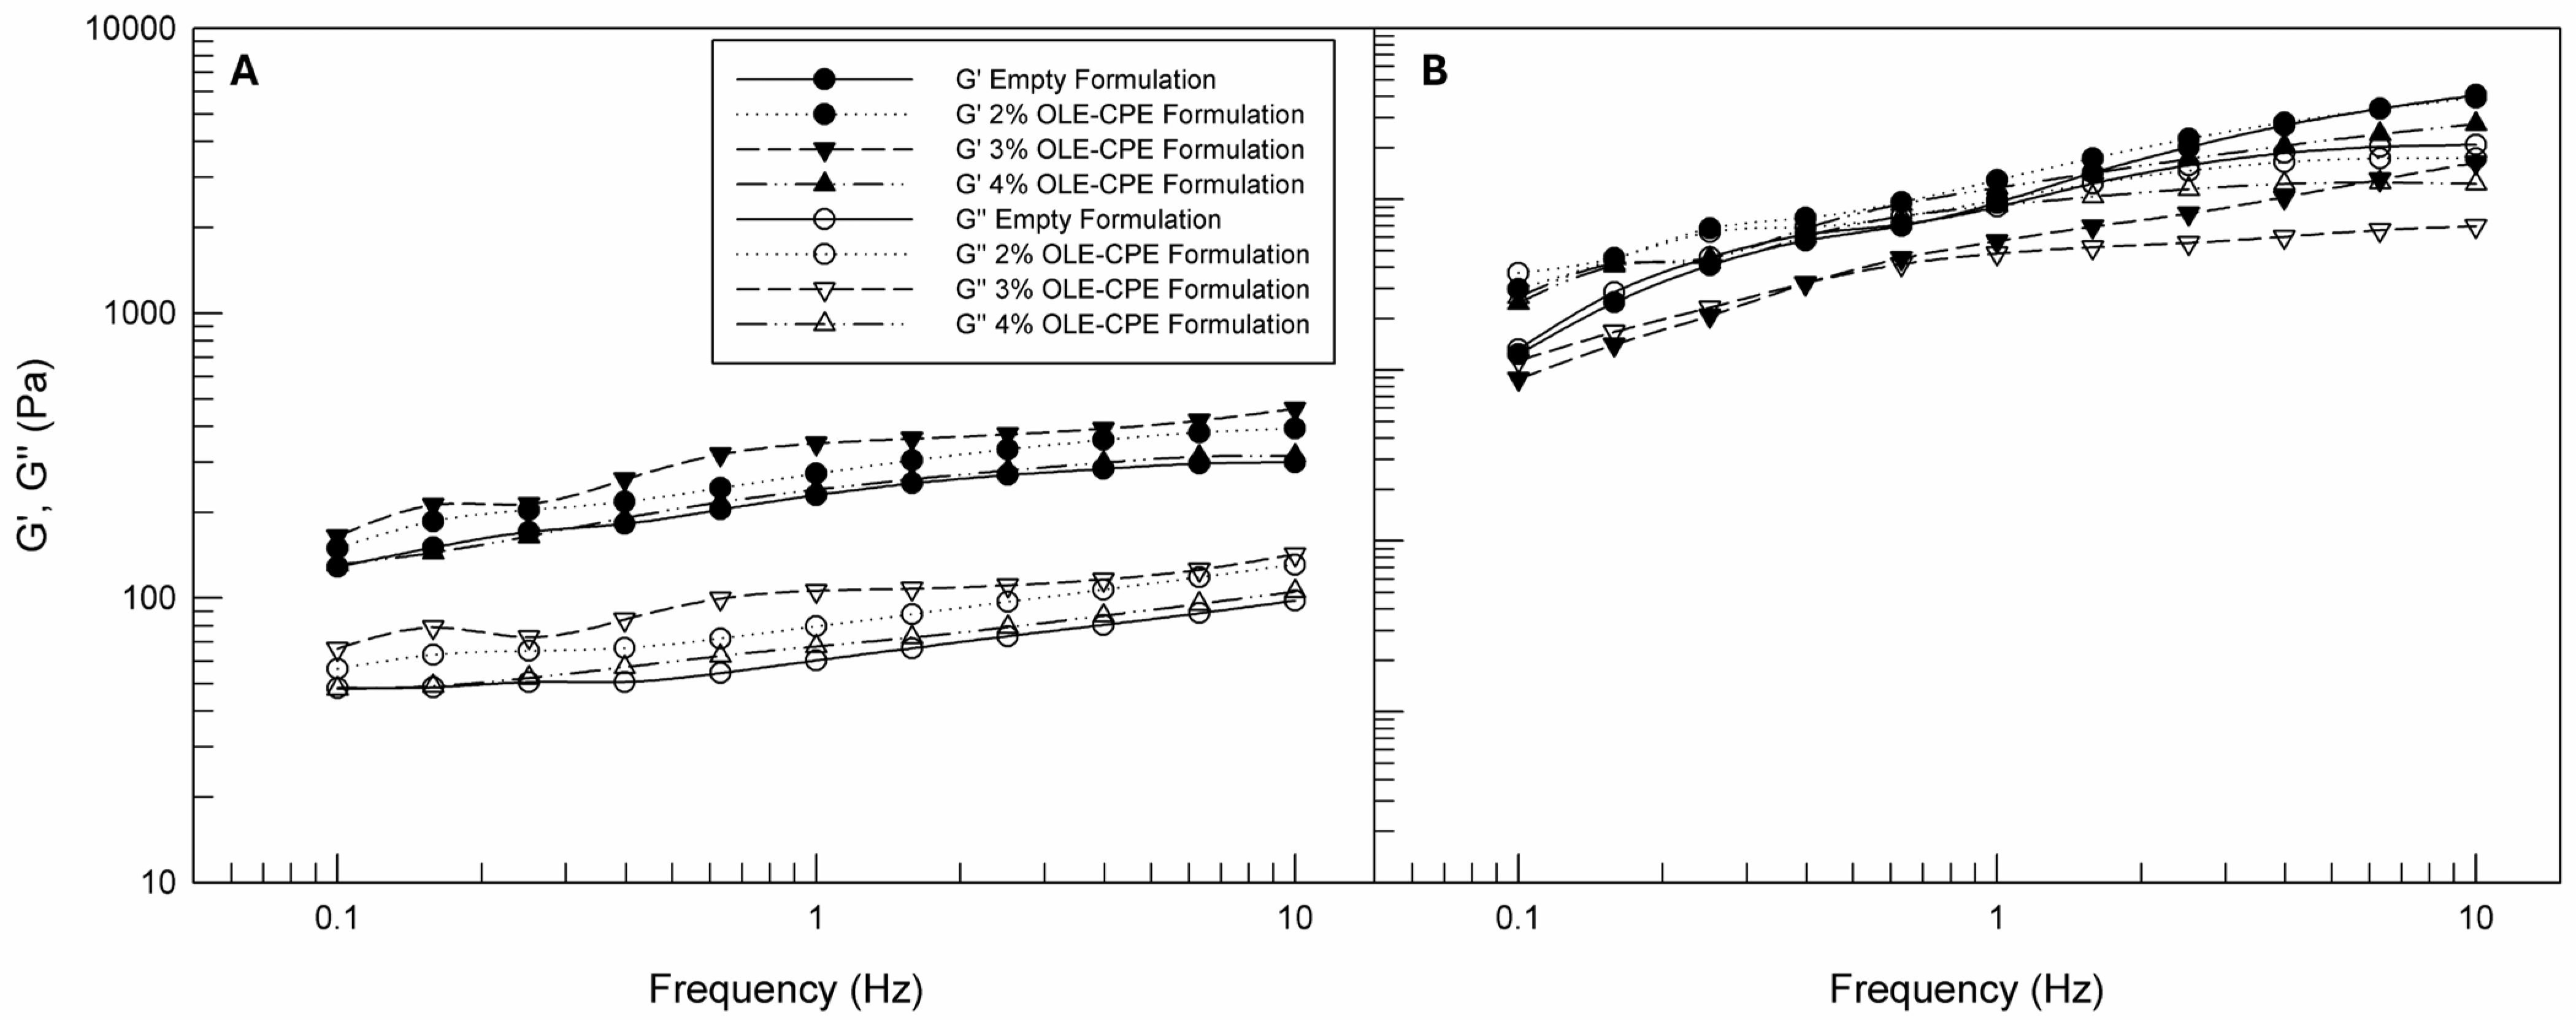
3.3.2. Dynamic Rheological Characterization of Empty and Citrus and Olive Leaf Extracts-Loaded Face Creams
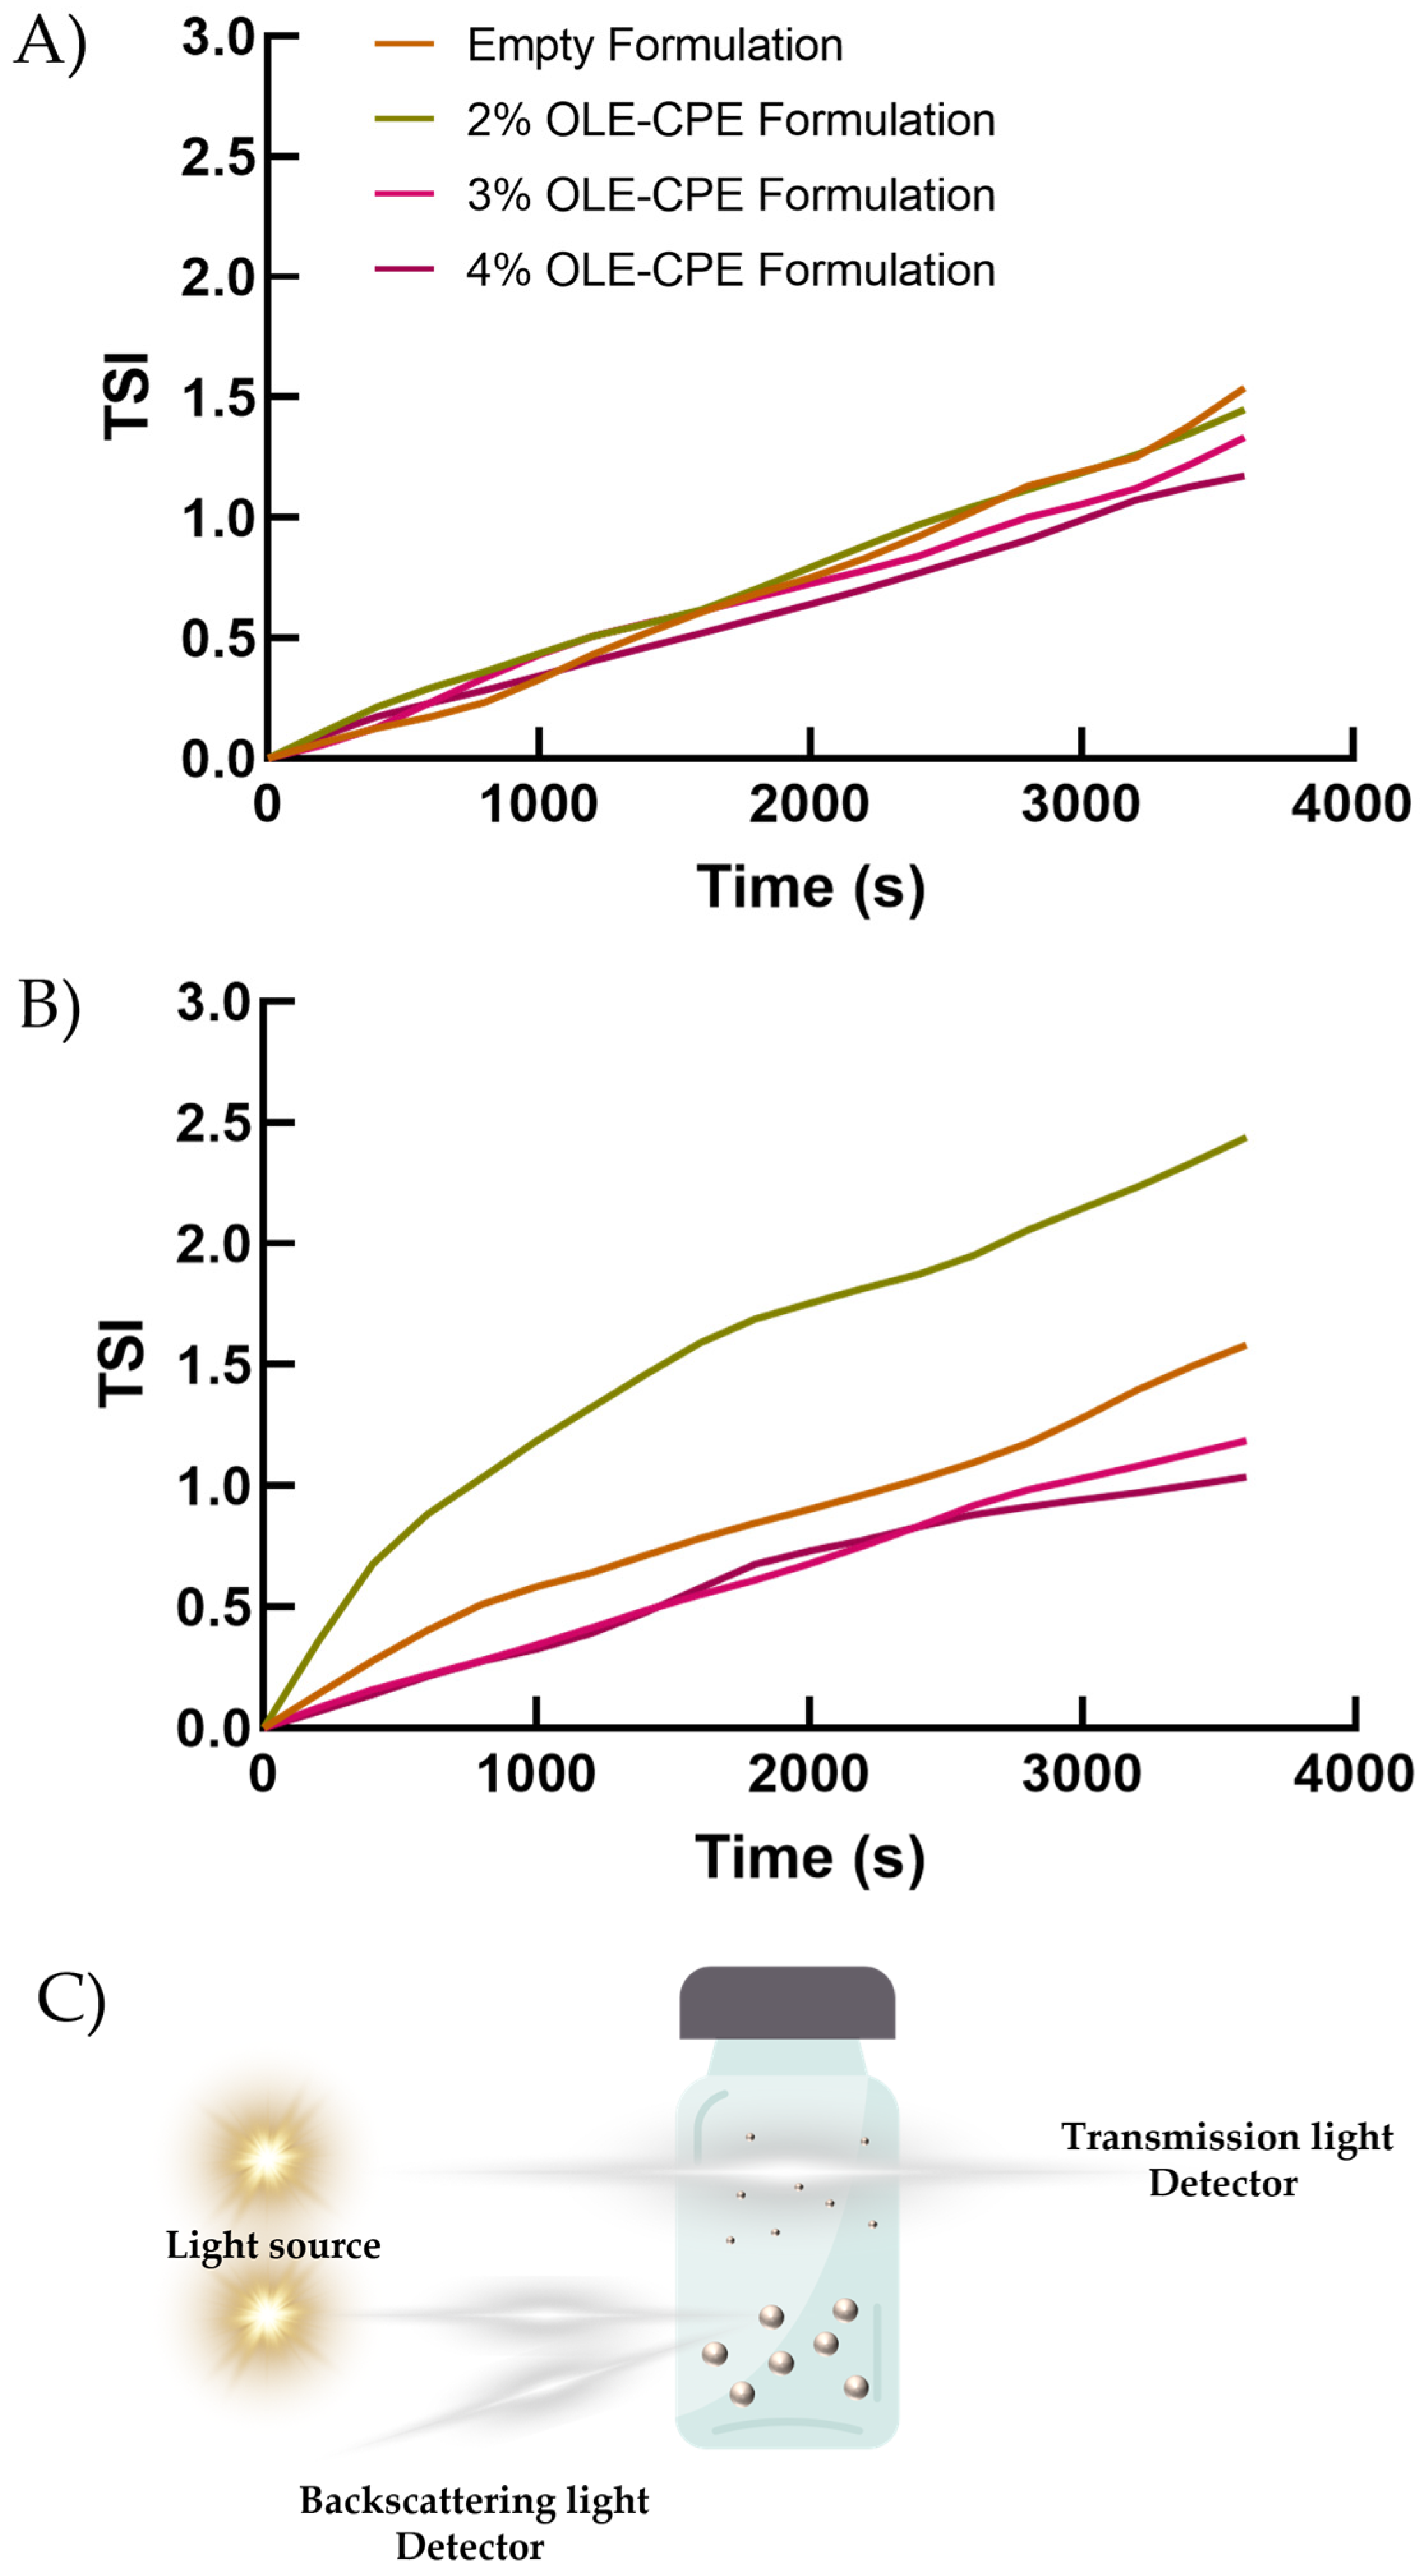
3.4. Stability Studies on Emulsions
3.5. In Vivo Evaluation of Cutaneous Tolerability and Feelings Induced by Emulsions
4. Conclusions
Supplementary Materials
Author Contributions
Funding
Institutional Review Board Statement
Informed Consent Statement
Data Availability Statement
Acknowledgments
Conflicts of Interest
References
- Huang, C.-H.; Liu, S.-M.; Hsu, N.-Y. Understanding global food surplus and food waste to tackle economic and environmental sustainability. Sustainability 2020, 12, 2892. [Google Scholar] [CrossRef]
- Lin, T.-Y.; Chiu, S.-Y.; Chiu, Y.-H.; Lu, L.-C.; Huang, K.-Y. Agricultural production efficiency, food consumption, and food waste in the European countries. Environ. Dev. Sustain. 2023, 1–22. [Google Scholar] [CrossRef]
- Mishra, B.; Mohanta, Y.K.; Reddy, C.N.; Reddy, S.D.M.; Mandal, S.K.; Yadavalli, R.; Sarma, H. Valorization of agro-industrial biowaste to biomaterials: An innovative circular bioeconomy approach. Circ. Econ. 2023, 2, 100050. [Google Scholar] [CrossRef]
- Nath, P.C.; Sharma, R.; Debnath, S.; Nayak, P.K.; Roy, R.; Sharma, M.; Inbaraj, B.S.; Sridhar, K. Recent advances in production of sustainable and biodegradable polymers from agro-food waste: Applications in tissue engineering and regenerative medicines. Int. J. Biol. Macromol. 2024, 259, 129129. [Google Scholar] [CrossRef]
- Chakrapani, G.; Zare, M.; Ramakrishna, S. Biomaterials from the value-added food wastes. Bioresour. Technol. Rep. 2022, 19, 101181. [Google Scholar] [CrossRef]
- Morganti, P.; Gao, X.; Vukovic, N.; Gagliardini, A.; Lohani, A.; Morganti, G. Food loss and food waste for green cosmetics and medical devices for a cleaner planet. Cosmetics 2022, 9, 19. [Google Scholar] [CrossRef]
- Mondello, A.; Salomone, R.; Mondello, G. Exploring circular economy in the cosmetic industry: Insights from a literature review. Environ. Impact Assess. Rev. 2024, 105, 107443. [Google Scholar] [CrossRef]
- Da Silva, A.C.; Paiva, J.P.; Diniz, R.R.; Dos Anjos, V.M.; Silva, A.B.S.; Pinto, A.V.; Dos Santos, E.P.; Leitão, A.C.; Cabral, L.M.; Rodrigues, C.R. Photoprotection assessment of olive (Olea europaea L.) leaves extract standardized to oleuropein: In vitro and in silico approach for improved sunscreens. J. Photochem. Photobiol. B Biol. 2019, 193, 162–171. [Google Scholar] [CrossRef]
- Gómez-Mejía, E.; Rosales-Conrado, N.; León-González, M.E.; Madrid, Y. Citrus peels waste as a source of value-added compounds: Extraction and quantification of bioactive polyphenols. Food Chem. 2019, 295, 289–299. [Google Scholar] [CrossRef]
- Oliveira, A.L.; Gondim, S.; Gómez-García, R.; Ribeiro, T.; Pintado, M. Olive leaf phenolic extract from two Portuguese cultivars–bioactivities for potential food and cosmetic application. J. Environ. Chem. Eng. 2021, 9, 106175. [Google Scholar] [CrossRef]
- Leporini, M.; Loizzo, M.R.; Sicari, V.; Pellicanò, T.M.; Reitano, A.; Dugay, A.; Deguin, B.; Tundis, R. Citrus× clementina Hort. juice enriched with its by-products (peels and leaves): Chemical composition, in vitro bioactivity, and impact of processing. Antioxidants 2020, 9, 298. [Google Scholar] [CrossRef]
- Prevete, G.; Carvalho, L.G.; del Carmen Razola-Diaz, M.; Verardo, V.; Mancini, G.; Fiore, A.; Mazzonna, M. Ultrasound assisted extraction and liposome encapsulation of olive leaves and orange peels: How to transform biomass waste into valuable resources with antimicrobial activity. Ultrason. Sonochem. 2024, 102, 106765. [Google Scholar] [CrossRef]
- Quispe-Fuentes, I.; Uribe, E.; López, J.; Contreras, D.; Poblete, J. A study of dried mandarin (Clementina orogrande) peel applying supercritical carbon dioxide using co-solvent: Influence on oil extraction, phenolic compounds, and antioxidant activity. J. Food Process. Preserv. 2022, 46, e16116. [Google Scholar] [CrossRef]
- Romero-Márquez, J.M.; Navarro-Hortal, M.D.; Forbes-Hernández, T.Y.; Varela-López, A.; Puentes, J.G.; Pino-García, R.D.; Sánchez-González, C.; Elio, I.; Battino, M.; García, R. Exploring the antioxidant, neuroprotective, and anti-inflammatory potential of olive leaf extracts from Spain, Portugal, Greece, and Italy. Antioxidants 2023, 12, 1538. [Google Scholar] [CrossRef]
- Wanitphakdeedecha, R.; Ng, J.N.C.; Junsuwan, N.; Phaitoonwattanakij, S.; Phothong, W.; Eimpunth, S.; Manuskiatti, W. Efficacy of olive leaf extract–containing cream for facial rejuvenation: A pilot study. J. Cosmet. Dermatol. 2020, 19, 1662–1666. [Google Scholar] [CrossRef]
- Qabaha, K.; Al-Rimawi, F.; Qasem, A.; Naser, S.A. Oleuropein is responsible for the major anti-inflammatory effects of olive leaf extract. J. Med. Food 2018, 21, 302–305. [Google Scholar] [CrossRef]
- Zillich, O.; Schweiggert-Weisz, U.; Eisner, P.; Kerscher, M. Polyphenols as active ingredients for cosmetic products. Int. J. Cosmet. Sci. 2015, 37, 455–464. [Google Scholar] [CrossRef]
- Rodrigues, C.V.; Pintado, M. Hesperidin from Orange Peel as a Promising Skincare Bioactive: An Overview. Int. J. Mol. Sci. 2024, 25, 1890. [Google Scholar] [CrossRef]
- Kiefer, S.; Weibel, M.; Smits, J.; Juch, M.; Tiedke, J.; Herbst, N. Citrus flavonoids with skin lightening effects–Safety and efficacy studies. Int. J. Appl. Sci. 2010, 132, 46–54. [Google Scholar]
- Boo, Y.C. Human skin lightening efficacy of resveratrol and its analogs: From in vitro studies to cosmetic applications. Antioxidants 2019, 8, 332. [Google Scholar] [CrossRef]
- Chowdhury, A.; Nosoudi, N.; Karamched, S.; Parasaram, V.; Vyavahare, N. Polyphenol treatments increase elastin and collagen deposition by human dermal fibroblasts; Implications to improve skin health. J. Dermatol. Sci. 2021, 102, 94–100. [Google Scholar] [CrossRef]
- Casquete, R.; Castro, S.M.; Martín, A.; Ruiz-Moyano, S.; Saraiva, J.A.; Córdoba, M.G.; Teixeira, P. Evaluation of the effect of high pressure on total phenolic content, antioxidant and antimicrobial activity of citrus peels. Innov. Food Sci. Emerg. Technol. 2015, 31, 37–44. [Google Scholar] [CrossRef]
- Weng, Y.X.; Wang, H.C.; Chu, Y.L.; Wu, Y.Z.; Liao, J.A.; Su, Z.Y. Essential oil from Citrus depressa peel exhibits antimicrobial, antioxidant and cancer chemopreventive effects. J. Sci. Food Agric. 2024. ahead of print. [Google Scholar] [CrossRef]
- Costanzo, G.; Iesce, M.R.; Naviglio, D.; Ciaravolo, M.; Vitale, E.; Arena, C. Comparative studies on different citrus cultivars: A revaluation of waste mandarin components. Antioxidants 2020, 9, 517. [Google Scholar] [CrossRef]
- Berbel, J.; Posadillo, A. Review and analysis of alternatives for the valorisation of agro-industrial olive oil by-products. Sustainability 2018, 10, 237. [Google Scholar] [CrossRef]
- Viuda-Martos, M.; Ruiz-Navajas, Y.; Fernández-López, J.; Pérez-Álvarez, J. Effect of adding citrus waste water, thyme and oregano essential oil on the chemical, physical and sensory characteristics of a bologna sausage. Innov. Food Sci. Emerg. Technol. 2009, 10, 655–660. [Google Scholar] [CrossRef]
- Khaw, K.-Y.; Parat, M.-O.; Shaw, P.N.; Falconer, J.R. Solvent supercritical fluid technologies to extract bioactive compounds from natural sources: A review. Molecules 2017, 22, 1186. [Google Scholar] [CrossRef]
- Abou Elmaaty, T.; Sayed-Ahmed, K.; Magdi, M.; Elsisi, H. An eco-friendly method of extracting alizarin from Rubia tinctorum roots under supercritical carbon dioxide and its application to wool dyeing. Sci. Rep. 2023, 13, 30. [Google Scholar] [CrossRef]
- Radzali, S.A.; Markom, M.; Saleh, N.M. Co-solvent selection for supercritical fluid extraction (SFE) of phenolic compounds from Labisia pumila. Molecules 2020, 25, 5859. [Google Scholar] [CrossRef]
- Mare, R.; Pujia, R.; Maurotti, S.; Greco, S.; Cardamone, A.; Coppoletta, A.R.; Bonacci, S.; Procopio, A.; Pujia, A. Assessment of Mediterranean Citrus Peel Flavonoids and Their Antioxidant Capacity Using an Innovative UV-Vis Spectrophotometric Approach. Plants 2023, 12, 4046. [Google Scholar] [CrossRef]
- Mare, R.; Maurotti, S.; Ferro, Y.; Galluccio, A.; Arturi, F.; Romeo, S.; Procopio, A.; Musolino, V.; Mollace, V.; Montalcini, T. A rapid and cheap method for extracting and quantifying lycopene content in tomato sauces: Effects of lycopene micellar delivery on human osteoblast-like cells. Nutrients 2022, 14, 717. [Google Scholar] [CrossRef]
- Cristiano, M.C.; Barone, A.; Mancuso, A.; Torella, D.; Paolino, D. Rutin-loaded nanovesicles for improved stability and enhanced topical efficacy of natural compound. J. Funct. Biomater. 2021, 12, 74. [Google Scholar] [CrossRef]
- Mancuso, A.; Tarsitano, M.; Udongo, B.P.; Cristiano, M.C.; Torella, D.; Paolino, D.; Fresta, M. A comparison between silicone-free and silicone-based emulsions: Technological features and in vivo evaluation. Int. J. Cosmet. Sci. 2022, 44, 514–529. [Google Scholar] [CrossRef]
- Luan, J.; Zhang, Z.; Shen, W.; Chen, Y.; Yang, X.; Chen, X.; Yu, L.; Sun, J.; Ding, J. Thermogel loaded with low-dose paclitaxel as a facile coating to alleviate periprosthetic fibrous capsule formation. ACS Appl. Mater. Interfaces 2018, 10, 30235–30246. [Google Scholar] [CrossRef]
- Xu, B.; Kang, W.; Wang, X.; Meng, L. Influence of water content and temperature on stability of W/O crude oil emulsion. Pet. Sci. Technol. 2013, 31, 1099–1108. [Google Scholar] [CrossRef]
- Luo, M.; Qi, X.; Ren, T.; Huang, Y.; Keller, A.A.; Wang, H.; Wu, B.; Jin, H.; Li, F. Heteroaggregation of CeO2 and TiO2 engineered nanoparticles in the aqueous phase: Application of turbiscan stability index and fluorescence excitation-emission matrix (EEM) spectra. Colloids Surf. A Physicochem. Eng. Asp. 2017, 533, 9–19. [Google Scholar] [CrossRef]
- Gardien, K.L.; Baas, D.C.; de Vet, H.C.; Middelkoop, E. Transepidermal water loss measured with the Tewameter TM300 in burn scars. Burns 2016, 42, 1455–1462. [Google Scholar] [CrossRef]
- Matts, P.; Dykes, P.; Marks, R. The distribution of melanin in skin determined in vivo. Br. J. Dermatol. 2007, 156, 620–628. [Google Scholar] [CrossRef]
- Moravkova, T.; Stern, P. Rheological and textural properties of cosmetic emulsions. Appl. Rheol. 2011, 21, 35200. [Google Scholar]
- Bekker, M.; Webber, G.; Louw, N. Relating rheological measurements to primary and secondary skin feeling when mineral-based and Fischer–Tropsch wax-based cosmetic emulsions and jellies are applied to the skin. Int. J. Cosmet. Sci. 2013, 35, 354–361. [Google Scholar] [CrossRef]
- Mendoza-Wilson, A.M.; Glossman-Mitnik, D. Theoretical study of the molecular properties and chemical reactivity of (+)-catechin and (−)-epicatechin related to their antioxidant ability. J. Mol. Struct. THEOCHEM 2006, 761, 97–106. [Google Scholar] [CrossRef]
- Parcheta, M.; Świsłocka, R.; Orzechowska, S.; Akimowicz, M.; Choińska, R.; Lewandowski, W. Recent developments in effective antioxidants: The structure and antioxidant properties. Materials 2021, 14, 1984. [Google Scholar] [CrossRef]
- Castillo, J.J.; Alcaraz, M.; Benavente-García, O. Antioxidant and radioprotective effects of olive leaf extract. In Olives and Olive Oil in Health and Disease Prevention; Elsevier: Amsterdam, The Netherlands, 2010; pp. 951–958. [Google Scholar]
- Al Foraih, M.; Hyatt, S.L.; Naumovski, N.; Alasmari, H.A. Seasonal Variations in Dietary Flavonoid Content of Edible Plants. J. High Inst. Public Health 2023, 53, 38–45. [Google Scholar] [CrossRef]
- Williams, C.A.; Richardson, J.; Greenham, J.; Eagles, J. Correlations between leaf flavonoids, taxonomy and plant geography in the genus Disporum. Phytochemistry 1993, 34, 197–203. [Google Scholar] [CrossRef]
- López-García, J.; Lehocký, M.; Humpolíček, P.; Sáha, P. HaCaT keratinocytes response on antimicrobial atelocollagen substrates: Extent of cytotoxicity, cell viability and proliferation. J. Funct. Biomater. 2014, 5, 43–57. [Google Scholar] [CrossRef] [PubMed]
- Chung, J.H.; Han, J.H.; Hwang, E.J.; Seo, J.Y.; Cho, K.H.; Kim, K.H.; Youn, J.I.; Eun, H.C. Dual mechanisms of green tea extract-induced cell survival in human epidermal keratinocytes. FASEB J. 2003, 17, 1–21. [Google Scholar] [CrossRef] [PubMed]
- Gunes, S.; Tamburaci, S.; Dalay, M.C.; Deliloglu Gurhan, I. In vitro evaluation of Spirulina platensis extract incorporated skin cream with its wound healing and antioxidant activities. Pharm. Biol. 2017, 55, 1824–1832. [Google Scholar] [CrossRef] [PubMed]
- Goren, L.; Zhang, G.; Kaushik, S.; Breslin, P.A.; Du, Y.-C.N.; Foster, D.A. (−)-Oleocanthal and (−)-oleocanthal-rich olive oils induce lysosomal membrane permeabilization in cancer cells. PLoS ONE 2019, 14, e0216024. [Google Scholar] [CrossRef]
- Wang, W.; Wu, J.; Zhang, Q.; Li, X.; Zhu, X.; Wang, Q.; Cao, S.; Du, L. Mitochondria-mediated apoptosis was induced by oleuropein in H1299 cells involving activation of p38 MAP kinase. J. Cell. Biochem. 2019, 120, 5480–5494. [Google Scholar] [CrossRef]
- Costantini, F.; Di Sano, C.; Barbieri, G. The hydroxytyrosol induces the death for apoptosis of human melanoma cells. Int. J. Mol. Sci. 2020, 21, 8074. [Google Scholar] [CrossRef]
- Steinhauser, S.; Fattahi, E.; Geier, D.; Becker, T. Non-invasive rheology measurement employing diode laser imaging. Opt. Laser Technol. 2022, 152, 108112. [Google Scholar] [CrossRef]
- Zhu, Q.; Qiu, S.; Zhang, H.; Cheng, Y.; Yin, L. Physical stability, microstructure and micro-rheological properties of water-in-oil-in-water (W/O/W) emulsions stabilized by porcine gelatin. Food Chem. 2018, 253, 63–70. [Google Scholar] [CrossRef]
- Cristiano, M.C.; Froiio, F.; Mancuso, A.; De Gaetano, F.; Ventura, C.A.; Fresta, M.; Paolino, D. The Rheolaser Master™ and Kinexus rotational rheometer® to evaluate the influence of topical drug delivery systems on rheological features of topical poloxamer gel. Molecules 2020, 25, 1979. [Google Scholar] [CrossRef] [PubMed]
- Degrand, L.; Michon, C.; Bosc, V. New insights into the study of the destabilization of oil-in-water emulsions with dextran sulfate provided by the use of light scattering methods. Food Hydrocoll. 2016, 52, 848–856. [Google Scholar] [CrossRef]
- Sun, C.; Wu, T.; Liu, R.; Liang, B.; Tian, Z.; Zhang, E.; Zhang, M. Effects of superfine grinding and microparticulation on the surface hydrophobicity of whey protein concentrate and its relation to emulsions stability. Food Hydrocoll. 2015, 51, 512–518. [Google Scholar] [CrossRef]
- Estanqueiro, M.; Amaral, M.; Sousa Lobo, J. Comparison between sensory and instrumental characterization of topical formulations: Impact of thickening agents. Int. J. Cosmet. Sci. 2016, 38, 389–398. [Google Scholar] [CrossRef] [PubMed]
- Gaspar, L.; Campos, P.M. Rheological behavior and the SPF of sunscreens. Int. J. Pharm. 2003, 250, 35–44. [Google Scholar] [CrossRef] [PubMed]
- Katsaros, G.; Tsoukala, M.; Giannoglou, M.; Taoukis, P. Effect of storage on the rheological and viscoelastic properties of mayonnaise emulsions of different oil droplet size. Heliyon 2020, 6, e05788. [Google Scholar] [CrossRef]
- Calienni, M.N.; Prieto, M.J.; Couto, V.M.; de Paula, E.; de VaAlonso, S.; Montanari, J. 5-Fluorouracil-loaded ultradeformable liposomes for skin therapy. AIP Conf. Proc. 2018, 1990, 020024. [Google Scholar]
- Trujillo-Cayado, L.; Alfaro, M.; Muñoz, J. Effects of ethoxylated fatty acid alkanolamide concentration and processing on d-limonene emulsions. Colloids Surf. A Physicochem. Eng. Asp. 2018, 536, 198–203. [Google Scholar] [CrossRef]
- Klotz, T.; Ibrahim, A.; Maddern, G.; Caplash, Y.; Wagstaff, M. Devices measuring transepidermal water loss: A systematic review of measurement properties. Ski. Res. Technol. 2022, 28, 497–539. [Google Scholar] [CrossRef]
- Jeong, C.; Han, J.; Cho, J.; Suh, K.; Nam, G. Analysis of electrical property changes of skin by oil-in-water emulsion components. Int. J. Cosmet. Sci. 2013, 35, 402–410. [Google Scholar] [CrossRef] [PubMed]


| Formulation | Phase | INCI Name | Concentration % (w/w) |
|---|---|---|---|
| Empty | A | Prunus Amygdalus Dulcis (Sweet Almond) Oil | 10.5 |
| Olivoil Glutamate Emulsifier G-PF | 15 | ||
| Tocopheril Acetate | 1 | ||
| Cetyl Alcohol | 2 | ||
| B | Bergamot wastewater | 67.5 | |
| Xantan Gum | 0.2 | ||
| Glycerin | 3.6 | ||
| C | Imidazolidinyl Urea | 0.2 | |
| 2% CPE-OLE | A | Prunus Amygdalus Dulcis (Sweet Almond) Oil | 9.5 |
| Olivoil Glutamate Emulsifier G-PF | 15 | ||
| Tocopheril Acetate | 1 | ||
| Cetyl Alcohol | 2 | ||
| B | Bergamot wastewater | 66.5 | |
| Xantan Gum | 0.2 | ||
| Glycerin | 3.6 | ||
| C | Imidazolidinyl Urea | 0.2 | |
| Olive leaf extract | 0.5 | ||
| Clementine peel extract | 1.5 | ||
| 3% CPE-OLE | A | Prunus Amygdalus Dulcis (Sweet Almond) Oil | 9 |
| Olivoil Glutamate Emulsifier G-PF | 15 | ||
| Tocopheril Acetate | 1 | ||
| Cetyl Alcohol | 2 | ||
| B | Bergamot wastewater | 66 | |
| Xantan Gum | 0.2 | ||
| Glycerin | 3.6 | ||
| C | Imidazolidinyl Urea | 0.2 | |
| Olive leaf extract | 0.5 | ||
| Clementine peel extract | 2.5 | ||
| 4% CPE-OLE | A | Prunus Amygdalus Dulcis (Sweet Almond) Oil | 9 |
| Olivoil Glutamate Emulsifier G-PF | 15 | ||
| Tocopheril Acetate | 1 | ||
| Cetyl Alcohol | 2 | ||
| B | Bergamot wastewater | 65 | |
| Xantan Gum | 0.2 | ||
| Glycerin | 3.6 | ||
| C | Imidazolidinyl Urea | 0.2 | |
| Olive leaf extract | 0.5 | ||
| Clementine peel extract | 3.5 |
| Sample | UV-Vis Spectrophotometer | |||||
| TPC (mg/mL GAE) | TFC (mg/mL) | Antioxidant Activity (%I) | ||||
| Olive leaves extract | 0.0903 ± 0.0035 | 0.2164 ± 0.762 | 23.23 ± 1.47 | |||
| Clementine peels extract | 0.330 ± 0.017 | 0.8844 ± 0.0796 | 25.86 ± 3.07 | |||
| Sample | Liquid Chromatography (HPLC) | |||||
| Rutin (ppm) | Naringin (ppm) | Hesperidin (ppm) | Oleuropein (ppm) | |||
| Olive leaves extract | n.a. | n.a. | n.a. | 7.44 ± 0.52 | ||
| Clementine waste extract | 25.97 ± 1.10 | 28.16 ± 2.13 | 679.88 ± 59.29 | n.a | ||
| Formulation | Shear Viscosity (Pa·s) at Different Shear Rate (s−1) | |||
|---|---|---|---|---|
| 0.1 s−1 | 1 s−1 | 10 s−1 | 100 s−1 | |
| T = 25.00 ± 0.01 °C | ||||
| Empty Formulation | 285.40 ± 9.21 | 58.96 ± 6.54 | 5.51 ± 0.86 | 0.56 ± 0.02 |
| 2% OLE-CPE Formulation | 240.10 ± 6.28 * | 52.51 ± 4.36 | 7.56 ± 1.04 | 0.66 ± 0.04 * |
| 3% OLE-CPE Formulation | 215.20 ± 5.98 ** | 41.58 ± 3.05 * | 6.41 ± 1.58 | 0.55 ± 0.00 |
| 4% OLE-CPE Formulation | 199.90 ± 7.02 ** | 40.40 ± 4.35 * | 5.29 ± 0.99 | 0.48 ± 0.07 |
| T = 40.00 ± 0.01 °C | ||||
| Empty Formulation | 115.60 ± 11.21 | 13.50 ± 2.45 | 1.67 ± 0.58 | 0.27 ± 0.05 |
| 2% OLE-CPE Formulation | 91.55 ± 8.24 * | 8.76 ± 1.98 | 1.06 ± 0.78 | 0.15 ± 0.02 * |
| 3% OLE-CPE Formulation | 58.99 ± 8.25 * | 9.23 ± 1.14 | 1.23 ± 0.45 | 0.18 ± 0.02 * |
| 4% OLE-CPE Formulation | 59.05 ± 6.25 * | 6.92 ± 1.87 * | 0.99 ± 0.05 | 0.16 ± 0.00 * |
Disclaimer/Publisher’s Note: The statements, opinions and data contained in all publications are solely those of the individual author(s) and contributor(s) and not of MDPI and/or the editor(s). MDPI and/or the editor(s) disclaim responsibility for any injury to people or property resulting from any ideas, methods, instructions or products referred to in the content. |
© 2024 by the authors. Licensee MDPI, Basel, Switzerland. This article is an open access article distributed under the terms and conditions of the Creative Commons Attribution (CC BY) license (https://creativecommons.org/licenses/by/4.0/).
Share and Cite
d’Avanzo, N.; Mancuso, A.; Mare, R.; Silletta, A.; Maurotti, S.; Parisi, O.I.; Cristiano, M.C.; Paolino, D. Olive Leaves and Citrus Peels: From Waste to Potential Resource for Cosmetic Products. Cosmetics 2024, 11, 41. https://doi.org/10.3390/cosmetics11020041
d’Avanzo N, Mancuso A, Mare R, Silletta A, Maurotti S, Parisi OI, Cristiano MC, Paolino D. Olive Leaves and Citrus Peels: From Waste to Potential Resource for Cosmetic Products. Cosmetics. 2024; 11(2):41. https://doi.org/10.3390/cosmetics11020041
Chicago/Turabian Styled’Avanzo, Nicola, Antonia Mancuso, Rosario Mare, Antonio Silletta, Samantha Maurotti, Ortensia Ilaria Parisi, Maria Chiara Cristiano, and Donatella Paolino. 2024. "Olive Leaves and Citrus Peels: From Waste to Potential Resource for Cosmetic Products" Cosmetics 11, no. 2: 41. https://doi.org/10.3390/cosmetics11020041
APA Styled’Avanzo, N., Mancuso, A., Mare, R., Silletta, A., Maurotti, S., Parisi, O. I., Cristiano, M. C., & Paolino, D. (2024). Olive Leaves and Citrus Peels: From Waste to Potential Resource for Cosmetic Products. Cosmetics, 11(2), 41. https://doi.org/10.3390/cosmetics11020041