Abstract
Cosmeceuticals are one of the fast-growing areas of the natural personal care industry. Cosmeceuticals are cosmetic products with medicinal or drug-like benefits that can affect the biological functioning of the skin depending on the ingredients in the composition. The development of one formulation acting on the dermis and stimulating the collagen production is very important for the hydration of the skin. The association of collagen with other ingredients can have a positive effect on increasing the natural production of collagen in the skin. An example of such an ingredient is niacinamide, which, having a recognized nutritional value, has been quite recently studied. Considering these aspects, this study focused on developing oil-in-water (O/W) emulsions, based on natural ingredients (vegetable oils, floral waters, and essential oils) and hydrolyzed collagen and niacinamide as active ingredients, and on evaluating the stability, pH, optical, superficial, rheological and textural properties, as well as microbiological tests of the emulsions, in order to investigate their potential as a cosmeceutical product. All the obtained emulsions proved to be stable at variable temperatures and had a pH value compatible with natural pH of the skin, allowing their safe application. Over goniometric analysis, a partial wetting and a hydrophilic character of the emulsions were emphasized. Following the rheological analyses, all dermatocosmetic emulsions exhibited non-Newtonian pseudoplastic behavior and a thixotropic character, these properties being very important for their production process and their application on the skin surface to generate an optimal therapeutic effect. The textural characteristics recorded for all emulsions indicated adequate spreadability at the application site. All tested samples respected the Pharmacopoeia limits of microbiological contamination. All prepared emulsions have good stability, are safe for the skin and have appropriate physicochemical and microbiological characteristics; therefore, they can be used as a cosmeceutical product.
1. Introduction
A cosmeceutical is a product with hybrid properties presenting topical action benefits and providing good protection against degenerative skin conditions [1]. The term “cosmeceuticals” was made popular by Albert M. Kligman in the 1970s [2], as a combination of personal care cosmetic products and pharmaceutical products with therapeutic and healing properties. Similar to cosmetics, cosmeceuticals are applied topically on the skin, but they also contain ingredients that influence skin functioning [3]. Cosmeceuticals improve appearance of the skin by delivering the necessary nutrients. Cosmeceuticals usually claim to improve skin tone, texture, and radiance, while also reducing wrinkling. They are among the fastest-growing segments of the natural personal care industry [4] and they can influence the biological functioning of the skin due to their ingredients. They are skin care products that achieve more than simply perfuming and coloring the skin. These products encourage collagen growth, improving the functioning of the skin and combating the effects of free radicals, while also maintaining keratin structure in good condition [5].
Collagen constitutes a large part of connective tissue, and is found in bones, tendons, joints and skin, as a structural protein component [6]. The primary structure of collagen contains Glycine (~33%), proline and hydroxyproline (~22%). Its secondary structure consists of amino acids chains packed into a triple helix with three amino acids per turn, which are twisted around each other to form a tertiary structure. The superhelix is the fundamental quaternary structure of collagen. To date, 29 types of collagens have been discovered [7]. The high biocompatibility, non-toxicity and biodegradability of collagen recommend its use in a wide range of applications: cosmetics, pharmaceutical, medical and food industries. The collagen content decreases with age; therefore, cosmetics companies develop new methods for the topical use of collagen [8].
Skin hydration can be ameliorated by stimulating collagen production, which can be achieved by developing a formulation acting on the dermis. Moisturizers play an important role in this regard, improving many impaired functions related to dry skin, such as atopic dermatitis [9].
Collagen represents an important constituent in cosmetic formulations being moisturizing, film forming and regenerating the skin. The excellent ability of collagen to bind water helps to properly maintain the content of water in the skin during the day, keeping the skin moisturized and soft. Collagen’s film forming properties reduce the loss of transepidermal water, alongside being a natural humectant. Peptide occlusion makes the skin more smooth, illuminated and radiant, and can also prevent skin and hair damage caused by mechanical impairments. Recent research has shown that collagen accelerates the wound healing process and helps regenerate tissues. Collagen is therefore used on a large scale in cosmetics [10,11].
The association of collagen with other ingredients can have a positive effect on increasing the natural production of collagen in the skin. Niacinamide is an example of such an ingredient, with a well-recognized nutritional value, used as a topical agent for skin care benefits. Some reports of topical niacinamide point to beneficial effects in the prevention of carcinogenesis and immunosuppression [12], prevention of dermal collagen loss accompanied by skin photoaging [13], reduction in acne severity and enhancement in bullous pemphigoid [14]. Although in these cases beneficial effects have been observed, the mechanisms involved are not well understood. Recent studies showed that facial skin tolerates niacinamide very well, providing many beneficial effects for skin aging, such as barrier function, and reducing sebum production and the appearance of photoaging signs (pore size, dark spots, red blotchiness) [15].
Considering these aspects, the purpose of this study was to develop oil-in-water (O/W) emulsions, based on natural ingredients (such as vegetable oils, floral waters and essential oils) and hydrolyzed collagen and niacinamide as active ingredients, and to evaluate the stability, pH, saponification value, optical, superficial, rheological and textural properties, as well as microbiological tests of the emulsions, in order to investigate their potential as a cosmeceutical product.
2. Materials and Methods
2.1. Materials
Collagen hydrolysate was obtained by acid hydrolysis of fresh bovine dermis at 125 °C during 8 h according to the technology previously described [16].
The Turkish pine (Pinus brutia Ten) essential oil was obtained in Department of Medicinal and Aromatic Plants, Faculty of Agriculture, Hatay Mustafa Kemal University (Turkey) from wild plants from the province of Hatay in the period of their blooming.
Vegetable oils (avocado oil, almond oil, jojoba oil), emulsifier (glyceryl stearate), floral waters (witch hazel water and linden water), xanthan gum, niacinamide, and Cosgard preservative (benzyl alcohol, salicylic acid, glycerin, sorbic acid) were purchased from https://www.elemental.eu/ro/, (accessed on 17 October 2023) Elemental, Oradea, Romania.
2.2. Formulation and Preparation of Oil/Water (O/W) Emulsions
Table 1 shows the chemical composition for all emulsions.

Table 1.
Composition of the cosmetic emulsions prepared A—Oil phase (vegetable oils and emulsifier); B—water phase (distilled water and floral water, collagen and niacinamide); C—preservative (Cosgard: mixture of benzyl alcohol, salicylic acid, glycerin, ascorbic acid) and thickening agent (xanthan gum); D—fragrance (Turkish pine essential oil).
2.3. Calculation of Required Hydrophilic–Lipophilic Balance Values (rHLB) for the Prepared Emulsifiers
The required HLB value represents the HLB value required to prepare stable emulsion using a combination of emulsifiers and oils. The rHLB was calculated using Formula (1) [17]:
where wi = the weight fraction of the emulsifier utilized, with its HLBi.
2.4. Characterization of O/W Emulsion
2.4.1. Physical Characterization, Stability, and pH
Physical characterization, pH, stability, and the organoleptic properties (color, appearance, smell) for the emulsions obtained were performed and physical properties (phase separation) were optically observed.
pH was determined using inoLab pH meter (WTW 82362 Weilheim, Germany). Stability tests were performed at different temperatures: room temperature (20–23 °C), 4–5 °C (refrigerator), and 40 °C (incubator) for all obtained emulsions, according to standard STAS 10998 [18].
In addition, the formulations’ ability to spread on the skin, skin absorption, and odor were estimated by sensory analysis.
2.4.2. Determination of Water Content and Volatile Substances
Approximately 1 g of sample was weighed in a vial, placed into the oven at 100 ± 5 °C and dried to constant mass. The water content and volatile substances are calculated using Equation (2).
where: m2—mass of the vial sample before drying, (g); m1—mass of the vial sample after drying, (g); m—mass of the sample taken for analysis, (g)
2.4.3. Optical Microscopy Analysis
A drop of emulsion was spread on a glass slide and then visualized under the LEICA model S8AP0 optical microscope (Leica Microsystems CMS GmbH 35578, Wetzlar, Germany), with Increase Power: 10–160×.
2.4.4. Contact Angle Evaluation
Contact angle (CA) measurements were performed to assess the wettability behavior of the emulsions, at 32 ± 0.5 °C. CAM 101 goniometer (KSV Instruments, Ltd., Espoo, Finland), equipped with a Hamilton syringe and a C 209-30 needle was used as previously reported [19]. Distilled water was dropped on a glass slide coated with the tested emulsion and the modifications of the drop shape were assessed [20]. The Young equation fitted the model of analysis and the contact angle was computed and expressed as a mean of ten measurements (Equation (3)).
where γSG represents the superficial tension at the solid/gas interface; γSL—the superficial tension at the solid/liquid interface; γLG—the superficial tension at the liquid/gas interface, and θ—the contact angle.
2.4.5. Rheological Analysis
The rheological investigation of all emulsions was carried out with a rotational viscometer Multi-Visc Rheometer (Fungilab, Barcelona, Spain), using the standard spindle TR10 and an ultra-thermostat ThermoHaake P5 that ensures maintaining the sample at a constant temperature during the rheological test. The experimental set-up was previously detailed in our studies [21]. The measurements were conducted at two different temperatures: 24 °C (optimal conditioning temperature of dermatocosmetic emulsions) and 32 °C (temperature of the human skin surface). The experimental data were graphically represented in the form of rheograms—viscosity versus shear rate and well fitted by Power Law Model, a typical mathematical model to characterize the rheological properties of polymeric materials. Moreover, to evaluate the thixotropic behavior, rheograms—shear stress versus shear rate—were built and the specific thixotropic parameters were presented [22].
2.4.6. Textural Analysis
Texture Profile Analysis (TPA) was conducted to assess the textural properties of emulsion-based creams. The analyses were performed at a controlled ambient temperature of 20 °C using a TX-700 texture analyzer (Lamy Rheology Instruments, Champagne au Mont d’Or, France) equipped with a 5 kg load cell. The instrument utilized a stainless-steel cylindrical probe with dimensions of 40 mm in height and 25 mm in diameter. Approximately 30 g of each cream sample were placed into a cylindrical container and balanced to room temperature prior to the measurements.
For the textural analysis, the probe performed two consecutive compression and decompression cycles into the cream samples. Each compression was executed at a constant velocity of 0.5 mm/s to a depth of 10 mm. The onset of sample compression was detected at a force threshold of 0.01 N. After reaching the target depth, the probe retracted at the same speed to a return position set at 20 mm above the sample.
The analysis generated force–time curves from which textural parameters such as hardness, cohesiveness, springiness, and adhesiveness were derived [23]. Data collection, along with subsequent analysis, was performed using the RheoTex software version 1.52.0.0 package provided with the instrument. To ensure the repeatability and precision of the texture measurements, five replicates were performed for each cream formulation. The results from these replicates were averaged to provide a reliable representation of the textural characteristics of the emulsions.
Average value and standard deviation (SD) are used to express all data. One-way analysis of variance (ANOVA), Tukey’s HSD post hoc test, and Student’s t-test for dependent and independent samples were used to statistically examine each parameter of interest. A p-value less than 0.05 was considered significant. GraphPad Prism version 9 for Windows (GraphPad Software, La Jolla, CA, USA) was used for statistical calculations.
2.4.7. Saponification Value
Saponification value represents the quantity of potassium hydroxide, in mg, required for the saponification of 1 mg of sample.
The sample is melted at a temperature no more than 15 °C above the melting point, dehydrated with anhydrous sodium sulfate and filtered through filter paper to remove impurities and traces of water. A total of 2 g of the sample are weighed and 25 cm3 of alcoholic potassium hydroxide solution is added with a burette. Then the mixture is boiled under reflux until complete saponification. After saponification, the sample is titrated with 0.5 N HCl, in the presence of phenolphthalein, until the red color disappears.
In parallel, a control sample is performed under identical conditions to those of the sample to be analyzed, but without fat.
The saponification value (SV) is calculated using Equation (4):
V—volume of HCl 0.5 N used for titration of control sample, mL; V1—volume of HCl 0.5 N used for titration of analyzed sample, mL; m—weight of analyzed sample, in g.
2.4.8. Microbiological Tests
Microbial Contamination Control
Microbial contamination control in accordance with The European Pharmacopoeia (Ph. Eur.) 10th Edition aims to determine the total number of aerobic microorganisms or the absence of pathogenic or conditioned-pathogenic microorganisms. In this regard, the following determinations were made:
- Total aerobic microbial count (TAMC)
- Total combined yeasts and molds count (TYMC)
A total of 1 g of sample is weighted and in a sterile Erlenmeyer flask is suspended in 99 mL buffered NaCl solution, pH = 7.00 (buffered sodium chloride solution pH = 7.0). A 1:10 dilution is obtained from which serial dilutions (1:100; 1:1000, etc.) are prepared, using the same sterile diluent. In two Petri dishes, with a diameter of 9 cm, 1 mL of each prepared dilution is transferred. Then, 15–20 mL of agar culture medium with casein and soy hydrolysate (Casein Soya Bean Digest Agar) or 15–20 mL of Sabouraud agar culture medium (Sabouraud Dextrose Agar) is added. The liquefied culture medium must not be greater than 45 °C. Plates with hydrolyzed casein and soy agar are incubated for 48 h at 30–35 °C. Sabouraud agar plates are incubated for 5–7 days at 20–25 °C. The samples were checked throughout the incubation period. For a proper evaluation, the plates that have no more than 250 colonies for bacteria and 50 colonies for yeasts and filamentous fungi are selected. The developed colonies were counted and the arithmetic mean for each dilution was made. The total number of colony-forming units was calculated (CFU g/mL) by dividing the number of dilutions performed.
- Total aerobic microbial count (TAMC) = mean CFU determined on agar medium with casein and soy hydrolysate.
If CFU of yeasts and filamentous fungi are detected on this culture medium, they are taken into account in the total number of CFU for this medium.
- Total combined yeasts and molds count (TYMC) = average CFU determined on the Sabouraud agar medium. If CFU bacteria are detected on this culture medium, they are taken into account in the total number of CFU developed on this medium.
The total number of viable aerobic microorganisms is the sum of the number of bacteria and the number of yeasts and filamentous fungi developed on the two-culture media.
Calculation of the Antibacterial Activity Ratio
The samples were tested by adapting the ISO 20743: 2007 standard [24] involving quantitative test methods to determine antimicrobial activity. The absorption method was used, which involved the direct inoculation of the bacteriological test inoculum directly into the sample. The initial cell concentration was determined previously, by decimal dilutions (10−4) in sterile deionized water, and from the last dilution, for each strain, 100 µL were taken and spread on Nutrient Agar medium. The counts on the plate were performed after 24 h of incubation, these being kept as a reference for the cell developments in the control sample from the set of samples (taken as the sample performed in paraffin oil). Thus, plates with cell density similar to that in the 10−5 dilution were considered to have similar CFU values (1 × 10⁵ CFU/mL—Escherichia coli, 1.5 × 10⁵ CFU/mL for Staphylococcus aureus and Pseudomonas aeruginosa).
The results were expressed as average percentage and logarithmic reduction. Counts on the plate were performed at 24 h of incubation, in order to detect colony-forming cellular units. To quantify the antimicrobial efficiency, the degree of microbial and logarithmic reduction of each sample was calculated, related to the initial cell concentration.
When the test is considered to be effective, the antibacterial activity ratio is obtained according to the following Equation (5):
R is the antibacterial activity ratio; Ct is the average number of bacteria obtained from three control samples, after an incubation time of 18 h to 24 h; Tt is the number of bacteria obtained from three samples with antibacterial effects after an incubation time of 18 h to 24 h.
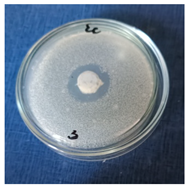
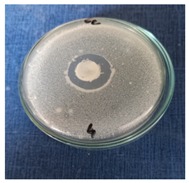
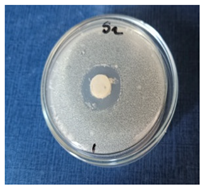
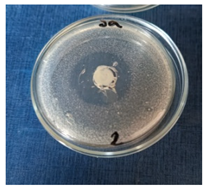
Inhibitory Activity of Escherichia coli and Staphylococcus aureus Strains
The samples were tested on ATCC strains from the ICPI Biotechnology Laboratory collection, namely on Escherichia coli (ATCC 10536) and Staphylococcus aureus (ATCC 6538). The working method was the diffusimetric one. A test tube containing Mueller Hinton Broth (MHB) inoculated with E. coli and S. aureus was incubated for 18 h at 37 °C. Decimal dilutions up to 10−5 CFU/mL were made from this tube. A total of 200 μL of the inoculum was seeded onto the plates. Later, halos were made, with a diameter of 15 mm; the samples thus prepared were kept in the incubator for 24 h, at 37 °C. After this time, the antibacterial activity was determined by measuring the diameter of the zone of inhibition around the halo.
To discuss the measurements, we opted for a classification of the samples, according to a scale used in similar studies, starting from the diameter of the inhibition zone, calculated using the Equation (6):
- H = zone of inhibition, in millimeters;
- D = the total diameter of the halo of the inhibition zone, in millimeters;
- d = halo diameter, in millimeters.
3. Results and Discussion
3.1. Formulation of Oil/Water (O/W) Emulsions
An emulsion is a disperse system consisting of two liquids that are immiscible and stabilized using an emulsifying agent (emulsifier or emulgent) [25]. Two liquids can form different types of emulsions: oil and water can form either an oil-in-water emulsion (O/W), wherein water acts as the dispersion medium and oil is the dispersed liquid, or a water-in-oil emulsion (W/O), wherein water is the dispersed phase and oil is the external phase. Multiple emulsions are also possible, including a water-in-oil-in-water (W/O/W) emulsion and an oil-in-water-in-oil (O/W/O) emulsion [26]. Formulations of O/W emulsions have recently gained an increased academic interest because of their suitability for use in medicine and cosmetics [27].
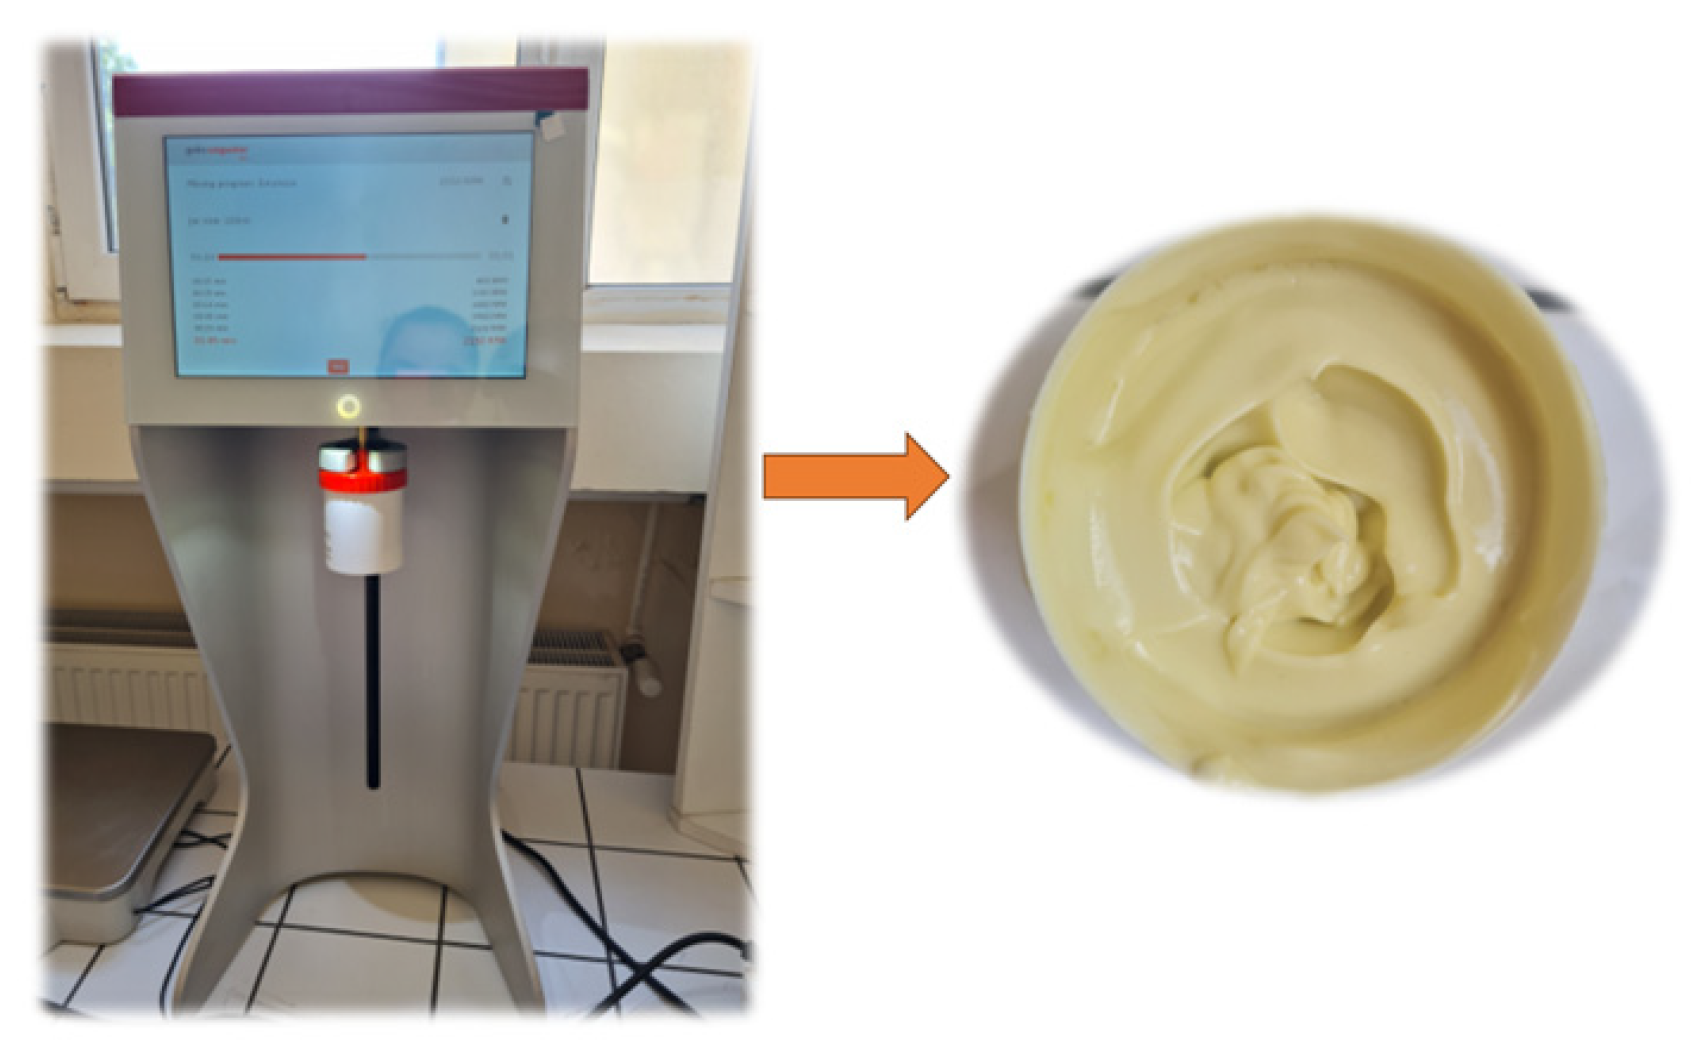
Our study was focused on preparing and characterizing some O/W cosmeceutical emulsions (Figure 1) using natural ingredients (mostly obtained from vegetable materials) and active ingredients, like collagen hydrolysate and niacinamide.
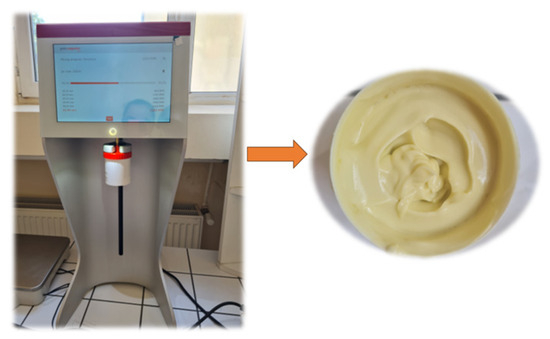
Figure 1.
Preparation of O/W emulsions.
Different mixtures of vegetable oils (avocado, almond, and jojoba oils) were used as the oil phase. Rich in fatty acids and fatty alcohols, vegetable oils provide emollient properties. Other dermato-cosmetic properties of the mentioned vegetable oils are reported in the literature [28]. Avocado oil, rich in monosaturated fat, can boost collagen production, prevent the appearance of wrinkles, increase skin elasticity and moisturize the skin, while also acting as a shield against ultraviolet irradiation, because it contains fat soluble vitamins A, B, E and D, and polyphenols such as phytosterols which play a major role in rejuvenating the stressed skin [29]. Almond oil, known for its softening, moisturizing and nutritive properties, is also used in cosmetic and pharmaceutical industries [30]. Thus, the development of stable emulsions using this natural oil can lead to creating a diverse range of emulsion-based products, depending on the added hydrophilic compound and its bioactivity [31]. Another interesting oil with unique properties is jojoba oil, which resembles the oil secreted by human skin and is less likely to build and clog pores, making it ideal for use in cosmetics and pharmaceutical products, particularly with its high penetration capacity and pleasant feel on the skin. Its hypoallergenic and moisturizing properties make it suitable for use in topical formulations with protective and soothing effects, while also reducing inflammation. Jojoba oil contains natural antioxidants such as alpha, gamma, and delta tocopherols, is highly stable following oxidation and hydrolysis and in turn helps stabilize other ingredients that may be unstable. The use of jojoba oil to prepare microemulsions in transdermal drug delivery has been of high interest [32].
A plant-based product containing glyceryl stearate (recommended for O/W systems) was used as emulsifier. According to its quality certificate, Bella emulsifier is suitable for all skin types, particularly for combination and oily skin. With a recommended dosage of 3–8%, it can be used in a variety of products (eye creams, anti-wrinkle creams, moisturizers, body milks, sun block, and color cosmetics formulations), and can be stabilized using xanthan gum or a co-emulsifier.
The water phase consisted of witch hazel (Hamamelis virginiana) water, (with anti-inflammatory properties to treat sunburn, atopic eczema, and irritated skin, presenting astringent and antiphlogistic properties as well [33]) and linden (Tilia vulgaris) water (which soothes sensitive skin, helps illuminate the skin, brightens the complexion, relieves discomfort of skin prone to itching, helps deep cleaning of the skin, and calms skin redness [34]). To avoid parabens, Ecocert-approved Cosgard was used as an appropriate preservative for water and flower water-containing preparations, with additional antibacterial and antifungal properties, suitable for sensitive skin.
3.2. Characterization of O/W Emulsion
3.2.1. Physical Characterization, Stability, and pH
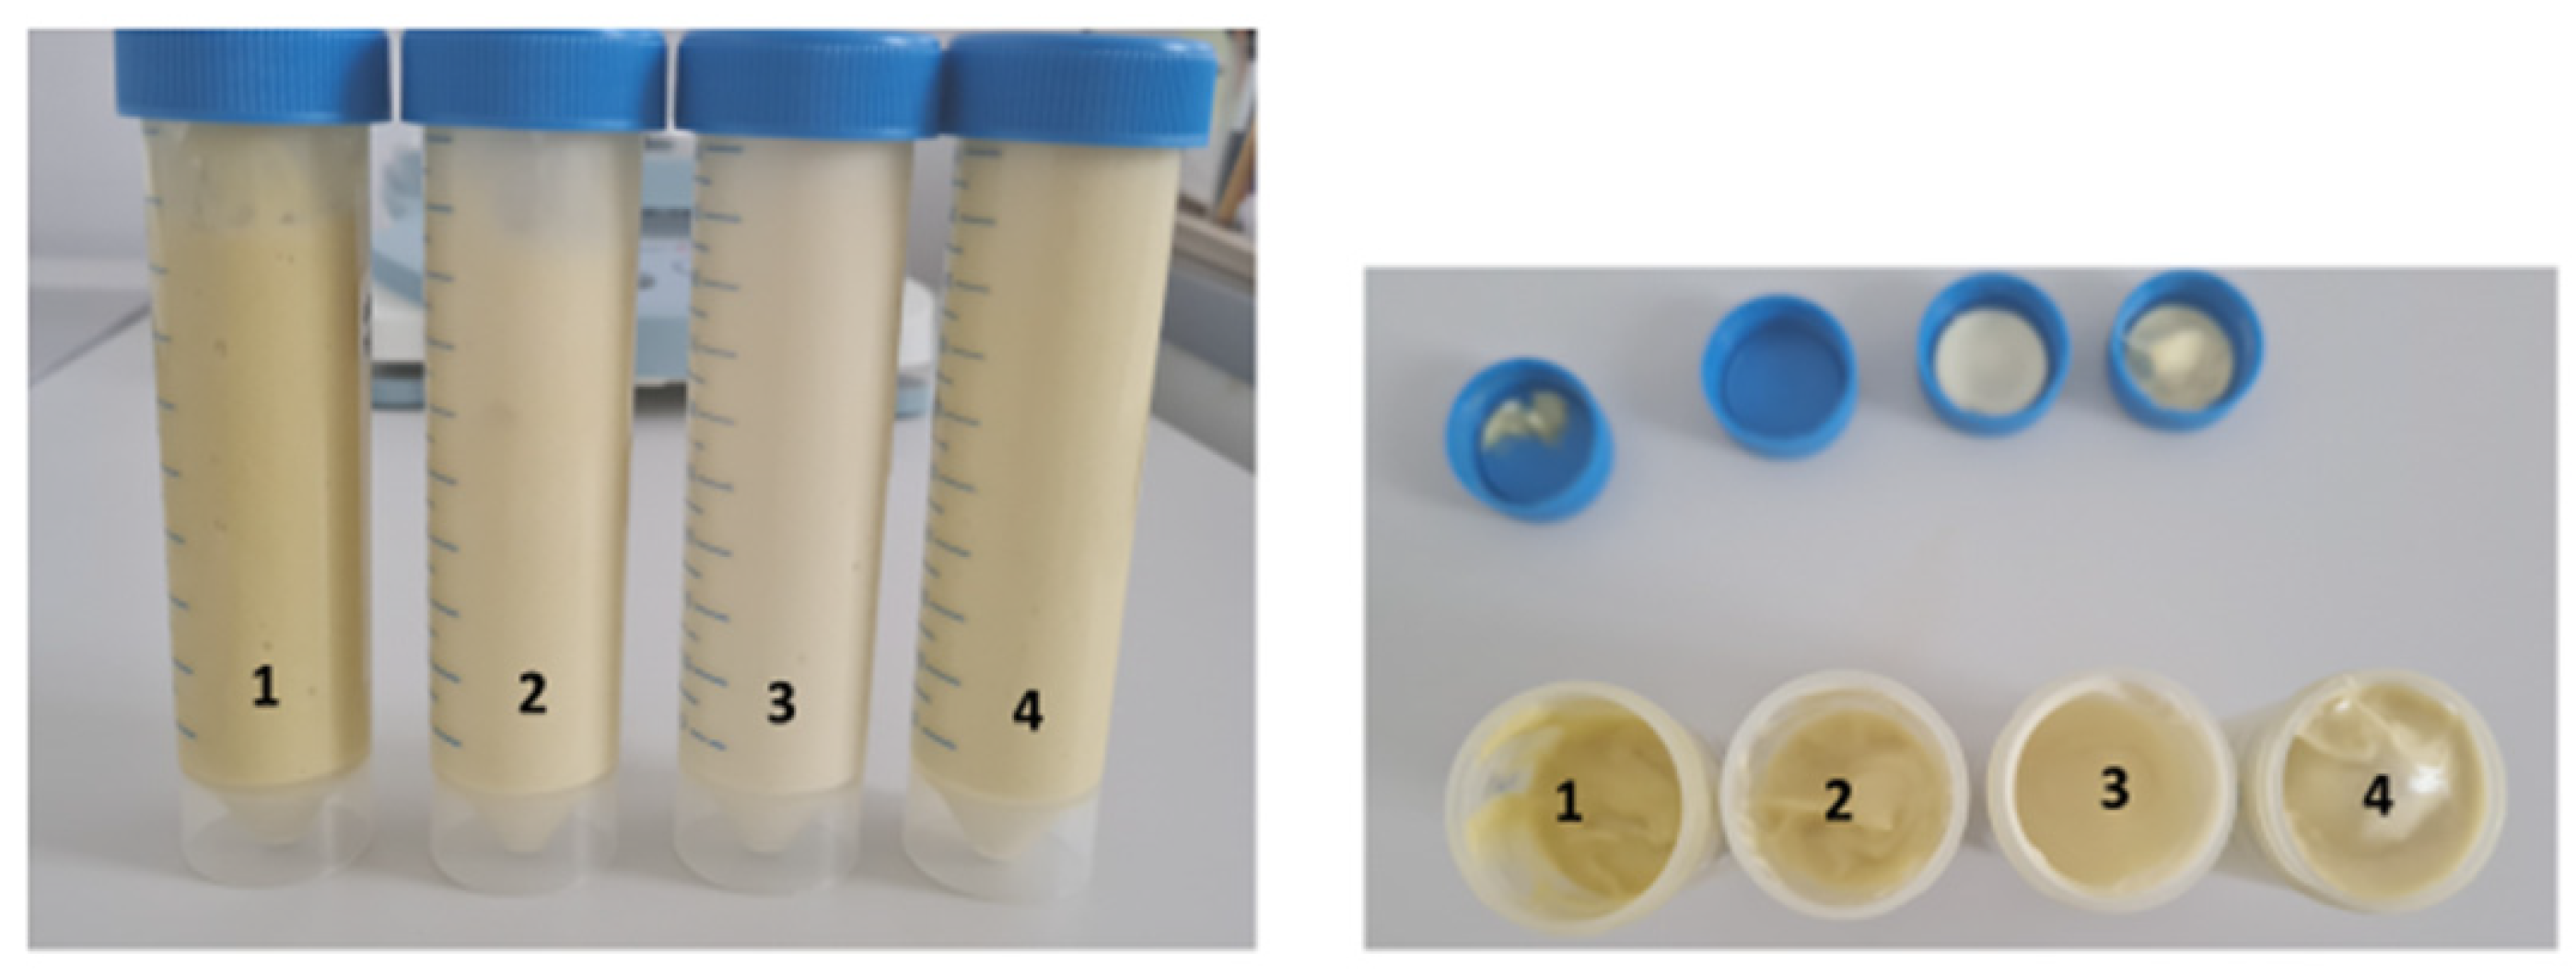
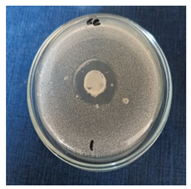
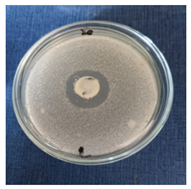
Depending on the vegetable oil content (Figure 2), emulsion no. 1 and no. 4 present a yellow color due to the high avocado oil content, no. 2 has a slightly yellow color (due to low content of avocado oil), while no. 3 has a yellow-white color with less avocado oil concentration.

Figure 2.
O/W cosmetic emulsions.
All emulsions have a pleasant, creamy, moisturized appearance and fragrance specific to the essential oil in the composition. Upon a first sensory analysis, all the emulsions are easily absorbed into the skin, do not irritate the skin, and have a pleasant odor, which make them a natural alternative at the commercial products acceptable by the consumers.
The pH values of the obtained emulsions, both for fresh prepared samples and after 30 days, are shown in Table 2.
Table 2.
The pH values for the obtained emulsions *.
Skin pH is an important biophysical feature and products administered on the skin can alter this value. The natural pH of the skin varies between 4.5 and 6.5 depending on multiple factors such as race, skin tone or color, exposure to sunlight and diseases. This is also the optimal interval for cosmetics that come into direct contact with the skin [35]. The pH values obtained for the emulsions, both fresh and after 30 days, are in the above-mentioned interval, which means that the emulsions can be safely applied on the skin.
The stability of emulsions can be altered by different variables, such as: the composition of oils, the type of emulsifier and the hydrophilic–lipophilic balance (HLB) value of the mixture of emulsifiers. Semisolid pharmaceuticals and cosmetics (emulsion, cream, and lotion) are mostly biphasic systems in which the hydrophilic–lipophilic balance (HLB) plays a vital role by managing the tension at the interface of two immiscible liquids. Knowing precisely the required HLB (rHLB) value of different ingredients in the emulsion helps determine the rHLB of the system (oil phase of formulation), which ultimately leads to the development of a stable final formulation [36].
The rHLB values of each component used to prepare the oil phases are as follows: avocado oil, 7; almond oil, 6; jojoba oil, 6–7; Bella emulsifier, 5.8. Table 3 shows the rHLB values of the obtained emulsifier blends (calculated using the Equation (1)).
Table 3.
rHLB values of the obtained emulsifier blends.
It can be seen that emulsion blend no. 4 does not contain almond oil, being characterized by high value of rHLB and emulsion no. 2 is characterized by low value of rHLB which does not contain jojoba oil. This is justified by the low content of saturated fatty acids contained by the vegetable oils.
The stability tests showed that all the samples were stable at all three working temperatures for 1 week (short-term stability) and 3 weeks (long-term stability).
3.2.2. Determination of Water Content and Volatile Substances
Water content and volatile substance are presented in Table 4.
Table 4.
The value for water content and volatile substance for the obtained emulsions.
As indicated in Table 4, the most hydrated emulsions are no. 3 and no. 4 with the highest content of water and volatile substances of 28.81% and 27.93%, respectively.
3.2.3. Optical Microscopy Analysis
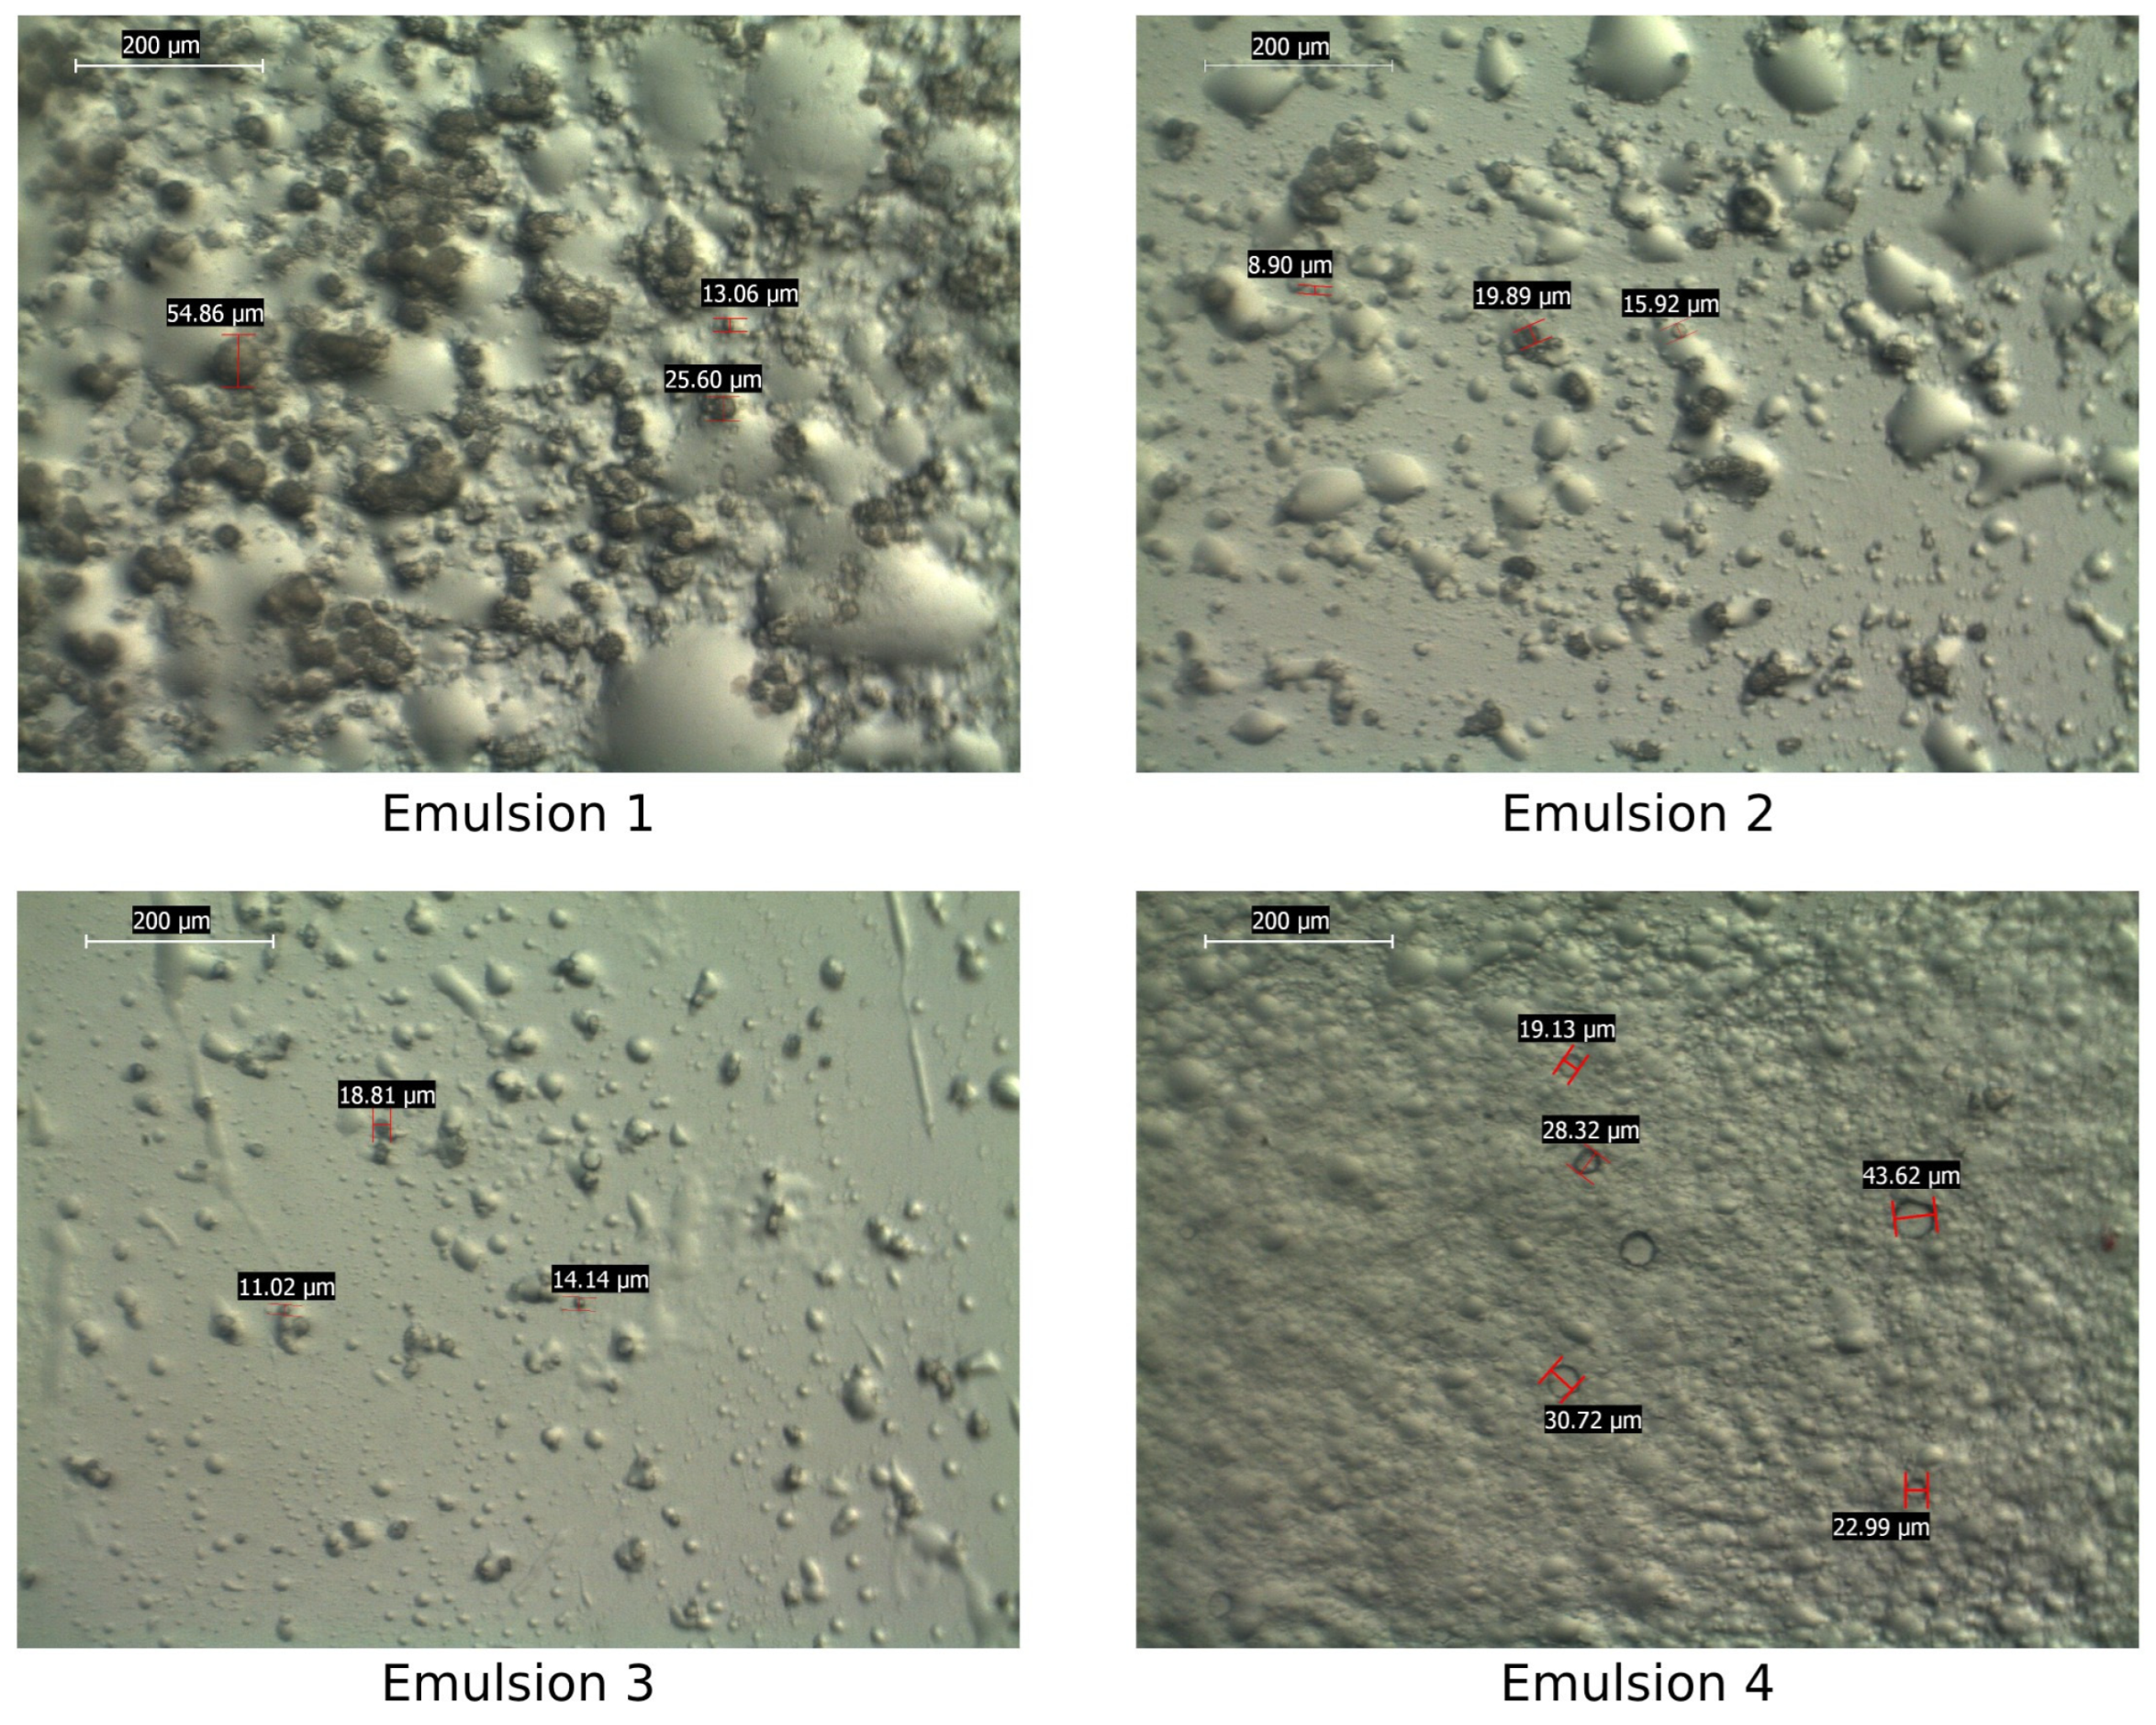
Optical microscopy was used to determine the morphology of the emulsions and the images obtained are shown in Figure 3.
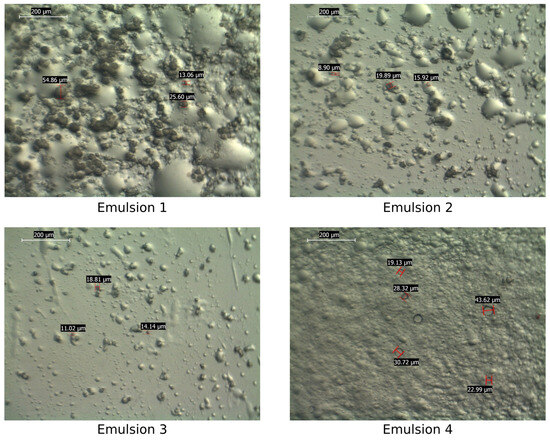
Figure 3.
Images obtained by optical microscopy for emulsion variants 1–4, magnification ×160.
Figure 3 shows uniform dispersion of oil droplets (emulsions no. 3 and no. 4) or less uniform (emulsions no. 1 and no. 2); also, the particle size varies from one sample to another, due to the different proportions of fatty acids (oleic, linoleic, palmitic, etc.) contained in vegetable oils. Optical microscopy analysis results show that all emulsions have a “foam-like” aspect and are slightly aerated.
The foam-like appearance is due to the incorporation of air during the manufacturing process. During displacement, the oil is sufficiently solubilized and transported into a phase with a foam-like texture that develops into a stream of droplets. The magnitude and stability of these emulsion phases depend on the salinity and effectiveness of the surfactant. Similarity to a texture of classical foam phases is used to determine the mechanisms that stabilize such macroemulsions in porous media. The observed displacement mechanisms can be traced back to foam formation, quality, and transport.
3.2.4. Contact Angle Evaluation
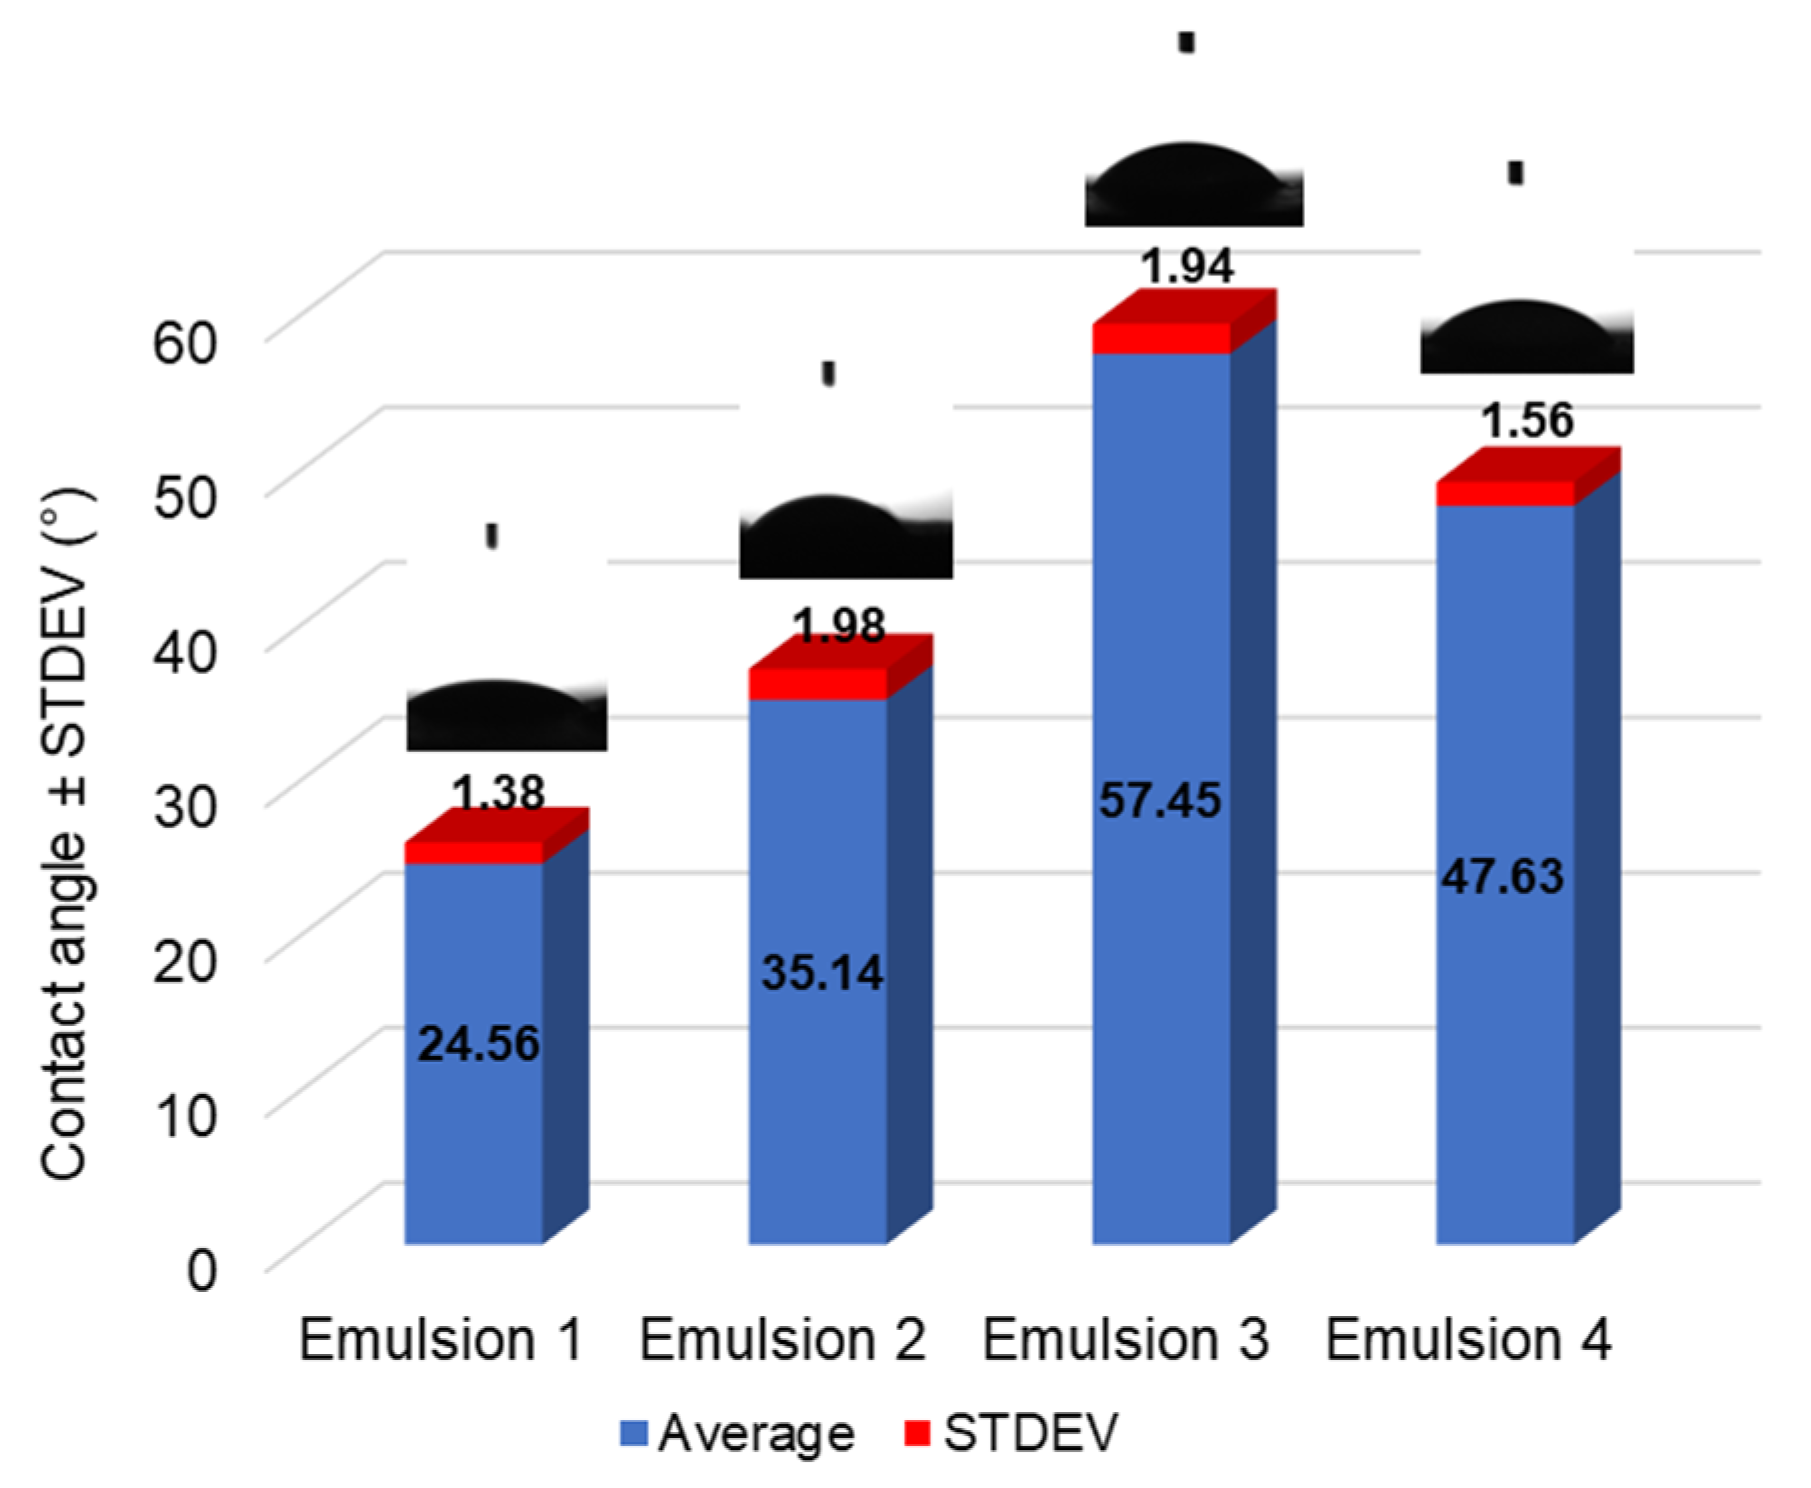
The O/W niacinamide-based emulsions coded E1–E4 were analyzed by applying the contact angle model to explore their wettability behavior at contact with a water drop. In the same manner, the method offered a pathway for establishing relevant connections between superficial parameters and the waterproof ability of the emulsions. By observing experimental values of the contact angle between 24.56 ± 1.38° and 57.45 ± 1.94°, a correlation with the emulsion’s composition was made.
Figure 4 describes the variation in the contact angle for each emulsion tested at 32 ± 0.5 °C, together with drop shape profiles describing the partial wetting and a different variation in the hydrophilic character of the samples, following the order E3 < E4 < E2 < E1.

Figure 4.
Variation in the contact angle and standard deviation for the niacinamide-based emulsions 1–4, tested at 32 ± 0.5 °C, visualized together with their corresponding drop shape profiles.
It can be observed that the E1 and E2 emulsions with contact angles of 24.56 ± 1.38° and 35.14 ± 1.98° experienced the highest hydrophilicity due to their composition based on a mixture of avocado and almond oils of 40% (for E1) and 30.9% (for E2), with a fixed concentration of the almond oil of 10%. In the second case, a slight increase in the CA value was recorded when the oil phase was reduced to 30.9%. This effect can be attributed to multiple factors, namely the slight increase in the collagen hydrolysate and niacinamide at 1.5% either, but also the introduction of xanthan gum 0.1% which acted as a stabilizer, equally behaving as a thickening agent with impact on the rheological behavior [37].
The E3 and E4 emulsions exhibited a lower wettability quantified by CA values of 57.45 ± 1.94 ° and 47.63 ± 1.56°, being prepared with a different lipophilic blend of avocado and jojoba oils in a total amount of 20.7% (for E3) and 40.5% (for E4), where the jojoba oil concentration was maintained at a constant level of 10–10.5%. A higher amount of avocado oil improved the hydrophilicity of the E4, as previously mentioned for the E1 emulsion. The increase in collagen hydrolysate and the use of higher xanthan gum concentrations of 0.3–0.5% can modify the emulsion structure and its behavior, but a strong effect is promoted by the introduction of jojoba oil which acts like a liquid wax. The avocado and almond vegetable oils have a composition mainly based on C14–C20 saturated and poly-/unsaturated fatty acids, and oil-soluble fractions like phytosterols and tocopherols [38,39], while jojoba oil contains up to 98% pure waxes based on wax esters, hydrocarbons, and a poor content of fatty acids [40]. Due to its special composition, jojoba oil reduced the hydrophilic effect of the emulsions, creating a resistant and protective film with waterproof activity [41]. This effect is favorable for dermatocosmetic emulsions with activity on the prevention of trans epidermal water loss, increasing the contact of the active ingredients at the skin level [42]. It can be appreciated that CA determinations revealed the hydrophilic character of the emulsions, as an important quality parameter, required in the development process of dermatological products for topical application. The inclusion of vegetable oils in the emulsion formulation contributes to an increase in biocompatibility, modulating the wettability behavior, with a direct impact on their pharmaceutical quality and medical recommendations.
3.2.5. Rheological Analysis
The rheological analysis represents a valuable test for the quality control evaluation of a dermatocosmetic emulsion because it furnishes quantitative information of the products peculiarities through flow assessment and deformation comportment of the sample [43]. The knowledge and the management of the rheological characteristics are extremely important for the manufacturer regarding the production, transportation, manipulation, storage, and applicability of emulsions [44].
Dermatocosmetic emulsions represent multicomponent products containing multiple ingredients (surfactants, co-surfactants, thickening promoters, preservatives, and many others), influencing the rheological properties depending on the interaction between the components. Thus, the rheological parameters offer valuable information for the manufacturer to develop a final product adequate for the needs of the consumer [45].
Figure 5 presents the cumulative forward rheograms built as viscosity versus shear rate for all emulsions, tested at both temperatures.
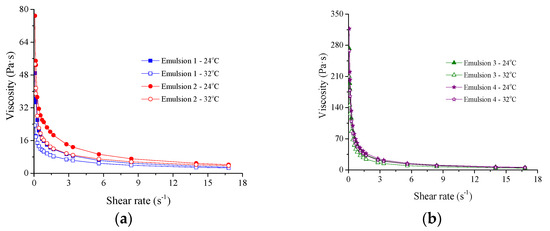
Figure 5.
Cumulative forward rheograms—viscosity as a function of shear rate—for emulsions: (a) 1 and 2, (b) 3 and 4, analyzed at 24 and 32 °C.
To evaluate the pseudoplastic behavior of the dermatocosmetic emulsions, the experimental data were fitted according to the mathematical Power Law Model (Equation (7)) [46].
The above equation shows the relation between the viscosity (η—Pa·s) and shear rate (—s−1). The rheological Power Law Model is a sample model, with a large technology application. It describes two significant parameters that define the flow behavior of the emulsions, obtained through the linearization of Equation (6) by double logarithmic method: n—the flow behavior index (dimensionless) that represents the degree of the pseudoplasticity of the product, respectively, and m—the consistency coefficient (Pa·sn), but also associated with the viscosity of a Newtonian fluid for a shear rate of 1 s−1. The n index offers information regarding the pseudoplastic (shear-thinning) behavior of a product when it varies between 0 and 1. The values of the Power Law Model parameters of dermatocosmetic emulsions analyzed at 24 °C and 32 °C and recorded for forward and backward curves are presented in Table 5 and Table 6.
Table 5.
Power law model parameters and the determination coefficients characteristics for emulsions 1–4 tested at 24 °C.
Table 6.
Power law model parameters and determination coefficients characteristics for emulsions 1–4 tested at 32 °C.
In accordance with Table 5 and Table 6, the values of the determination coefficient R2 vary between 0.9983 and 0.9999 for all emulsions analyzed at both temperatures, which means that the Power Law Model is a representative model to fit the rheological experimental results.
Figure 5 illustrates the dependency of the viscosity on shear rate, indicating the most common method to describe the behavior of the emulsion to flow. Figure 5, Table 5 and Table 6 show that, for both temperatures, all tested emulsions have non-Newtonian pseudoplastic (shear-thinning) behavior, suggesting that the viscosity of the dermatocosmetic products decreases when the applied shear rate increases. This behavior could be explained by the deformation of the internal structure of the emulsion generated by shearing, following the flow orientation [19]. The pseudoplasticity is assigned to the flow behavior index, previously mentioned, whose values range from 0 to 1; thus, the pseudoplasticity degree is stronger when the value recorded for the flow index n is lower than 1 [47,48].
According to Table 5 and Table 6, the n values of Emulsion 1 are similar for both curves, forward and backward, at 24 °C, but smaller at 32 °C. For Emulsion 2, at 24 °C, n values are similar to those of Emulsion 1. It can be observed that at 32 °C, both emulsions have a stronger pseudoplasticity compared to the values obtained at 24 °C, excepting the n value for forward curve of Emulsion 2. Emulsion 3 and 4 present higher values of flow index at both temperatures compared to Emulsions 1 and 2. It means that Emulsions 3 and 4 are less pseudoplastic than Emulsions 1 and 2. For forward curves, n values increases from Emulsion 1 to Emulsion 4, this aspect could be explained by their composition regarding the thickening agent (xanthan gum): thus, the pseudoplasticity decreases with the increase of the xanthan gum content (0% for Emulsion 1 with the strongest pseudoplasticity and 0.5% for Emulsion 4 with the lowest pseudoplasticity). It is essential to emphasize that the content of vegetable oils does not significantly affect the pseudoplastic behavior of the dermatocosmetic emulsions. Accordingly, comparing Emulsion 1 and 4, which have a similar content of oils (40% and 40.5%, respectively), the pseudoplasticity of Emulsion 4 is 1.46–1.64 times lower than the one of Emulsion 1, at 24 °C, for both curves, and it is ~2 times lower at 32 °C, for both curves. This behavior can be explained by the content of xanthan gum from both emulsions: 0% for Emulsion 1 and the maximum content (0.5%) for Emulsion 4. Moreover, Emulsion 3, which has a high n value, contains the smallest volume of vegetable oils from all dermatocosmetic emulsions (20.7%). As can be noticed in Table 6, the n index values are slightly influenced by the temperature, the most highlighted for Emulsion 1, which is correlated with the literature data [25].
The degree of emulsion thickening can be analyzed through the consistency index (m) determination. According to Table 5, at 24 °C, for forward curves, the m values increase from Emulsion 1 to Emulsion 4, in accordance with the n index values. Correlating with n parameter, the viscosity is strongly influenced by the content of the xanthan gum; therefore, Emulsion 4 is the most viscous of all four samples because it contains the maximum concentration of the thickening agent, 0.5%. On the other hand, the formulation without xanthan gum presents the lowest viscosity. For backward curves, the m value of Emulsion 2 is slightly higher than the m value of Emulsion 1, but for Emulsions 3 and 4, the tendency of the consistency index value remains the same as the forward curves. It can be easily noticed that the temperature has a strong influence on the m parameter, decreasing about 1.13–1.56 times with the increase of temperature. In accordance with the Table 6, the viscosity has the same trend at 32 °C for both, forward and backward curves; thus, Emulsion 1 has the lowest viscosity because it does not contain the xanthan gum, and Emulsion 4 presents the highest viscosity due to the maximum content of the xanthan gum (0.5%). As we described above about the n index evolution, the content of vegetable oils does not significantly influence the viscosity of the emulsions, Emulsion 4 being the most viscous of all four emulsions due to the highest content of xanthan gum. Its viscosity is 3.28–3.8 times higher than the one of Emulsion 1, at 24 °C, for both curves, and the viscosity is 4.58–4.73 times higher at 32 °C, for both curves. Moreover, Emulsion 3, which has a high viscosity close to that of Emulsion 4, contains the smallest volume of vegetable oils from all dermatocosmetic emulsions (20.7%).
Alongside the m and n parameters described in detail above, another significant rheological descriptor for a dermatocosmetic product is the thixotropy. For a pseudoplastic system, the thixotropy represents a valuable characteristic because it illustrates a modification of the viscosity that is dependent on time [49]. IUPAC defined the thixotropy as a decrease of the viscosity or the consistency of a system after a long rest when a definite shear is applied on the system, with the recovery of the initial viscosity or consistency [50].
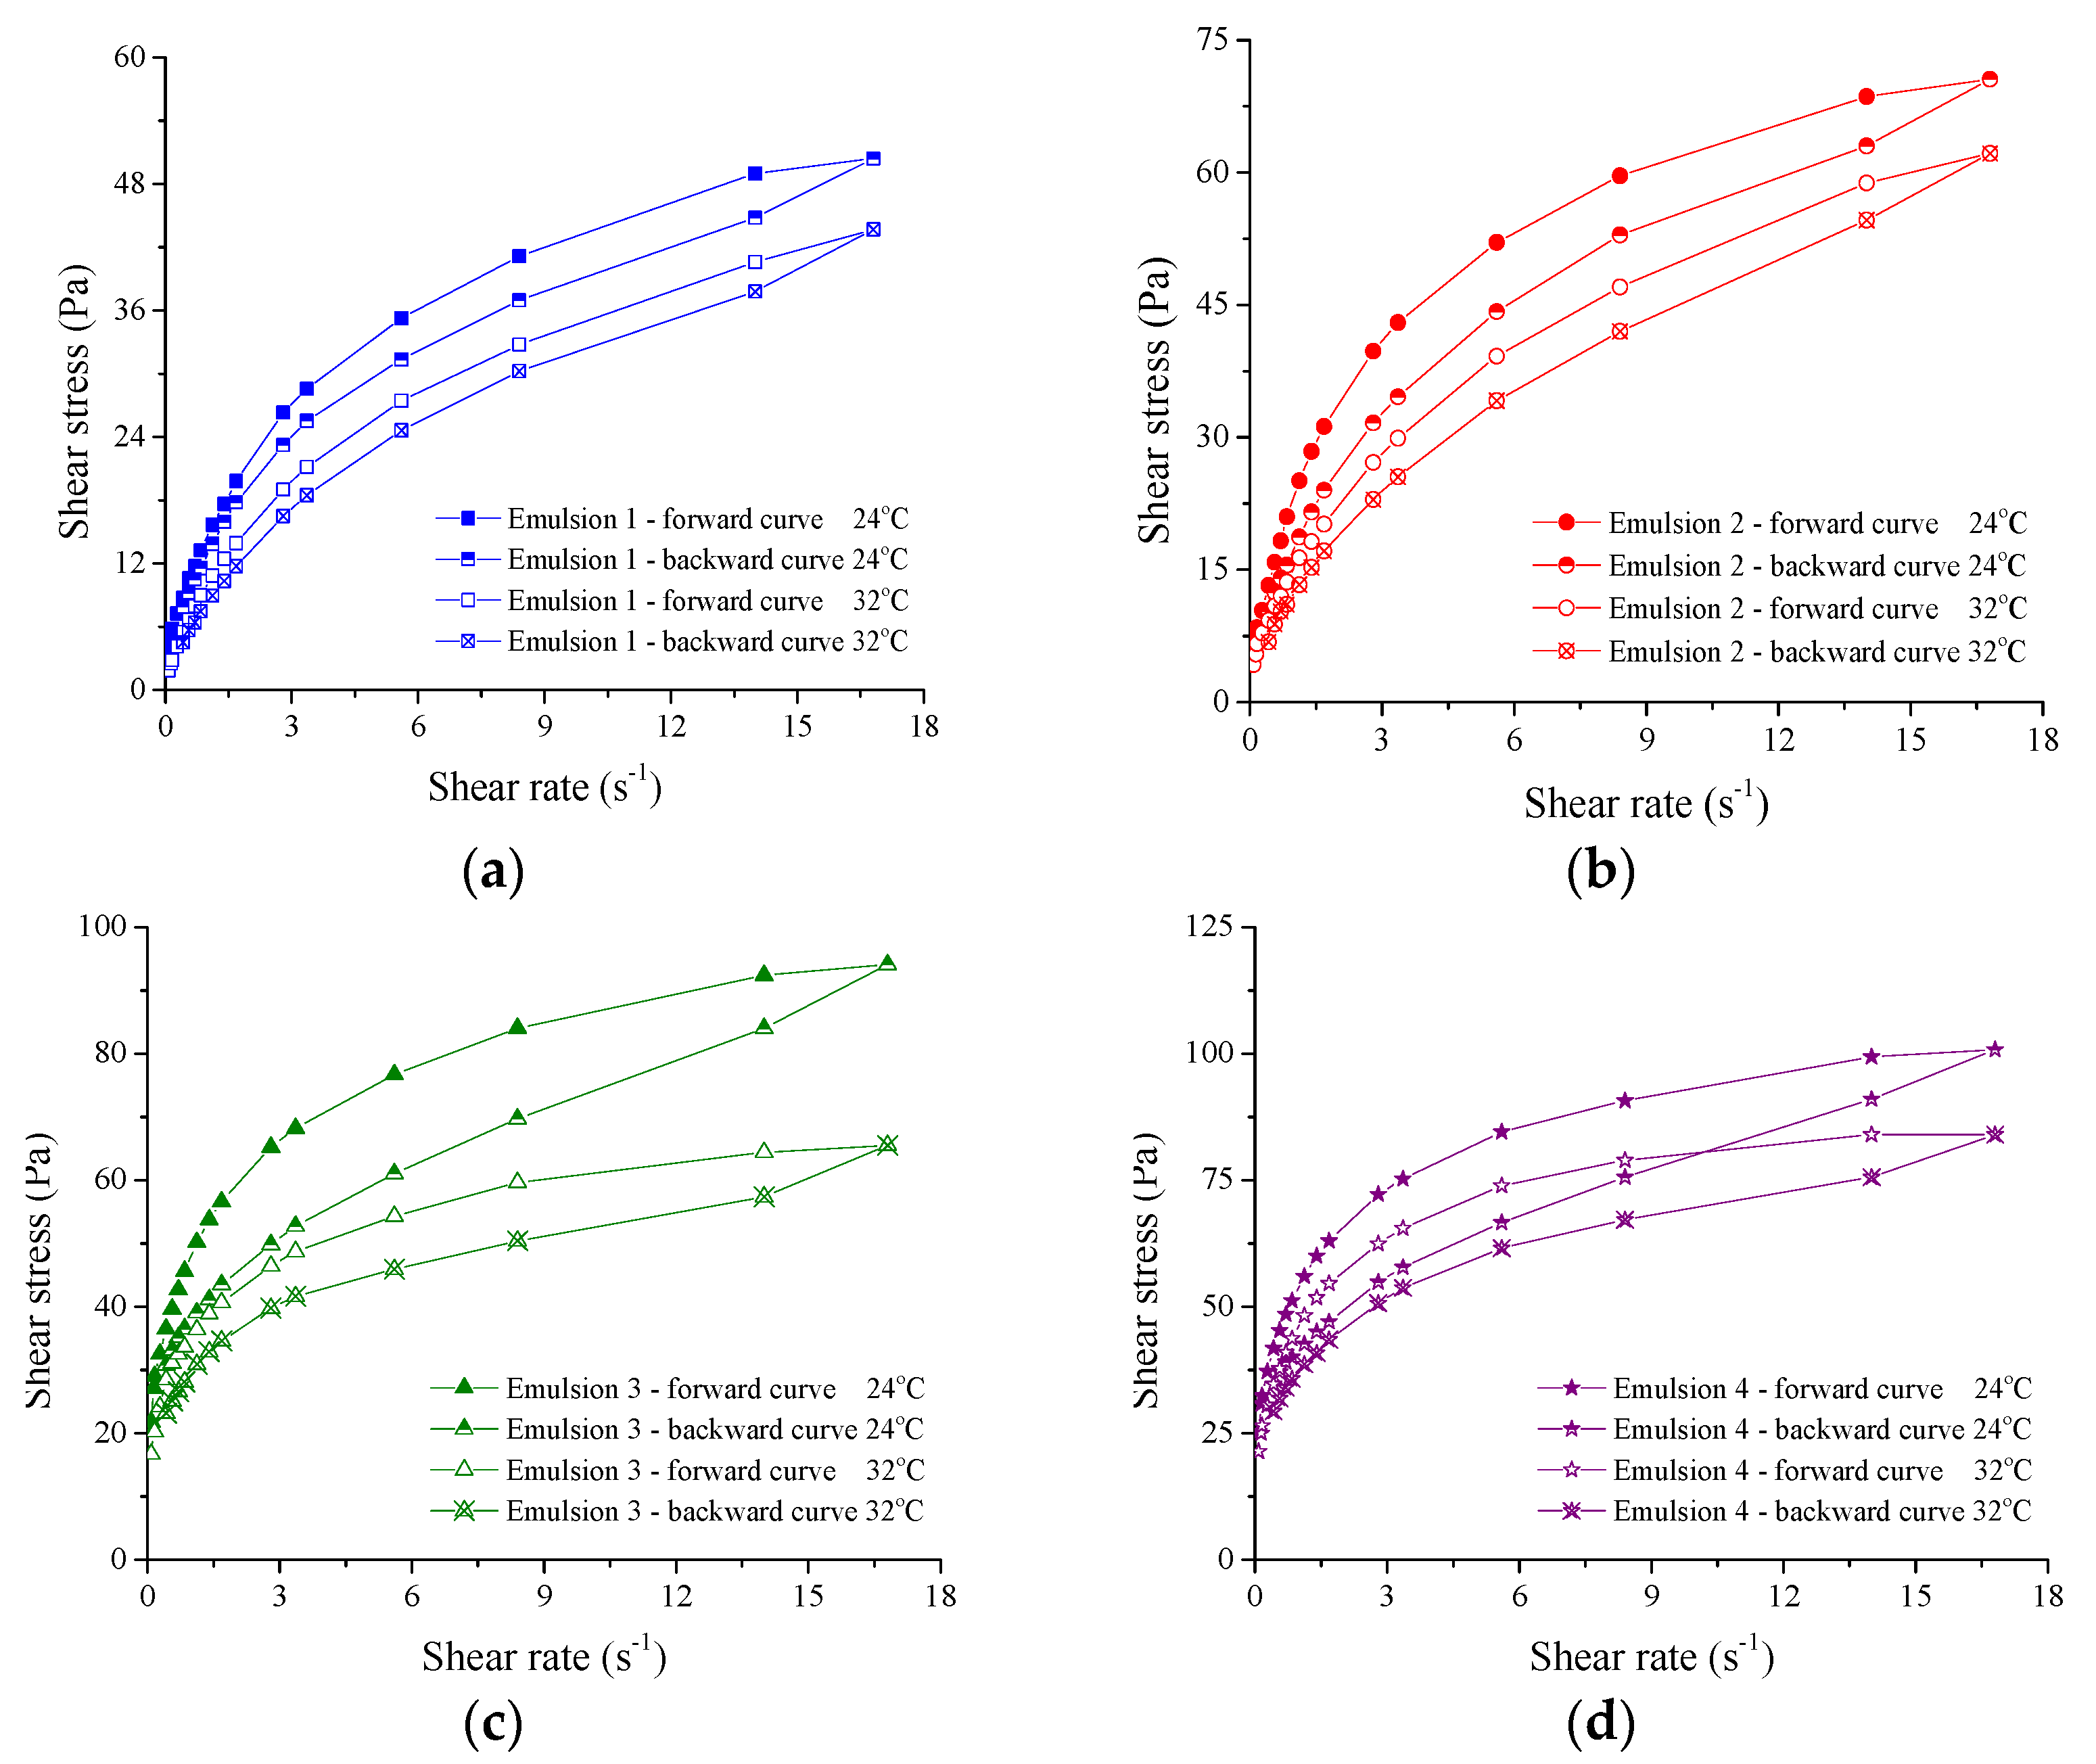
The thixotropic character is graphically presented in Figure 6 through the forward and backward curves plotted as shear stress versus shear rate for all four formulations tested at 24 and 32 °C.
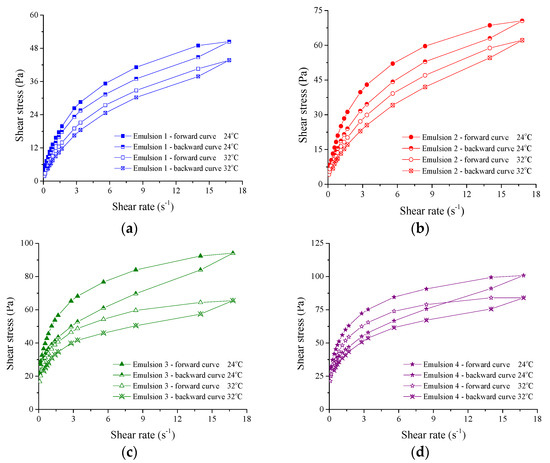
Figure 6.
Forward and backward rheograms—shear stress as a function of shear rate—for emulsions: (a) 1, (b) 2, (c) 3, and (d) 4, analyzed at 24 and 32 °C.
Figure 6 shows that all emulsions present a thixotropic behavior at both working temperatures due to the position of the backward curve, which is placed under the forward curve, indicating that at the same shear rate, the shear stress for the descending curve is smaller. The thixotropic behavior is evaluated through two significant parameters: (1) the thixotropy area (Sthix) and (2) the thixotropy index (Thyst%). The quantitative equation of the thixotropy index is given by Equation (8):
In this equation, Sfwd represents the area enclosed under the forward rheograms. The Thyst% values higher than 5% are significant for a system to be considered thixotropic.
The values of the most important thixotropic parameters are presented in Table 7 for all the emulsions, analyzed at 24 °C and 32 °C.
Table 7.
Thixotropic parameters of emulsions, analyzed at 24 and 32 °C.
According to Table 7, all the values of the thixotropy index exceed 5%, indicating the thixotropic character of all four formulations for both temperatures [20]. It is important to mention that the values of the thixotropy area increase from Emulsion 1 (the least viscous) to Emulsion 4 (the most viscous) for both temperatures, in accordance with the viscosity values, described above. The rise in temperature from 24 °C to 32 °C led to a decrease of all thixotropic parameters for all tested emulsions. The evaluation of the thixotropic parameters represents a quality requirement followed in the design of the dermatocosmetic products, in order to allow their spreading on the skin surface.
3.2.6. Textural Analysis
Texture analysis is crucial in the formulation and evaluation of topical creams and hydrogels, widely used in pharmaceutical and cosmetic industries. The phenomenological significance of primary textural parameters such as cohesion, adhesion, hardness, springiness, and others, is deeply rooted in the microstructure and composition of the material being tested, particularly in complex systems like the O/W emulsions. These parameters are used to describe how the product behaves under certain conditions and can be critical for both product development and quality control [51].
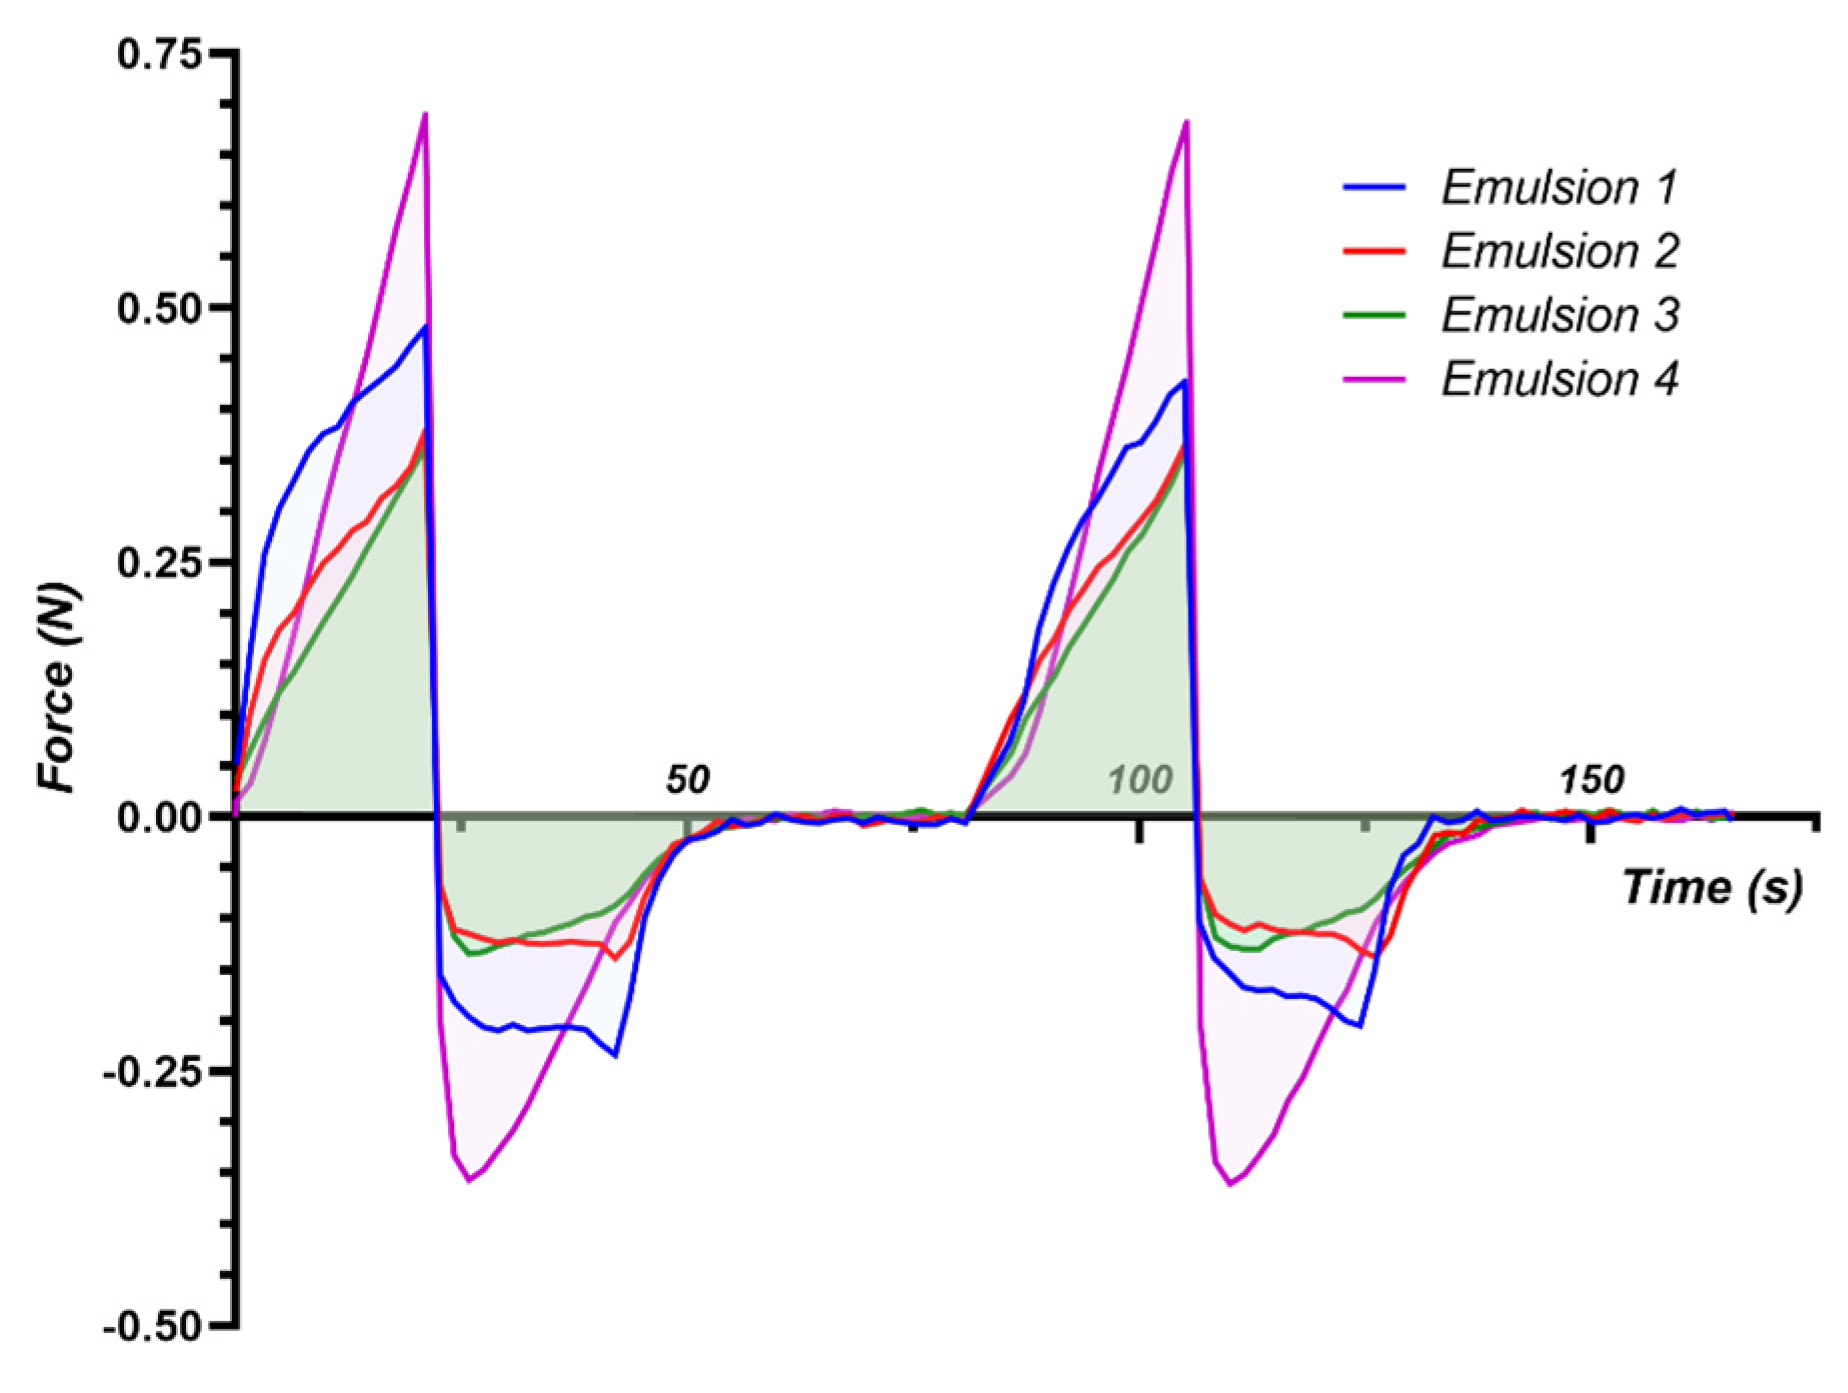
The four experimental emulsions were subjected to texture analysis and measurements are represented by plots of force vs. time (Figure 7) and force vs. distance traces (Figure 8).
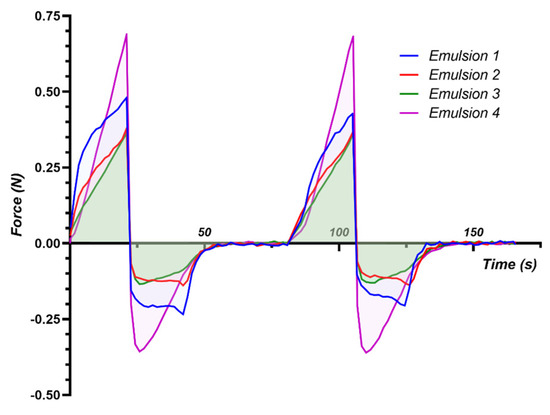
Figure 7.
Force vs. time average texture analysis traces obtained for the analyzed emulsions using a cylindrical 25 mm probe.
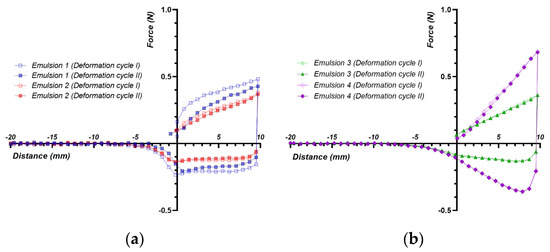
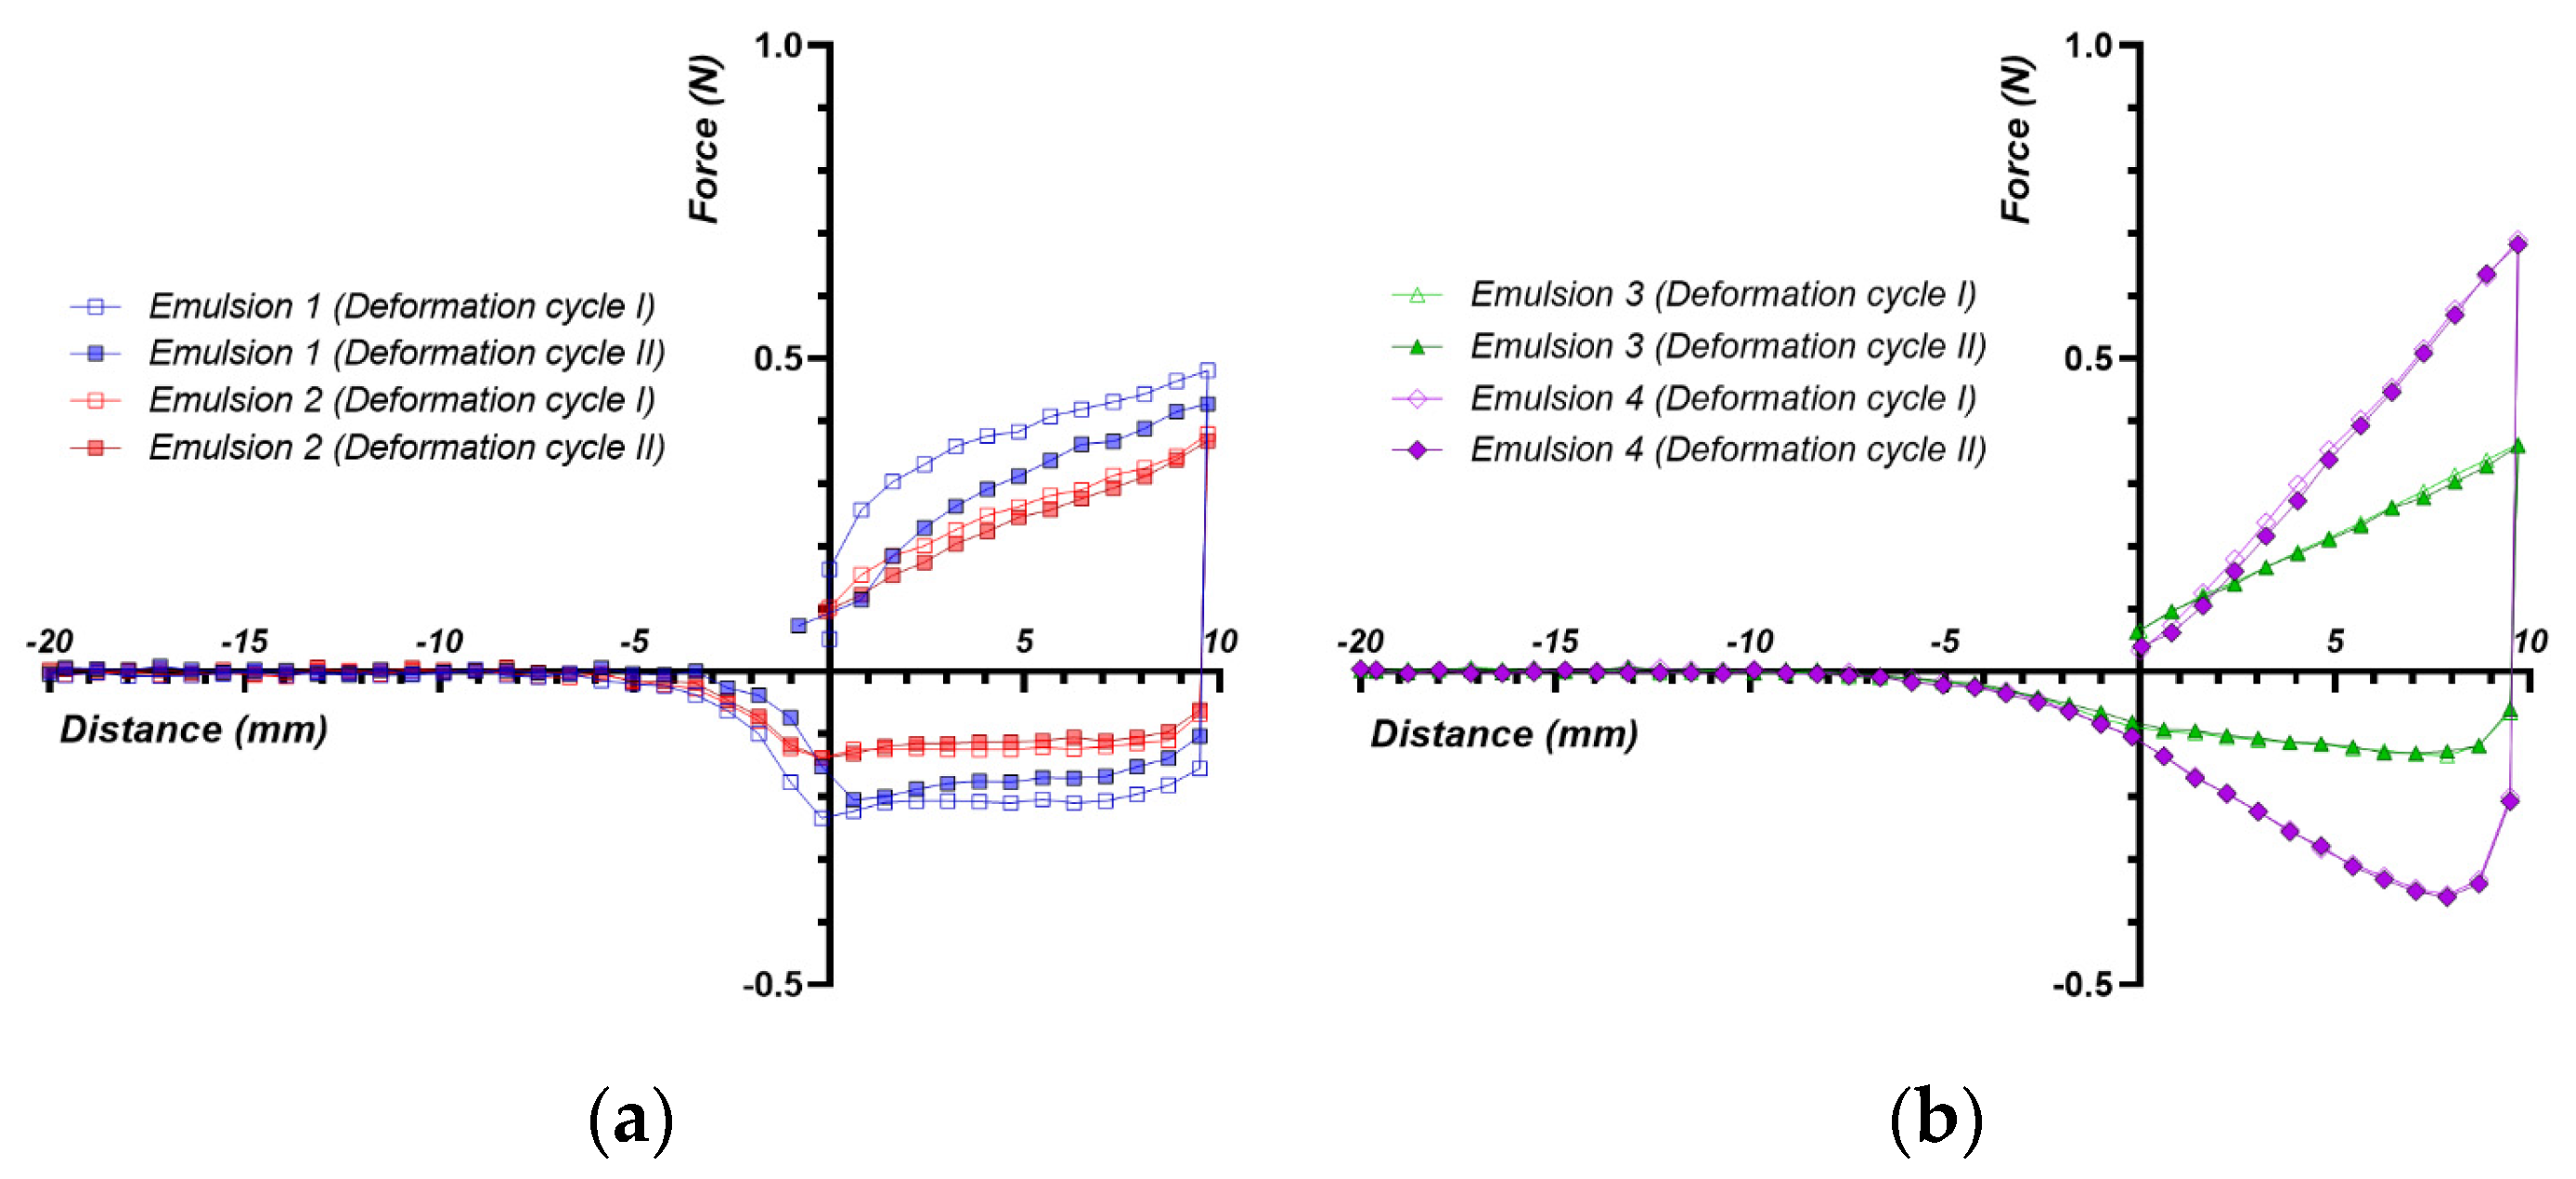
Figure 8.
Distance vs. time average texture analysis traces obtained for the analyzed emulsions using a cylindrical 25 mm probe; (a) emulsions 1 and 2; (b) emulsions 3 and 4.
Emulsion 4 demonstrates the least variation in force between the two compression cycles, indicating it might be the most stable emulsion under the applied stress conditions. Emulsion 1 shows the most considerable variation, which could suggest a less stable structure or a more yielding texture upon application of force. The negative forces observed for all emulsions suggest that they all exhibit some degree of elastic behavior, as they can resist and rebound from the applied force. Emulsion 4 might be considered to have the most stable texture, whereas emulsion 1 may have the firmest initial texture but also the most significant variation, which could be interpreted as less stability or a different structural composition.
For emulsion 1 and to a lesser extent emulsion 2, the initial part of the compression curve consists of two linear segments. Their intersection corresponds to the yield point (Y), i.e., the force value at which the gel ceases to be elastic and transforms to plastic, beginning to flow under the applied stress [52]. The ramp-up curve shape indicates yield transition at the highest force value (0.34 N) for emulsion 1 (thus requiring more force to initiate flow) and 0.19 N for emulsion 2, whereas for emulsions 3 and 4 the curve was linear, and presence of the yield transition could not be identified, possibly due to the higher amount of xanthan gum contained.
Another feature of the force vs. time traces that offers valuable information regarding the textural properties of the tested emulsions is the shape of the negative peak, which influences the adhesive properties of a product, i.e., the work required to overcome the attractive forces between the surface of the product and the surface it comes into contact with. Emulsions 3 and 4 show smooth and monotonous overall curves, whereas for emulsions 1 and 2 the curves become non-monotonous and show the presence of some unresolved shoulders, indicating a non-homogeneous behavior probably related to the internal microstructure, which makes it more difficult to spread the product evenly on the skin surface.
The force vs. time curves were used for calculation of the textural parameters such as hardness (assessed by the peak force encountered during the first compression), cohesiveness (measured as the ratio of the positive force area during the second compression to the positive force area during the first compression), springiness (calculated as the ratio of the recovery height during the relaxation period to the original compression height), adhesiveness (calculated from the negative area on the force–time curve during the probe’s withdrawal), as well as resilience (calculated as the ratio of the area under the curve during the relaxation phase to the area under the curve during the compression phase of the first deformation cycle) [53]. The values calculated for the 4 investigated emulsions are depicted in Table 8.
Table 8.
Textural parameters obtained for the investigated emulsions (Mean ± SD).
The comparison between the main texture parameters is presented in Figure 9.
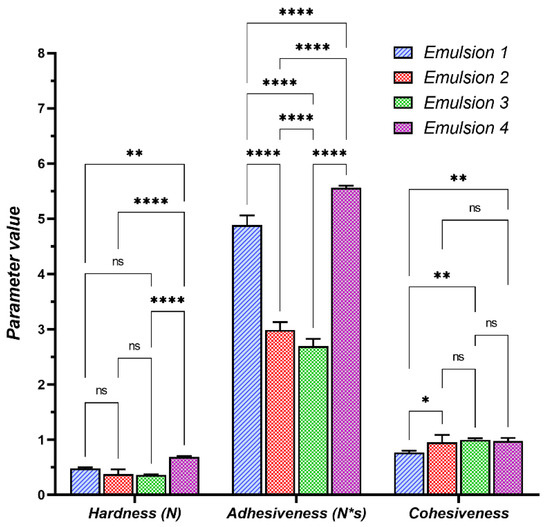
Figure 9.
Comparison on the hardness, adhesiveness and cohesiveness of the investigated emulsions. Significance levels: p > 0.05 (ns), p < 0.05 (*), p < 0.01 (**), p < 0.0001 (****).
Emulsion 4 might be considered to have the most stable texture, whereas emulsion 1 may have the firmest initial texture but also the most significant variation, which could be interpreted as less stability or a different structural composition. Emulsion 4 has the highest hardness (0.6892 N) and adhesiveness (5.5643 N*s), likely due to the combination of high amounts of avocado oil, the presence of both collagen and niacinamide, and the highest concentration of xanthan gum. This suggests a thicker, creamier product when applied to the skin (correlated also with the smooth aspect of the force vs. time curve) as well as good stability and less tendency to run or spread excessively upon application. The high adhesiveness could mean it has a higher tendency to form a thin film that adheres well to the skin, potentially enhancing the perceived duration of moisturization or active ingredient delivery.
Emulsions 1 and 4 have higher amounts of avocado oil, which has a more viscous texture, possibly also contributing to the higher hardness and adhesiveness in these emulsions. Emulsion 2 has a combination of avocado and almond oils, which could lead to a balanced texture, not as firm as an emulsion with avocado oil alone. Emulsion 3 contains jojoba oil, which has a lighter, less greasy feel, potentially contributing to its softer texture. Together with the high water content, presence of jojoba oil leads to Emulsion 3 having the lowest hardness among the four, which could translate to a lighter, more easily spreadable product.
Lower adhesiveness in emulsions 2 and 3 might indicate a product that is easier to wash off or one that imparts a less heavy feeling on the skin.
Emulsion 3 has the highest cohesiveness (0.9983), implying a very stable product that retains its structure during application, thus providing consistent performance over time and under various conditions. Emulsion 1′s lower cohesiveness (0.7717) may suggest a product that breaks down more easily when worked between the fingers or applied to the skin.
The similar high springiness across all emulsions indicates that they have a similar high ability to recover their shape after spreading, that could be indicative of how the product feels during application—a bouncy, light texture that is not too heavy or dragging on the skin. This phenomenon in emulsions may be due to a structured network within the continuous phase that can recover after deformation [54].
All emulsions have low resilience, which might indicate a more immediate release upon application, which could be beneficial for treatment products where quick absorption of active ingredients is desired. Low resilience suggests that the material does not bounce back to its original shape quickly, which implies that the deformation has a more lasting effect and that, once spread, they do not resist the spreading force and therefore do not return to their original shape, contributing to ease of spreading.
3.2.7. Saponification Value (SV)
The results obtained for saponification value are presented in Table 9.
Table 9.
The saponification value for the obtained emulsions.
Saponification value characterized the average molecular weight of the fatty acids from the oil composition. The saponification value is reverse proportional to the molecular weight of the fatty acids in the fat composition from the sample to be analyzed. Thus, a high saponification value proves the presence of low molecular weight fatty acids, and a low saponification value proves the presence of high molecular weight fatty acids [56].
Table 10 presents the approximate distribution of chain length and the unsaturation degree of the vegetable oils used in the preparation of the emulsions.
Table 10.
An approximate chain length distribution, the degree of unsaturation, molecular weight and percentage in composition of the vegetable oils used for preparation of emulsions [57,58,59,60].
The high saponification value was obtained for emulsions no. 1 and no. 4 which contain more avocado oil rich in mono unsaturated fatty acids with low molecular weight, while the values obtained for emulsions no. 2 and 3 are lower due to the mono unsaturated (for jojoba oil) and poly unsaturated (for almonds oil) fatty acids with high molecular weight from the oil’s composition.
3.2.8. Microbiological Tests
Microbial Contamination Control
Table 11 shows the results for microbiological results:
Table 11.
The results for microbial contamination: Total aerobic microbial count (TAMC) and Total combined yeast and molds count (TYMC) according to the European pharmacopoeia 10th edition.
The results obtained for TAMC and TYMC for tested emulsions are within admissible pharmacopeial limits for all samples. Also, there were no descriptive colonies of E. coli, S. aureus and P. aeruginosa in the specific media and therefore all samples were found to be free from those bacteria.
Calculation of the Antibacterial Activity Ratio, R%
Table 12.
Antibacterial activity ratio for Staphylococcus aureus ATCC 6538.
Table 13.
Antibacterial activity ratio for Escherichia coli ATCC 10536.
The antibacterial activity ratio, R% was 100% for all samples and after 24 h incubation all the samples presented 0 CFU/mL, which proves the efficiency of essential oil (Turkish pine) and preservative from the composition.
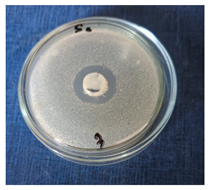
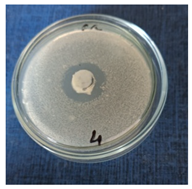
Inhibitory Activity of Escherichia coli and Staphylococcus aureus Strains
Table 14.
Inhibitory activity for Escherichia coli.
Table 15.
Inhibitory activity for Staphylococcus aureus.
All the tested samples presented a zone of inhibition higher than 1 mm, without any multiplication. The zone of inhibition size is usually related to the antimicrobial activity level present in the sample or product, and a large zone of inhibition usually means that the antimicrobial is more potent. In this case, the high values for zone of inhibition were obtained for emulsions no. 1 and no. 2.
4. Conclusions
In this study, some O/W cosmetic emulsions were prepared using hydrolysate collagen (the most abundant protein in the skin, promoting wound healing and tissue regeneration), niacinamide (with a role in preventing dermal collagen loss related to photoaging, and ameliorating acne), mixtures of vegetable oils, essential oil, and other natural ingredients.
All obtained emulsions proved to be stable at varying temperatures and had a pH value compatible with that of the skin, allowing their safe application. Emulsions no. 3 and no. 4 are the most hydrated as they are highest in water and volatile substance content. Optical microscopy analysis indicates that all emulsions have a “foam-like”, slightly aerated appearance.
Regarding the saponification values, they are reverse proportional to the molecular weight of the fatty acids in the fat composition; the highest values were obtained for emulsion no 4 and no 1 rich in mono unsaturated fatty acids with low molecular weight.
Over goniometric analysis, a partial wetting and a hydrophilic character of the emulsions were emphasized. The variation in the oil concentration was found to be one of the critical contributors to the emollient effect of cosmetic emulsions.
As a result of rheological analysis, all dermatocosmetic emulsions presented a non-Newtonian pseudoplastic behavior, quantified through the Power Law Model and a thixotropic character, these properties being very important for their production process and their application on the skin surface in order to generate an optimal therapeutic effect.
The textural characteristics recorded for all emulsions indicated an adequate spreadability at the application site.
The low levels of microbiological contamination in samples tested are due to the application of Current Good Manufacturing Practice (CGMP), effective preservative agents (Cosgard preservative and Turkish pine essential oil) and suitable quality control; all the tested samples complied with the pharmacopeial limits of microbiological contamination.
In conclusion, all the emulsions prepared have good stability, and exhibit adequate physical–chemical and microbiological characteristics; therefore, they can be used as a cosmeceutical product. In the future, clinical trials and other tests are necessary for the designed emulsions.
Author Contributions
Conceptualization, E.D. and M.V.G.; methodology, E.D. and D.A.K.; validation, D.A.K., A.E.C., M.G.A.K. and M.V.G.; formal analysis, E.D., V.A., L.P., C.C., R.R.C., C.D.-P. and M.V.G.; investigation, E.D., V.A., L.P., C.C., R.R.C. and C.D.-P.; data curation, E.D.; writing—original draft preparation, E.D. and D.A.K.; writing—review and editing, E.D., M.G.A.K. and M.V.G.; visualization, A.E.C.; supervision, V.A., L.P., C.D.-P. and M.G.A.K.; project administration, E.D. All authors have read and agreed to the published version of the manuscript.
Funding
This research was funded by Ministry of Research, Innovation and Digitalization, grant number PN 23 26 01 01/2023 and 4PFE/2021 and by “Carol Davila” University of Medicine and Pharmacy, Bucharest, Romania through Contract no. 33PFE/30.12.2021.
Institutional Review Board Statement
Not applicable.
Informed Consent Statement
Not applicable.
Data Availability Statement
The data presented in this study are available on request from the corresponding author. The data are not publicly available due to the preparation of another paper.
Conflicts of Interest
The authors declare no conflicts of interest.
References
- Talianu, M.-T.; Dinu-Pîrvu, C.-E.; Ghica, M.V.; Anuta, V.; Jinga, V.; Popa, L. Foray into concepts of design and evaluation of microemulsions as a modern approach for topical applications in acne pathology. Nanomaterials 2020, 10, 2292. [Google Scholar] [CrossRef] [PubMed]
- Kligman, A. The future of cosmeceuticals: An interview with Albert Kligman, MD, Ph.D. Interview by Zoe Diana Draelos. Dermatol. Surg. 2005, 31, 890–891. [Google Scholar] [PubMed]
- Grace, R. Cosmeceuticals: Functional food for the skin. Nat. Foods Merch. 2002, 23, 92–99. [Google Scholar]
- Draelos, Z.D. The cosmeceutical realm. Clin. Dermatol. 2008, 26, 627–632. [Google Scholar] [CrossRef] [PubMed]
- Singhal, M.; Khanna, S.; Nasa, A. Cosmeceuticals for the skin: An overview. Asian J. Pharm. Clin. Res. 2011, 4, 6. [Google Scholar]
- Rodríguez, M.; Rodriguez, I.A.; Barrosso, L.G.R.; Sánchez, M.L. Collagen: A review on its sources and potential cosmetic applications. J. Cosmet. Dermatol. 2017, 17, 20–26. [Google Scholar] [CrossRef]
- Leon-Lopez, A.; Morales-Penaloza, A.; Martinez-Juarez, V.; Vergas-Torres, A.; Zeugolis, D.; Aguirre-Alvarez, G. Hydrolyzed collagen—Sources and applications. Molecules 2019, 24, 4031. [Google Scholar] [CrossRef]
- Bhagwat, P.; Dandge, P.B. Isolation, characterization and valorizable applications of fish scale collagen in food and agriculture industries. Biocatal. Agric. Biotechnol. 2016, 7, 234–240. [Google Scholar] [CrossRef]
- Loden, M. Role of topical emollients and moisturizers in the treatment of dry skin barrier disorders. Am. J. Clin. Dermatol. 2003, 4, 771–788. [Google Scholar] [CrossRef]
- Sionkowska, A.; Adamiak, K.; Musiał, K.; Gadomska, M. Collagen based materials in cosmetic applications: A Review. Materials 2020, 13, 4217. [Google Scholar] [CrossRef]
- Ghica, M.V.; Albu, M.G.; Kaya, D.A.; Popa, L.; Öztürk, Ş.; Rusu, L.-C.; Dinu-Pirvu, C.; Chelaru, C.; Albu, L.; Meghea, A.; et al. The effect of Lavandula essential oils on release of niflumic acid from collagen hydrolysates. Korean J. Chem. Eng. 2016, 33, 1325–1330. [Google Scholar] [CrossRef]
- Gensler, H.L. Prevention of photoimmunesuppression and photocarcinogenesis by topical niacinamide. Nutr. Cancer 1997, 29, 157–162. [Google Scholar] [CrossRef]
- Yu, J.M.; Liu, Y.; Xie, N.; Sun, W.; Wang, J.J.; Li, H.Q. Effects of nicotinamide on levels of dermis hydroxyproline in photoaging skin. Huanjing Yu Jiankang Zazhi J. Environ. Health 2002, 19, 102–104. [Google Scholar]
- Berk, M.A.; Lorincz, A.L. The treatment of bullous pemphigoid with tetracycline and niacinamide: A preliminary report. Arch. Dermatol. 1986, 122, 670–674. [Google Scholar] [CrossRef]
- Hakozaki, T.; Minwalla, L.; Zhuang, J.; Chhoa, M.; Matsubara, A.; Miyamoto, K.; Greatens, A.; Hillebrand, G.G.; Bissett, D.L.; Boissy, R.E. The effect of niacinamide on reducing cutaneous pigmentation and suppression of melanosome transfer. Br. J. Dermatol. 2002, 147, 22–33. [Google Scholar] [CrossRef]
- Trandafir, V.; Popescu, G.; Albu, M.G.; Iovu, H.; Georgescu, M. Collagen Extraction Techniques; Ars Docendi: Bucharest, Romania, 2007; Chapter 4; pp. 111–112. (In Romanian) [Google Scholar]
- Griffin, W.C. Classification of surface-active agents by “HLB”. J. Cosmet. Sci. 1949, 1, 311–326. [Google Scholar]
- STAS 10998-88; Emulsions and Cosmetic Creams. Methods of Analysis. The Romanian Standardization Institute: Bucharest, Romania, 2014.
- Anicescu, M.C.; Dinu-Pîrvu, C.E.; Talianu, M.T.; Ghica, M.V.; Anuța, V.; Prisada, R.M.; Nicoară, A.C.; Popa, L. Insights from a Box-Behnken Optimization Study of Microemulsions with Salicylic Acid for Acne Therapy. Pharmaceutics 2022, 14, 174. [Google Scholar] [CrossRef] [PubMed]
- Dănilă, E.; Albu Kaya, M.G.; Ghica, M.V.; Bunea, A.-M.; Popa, L.; Kaya, D.A.; Öztürk, Ş.; Marin, M.-M.; Dinu-Pîrvu, C.-E.; Anuța, V. Formulation and Characterization of Anti-Aging Cosmetic Emulsions Based on Collagen Hydrolysate and Caffeine. In Proceedings of the ICAMS 2020—8th International Conference on Advanced Materials and Systems, Bucharest, Romania, 1–3 October 2020; pp. 139–144. [Google Scholar]
- Tudoroiu, E.E.; Albu Kaya, M.G.; Titorencu, I.; Dinu-Pîrvu, C.E.; Marin, M.M.; Roșca, A.M.; Popa, L.; Anuța, V.; Antoniac, A.; Chelaru, C.; et al. Design and evaluation of new wound dressings based on collagen-cellulose derivatives. Mater. Des. 2023, 236, 112469. [Google Scholar] [CrossRef]
- Ghica, M.V.; Hirjau, M.; Lupuleasa, D.; Dinu-Pirvu, C. Flow and Thixotropic Parameters for Rheological Characterization of Hydrogels. Molecules 2016, 21, 786. [Google Scholar] [CrossRef]
- Szulc-Musioł, B.; Siemiradzka, W.; Dolińska, B. Formulation and evaluation of hydrogels based on sodium alginate and cellulose derivatives with quercetin for topical application. Appl. Sci. 2023, 13, 7826. [Google Scholar] [CrossRef]
- EN ISO 20743; Textiles—Determination of Antibacterial Activity of Antibacterial Finished Products. International Organization for Standardization: Geneva, Switzerland, 2007.
- Madaan, V.; Chanana, A.; Kumar, K.; Bilandia, M. Emulsion technology and recent trends in emulsion applications. Int. Res. J. Pharm. 2014, 5, 533–542. [Google Scholar] [CrossRef]
- Khan, A.Y.; Talegaonkar, S.; Iqbal, Z.; Jalees Ahmed, F.; Khar, R.K. Multiple emulsions: An overview. Curr. Drug Deliv. 2006, 3, 429–443. [Google Scholar] [CrossRef]
- Anghelache, A.M.; Kim, L.; Cuciureanu, A.; Batrinescu, G.; Pascu, L.F. Rheological properties and stability of squalene emulsion prepared with non-ionic emulsifier. Rev. Chim. 2017, 68, 1681–1684. [Google Scholar] [CrossRef]
- Dănilă, E.; Moldovan, Z.; Albu Kaya, M.G.; Ghica, M.V. Formulation and characterization of some oil in water cosmetic emulsions based on collagen hydrolysate and vegetable oils mixtures. Pure Appl. Chem. 2019, 91, 1493–1507. [Google Scholar] [CrossRef]
- Fares, M.M.; Radaydeh, S.K.; AlAmeen, H.M. Green Tannins/Avocado Oil Composites; Suncare and Skincare Materials. Arab. J. Chem. 2023, 16, 104764. [Google Scholar] [CrossRef]
- Ahmad, Z. The uses and properties of almond oil. Complement. Ther. Clin. Pract. 2010, 16, 10–12. [Google Scholar] [CrossRef]
- Colucci, G.; Santamaria-Echart, A.; Silva, S.C.; Fernandes, I.P.M.; Sipoli, C.C.; Barreiro, M.F. Development of water-in-oil emulsions as delivery vehicles and testing with a natural antimicrobial extract. Molecules 2020, 25, 2105. [Google Scholar] [CrossRef]
- Assaf, S.M.; Maaroof, K.T.; Altaani, B.M.; Ghareeb, M.M.; Abu Alhayyal, A.A. Jojoba oil-based microemulsion for transdermal drug delivery. Res. Pharm. Sci. 2021, 16, 326–340. [Google Scholar] [CrossRef] [PubMed]
- Choi, J.; Yang, D.; Moon, M.Y.; Han, G.Y.; Chang, M.S.; Cha, J. The protective effect of Hamamelis virginiana stem and leaf extract on fine dust-induced damage on human keratinocytes. Cosmetics 2021, 8, 119. [Google Scholar] [CrossRef]
- Available online: https://www.ellemental.com/859-limewater-tilia-vulgaris-organic.html (accessed on 17 October 2023).
- Smaoui, S.; Hlima, H.B.; Jarraya, R.; Grati Kamoun, N.; Ellouze, R.; Damak, M. Cosmetic emulsion from virgin olive oil: Formulation and biophysical evaluation. Afr. J. Biotechnol. 2012, 11, 9664. [Google Scholar]
- Wangpradit, N.; Macha, S.; Phooteh, N.; Yusohyo, N.; Waedoloh, A.; Manee, S. Determination of required hydrophilic-lipophilic balance of Amesiodendron chinense (Merr.) Hu oil and development of stable cream formulation. Oilseeds Fats 2022, 29, 8. [Google Scholar] [CrossRef]
- Krstonošić, V.; Dokić, L.; Nikolić, I.; Milanović, M. Influence of xanthan gum on oil-in-water emulsion characteristics stabilized by OSA starch. Food Hydrocoll. 2015, 45, 9–17. [Google Scholar] [CrossRef]
- Da Silva Santos, V.; Deschamps Fernandes, G. Chapter 37—Cold pressed avocado (Persea americana Mill.) oil. In Cold Pressed Oils: Green Technology, Bioactive Compounds, Functionality, and Applications; Ramadan, M.F., Ed.; Academic Press: London, UK, 2020; pp. 405–428. [Google Scholar]
- Ouzir, M.; El Bernoussi, S.; Tabyaoui, M.; Taghzouti, K. Almond oil: A comprehensive review of chemical composition, extraction methods, preservation conditions, potential health benefits, and safety. Compr. Rev. Food Sci. Food Saf. 2021, 20, 3344–3387. [Google Scholar] [CrossRef]
- Gad, H.A.; Roberts, A.; Hamzi, S.H.; Gad, H.A.; Touiss, I.; Altyar, A.E.; Kensara, O.A.; Ashour, M.L. Jojoba Oil: An Updated Comprehensive Review on Chemistry, Pharmaceutical Uses, and Toxicity. Polymers 2021, 13, 1711. [Google Scholar] [CrossRef]
- Femenia, A. High-value co-products from plant foods: Cosmetics and pharmaceuticals. In Handbook of Waste Management and Co-Product Recovery in Food Processing; Woodhead Publishing Limited: Cambridge, UK, 2007; Volume 1, pp. 470–501. [Google Scholar]
- De Oliveira, A.C.; Morocho-Jácome, A.L.; de Castro Lima, C.R.; Marques, G.A.; de Oliveira Bispo, M.; de Barros, A.B.; Costa, J.G.; de Almeida, T.S.; Rosado, C.; de Carvalho, J.C.; et al. Chapter 10—Cosmetics Applications. In Microalgae: Cultivation, Recovery of Compounds and Applications; Galanakis, C.M., Ed.; Academic Press: London, UK, 2020; pp. 313–332. [Google Scholar]
- Turcov, D.; Barna, A.S.; Blaga, A.C.; Ibanescu, C.; Danu, M.; Trifan, A.; Zbranca, A.; Suteu, D. Dermatocosmetic Emulsions Based on Resveratrol, Ferulic Acid and Saffron (Crocus sativus) Extract to Combat Skin Oxidative Stress-Trigger Factor of Some Potential Malignant Effects: Stability Studies and Rheological Properties. Pharmaceutics 2022, 14, 2376. [Google Scholar] [CrossRef] [PubMed]
- Dimitrova, T.D.; Leal-Calderon, F. Rheological properties of highly concentrated protein-stabilized emulsions. J. Colloid Interface Sci. 2004, 108, 49–61. [Google Scholar] [CrossRef] [PubMed]
- Kwak, M.-S.; Ahn, H.-J.; Song, K.-W. Rheological investigation of body cream and body lotion in actual application conditions. Korea Aust. Rheol. J. 2015, 27, 241–251. [Google Scholar] [CrossRef]
- Izidoro, D.R.; Scheer, A.d.P.; Sierakowsk, M.-R. Rheological properties of emulsions stabilized by green banana (Musa cavendishii) pulp fitted by power law model. Braz. Arch. Biol. Technol. 2009, 52, 1541–1553. [Google Scholar] [CrossRef]
- Zheng, T.; Tang, P.; Shen, L.; Bu, H.; Li, G. Rheological behavior of collagen/chitosan blended solutions. J. Appl. Polym. Sci. 2021, 138, 50840. [Google Scholar] [CrossRef]
- Amoo, L.M.; Layi Fagbenle, R. Overview of non-newtonian boundary layer flows and heat transfer. In Applications of Heat, Mass and Fluid Boundary Layers; Fagbenle, R.O., Amoo, O.M., Aliu, S., Falana, A., Eds.; Woodhead Publishing: Cambridge, UK, 2020; pp. 413–435. [Google Scholar]
- Dănilă, E.; Kaya, D.A.; Ghica, M.V.; Albu Kaya, M.G.; Negrea, C.; Popa, L.; Nitipir, C. Rheological properties and stability of dermatocosmetic emulsions with collagen and natural ingredients used as color correcting cream and cream foundation. Rev. Chim. 2019, 70, 1928–1933. [Google Scholar] [CrossRef]
- Zanna, N.; Tomasini, C. Peptide-based physical gels endowed with thixotropic behaviour. Gels 2017, 3, 39. [Google Scholar] [CrossRef] [PubMed]
- Tai, A.; Bianchini, R.; Jachowicz, J. Texture analysis of cosmetic/pharmaceutical raw materials and formulations. Int. J. Cosmet. Sci. 2014, 36, 291–304. [Google Scholar] [CrossRef] [PubMed]
- Tamburic, S.; Stevic, M.; Sisson, H. Rheological and texture analysis methods for the assessment of viscoelasticity. SOFW J. 2018, 144, 20–25. [Google Scholar]
- Nishinari, K.; Kohyama, K.; Kumagai, H.; Funami, T.; Bourne, M.C.J.F.S.; Research, T. Parameters of texture profile analysis. Food Sci. Technol. Res. 2013, 19, 519–521. [Google Scholar] [CrossRef]
- Poling-Skutvik, R.; Di, X.; Osuji, C.O. Correlation of droplet elasticity and volume fraction effects on emulsion dynamics. Soft Matter 2020, 16, 2574–2580. [Google Scholar] [CrossRef]
- STAS 1445; Fats and Oils of Animal and Vegetable Origin. Determination of the Saponification Index. The Romanian Standardization Institute: Bucharest, Romania, 1998.
- Ivanova, M.; Hanganu, A.; Dumitriu, R.; Tociu, M.; Ivanov, G.; Stavarache, C.; Popescu, L.; Ghendov-Mosanu, A.; Sturza, R.; Deleanu, C.; et al. Saponification value of fats and oils as determined from H-NMR data: The case of dairy fats. Foods 2022, 11, 1466. [Google Scholar] [CrossRef]
- Douati, T.E.; Konan N’Guessan, Y.; Coulibaly, A.; Sidibe, D.; Biego Godi, H.M. Nutritive components in the Terminalia catappa L. Combretaceae) almonds cultivated in côte d’ivoire. J. Appl. Life Sci. Int. 2017, 12, 1–10. [Google Scholar]
- Flores, M.; Saravia, C.; Vergara, C.E.; Avila, F.; Valdés, H.; Ortiz-Viedma, J. Avocado oil: Characteristics, properties, and applications. Molecules 2019, 24, 2172. [Google Scholar] [CrossRef]
- Busson-Breysse, J.; Farines, M.; Soulier, J. Jojoba wax: Its esters and some of its minor components. J. Am. Oil Chem. Soc. 1994, 71, 999–1002. [Google Scholar] [CrossRef]
- Zielińska, A.; Nowak, I. Fatty acids in vegetable oils and their importance in cosmetic industry. Chemik 2014, 68, 103–110. [Google Scholar]


Disclaimer/Publisher’s Note: The statements, opinions and data contained in all publications are solely those of the individual author(s) and contributor(s) and not of MDPI and/or the editor(s). MDPI and/or the editor(s) disclaim responsibility for any injury to people or property resulting from any ideas, methods, instructions or products referred to in the content. |
© 2024 by the authors. Licensee MDPI, Basel, Switzerland. This article is an open access article distributed under the terms and conditions of the Creative Commons Attribution (CC BY) license (https://creativecommons.org/licenses/by/4.0/).