Review

Meta-Analysis and Analytical Methods in Cosmetics Formulation: A Review

by
Felipe Rico
1,
Angela Mazabel
1,
Greciel Egurrola
1,
Juanita Pulido
1,
Nelson Barrios
2,
Ronald Marquez
2,* and
Johnbrynner García
1,*
1
Belcorp, Research, Development & Innovation, Tocancipa 251017, Colombia
2
Department of Forest Biomaterials, North Carolina State University, Raleigh, NC 27607, USA
*
Authors to whom correspondence should be addressed.
Cosmetics 2024, 11(1), 1; https://doi.org/10.3390/cosmetics11010001
Submission received: 20 November 2023 / Revised: 4 December 2023 / Accepted: 11 December 2023 / Published: 19 December 2023
(This article belongs to the Special Issue Advanced Cosmetic Sciences: Sustainability in Materials and Processes)

Abstract

:
The ever-evolving cosmetic industry requires advanced analytical techniques to explore, understand, and optimize product performance at nano, micro, and macroscopic levels. Nowadays, these insights are crucial for translating microstructure behavior into macroscopic properties. This knowledge is essential to formulate products with a lower carbon footprint and a higher sustainability profile, incorporating, at the same time, natural or biobased raw materials. These raw materials may present challenges for formulators and analytical scientists due to either an inferior performance when compared to their fossil-derived counterparts or higher costs. This comprehensive review covers a spectrum of analytical methodologies employed in cosmetic formulation, including chromatographic analyses, olfactometry, and electronic nose technology. The characterization of product stability involving assessing parameters such as droplet size, zeta potential, viscosity, analytical centrifugation, surface tension, and interfacial tension are also explored. The discussion in this paper extends to the role of rheology in understanding the molecular structure and behavioral dynamics of cosmetic samples. This review concludes with an overview of colorimetric analysis, a crucial aspect related to consumer perception, followed by a discussion on the challenges and opportunities associated with using meta-analysis methodologies in cosmetics. The formulation of cosmetics employing biobased feedstocks is included, highlighting the evolving landscape of cosmetic science and the integration of sustainable practices. This review stands at the interface between a meta-analysis of cosmetics and product performance, which is attained through a detailed examination of each analytical method. The know-how shared serves as a valuable resource for formulators, researchers, and industry professionals for real-world applications in the analytical field of cosmetics formulation.

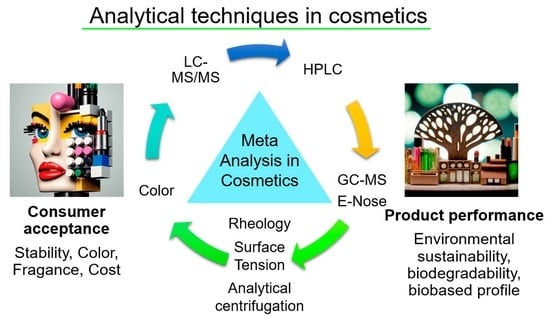
Graphical Abstract

1. Introduction

The Perfume, Cosmetic, and Toiletry (PCT) industry dates back to the use of cosmetics by ancient civilizations, with the Egyptians, Greeks, and Romans being one of the first societies to extensively employ cosmetics for both aesthetic and functional purposes [1,2,3]. Neanderthal men utilized natural pigments for face painting, while the Romans employed oil-based perfumes. The Egyptians, around 4000 BC, were known for their extensive use of cosmetics for both aesthetic and functional purposes, with examples such as the lead-based kohl which was later used by Cleopatra. Then, significant milestones were attained in France during the Renaissance period, where perfumeries began crafting intricate formulations, and evolved with the 19th century seeing a transition to chemical ingredients [4]. The 20th century marked a period of rapid growth and technological innovations with the birth of iconic companies like Estée Lauder, L’Oréal, and Shiseido, who became pioneers in cosmetics R&D and marketing. Noteworthy is the industry’s adaptability and growth, even amidst global challenges such as the COVID-19 pandemic [5].

1.1. Industry Overview

In 2023, the global beauty market was valued at ca. USD 625.7 billion, with a projected CAGR (compound annual growth rate) of 3.3% from 2023 to 2028 [6]. When referring to the cosmetic industry, the latter is often misinterpreted as solely comprising the color cosmetic or makeup segments, while, in reality, these account for just over 18% of the entire personal care market. The industry itself is diverse, with various segments including skincare, haircare, fragrances, and more. The U.S. remains a significant market, but a noticeable shift towards developing regions like South America, Eastern Europe, and Asia has been observed and is projected to reach a value of USD 126.52 billion by 2025, growing at a CAGR of 9.3% from 2020 to 2025 [6]. Moreover, sustainability trends in 2023 have emphasized the use of biobased raw materials, eco-friendly packaging, and ingredient transparency, reflecting the industry’s response to consumer demands for sustainability [7,8]. The Cosmetic, Toiletry, and Fragrance Association (CTFA) and Cosmetic Ingredient Review (CIR) are among the organizations ensuring the scientific, legal, and regulatory adherence of cosmetic firms, promoting a culture of safety and transparency. As of 2022, the top 10 cosmetic companies held a market share of 62.8% of the global cosmetics market, reflecting a high concentration level within the industry [6]. Evolving consumer preferences, growing awareness related to the sustainability megatrend, and the rise of e-commerce are among the factors driving the growth of the PCT industry [7]. These industry leaders have maintained growth by employing strategies like product innovation, core brand re-marketing, and geographical expansion, particularly in high-growth regions like Asia, Latin America, and Eastern Europe.

1.2. The Importance of Instrumental Techniques in Cosmetics R&D

The development of instrumental methods marked a transformational shift in the cosmetics domain. Techniques such as high-performance liquid chromatography (HPLC) and gas chromatography–mass spectrometry (GC-MS) emerged as crucial tools for both quality control and gaining valuable insights into formulations. They enabled a thorough exploration of molecular composition, which allows for an understanding of interactions at a microscopic level, elucidating macroscopic properties such as viscosity, rheology, and solubility, which are pivotal to product performance [2,9,10].
Macroscopic properties constitute a spectrum of characteristics crucial for the practical application and performance of cosmetic products. These properties are significantly influenced by molecular and microscopic interactions, formulation strategies, and material choices [11]. These properties allow to gain insights into the texture, hydration potential, Sun Protection Factor (SPF), and longevity of cosmetics, to name a few [12].
The 20th century has witnessed remarkable advancements in the cosmetics industry. State-of-the-art analytical methods, the incorporation of novel active ingredients, and complex formulation strategies have all contributed to the rise of high-performance cosmetics [5,10]. Purity assessment assumed a central role with the inclusion of active molecules aimed at enhancing organoleptic properties like the fragrance and texture of cosmetics [9,13]. A significant paradigm shift observed in recent times is the transition from petrochemical-derived ingredients to biobased and naturally sourced alternatives. This transition is related to the sustainability megatrend and the demand for cleaner, safer, and better-performing formulations [11,14].
One case study highlighting the importance of analytical techniques in cosmetics is demonstrated by the detailed analysis of parabens, a common preservative in over 22,000 products, initially claimed as having low toxicity and general non-mutagenicity [15]. Advanced analytical methods enabled the understanding biological interactions of parabens, particularly their reproductive and estrogenic effects, leading to a trend in which parabens are being substituted by other less harmful compounds.

1.3. Meta-Analysis of Cosmetics

Several papers and reviews highlight the evolution and application of analytical techniques in cosmetics, correlating microstructure to macroscopic properties. The topics of these works range from the formulation development of emulsions [16] to modern techniques for sample preparation in cosmetics analysis [17], surface science in cosmetic formulations and its impact on product performance [11]. Moreover, new ingredients are being explored, and their microscopic properties and translation into macroscopic performance are being studied [18,19]. Nevertheless, there is a gap in the literature related to the application of a comprehensive analytical framework in cosmetics characterization, a so-called meta-analysis. A meta-analysis of cosmetics refers to a comprehensive and integrative approach that synthesizes findings from diverse analytical methodologies to provide a holistic understanding of cosmetic products. The meta-analysis of cosmetics involves the steps summarized in Table 1.

1.4. Literature Review Methodology

We analyzed 257 publications from the Dimensions and Scopus databases, selecting 190 which met the specified criteria. The search utilized the keywords “cosmetic”, “analysis”, “stability”, and “formulation”. To ensure rigor in our methodology, we adopted the Preferred Reporting Items for Systematic Reviews and Meta-Analyses (PRISMA) guidelines [20]. The PRISMA process entailed searching the Dimensions and Scopus digital libraries, removing duplicates, conducting initial screenings of paper abstracts, collating relevant full articles, and performing in-depth analyses of each selected article. Each manuscript was meticulously coded for specific information, including paper title, authors, publication year, context, methodology, and relevance to methods of analysis in cosmetics. The search incorporated peer-reviewed journal articles written in English and published between 2005 and 2023 (Figure 1). The resulting bibliographic data were analyzed using the VoSviewer text analytics module, which facilitated the creation of a visual representation of the bibliographic connections between keywords. In this visualization, the weight of the circles and lines denotes the number of publications, citations and collaborations, and the overall significance of the research output, as shown in Figure 2.

1.5. Structure of the Review

This review is structured into seven sections, each focusing on analytical and instrumental techniques for the evaluation of cosmetics. Section 2 includes an overview of the meta-analysis and analytical methods in cosmetics. Section 3 discusses chromatographic analysis, subdivided into liquid chromatography and gas chromatography. Following this, Section 4 covers olfactometry and electronic nose technology. Section 5 is dedicated to the characterization and evaluation of cosmetic products stability, including droplet size, zeta potential, viscosity, analytical centrifugation, and surface and interfacial tension. Section 6 focuses on rheology and its key role in understanding the link between the microstructure and performance of cosmetics, particularly in dispersed systems. In Section 7, colorimetric analysis in cosmetics formulation is presented, covering topics such as color and its conformational elements and the metric of color. Finally, Section 8 and 9 presents challenges and opportunities related to the measurement of cosmetic products incorporating biobased materials in their matrices, and conclusions and perspectives.

2. Analytical Methods in Cosmetics

In the field of cosmetic analysis, several analytical techniques play a crucial role, each tailored to meet specific requirements to understand the molecular nature of cosmetic products and the complexity of their formulations. In this comprehensive review, the primary emphasis is on specific techniques for conducting meta-analyses of cosmetic matrices. These techniques can be broadly classified into five main categories: chromatographic methods, spectroscopic methods, interfacial methods, rheology, and other specialized techniques. Chromatographic methods, such as LC-MS/MS (liquid chromatography–mass spectrometry/mass spectrometry) and GC-MS (gas chromatography–mass spectrometry), offer the remarkable capability to separate and identify complex mixtures within cosmetic formulations. Additionally, electronic nose technology has gained prominence in scent analysis, allowing for the characterization of fragrance components. Interfacial techniques encompass critical measurements such as surface and interfacial tension. Furthermore, the determination of emulsion stability, which can be assessed through analytical ultracentrifugation, provides valuable insights into the lifetime of emulsions. Rheology, the study of flow and deformation properties, also plays a crucial role in understanding the structural behavior of cosmetic products. Spectroscopic methods, including colorimetry, offer rapid and non-invasive means of analysis, primarily employed for color measurement within cosmetic formulations. These techniques collectively provide a comprehensive toolkit for meta-analysis in cosmetics. They facilitate a profound understanding of the molecular composition and microstructure of cosmetic products and help elucidate their impact on macroscopic properties. This holistic approach to cosmetic analysis is essential for ensuring product quality and performance. In Table 2, a comprehensive comparison of the advantages, limitations, and recent developments of chromatographic and spectroscopic methods is presented. The advancements in cosmetic measurement techniques are not only technical but also align with the broader objectives of efficiency, environmental sustainability, and adaptability.
To provide a comparative understanding of these techniques, we introduce a radar chart with a scale from 1 to 5 in Figure 3, including aspects such as cost, specificity, ease of use, precision, environmental impact, and equipment requirements. Each technique is assigned a qualitative score for each category, reflecting its strengths and limitations. For example, LC-MS/MS may score highly in specificity and sensitivity but lower in cost and ease of use. In contrast, HPLC might score higher in ease of use and accessibility. This enables the emphasis on the practical implications and applicability of each technique in diverse scenarios.

3. Chromatographic Analysis

Chromatography is one of the most used separation techniques in the cosmetics industry, specifically utilized for qualitative and quantitative analysis of formulation components. Various types of chromatography are known, among them liquid chromatography (LC) and gas chromatography (GC), both coupled to different detectors (UV, DAD, MS, MS/MS), as these two techniques are characterized by the sensitivity, robustness, and reproducibility of their methods [21]. In complex matrices such as cosmetic products, methodologies that allow for the separation and analysis of mixtures are useful for formulation and product innovation [22,23].

3.1. Liquid Chromatography

The basic principle of liquid chromatography is founded on the differing affinities that analytes in a mixture have towards the adsorbent material in the column or in the mobile phase. This difference causes the components to travel at varied speeds, leading to their separation [24]. Liquid chromatography encompasses various types of separation mechanisms, notably, reverse-phase and normal-phase chromatography. Additionally, less common methodologies are reported, such as ion exchange chromatography for contaminants like N-nitrosodiethanolamine (NDELA), a type of nitrosamine and potential human carcinogen which can form in cosmetic products [25,26]. Size exclusion chromatography methods are also documented, for instance, for the analysis of hyaluronic acid [27]. Following the separation of analytes in the column, they are detected by a coupled detection system, with the most common detectors being diode-array detection (DAD) or UV–visible spectroscopy (UV-Vis) and mass spectrometry (MS).
The most recurrent use of liquid chromatography in cosmetics is in the analysis of UV filters [28], as it is common to find such compounds in cosmetic formulations, from a daily sunscreen to a cosmetic base. In recent years, the use of sunscreens has increased due to heightened consumer awareness about skincare, the depletion of the ozone layer, and the prevention of diseases and skin discoloration or spots [28,29,30,31]. The initial step before introducing a sunscreen-laden sample into high-performance liquid chromatography (HPLC) involves evaluating the complexity of the matrix in which the sample is situated. Numerous publications have addressed the pretreatment of cosmetic samples, with one of the most relevant techniques involving the disruption of emulsions using ethanol or methanol or the incorporation of a surfactant. In certain instances, this procedure may be combined with low pH and/or elevated temperature (60 °C) conditions [6]. Another method is to perform a solid-phase extraction (SPE), with materials like graphene sponge [30]. Following the pretreatment of the sample, the injection process is initiated. Most advanced and frequently referenced methods employ a C-18 stationary phase. Typically, the mobile phase consists of ethanol or methanol, often combined with an aqueous phase which may include acetic acid or a buffer in certain instances [28,29,30,31]. Currently reported methods allow separating even 16 filters in a single run [29], enabling the analysis of different formulations using the same method.
Antioxidants are another group of ingredients in cosmetic products known for their high effectiveness and popularity. They can disrupt radical chain processes, enhance cellular rejuvenation, and prevent skin cancer [32]. These compounds, primarily mono or polyphenols with different substitution groups, are usually active in the ultraviolet part of the spectrum [33]. Consequently, a liquid chromatography system coupled with a UV or DAD detector is very useful in industry, offering an affordable price compared to other detectors [33]. When it comes to identifying the structure and performing trace quantification, it is advisable to employ a mass spectrometry detector [32]. However, its relatively high cost makes it less commonly used. Chromatographic methods for antioxidants typically involve a C-18 column and a methanol–water mobile phase in a gradient program [32,33].
In addition to sunscreens and antioxidants, two other large groups of compounds that are typically analyzed using liquid chromatography are preservatives and colorants. Preservatives are compounds that prevent the appearance and growth of microorganisms in cosmetic matrices [34]. Among the most used are parabens or esters of p-hydroxybenzoic acid. As of 2021, it was estimated that between 75 and 90% of cosmetics contained parabens in typical amounts ranging from 0.01 to 0.3% [35]. Their physicochemical characteristics make them compatible with various formulations, and their potency, efficacy, and low manufacturing costs contribute to their widespread use [34]. However, several studies have shown that constant exposure to even minimal concentrations of parabens can lead to alterations in the endocrine system of organisms [35] and a negative impact on skin cells [36]. As a result, there is a current trend to reduce these types of molecules in formulations and, in turn, quantify the amount of these analytes in cosmetic matrices. For the extraction of parabens before injection by means of chromatography, reports are found using techniques such as ultrasound-assisted extraction (UAE), supercritical fluid extraction (SFE), stir bar sorptive extraction (SBSE), solid-phase extraction (SPE), dispersive liquid–liquid microextraction (DLLME), among others [37,38,39]. In liquid chromatography, reverse-phase columns, typically C18 and C8, are commonly employed [37]. In addition to the commonly employed detection systems, other systems such as the chemiluminescence detector (Table 3) and the corona-charged aerosol detector are utilized [39,40].
Colorants are synthetic organic compounds that are either water-soluble or oil-soluble, and they serve to impart color to a product or to color parts of the body such as skin, hair, nails, or eyelashes [53]. Since they determine color, the ability to quantify them in different matrixes is crucial for maintaining quality standards and consumer acceptance. Among the five main groups of colorants based on their chemical structure are azo, triarylmethane, xanthenes, indigo, and quinoline; these groups exhibit chromophoric characteristics that allow laboratories to use the UV-Vis or DAD detectors, often coupled with mass spectrometry [53]. It is noteworthy that water-soluble colorants contain one or more water-soluble groups, such as carboxylic (–COO Na+) or sulfonic (–SO3Na+) in sodium or calcium forms. This leads to the potential formation of polyvalent ions in the ionization source of mass spectrometry [49,50]. Therefore, when separating them using liquid chromatography, factors like ionic strength, pH, and mobile phase composition must be considered [49]. Among the options, the inclusion of an organic modifier (such as acetonitrile or methanol) in the solvent system has been proposed to avoid the rapid elution of the most polar compounds near the column’s dead volume [49,50,53]. The inclusion of an organic modifier in the solvent system has also been proposed to avoid a fast elution close to the dead volume of the column of the most polar compounds [54]. It has also been reported that the addition of volatile neutral salts prevents interactions between negatively charged ionized compounds and partially ionized silanols in the stationary phase, which improves retention times and peak symmetry [49,50]. However, the presence of salts in the ion source can cause the suppression of ionization, reporting greater suppression in a positive ionization mode [49,50]. Consequently, low salt concentrations have been documented: for example, 3 mM of ammonium acetate is recommended to avoid peak tailing and improve chromatographic retention [49].
Finally, it can be inferred that the liquid chromatography technique is a relevant tool at different stages in the development of a cosmetic product, proving useful in reverse engineering and reaching quality control of a new product. This includes all the previously mentioned applications to the different matrices found in a cosmetic industry catalog. In addition to liquid chromatography, there is gas chromatography, which is a separation technique based on the vapor pressure and polarity of the components. This technique involves a stationary phase, which can be either liquid or solid, and a carrier gas (He, H, N) [55]. The differences between these two techniques restrict them to a specific group of compounds. While the applications of liquid chromatography have been discussed previously, the next section will explore gas chromatography in detail.

3.2. Gas Chromatography

In gas chromatography (GC), the compounds need to enter the column in a gaseous state, which restricts the technique to low molecular weight compounds which can withstand high temperatures. [55]. In the cosmetic industry, GC is primarily used in fragrance analysis; the compounds used in fragrances tend to be mixtures of hundreds or thousands of analytes, either naturally or synthetically derived [23]. For these analyses, gas chromatography is often coupled to a flame ionization detector (FID) or a mass spectrometer (MS), as most fragrance constituents, such as essential oils or alcohols, have a low vapor pressure and a low molecular weight [56]. Different objectives drive fragrance analysis in the cosmetic industry, among which are the following: (i) to determine the composition of a product quantitatively or qualitatively; (ii) to control the quality and authenticity of the product; and (iii) to detect the presence of contaminants [56]. The chromatographic methods used for fragrance analysis vary widely in terms of column dimensions and polarities, temperature ramps, and carrier gases, depending specifically on the matrix and detectors used in the analysis, as can be seen in Table 4 [23,56].
Within fragrances, there exists a category of volatile or semi-volatile allergenic compounds restricted by the European Union, known as fragrance allergens [57,58]. Most essential oils, being mixtures of alcohols, aldehydes, esters, phenols, ketones, and volatile and semi-volatile alkenes with boiling points below 350 °C [58], often present transoral toxicity and negative effects on the nervous system either temporarily or chronically [57,58]. These compounds are also known to cause sensitization upon contact with the skin and mucous membranes, endocrine disorders, dermatitis, asthma, and other diseases. The European Union and national standards in countries like China and Japan have set limits for nearly 99 compounds used in fragrances [58]. For instance, the maximum limit of fragrance allergens for all lip products is 0.04%, and for other types of products it is 5% [58,59]. This regulation stems from reports indicating that compounds such as citral and cinnamaldehyde can cause skin irritation; cinnamaldehyde may also lead to oral ulcers, and linalool has an anesthetic effect and can cause swelling and pain in the eyes and skin [58,59]. Therefore, the quantification of these compounds before a product’s release is a crucial part of the entire process. Reports indicate that gas chromatography, due to the physicochemical characteristics of these compounds, offers the fastest analysis route. The developed methods enable the quantification of 25 compounds with a limit of detection (LOD) ranging from 0.8 to 8.8 mg/kg and relative standard deviations (RSD) between 0.1 and 5.0% [60], or 24 compounds with a LOD at the ppb level and recoveries above 80% [61].
Table 4. Examples of gas chromatography in cosmetics.
IngredientSampleMethodDetectionReference/Year
AllergensBaby oil, lip balm, olive cream, deodorant, face mask, face lotion, shampoo, and toothpaste.DB-WAX (30 m × 0.32 mm i.d., 0.5 μm)FID[61]/2015
AllergensPerfumes and essential oilsColumn: Watercol 1460 (10 m × 0.10 mm, 0.08 μm); Watercol1910 (15 m × 0.10 mm, 0.08 μm)FID-TCD
MS
[62]/2020
AllergensPerfumeColumn: DB-1 (60 m × 0.25 mm, 0.25 μm); DB-1 (20 m × 0.18 mm, 0.18 μm); DB-5 (60 m × 0.25 mm, 0.25 μm); DB-17 (30 m × 0.25 mm, 0.25 μm); DB-17 (20 m × 0.18 mm, 0.18 μm); Delta-3 (30 m × 0.25 mm, 0.25 μm)MS[63]/2003
AllergensMoisturizing cream, moisturizing lotion, anti-wrinkle cream, hand cream, sunscreen, and after-sun cream.Column capillary HP5
(30 m × 0.25 mm i.d., 0.25 μm)
MS[64]/2010
AllergensPerfumes, post-depilation mousse, deodorant, and cream samples (body creams, sun creams, and hand creams)DB-VRX (20 m × 0.18 mm, 1 μm)MS[65]/2010
PreservativesMakeup remover gel, mouthwash solution, and hair gel.HP-5MS (30 m × 0.25 mm i.d., 0.1 μm).MS[66]/2009
PreservativesEmulsion, body lotion, and body cream.DB-5MS (30 m × 0.25 mm i.d., 0.25 μm)MS[67]/2010
PreservativesBath gel, baby cream, body lotion, nail strengthening cream, shower gel, shampoos, conditioners, and deodorants.Columns: RtxR 5 amine (30 m × 0.25 mm × 0.5 μm); RxiR-5Sil MS (20 m × 0.18 mm × 0.36 μm); SLBTM-5ms (20 m × 0.18 mm × 0.36 μm); 190-91S HP5-MS (30 m × 0.25 mm × 0.25 μm)MS/MS[68]/2013
PreservativesBody creams, baby creams, moisturizing cream, deodorants, sunscreen, baby after-sun, moisturizing lotion, makeup, and eye makeup remover.TG-5 SILMS (30 m × 0.25 mm i.d., 0.25 μm)MS/MS[69]/2014
Phthalates and ParabensHair sprays, perfumes, deodorants, creams, and lotionsHP-5MS (30 m × 0.25 mm i.d., 0.25 μm).MS[44]/2007
Solvents and ActivesNail productsRestek Rtx® 5 amine (30 m × 0.25 mm, 0.5 μm) Phenomenex ZB-SemiVolatiles (30 m × 0.25 mm, 0.25 μm).MS[22]/2016
SolventsNail productsHP-INNOWax (30 m × 0.32 mm i.d., 0.25 μm); Restek Rtx-225 column (30 m × 0.32 mm i.d., 0.25 μm)FID
MS
[70]/2011
As previously mentioned, preservatives are common components in cosmetic formulations, and besides being analyzed using liquid chromatography, they can also be studied through gas chromatography. The GC methods for this type of analytes were developed as an alternative for complex matrices: for instance, the method developed by Perry G. Wang and Wanlong Zhou for 26 personal care products, including bath gels, baby creams, body lotions, nail strengthening cream, shower gels, shampoos, hair conditioners, and deodorants, is effective for parabens analysis (Table 4) [68]. Other methods include the use of SPME-GC-MS/MS, which has been proven to be a simple, efficient, and sensitive methodology for the rapid determination of multiple preservatives in cosmetic samples such as facial cleansers, eye makeup removers, moisturizers, and sunblock, among others (Table 4) [69].
Another common application of gas chromatography in the cosmetics industry is related to nail products. A frequent application is in the analysis of solvents like toluene, which helps nail polish apply smoothly and adhere evenly to the nails [22]. Also, methanol, cataloged as a hazardous contaminant with maximum limits in cosmetics [70], or the solvent N-methyl pyrrolidone, which is miscible with water and also acts as a surfactant, can be analyzed through GC [22]. Beyond nail products, the use of API-SPME-GC-MS for the identification of microbial presence in cosmetics through microbial volatile organic compounds (MVOC) has recently been reported. These MVOCs, derived from enzymatic activity produced during metabolic processes, serve as biomarkers for the identification of studied bacteria, such as the following: Indole and 2-nitrophenol for Escherichia coli, 2-undecanone and phenylethyl alcohol for Proteus mirabilis, 1-undecene and 2′-aminoacetophenone for Pseudomonas aeruginosa., and at least three other MVOCs as general indicators of bacterial presence [71]. This analysis concluded that the use of SPME-GC-MS is a fast, robust, and highly valuable tool that complements API biochemical tests in the assessment of microbial contamination in cosmetics [71].

4. Olfactometry and Electronic Nose

The olfactory system comprises transduction mechanisms, a process which involves various proteins in receptors located in the olfactory epithelium [72]. These proteins transform chemical patterns into electrochemical impulses, which are interpreted by the brain [73]. Analyzing the profile of a perfume is not a simple task; modern formulations can contain more than 100 compounds in a single sample, requiring both the olfactory expertise of a perfumer and the utilization of advanced analytical techniques to evaluate perfumes from different perspectives [74]. Consequently, utilizing the sense of smell as a detector yields a potent tool capable of detecting and identifying compounds within a range of 10−17 g [75].
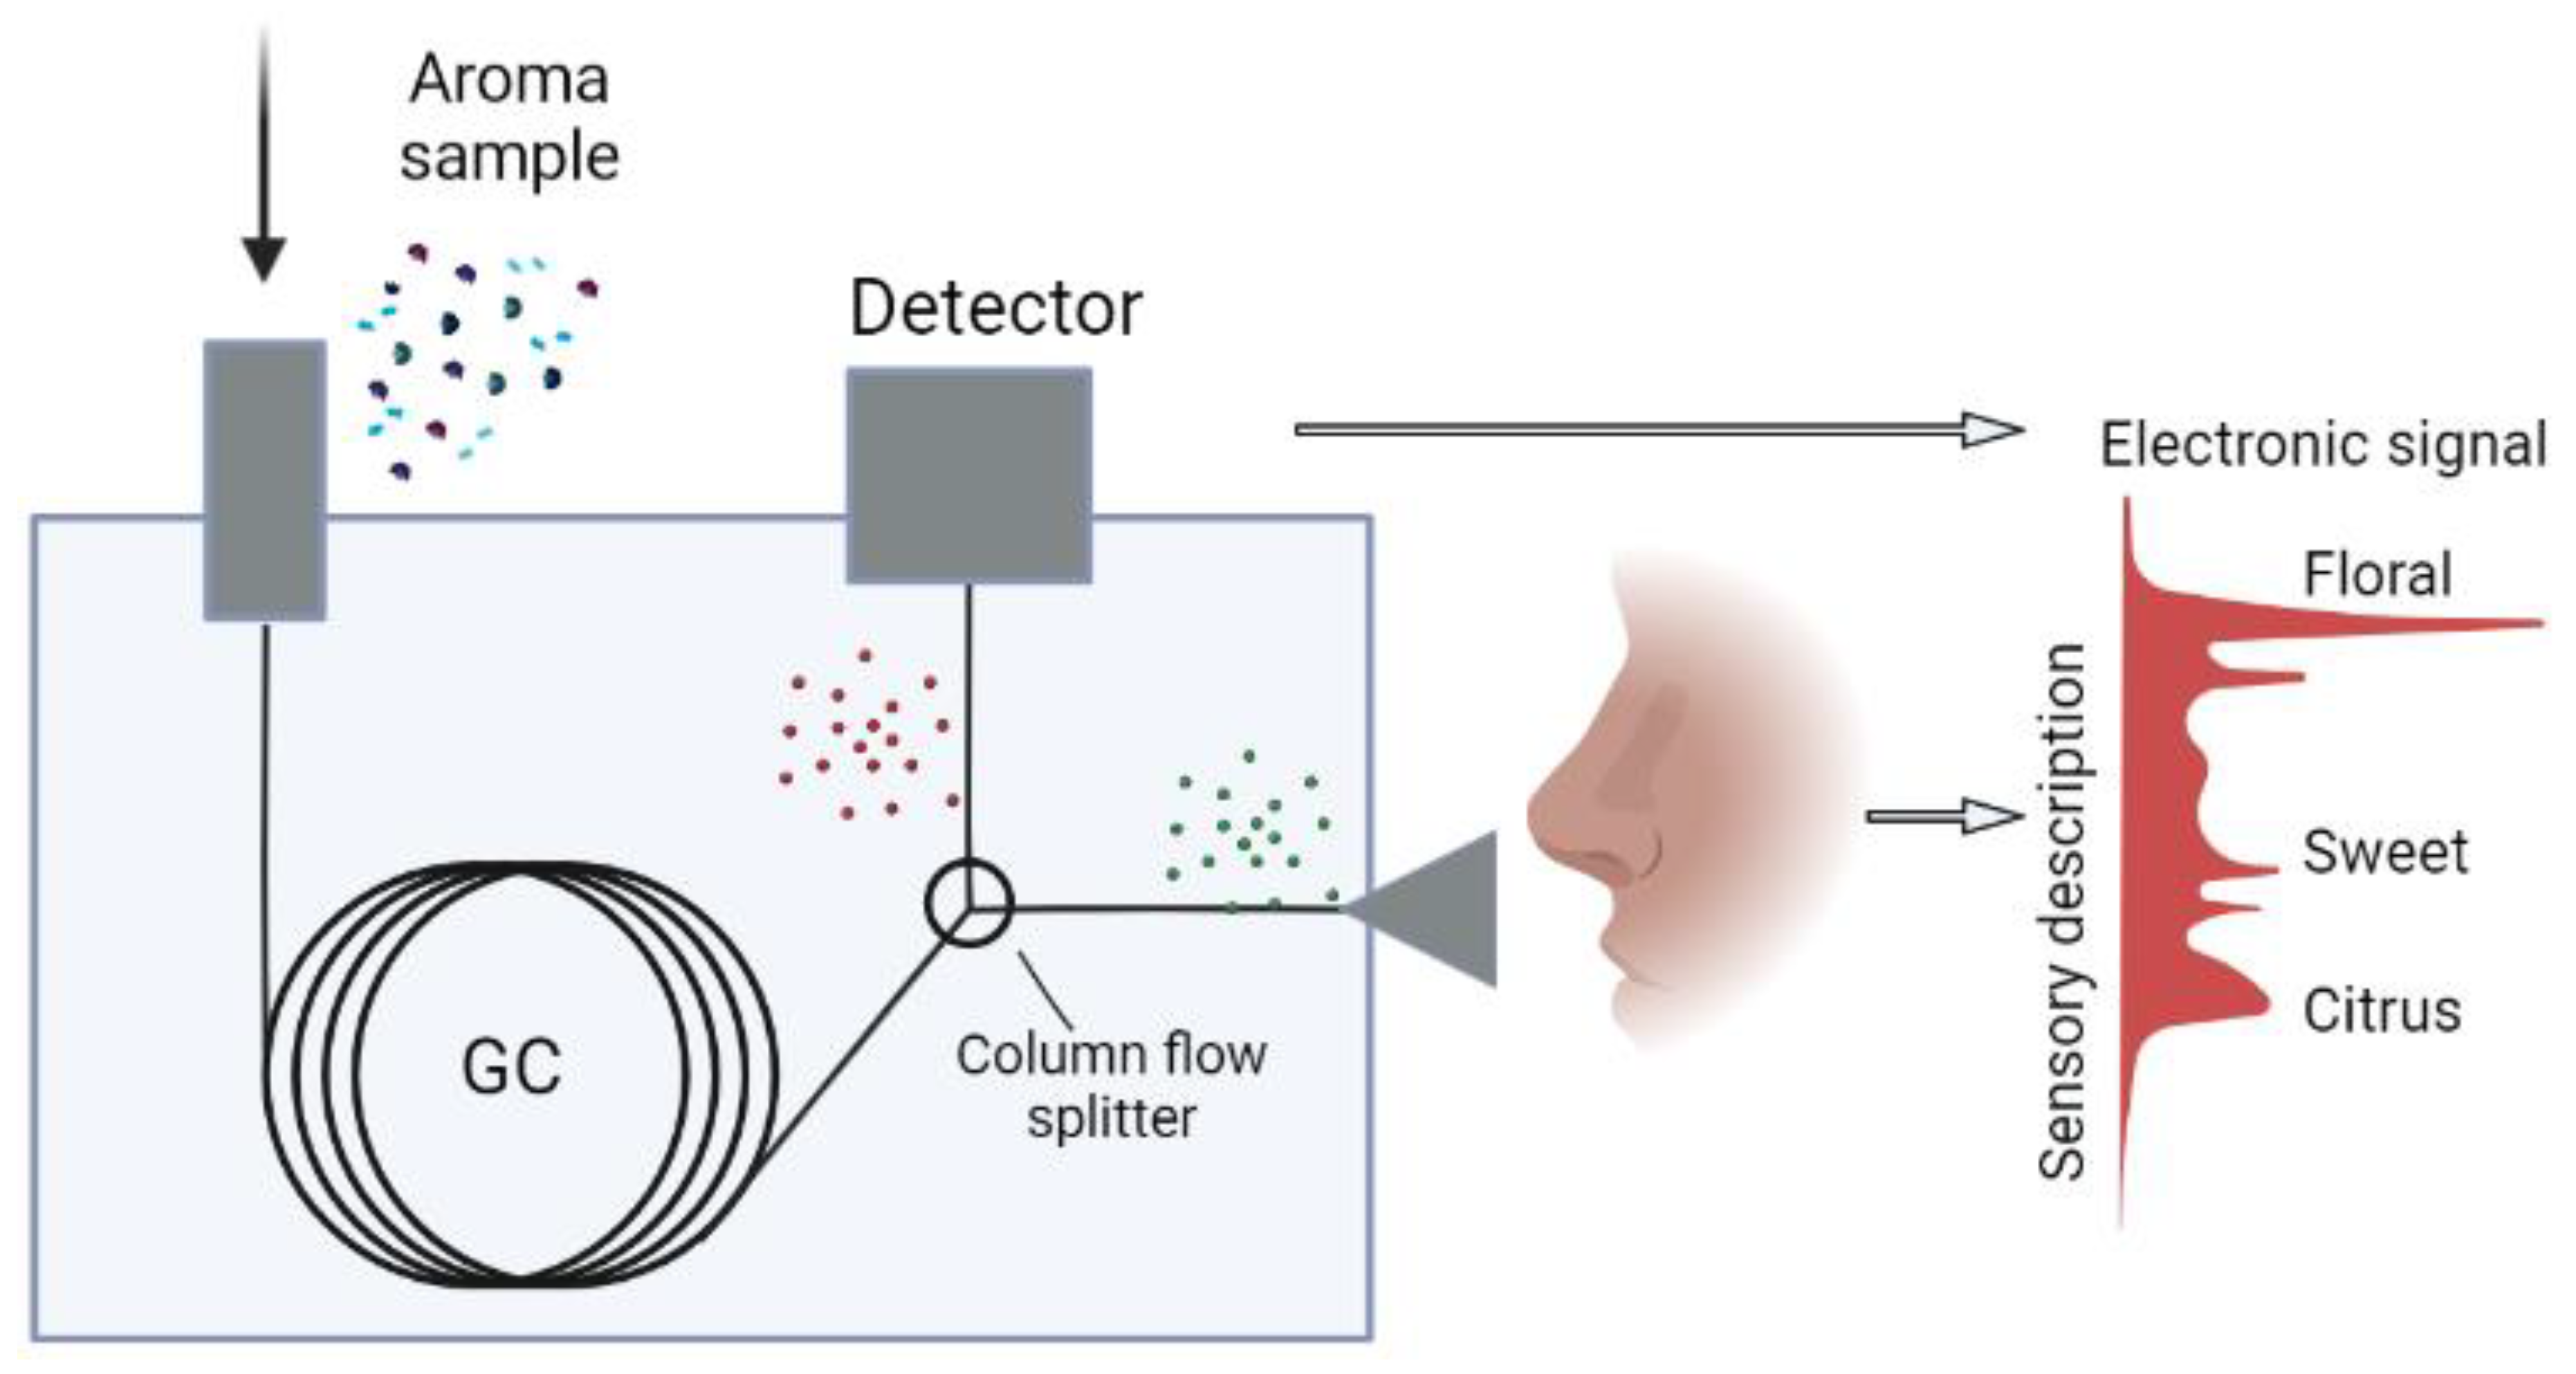
Given that the human sense of smell is the most suitable method for detecting aromas in the effluent of a gas chromatograph, chromatography coupled with an olfactometer (GC-O) has been utilized almost since the introduction of chromatographic analysis as an analytical technique [76]. In this method, the gas flow at the end of the chromatographic column is split using Y-shaped coupling. This setup allows the analytes, previously separated, to be analyzed both using an instrumental detector (FID, MS, etc.) and with an olfactometer, in which the human nose acts as a detector (Figure 4).
The ability to couple analytical techniques with sensory techniques allows for a diverse range of analyses of various samples, providing new insights into the nature of these samples. This is why this technique has become indispensable in the fragrance industry. With this coupling, the analyst can detect the volatile compounds responsible for different aromas, define their characteristics, and correlate sensory data with analytical data [77]. GC-O analyses usually consist of the following four stages:
  • Sample preparation;
  • Component separation;
  • Detection of olfactorily active compounds;
  • Interpretation of results.
Regarding sample preparation, the available methods can be divided into two broad groups: solvent-using techniques and solvent-free techniques. Each of these techniques offers different advantages that need to be assessed when selecting the appropriate method for achieving the best possible results. Factors such as the matrix, analytes of interest, and analysis objectives should also be considered when selecting the most suitable methodology [78]. Component separation is achieved using various chromatographic configurations. The precise choice of column polarity and a well-designed temperature program are critical factors in achieving the effective separation of analytes within the samples.
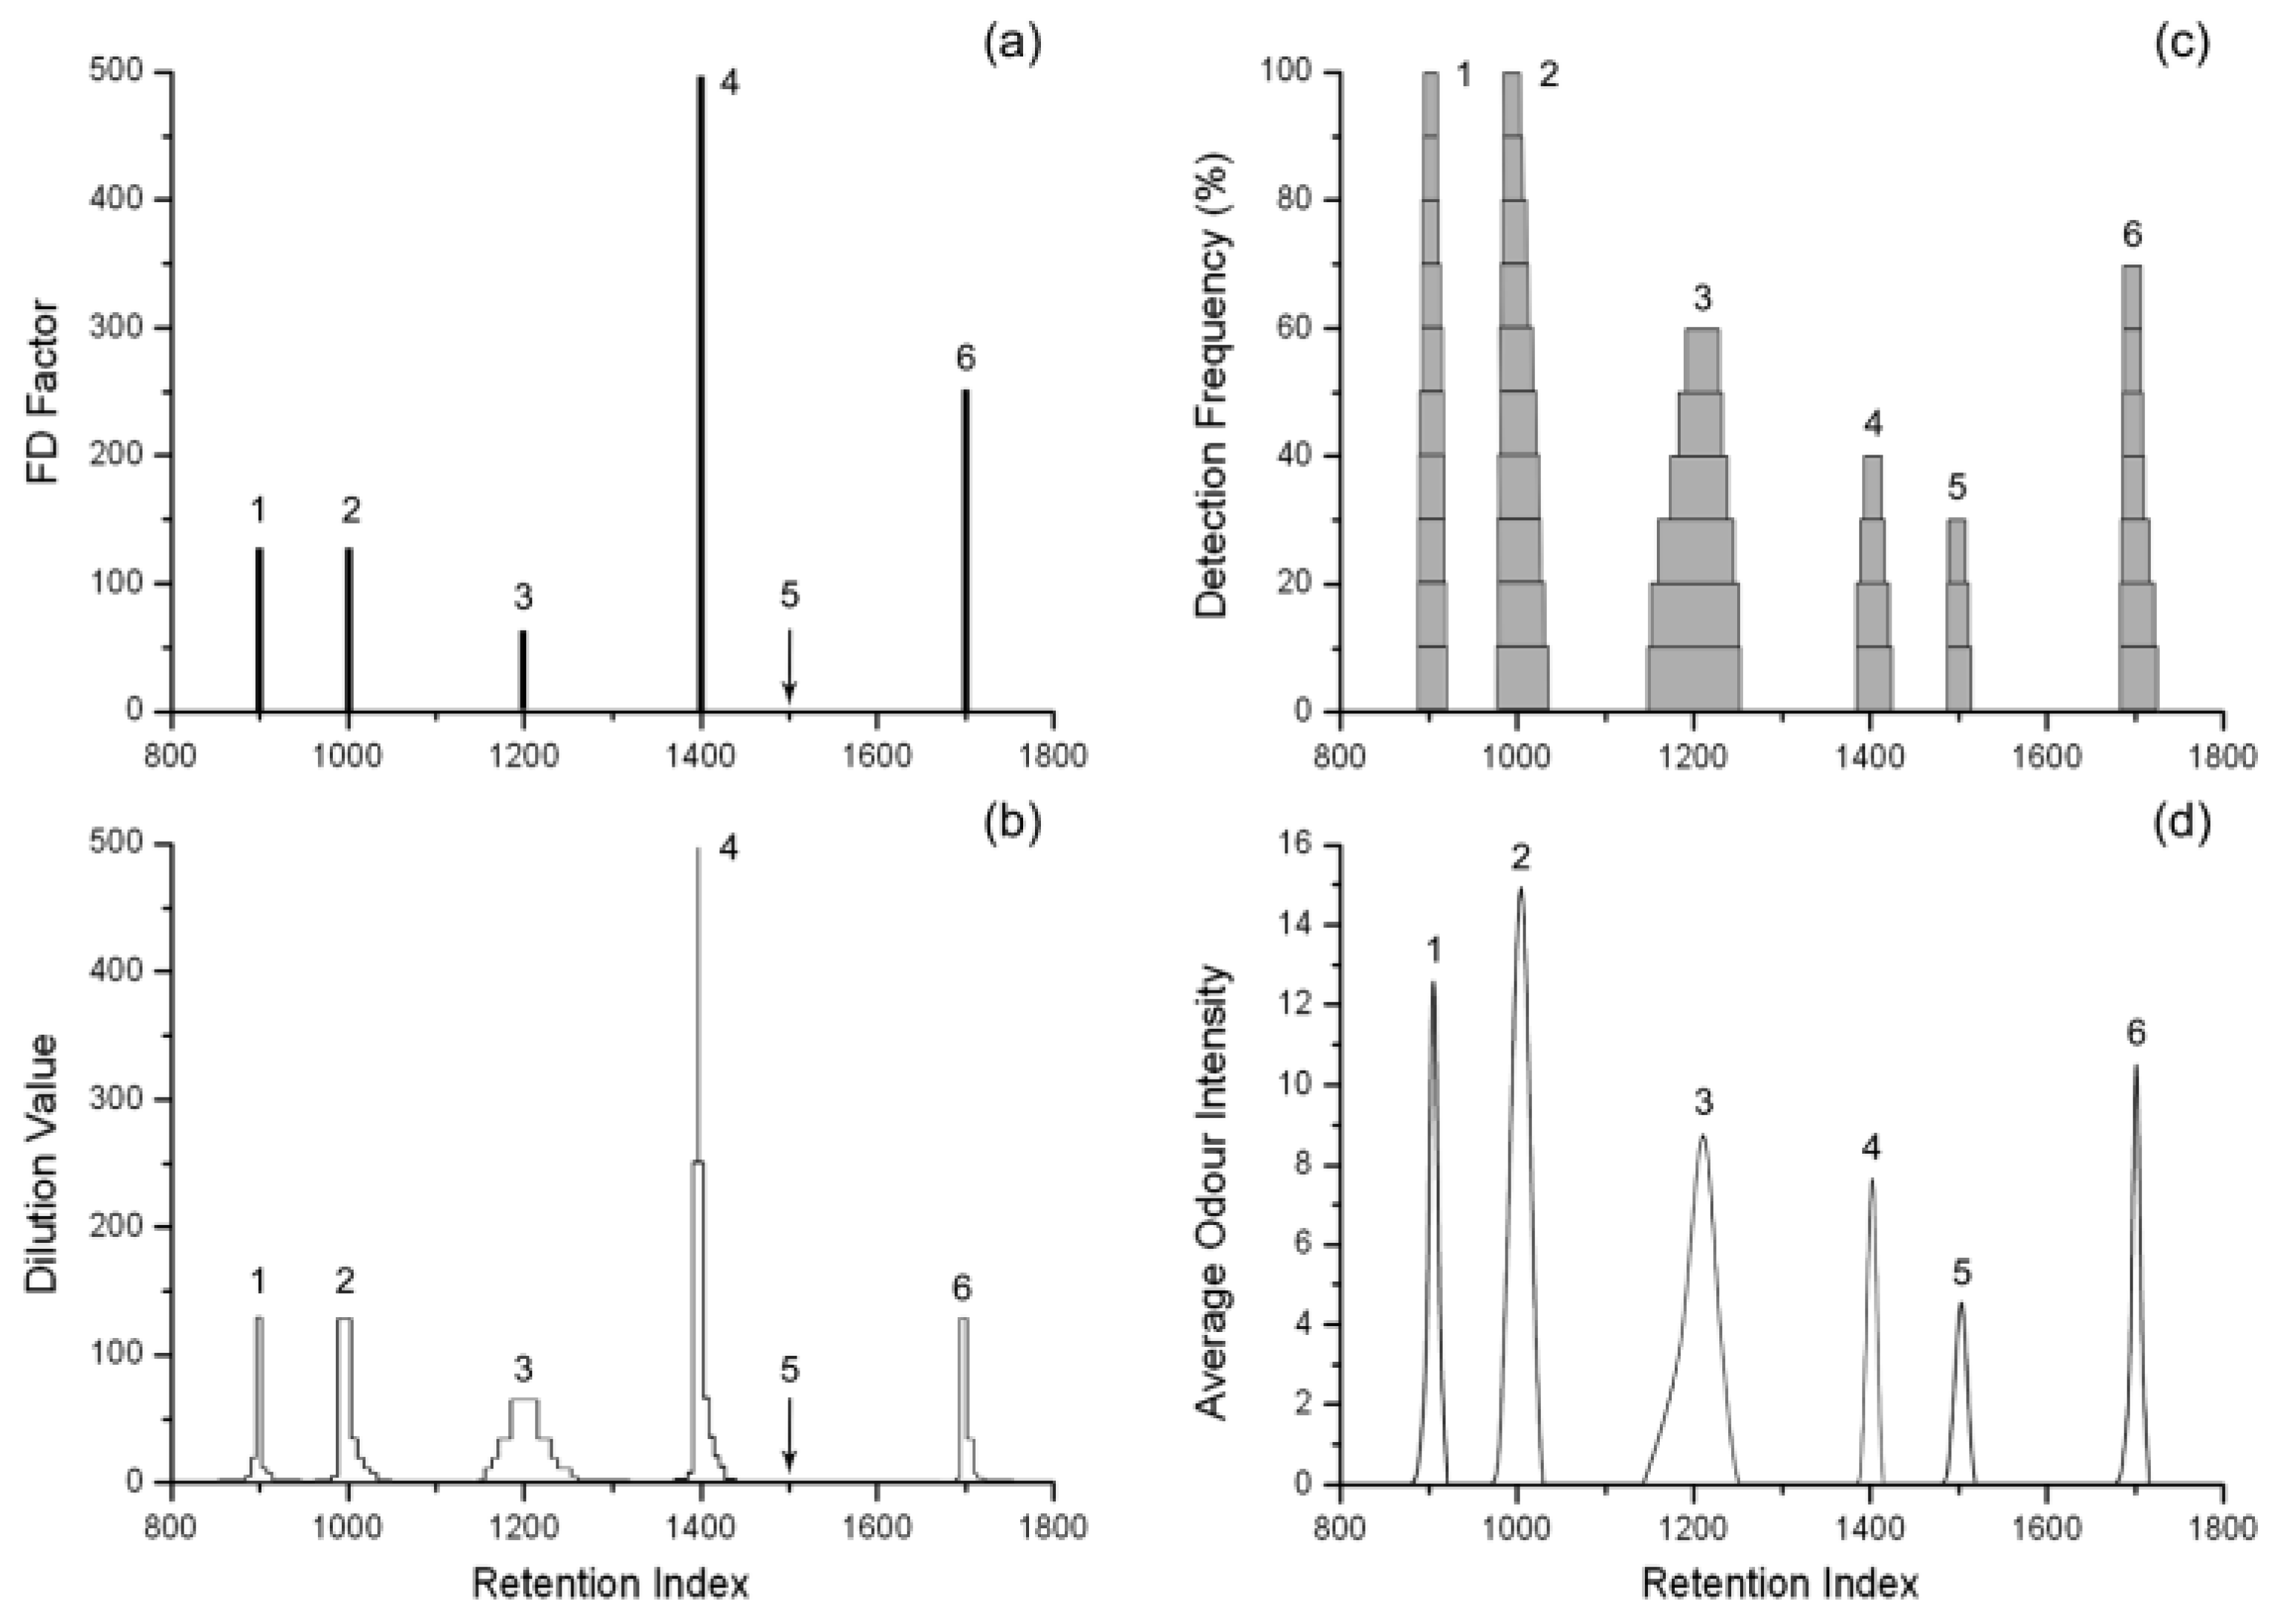
Various olfactometric methods enable the characterization of the four basic properties of olfactorily active compounds (olfactory threshold, quality, intensity, and aroma duration). These methods can be classified into the following three categories [79]: dilution methods, such as AEDA (aroma extract dilution analysis) and CHARM (combined hedonic aroma response measurement), direct intensity methods, and frequency methods.
In dilution methods, samples are successively diluted and analyzed until the point where the subsequent dilution, upon analysis, no longer presents smell-active compounds detectable by an olfactory evaluator. This principle is employed in AEDA and CHARM analyses. In AEDA, the dilution factor (DF) is determined as the last dilution at which an olfactorily active compound can be detected. The results are presented as the logarithm of the dilution factor (log DF) against the retention index/time or by listing the dilution factor (DF) values [80]. In contrast, CHARM analysis also involves successive dilutions, but olfactory evaluations are performed randomly to ensure an impartial analysis [81]. A limitation of these methods is the larger time requirement compared to a regular analysis, with typically only one or two evaluators assessing the olfactorily active eluted compounds [79]. Frequency detection methods address evaluator limitations as these methodologies employ sensory panels (6–12 participants). In this methodology, each evaluator records the duration of each detected odor. The individual responses are then combined to create an aromagram in which the height of the peaks corresponds to the number of evaluators who detected each aroma [82]. The simplicity and reliability of the results are the primary advantages of frequency detection methods over dilution methods, since having a broader panel of evaluators does not require prior training [82]. However, the main disadvantage of this methodology is the lack of a comparative scale for assigning a reference value to each aroma [83]. Lastly, direct intensity methods measure perceived intensity using a reference scale, based on Steven’s psychophysical law, which correlates the magnitude of a physical stimulus with the perceived intensity. In olfactometry, this relates the perceived intensity of an aroma to the concentration of the compound in question [84,85]. The perceived measurements can be taken in various ways, either by assigning a value to each compound at the time of analyte elution using a predefined intensity scale or dynamically, where the eluted compounds are treated as chromatographic peaks. In this case, the resulting olfactogram represents the olfactory intensity as a function of retention time, with the height of each peak indicating the maximum intensity given for each analyte, while the width determines the duration of each aroma [85] (Figure 5).
In general terms, frequency detection methods require the least amount of time to perform and are also the simplest to employ. On the other hand, dilution methods require a longer analysis time, while direct intensity methods are the most complex to execute [85]. However, once an experienced panel is available, direct intensity methods can be employed to quickly characterize the olfactory profiles of different samples, yielding highly precise data [79].
Each step described has different factors that will affect the quality of the results obtained. Proper sample handling, the use of equipment with sufficient capacity to separate all compounds, data obtained from additional detectors, and, finally, the expertise in interpreting the data and odors obtained by an analyst with olfactory training are crucial [85].

4.1. Electronic Nose

The classification and identification of aromas have posed significant challenges due to the interactions among various olfactorily active compounds. These compounds can exhibit synergistic interactions, in which two or more compounds together create a more potent aroma than each component alone, or they can exhibit compensatory effects, with one compound mitigating the effects of another. Similarly, due to their nature, certain components of a mixture may mask the aromas of other compounds, thereby complicating sample analysis. Consequently, systems like aroma sensors, better known as electronic noses, have enabled the high-precision analysis of these complex aroma mixtures [86].
In contrast to the chromatographic analysis techniques previously mentioned, alternative methods inspired by the sense of smell rely on electronic sensors equipped with arrays of gas sensors capable of discerning pattern systems. These sensors can identify simple or complex aromatic profiles by analyzing volatile compounds without the need to separate the aromas into their single aromatic compounds [87]. They function similarly to the human sense of smell, where a sensor array acts as the olfactory receptor, detecting the chemical compounds present in the environment and emitting a signal. This signal could be a change in voltage, current, frequency, or resistance, depending on the components of the sensor array [88,89]. The signal is then processed and classified through a pattern system, enabling the classification of each aroma (Figure 6).
Currently, a wide variety of sensors are available, each with distinct advantages, depending on the experience of the operator to employ the appropriate sensor for the required analysis. The sensors used in electronic noses can be categorized depending on the physical magnitude they quantify [75,90]. Below, some of the currently used sensors are described.
Optical sensors are named for the type of response they emit. These sensors are constructed using a fluorescent pigment, which changes its optical properties upon interaction with volatile compounds. This change could correspond to a shift in wavelength or intensity [91]. The advantage of these sensors lies in their potential for low-cost and simple production, with sensitivity varying depending on the type of pigment used [92]. Despite their benefits, these sensors require periodic calibration for accurate results and have a limited lifespan due to the photobleaching process [75].
Metal oxide sensors, or MOS, are the most used sensors due to the wide range of gases they can detect [93,94,95]. They are based on semiconductor metals whose electrical properties are modulated through redox-type interactions [90]. MOS can be divided into two groups: type p sensors, which respond to oxidizing gases which remove electrons from the metal surface, creating holes, and type n sensors, which react with oxygen molecules trapping electrons on the surface, thus generating high-resistance areas [95,96]. Their main advantages include ease of use, low production costs, and versatility in measurement types [94]. Detection can occur by measuring the change in capacitance and mass, based on optical characteristics or on the energy released due to gas–sensor interactions [97].
Sensors designed from conductive polymers are also used, particularly for their functionality at low temperatures (room temperature) [75]. These sensors operate based on the increase in electrical resistance caused by polymer expansion, which occurs when gaseous compounds contact the polymer, thus causing a change in material conductivity [98]. However, their main disadvantage is a high susceptibility to humidity, which can affect the accuracy of responses to volatile compounds [99].
QCM or quartz crystal microbalance sensors are mass sensors consisting of structures made of piezoelectric crystals [100,101]. Their operation is based on the crystal surface being covered with a material sensitive to changes caused by interaction with gaseous compounds [102]. This surface absorbs gases from the environment, increasing the sensor’s total mass and, subsequently, decreasing its frequency, which is the signal detected in QCM [102].

4.2. Importance of Olfactometric Analyses in the Cosmetic Industry

The use of olfactometry in the cosmetic industry has played a significant role in advancing the formulation of new cosmetic products. An example of this is the discovery of 1-p-menthene-8-thiol, the impactful compound in grapefruit aroma, identified through this methodology. Despite being present at levels below ppb, this compound has a very low odor threshold [103]. This methodology has also been employed by various flavor and perfume companies to identify new aromas and flavors from exotic locations such as various tropical jungles [104]. Additionally, it is currently employed in quality control to determine aromas that do not match the final product or that may cause undesired interactions, changing the olfactory profile of fragrances [79].
In the cosmetic industry, enhancing the organoleptic and perception properties of perfumes is crucial, since these products comprise complex formulations developed from blends of various natural and artificial sources. [105]. Given that these formulations are carefully selected and evaluated, original perfumes are usually expensive. Consequently, with the rising demand for perfumes, there has been an increase in perfume counterfeiting. Although counterfeit perfumes may exhibit aromas similar to the originals, they contain variations in their ingredients to mimic the authentic fragrance [106]. These variations, often not properly formulated, can lead to health issues such as allergic reactions or respiratory problems in users [107]. Thus, methodologies that allow for the differentiation between original products designed under quality standards and imitations potentially harmful to consumers are necessary. The electronic nose has been evaluated by various authors to verify its effectiveness in sample detection, yielding satisfactory results which validate the idea of using this methodology. Due to its simplicity, affordability, cost–benefit ratio, and speed, the electronic nose could become a future reference standard for determining the authenticity of cosmetic products [108,109].

5. Characterization and Evaluation of Cosmetic Products’ Stability

Most cosmetic products are dispersed systems that consist of one or more immiscible phases, the most common being emulsions and suspensions [14,110]. These systems are thermodynamically unstable, requiring a component to stabilize them, generally emulsifying agents, also called surfactants [3]. Being unstable, they can present instability phenomena such as flocculation, coalescence, and sedimentation, among others [111] (Figure 7). Over time, under storage conditions, this results in phase separation [112,113]. Therefore, in the design and development of cosmetic products, evaluating stability is crucial to ensure the safety, quality, and efficacy of the product [114]. Stability studies are conducted to define a product’s shelf-life and evaluate necessary adjustments in formulations, packaging materials, storage conditions, transportation, etc., to ensure health and meet consumer expectations [114,115,116].
The use of physicochemical formulation in surfactant–oil–water (SOW) systems is crucial to tailoring the stability of emulsions and suspensions [3,118]. Since the early 20th century studies by Bancroft, it has been recognized that, generally, the external phase of an emulsion, whether water or oil, depends on the location of the surfactant within one of the phases. Later, Winsor, in 1954, proposed a relationship (so-called Winsor R) through which the interaction energies between the surfactant, water, and oil can be analyzed conceptually, thereby allowing an understanding of the physicochemical situation of the system [119]. The physicochemical formulation of a system is associated with the type of emulsion and its stability. At the optimum formulation, the surfactant’s interactions with water and oil are exactly equal, leading to minimum interfacial tension in the system. Therefore, droplet drainage and coalescence occur rapidly which was recently determined to be due to a minimum elasticity of the interfacial film and fast surfactant exchanges between the bulk and the interface [120,121].
Currently, the physicochemical formulation in SOW systems can be described through the hydrophilic–lipophilic deviation (HLD) equation [3]. This equation relates various system variables, such as salinity, surfactant type, co-surfactant type, oil type, and temperature, to the physicochemical formulation of the system [14]. Moreover, it allows to quantitatively determine how far away the emulsion is from the optimum formulation. Systems near the optimal formulation generate unstable emulsions, and, on the other hand, at a certain distance, their stability increases [14,118,122]. It has been known that some systems generate a minimum droplet size at a certain distance from the optimum formulation, leading to maximum emulsion stability. This stability is linked to the interface energy related to the effective elasticity of the interface, as recently determined [111].
Therefore, several factors control stability in emulsions (Figure 7), among which are the following:
  • Droplet size;
  • Surfactant concentration;
  • Physicochemical formulation of the system (e.g., HLD value);
  • Viscosity of the external phase and the type of thickener or polymer used;
  • Concentration of the internal phase.
In the cosmetic field, these factors enable the tailoring of more or less stable emulsions, according to the application.
The case of suspensions is more complex due to the potential presence of three phases: an oil phase, a water phase, and a solid phase dispersed in the system, along with the use of surfactants [112,123]. For example, there are emulsions used in mascaras, and other types of suspensions are used to obtain different types of cosmetics, in which pigments, being generally solid, are particles found within the system [110,114]. In these suspensions, the physicochemical formulation is important as well as physical factors such as the contact angle, which can influence the formation of Pickering emulsions when the particles are small enough [124].
It has been determined that the contact angle is crucial for the stability of these systems, although its measurement remains challenging, even after many years, due to issues like hysteresis or the formation of a solid film to measure the contact angle, which differs from what occurs in actual suspension systems [125]. Consequently, phase diagrams are commonly used to study these systems, enabling the determination of regions with high and low stability. The strategies commonly used to evaluate stability and determine the shelf-life of cosmetics often require extensive periods. In the initial stages of development, rapid strategies are implemented by subjecting a product to stress and evaluating its response, to either reject or proceed with viable formulations. Among the main stress mechanisms used to evaluate stability are temperature, light, and centrifugation [116]. Following the stress exerted on the sample, a series of characterizations are conducted to evaluate the changes the sample undergoes. These include droplet size, zeta potential, viscosity, and a novel technique in the field of the cosmetic industry—analytical centrifugation [117].

5.1. Droplet Size

In emulsion-type systems, determining droplet size is one of the most common and practical methods for evaluating stability [126]. The larger the droplet size in an emulsion, the greater the velocity of creaming or sedimentation, which affects the medium-term stability of the emulsion [127]. Droplet size can be influenced by factors such as emulsifier concentration. Additionally, process variables like homogenization and pressure can be controlled to tailor the droplet size using high-energy emulsification methods (e.g., homogenizers, microfluidizers, colloidal mills) [116]. Low-energy emulsification methods allow to also attain nanoemulsions with droplet size values lower than 500 nm [3].
The conventional method for evaluating droplet size in an emulsion is through optical microscopy (Figure 8), which enables the determination of droplet size and shape and the microstructure of the emulsion. However, assessing droplet size distribution throughout an emulsion with this technique is challenging [118,127]. Therefore, instruments have been developed that allow for a more objective evaluation of droplet size distribution using laser diffraction. This technique results in a normal distribution and is based on the angular variation of scattered light when a laser passes through a simple emulsion, and Mie theory is utilized to calculate particle size. However, Mie’s theory assumes that all signals originate from particles or drops that are equivalent spheres; hence, the particle shape cannot be identified. Consequently, the optical microscope and other techniques such as light scattering can be used as complementary techniques [128].

5.2. Zeta Potential

Another strategy for characterizing the stability of dispersed systems of interest in the cosmetic industry is through the determination of the zeta potential. This parameter plays a crucial role in understanding the stability of emulsions and suspensions, as a large potential value on the surface of a droplet or particle can be related to electrostatic repulsion, which can be a way of hindering coalescence phenomena in emulsions or the formation of agglomerates in suspensions [129]. The zeta potential value depends not only on the charges on the surface of the droplet or particle but also on the ions present in the continuous phase of the system, as well as the type of emulsifier used [130,131]. The zeta potential is evaluated through instruments, such as the Zetasizer, that make use of electrophoretic mobility. However, concentrated and viscous samples require dilution to facilitate their measurement, ensuring that particles or drops can move easily, although dilution can lead to changes in the system.

5.3. Viscosity

The viscosity of the continuous phase is fundamental for the long-term stability of an emulsion, as it significantly affects separation due to gravity, according to Stokes’ law. Specifically, a high viscosity of the continuous phase slows down the movement of droplets or particles, thereby reducing the rate of creaming and sedimentation [127]. To increase the viscosity of the continuous phase and, thus, enhance stability, hydrocolloids are commonly used. These substances act as thickening agents, with carbomers, gums, silicones, and cellulose derivatives as examples [132]. The viscosity of cosmetic systems is currently evaluated through various techniques. Viscometers are widely used for this purpose, and more specialized equipment such as rheometers is also employed, providing additional information, such as oscillatory rheology measurements, which will be discussed in Section 6 [133].

5.4. Analytical Centrifugation

Analytical centrifugation (AC) is a reproducible and versatile technique, initially used in the evaluation of macromolecules in a solution [134,135]. However, with the development of new technologies and software, its applications have expanded considerably, particularly in dispersed systems. This technique facilitates the characterization of particle or droplet size distribution, density, diffusion coefficients, sedimentation velocity, and equilibrium sedimentation of the dispersed phase in cosmetic matrices such as emulsions and suspensions [136,137].
The operating principle of analytical centrifugation is based on the radial concentration gradients created by centrifugal force. At small sedimentation velocities, it follows Stokes’ law (Equation (1)), which describes the movement of a spherical particle with diameter d and density Ρnp in a fluid of density Ρs and viscosity ƞ, also introducing a sedimentation coefficient s which normalizes the sedimentation velocity given by the frequency and radius from the rotation center to the detection position [138,139].
d = 18 · η s · s ρ n p ρ s
Furthermore, the analytical centrifugation apparatus is equipped with an optical detection system that, depending on the specific instrument, is capable of measuring either absorbance, interference, or fluorescence. The absorbance-based optical system is sensitive in detecting macromolecules that contain strong chromophores or consist of two or more components with different absorption spectra; whereas, the CCD (charge-coupled device) interference-based optical system is particularly useful for sedimentation velocity experiments thanks to its extensive data acquisition [140]. Besides the optical system, the AC equipment features specific cells responsible for holding the sample. Generally, two types of cells are found in the market: hollow rotating disc cells and cuvette cells.
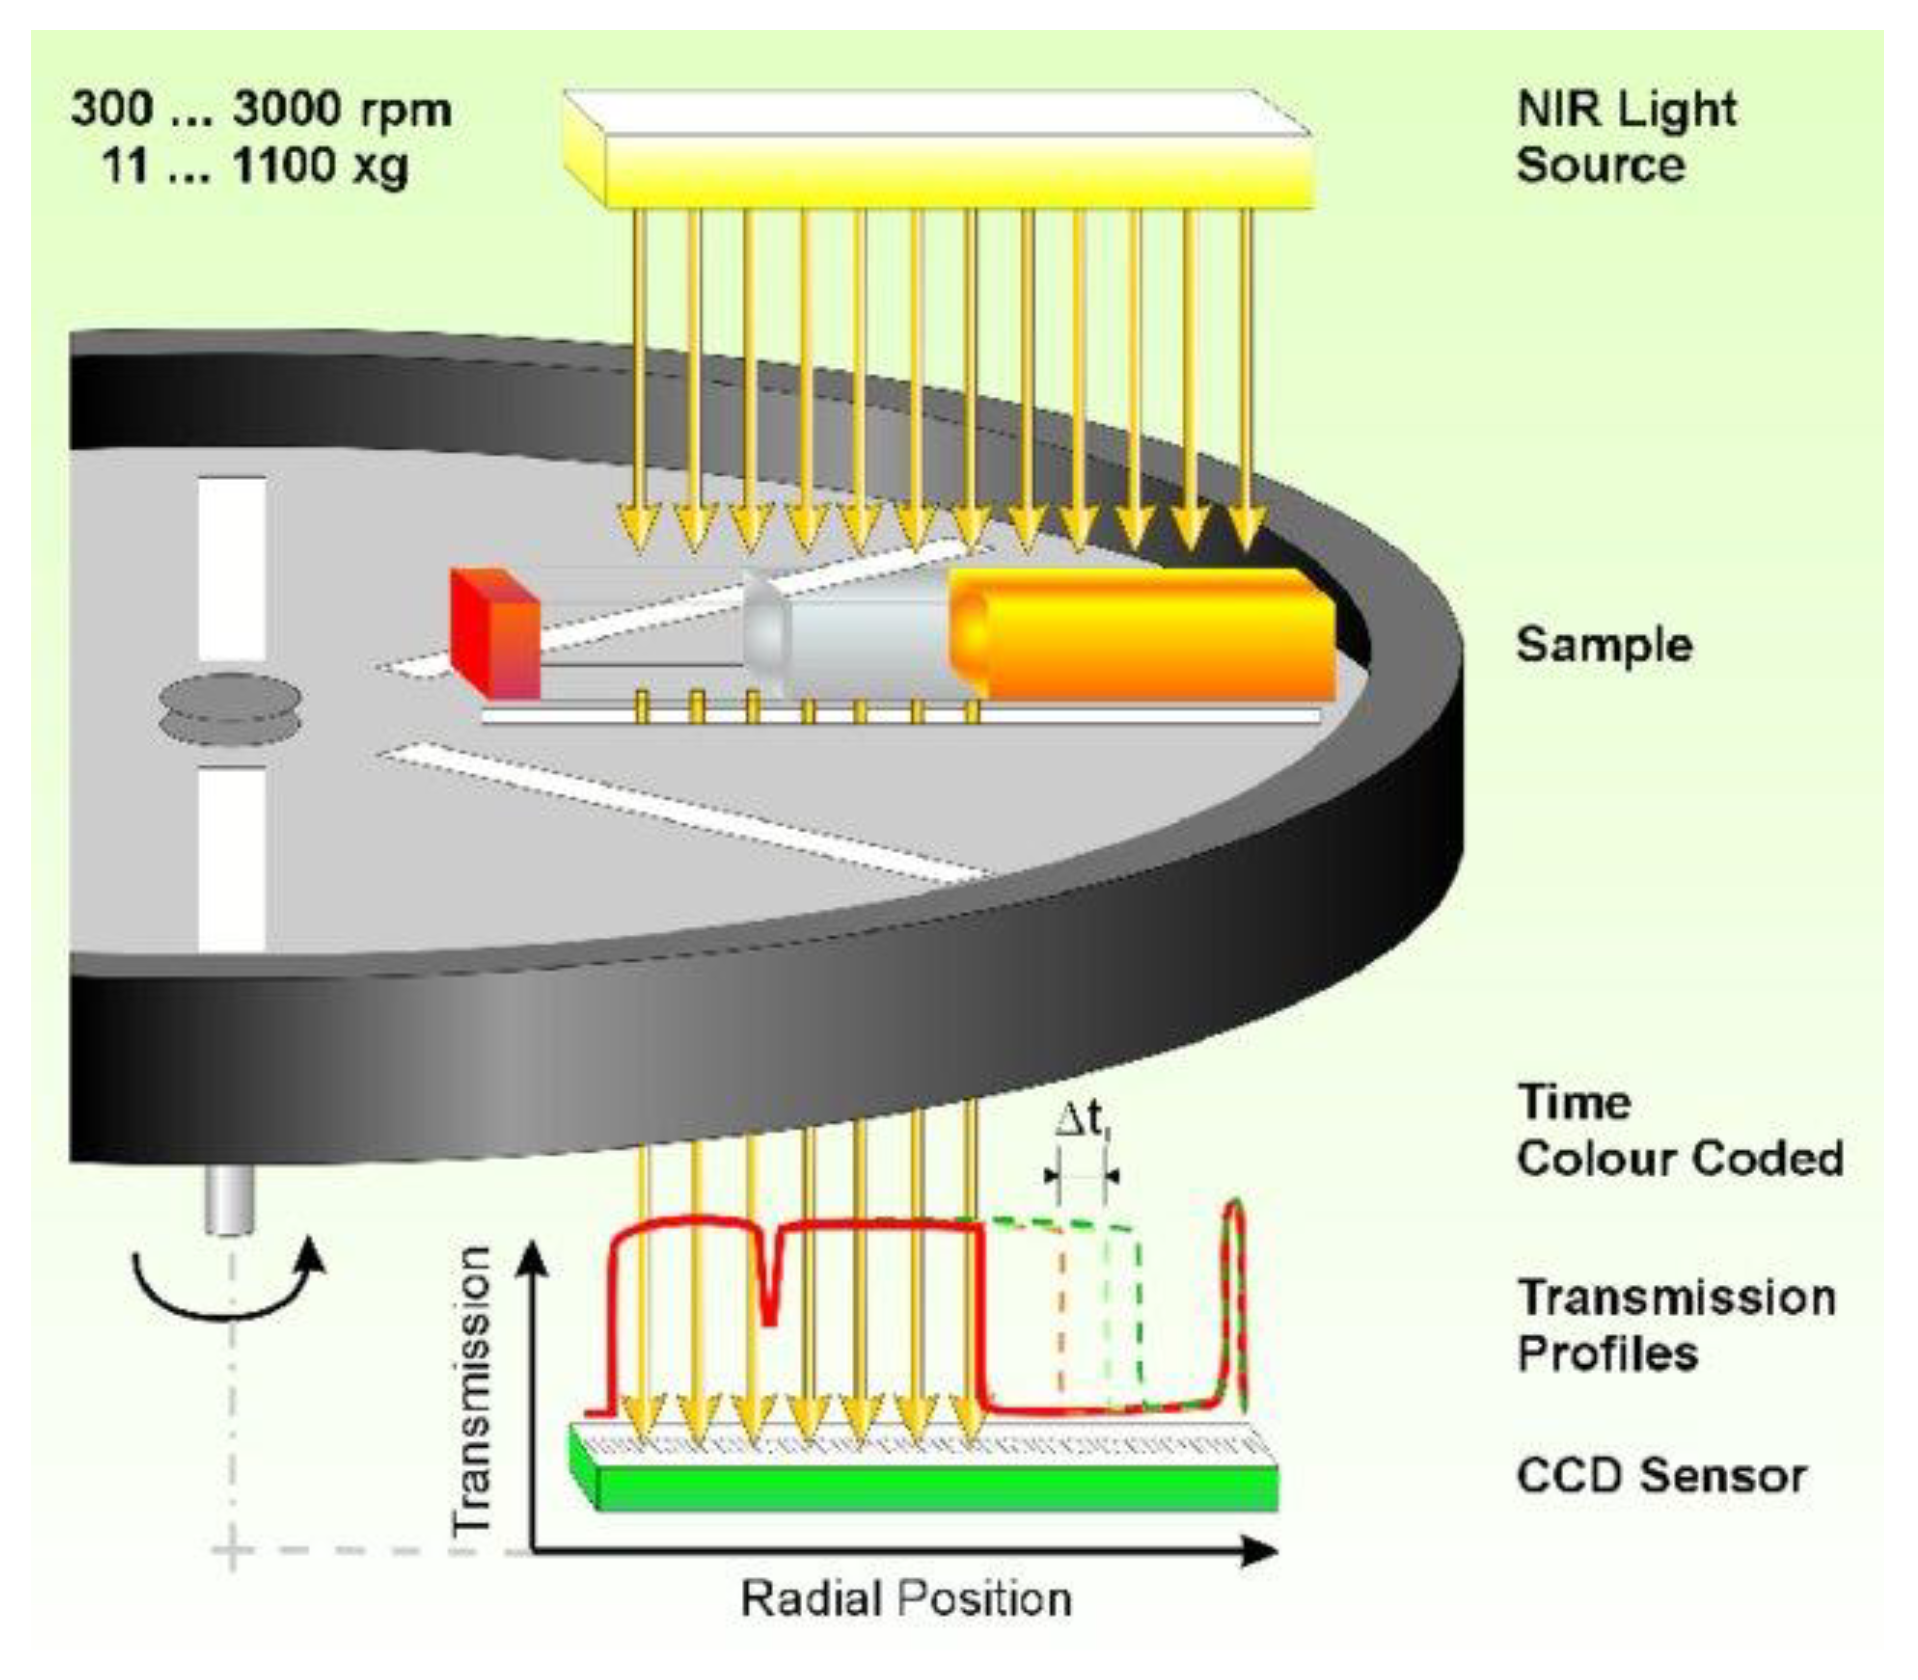
Currently, there are many AC equipment options available (Table 5). However, the LUMiSizer is the most commonly used for evaluating the stability of cosmetic matrices due to its moderate cost and working range with respect to particle size [141]. The instrument is configured as a conventional centrifuge, in which cells are placed horizontally, and the light source and CCD detector cover the cell’s length, as depicted in Figure 9. Additionally, the instrument features a variable illumination intensity for a broad range of concentrations and turbidity levels [141].
Table 5. Comparison of analytical centrifugation equipment, adapted from [141].
InstrumentCell TypeData AcquisitionDetectionFrequencyGravitational ForceContinuous PhaseParticle Size
LUMiSizerCellTransmissionSTEP300–4000 rpm6–2300 gWater, organic solvents10–100 μm
CPS DC (CPS DC24000 UHR) DiscTransmissionTurbidity500–24,000 rpm15–30,000 gWater, organic solvents 3.0 nm–10 μm
Brookhaven BI-DCPDiscTransmissionTurbidity500–15,000 rpm15–13,000 gWater, organic solvents 10 nm–30 μm
Beckman XLICellVolumeInterference1000–60,000 rpm70–250,000 gWater, organic solvents 1.0 nm–2.0 μm
AUC-UV-VisCellTransmissionUV-Vis1000–60,000 rpm70–250,000 gWater, organic solvents 1.0 nm–2.0 μm
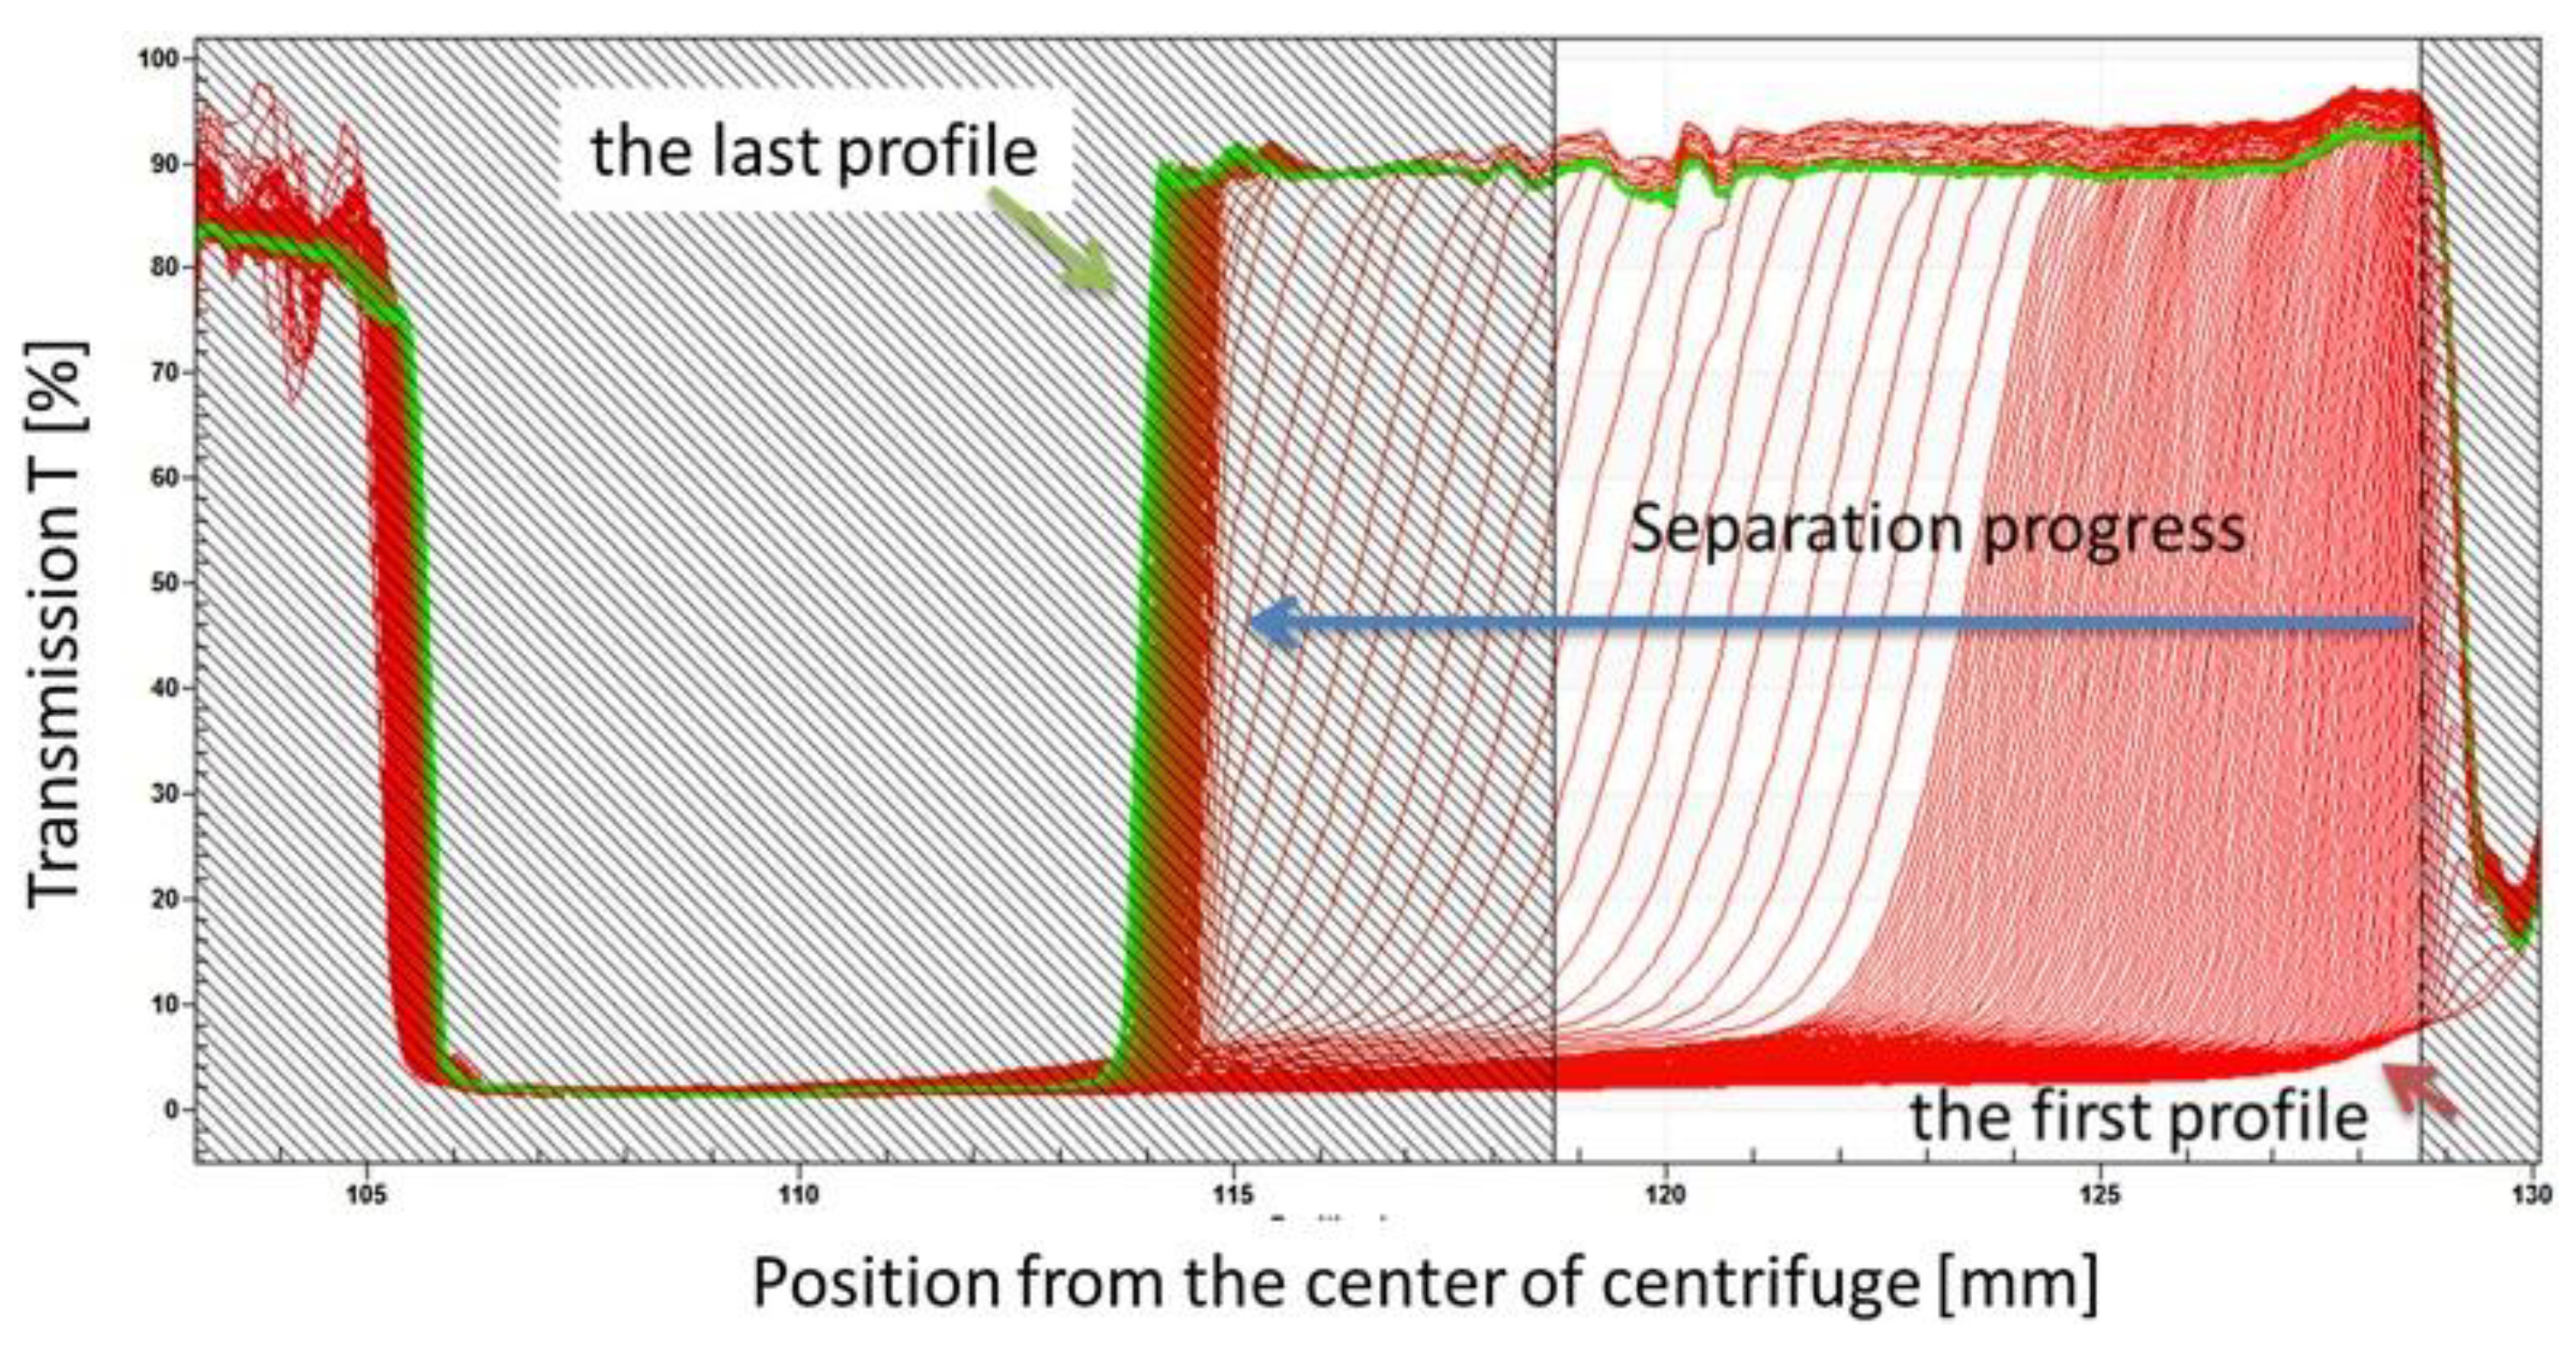
Additionally, the results of the profiles are obtained through STEP technology (space- and time-resolved extinction profiles), which enables the measurement of transmitted light intensity as a function of time and across the entire cell. In essence, the CCD sensor detects the transmitted light throughout the sample, capturing the initial extinction profile and continuing to do so throughout the entire experiment (Figure 10). This approach facilitates the acquisition of data related to the stability and kinetics of separation processes within dispersed systems [135,142].
With the LUMiSizer, it is possible to evaluate the phase separation behavior of cosmetic products, obtaining information about stability, creaming formation and clarification, density, particle size distribution, and product shelf-life [143]. One of the most common tests conducted in the cosmetic industry with the LUMiSizer is the stability analysis. This rapid method provides quantitative values for phase separation through a number known as the instability index. This index ranges between 0 and 1.0, categorizing the separation as stable when the value is 0, indicating no separation, or unstable when the value is 1, when a complete separation has occurred [143,144].
The shelf-life of a product in relation to its phase separation can be evaluated or predicted by subjecting it to different relative centrifugal forces and determining a sedimentation speed for each force. This is achieved by creating a curve of RCA (relative centrifugal acceleration) versus sedimentation speed and, subsequently, extrapolating to Earth’s gravity [145].
Consequently, the evaluation of the stability of cosmetic products is conducted in an integrated manner, meaning that no single technique or strategy provides all the necessary information for a comprehensive characterization of stability. It is essential to consider not only the physical stability characterizations previously mentioned but also to incorporate assessments of microbiological aspects (such as microorganism count and preservative systems) and chemical aspects (including oxidation reactions, hydrolysis, etc.) into the overall stability analysis [114].
Figure 10. Profiles obtained from the LUMiSizer. Reproduced from [144].
Cosmetics 11 00001 g010

5.5. Surface and Interfacial Tension

The measurement of surface and interfacial tension provides valuable information on the stability of cosmetic products, mainly related to the kinetics of surfactants at the interface. The decrease in surface tension has been linked to properties such as foamability and detergency, which are significant in various industry applications [146,147]. This is important when designing a product as these characteristics will affect consumer acceptance.
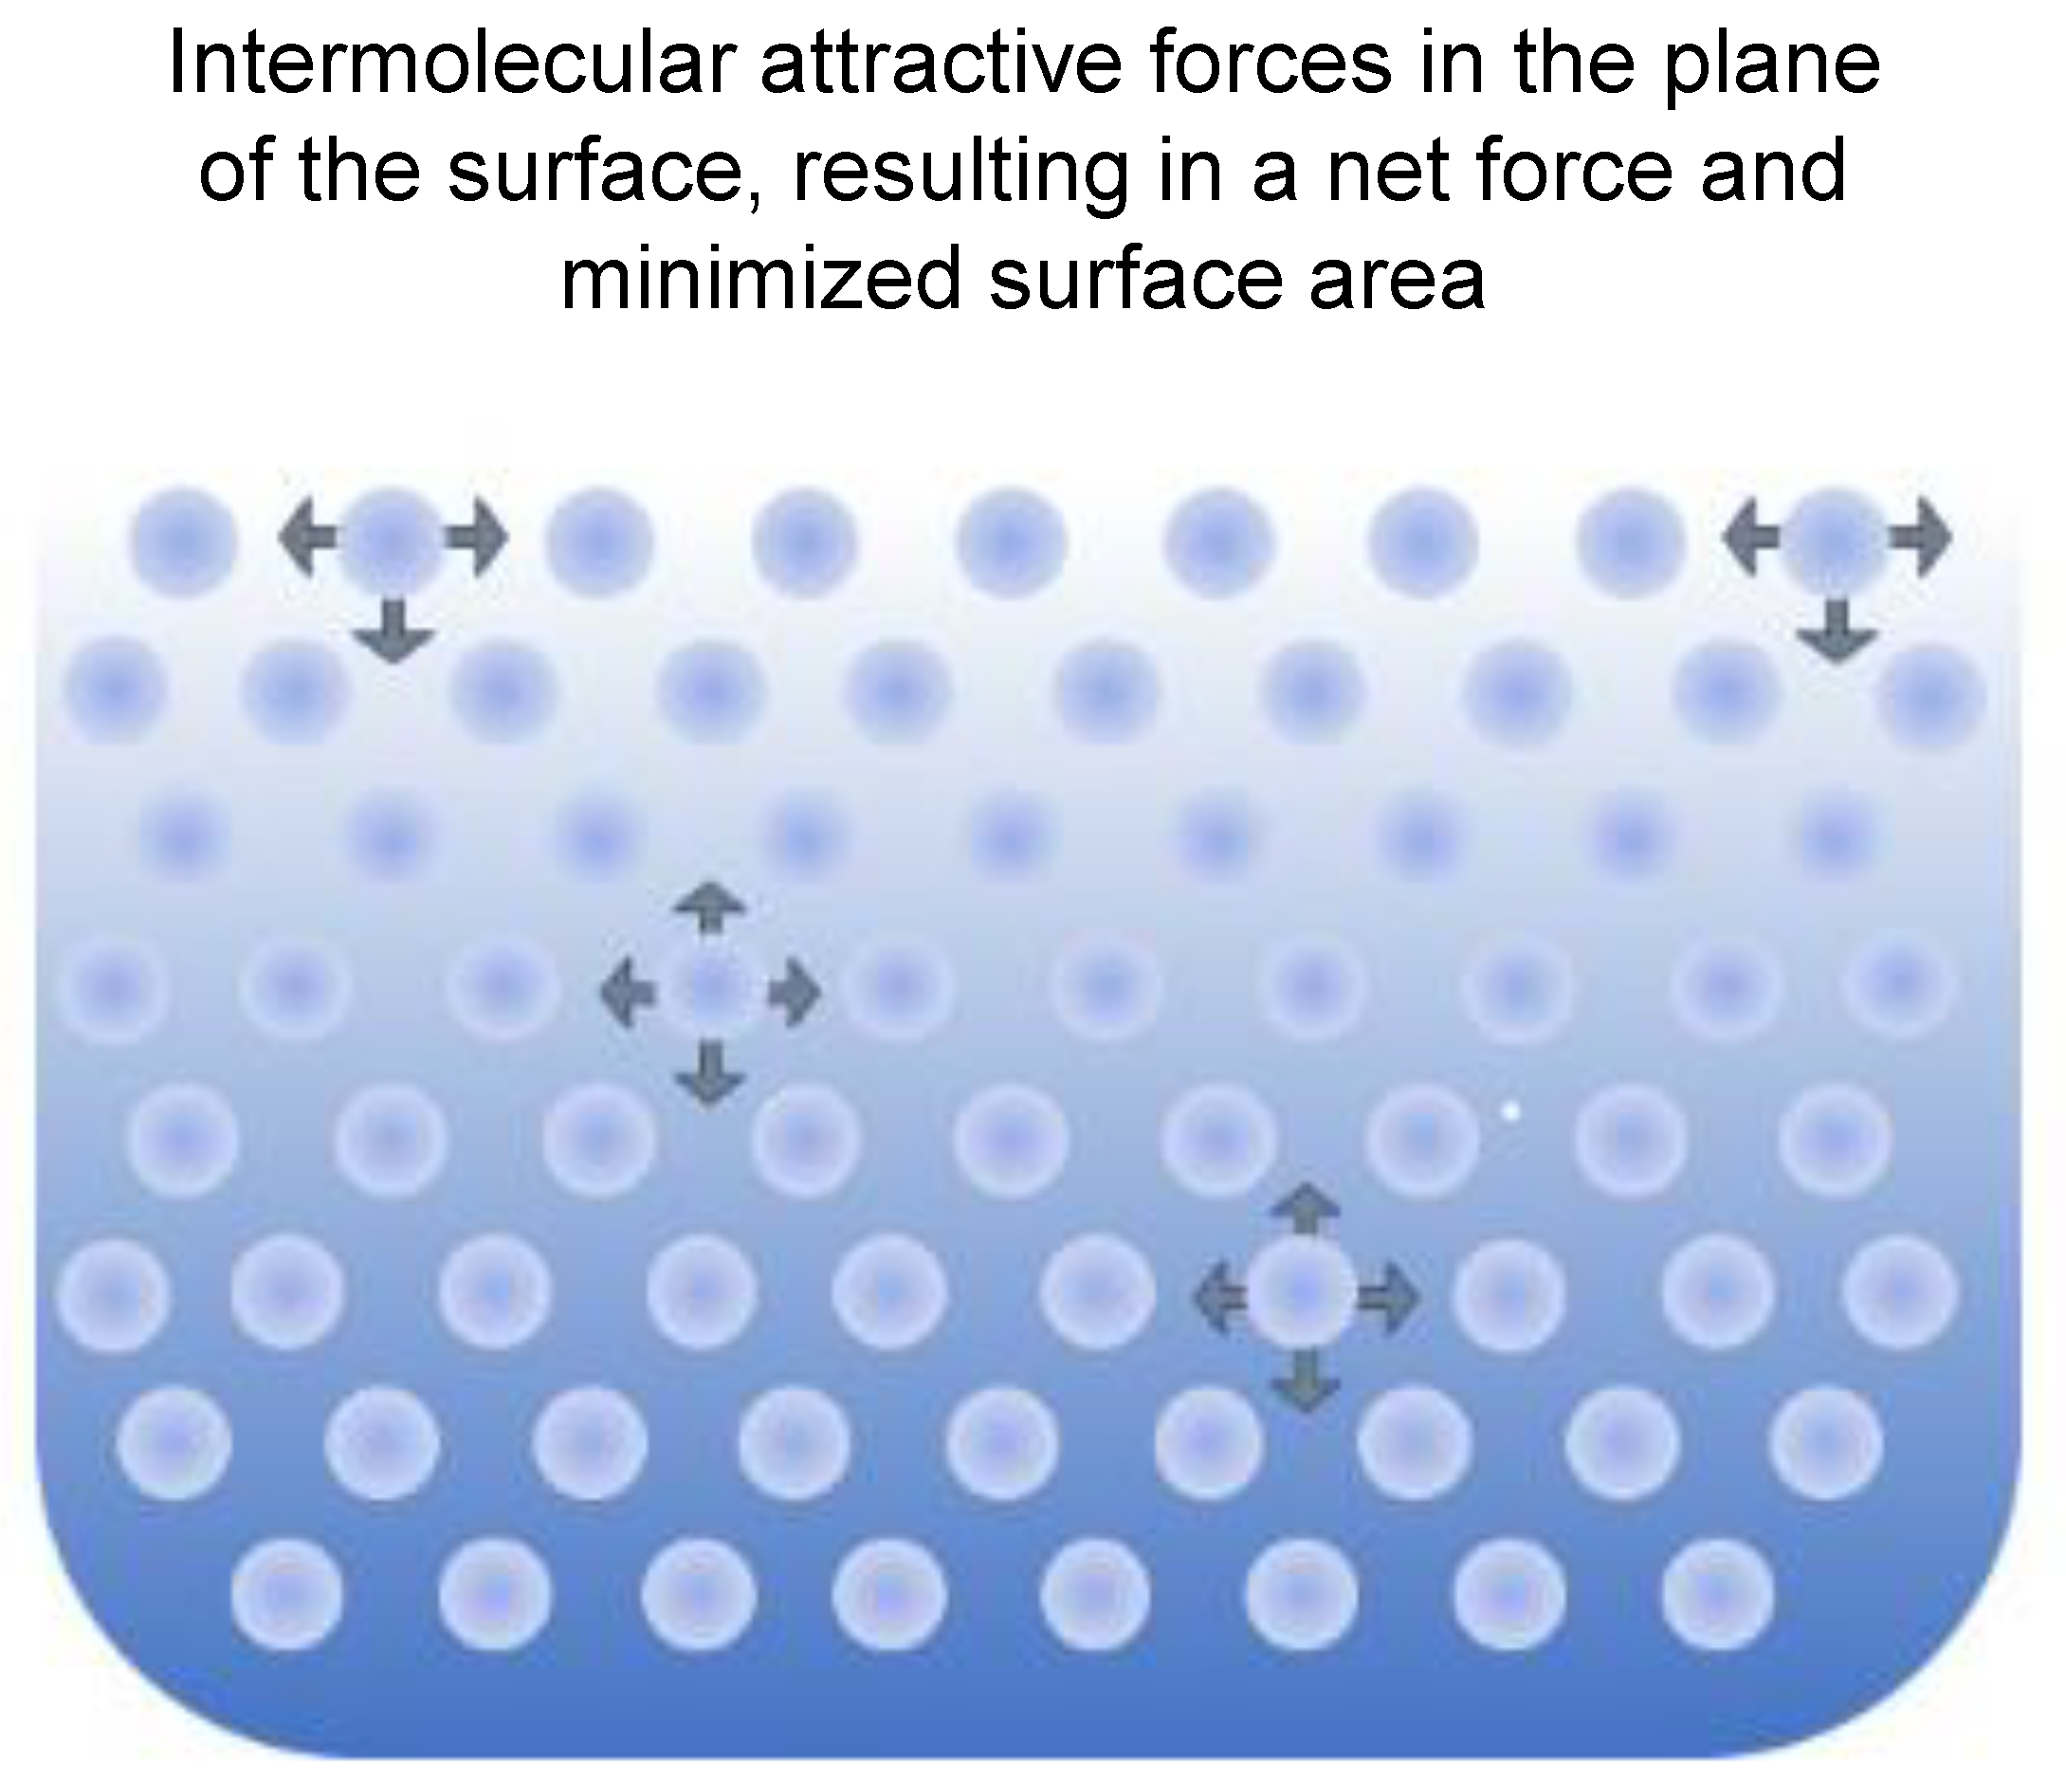
Surface and interfacial tension arise when the surface of a liquid comes into contact with another phase, either gaseous (surface tension) or liquid (interfacial tension). It is defined as the energy required to expand the surface or interface by one unit area [148]. This phenomenon occurs due to intermolecular interactions at the liquid surface, resulting from the attraction forces of molecules at the interface with other molecules of the same type inside the fluid. This phenomenon, illustrated in Figure 11, indicates that the smaller the interface area, the lower the force. Consequently, there is excess energy at the interface, and minimal energy is achieved by minimizing the interfacial area. As a result, the interface of the liquid tends to contract, creating an imbalance in the surface and a net force towards the interior of the liquid, as seen in Figure 11. The effect of these contraction forces gives rise to interfacial tension, enabling the interface to be stable and adopt geometries which minimize the interfacial area [113]. The details on the measurement of interfacial tension can be found in a recent review on the subject [119].
During the design of cosmetic products, evaluating surface or interfacial tension is crucial. Most cosmetics are dispersed systems formed by two immiscible phases (creating a surface or interface) that are thermodynamically unstable. Therefore, it is important to stabilize the system and keep the two phases forming a stable dispersion [149]. Surfactants (e.g., emulsifiers, foaming agents) are added to cosmetic products for this purpose. Surfactants adsorb at interfaces, decrease interfacial tension, and, under mixing, allow for the generation of more interfacial area, the elongation of the drops, and the formation of smaller droplets under shear conditions. Then, the surfactant film serves as a stabilizing layer, increasing the dilational elasticity at the surface or interface level due to Gibbs–Marangoni effects and generating a stable interface with lifetimes ranging from days to months, or even years [150].
The interfacial tension of a system depends on the surfactant structure and its interactions with its chemical environment. Various expressions have been developed and studied to characterize surfactants [151]. Griffin was the first to classify surfactants using the HLB (hydrophilic–lipophilic balance), considering the nature of the hydrophilic and lipophilic groups of a surfactant. However, this method does not account for the entire system (salinity, type of oil, temperature, cosurfactants), focusing exclusively on the surfactant. More comprehensive expressions have been developed for complete system characterization. The HLD (hydrophilic–lipophilic deviation) model, which considers a surfactant, the oil phase, the aqueous phase, temperature, and even pressure, is a semiempirical expression that allows to characterize the physicochemical situation of a system, with a surfactant contribution parameter (i.e., SCP, also called PACN, sigma or beta). Recent works have extensively outlined the use of the HLD equation for formulations in cosmetics, emphasizing the importance of its use in systems incorporating biobased raw materials [119,146,147,152,153].
Surface tension is an important factor to consider when evaluating cosmetic products, as valuable information about consumer perception of the products can be obtained from it. In hair products like shampoos, surface tension is crucial for foam formation and stability. The dynamics of the decrease in surface tension allow the product to present a high foamability with a pleasant perception for the consumer, enhancing the hair-washing experience [154].
Similarly, interfacial tension can significantly impact the absorption of active ingredients, like vitamins or antioxidants. Interfacial tension can influence the skin’s ability to absorb these ingredients. Fast interfacial tension dynamics and exchanges between the bulk and the interface can facilitate the penetration of ingredients into the skin and improve their efficacy [155]. It also provides information about a product’s application, mainly related to the performance of fluid flow when a low interfacial tension system is used. This allows the product to spread smoothly and be absorbed more effectively, without leaving a sticky or greasy feeling [155].

5.6. Contact Angle

Contact angle describes how a liquid interacts with a solid surface. It refers to the angle formed at the intersection of a liquid’s surface (e.g., a droplet of a cosmetic product) with the skin or any other solid surface it comes into contact with, as illustrated in Figure 12 [156].
The angle formed during the interaction of a liquid with a surface can indicate the wettability of the product and its ability to spread easily. However, establishing a clear correlation between contact angle, spreadability, and dispersibility is challenging, largely due to measurement difficulties. Most of the surfaces prepared in a laboratory to conduct wettability studies do not represent real-life applications or present some kind of hysteresis [157]. A lower contact angle between the product and the skin suggests a greater spreadability and may imply an improved dispersibility, a property which has been examined in detail in detergency studies [158]. Besides evaluating the contact angle in the final product, the contact angle is also assessed in raw materials relevant to the product’s sensoriality, such as emollients, to correlate the spreadability of the raw material with that of the final product. This approach aids in developing more efficient formulations, starting from the selection of raw materials [159].
Additionally, the contact angle can be used to assess the hydrophobicity of a formula, an important attribute when designing waterproof products, such as mascaras, and liquid lipsticks, among others. In these matrices, a very large contact angle is desired, indicating that the cohesive forces are superior to the adhesive forces, thus minimizing interaction with the surface. The contact angle in this case is evaluated by applying the product to the appropriate substrate (lashes, lips, etc.), adding a drop of water to the substrate, and measuring the angle formed [160].

6. Rheology

Rheology is the study of the flow and deformation of materials. It is an important field of research with applications in many different industries, including cosmetics [3,161]. Measuring and understanding the rheological properties of cosmetic samples is essential for comprehending the microstructure and behavior of these products [162,163]. In the cosmetics industry, rheology is employed to study the viscosity and other rheological properties of products such as hair conditioners, facial creams, and lotions. These properties are important for determining the performance and stability of these products [161]. In addition, rheological measurements can be used to predict how a cosmetic product will behave under different conditions, such as when applied to the skin or when exposed to different temperatures [164].
This section will discuss the principles and applications of rheology in the cosmetics industry. We will first provide a brief overview of the field of rheology and its importance in the study of cosmetic samples. Then, we describe various types of rheological measurements and the factors that affect rheological properties. We end with a discussion on the role of rheology in the development and formulation of new cosmetic products and provide some case studies to illustrate the use of rheology in the cosmetics industry.

6.1. Principles of Rheology

Rheology is a branch of physics that deals with the mechanical behavior of materials under the influence of external forces. The rheological properties of a material are determined by its microstructure and the interactions between its molecules. These properties can be affected by a variety of factors, such as temperature, concentration, and applied forces. [161,165]. Viscosity is a measure of the resistance of a fluid to flow. It is a property that is important for determining the performance and stability of cosmetic products. The viscosity of a cosmetic formulation determines how easily it can be applied or spread over the skin or hair and how well it will distribute throughout the surface or strands [166,167]. Several types of rheological measurements are commonly used in the cosmetics industry. On the one hand, oscillatory rheometry is used to measure the complex shear modulus, the storage and loss moduli, and the phase angle of a sample. On the other hand, extensional rheometry is used to measure the extensional viscosity of a sample and its behavior under the influence of significant normal forces within the fluid [161,168]. Such is the case of systems containing very high molecular weight polymers and nanoparticles, which tend to form a viscoelastic network.
Viscosity is a temperature-dependent property, meaning that it can be affected by changes in temperature. The viscosity of a cosmetic product may increase or decrease based on the temperature at which it is stored or used. Consequently, it is important to measure the viscosity of cosmetic samples at a range of temperatures to understand their behavior under different conditions [169,170]. Factors such as the type of surfactant, internal phase content, or emulsifier concentration also impact the rheological properties of a cosmetic sample. As the concentration increases, its viscosity generally increases as well. This is attributed to the increased concentration within the sample, leading to more interactions between the particles, which increases the resistance to flow [171,172]. Additionally, the type and magnitude of forces applied to a sample can alter its rheological properties. For instance, the viscosity of a cosmetic product, whether it is a shampoo, conditioner, cream, or gel, may change if it is subjected to shearing (forces causing flow in a particular direction) or extensional forces (forces causing stretching in one direction) [173,174].
Rheology information can be used to assess the performance and stability of cosmetic products and to develop and formulate new cosmetic products [161,168]. One of the key challenges in the study of rheology is the fact that the behavior of materials can be very complex and can vary depending on the specific conditions under which they are studied. This means that it is often necessary to use a combination of different rheological techniques to understand a given material’s behavior [173,175].

6.2. Applications of Rheology in Cosmetics

Rheology can be used to assess how a sample behaves under flow conditions, such as when applied to the skin or exposed to different temperatures [161,168]. The viscosity of a hair conditioner is an important factor in determining its performance. A high-viscosity conditioner may be difficult to apply and may not distribute evenly throughout the hair, while a low-viscosity conditioner may not provide enough conditioning. Measuring a hair conditioner’s viscosity at various temperatures allows for assessing its behavior during consumer use [166].
Beyond performance prediction, rheology is instrumental in studying the stability of cosmetic products. For instance, the viscosity of a facial cream may vary over time due to exposure to temperature fluctuations and other environmental factors. Monitoring the cream’s viscosity over time can foresee changes and identify potential stability issues [176,177]. Extensional rheometry can provide insights into a cream’s resistance to stretching, a factor that contributes to its moisturizing effects and its ability to preserve skin structure.
Rheology also aids in understanding the microstructure and behavior within cosmetic samples. Using oscillatory rheometry, the complex modulus, storage modulus, and loss moduli of a hair conditioner can be determined. These measurements offer an understanding of the conditioner’s viscoelastic behavior, which is related to its ability to condition hair and maintain hairstyle integrity [166,178].

6.3. Applications of Dynamic and Oscillatory Rheology Measurements in Cosmetics

Rheology plays a crucial role in tailoring cosmetic products to meet specific functional and sensory requirements. The rheological properties of cosmetics, which can be in the form of emulsions, dispersions, suspensions, or foams, are pivotal for their application and performance [179]. The flow behavior of these materials is often studied through the flow curve of viscosity versus shear rate, which provides insights into their behavior under different shear rates [133,178]. This is key for understanding how these products behave in real-world applications, such as spreading on the skin or enduring high shear rates during vigorous applications like rubbing sunscreen [162].
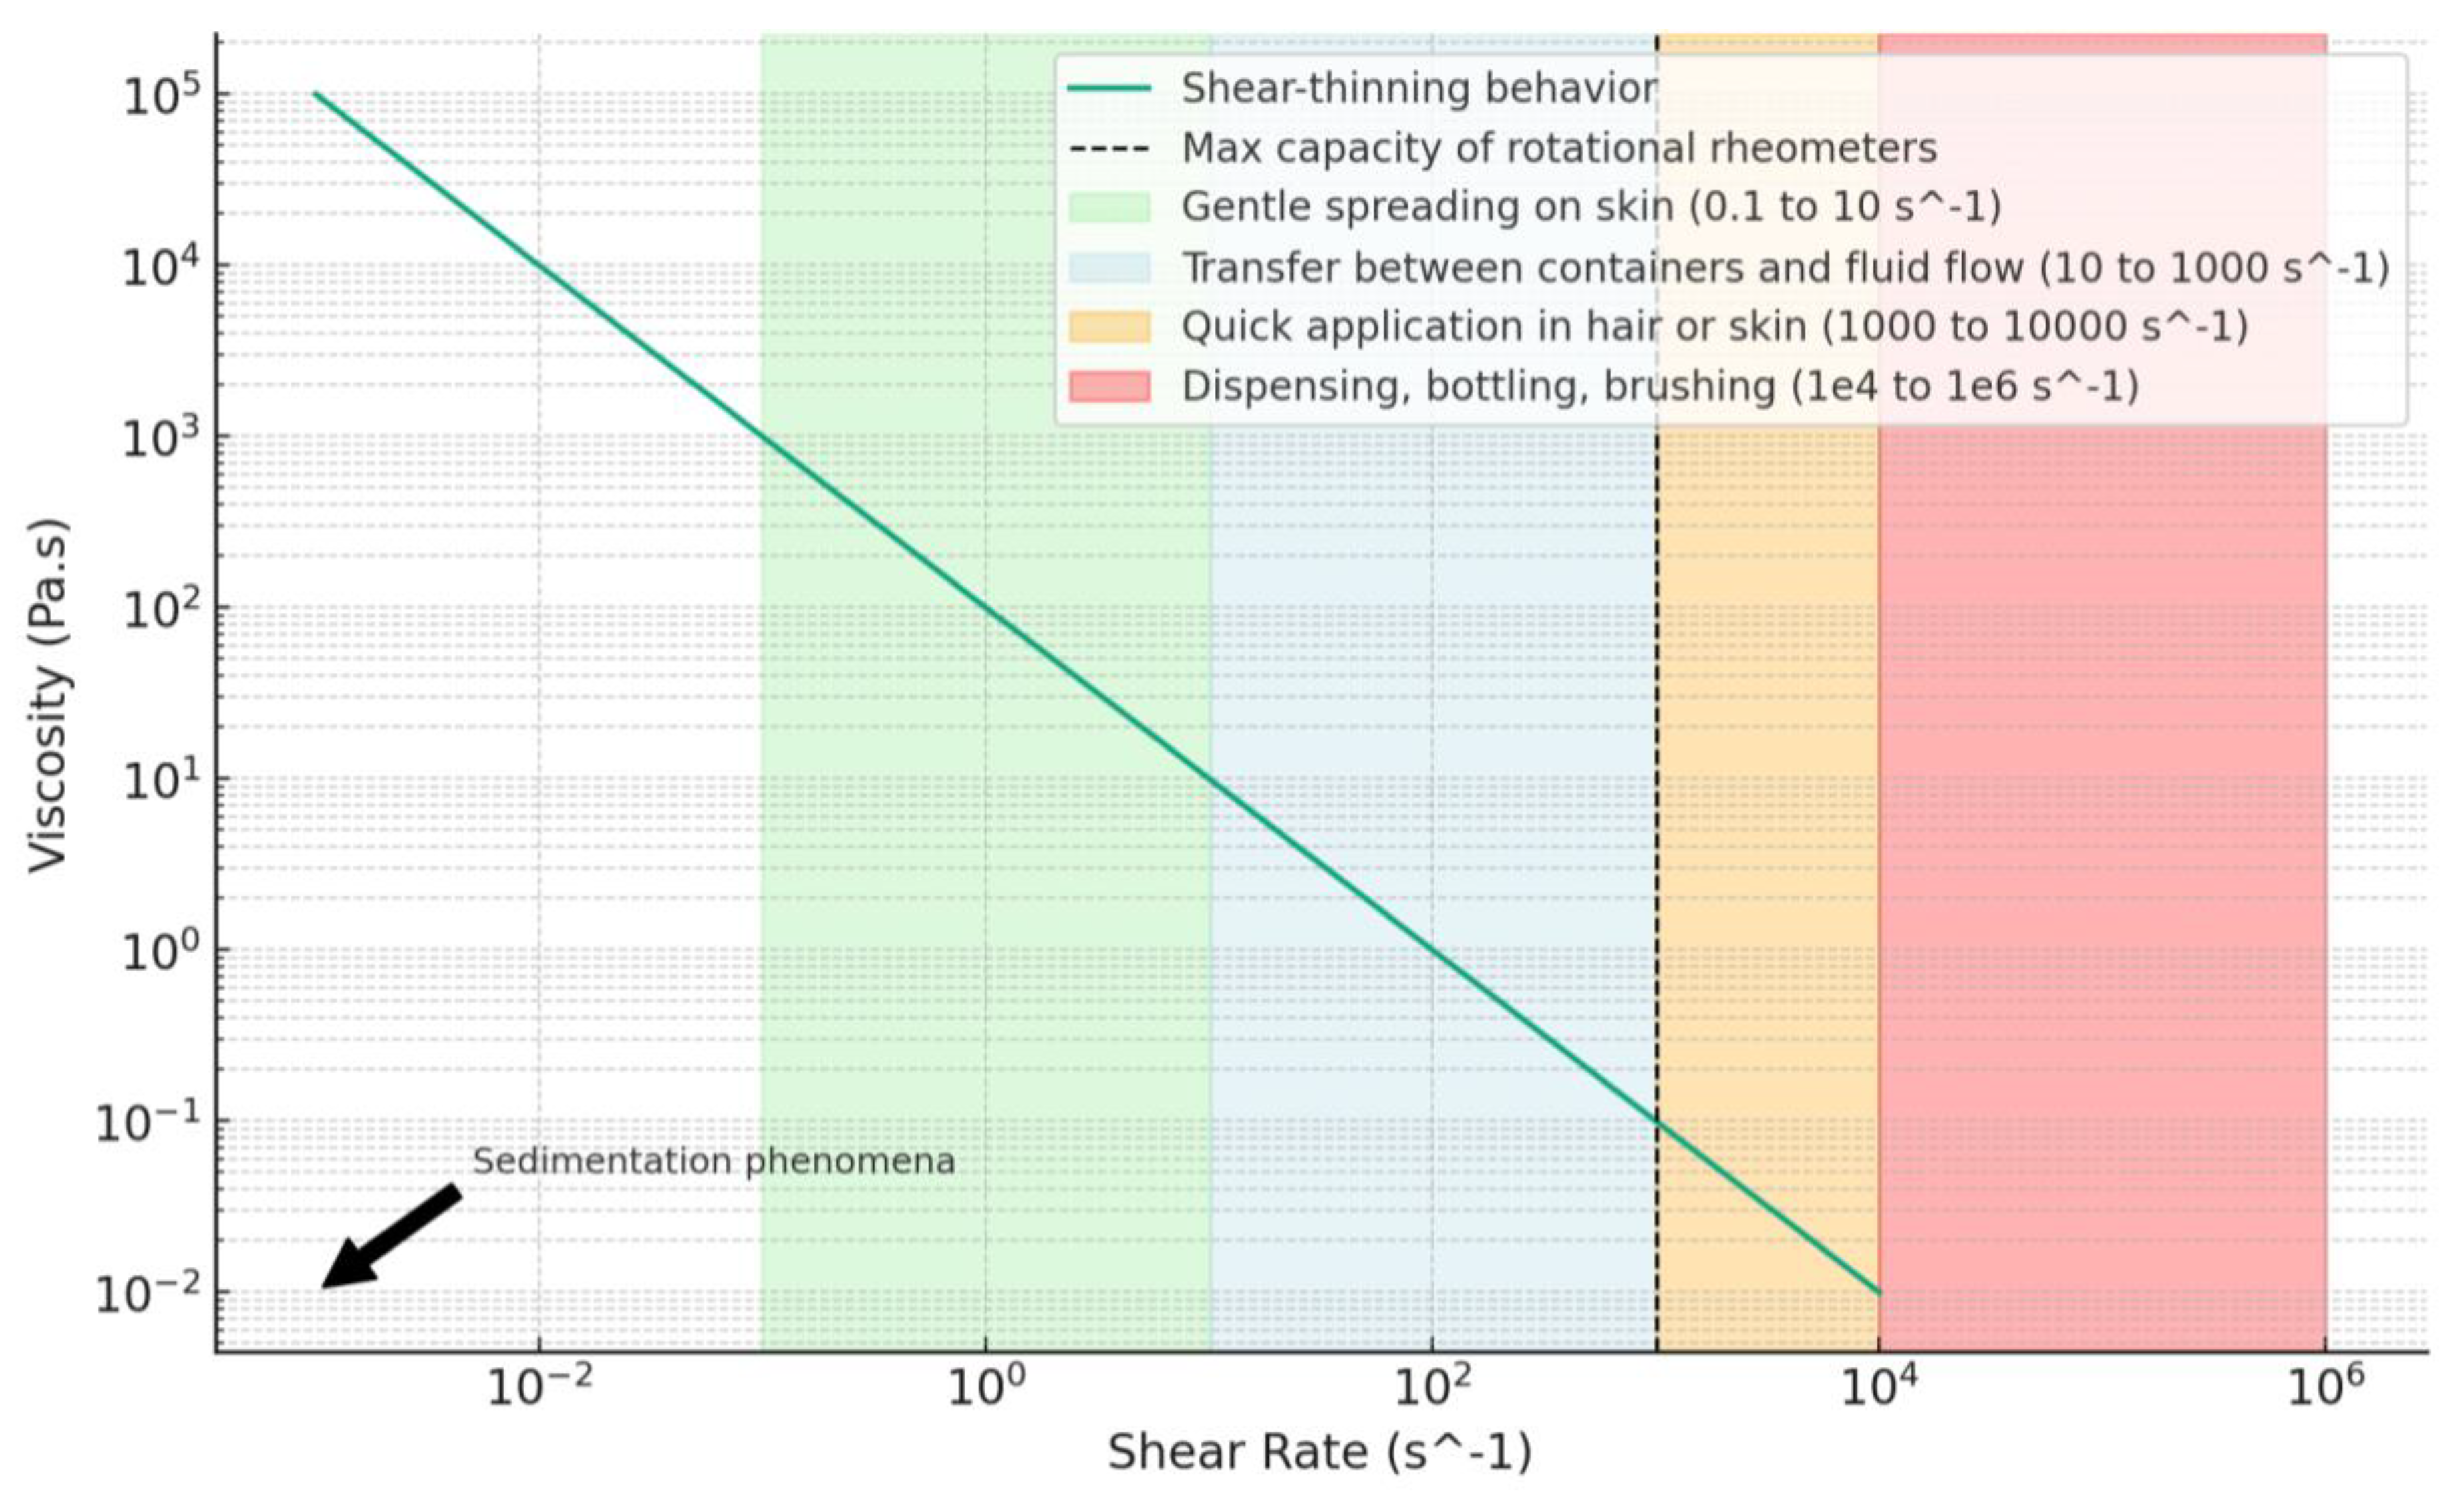
At very low shear rates (as depicted in Figure 13), phenomena like sedimentation can be observed, which are crucial for the stability and quality of the product. In the 0.1 to 10 s−1 shear rate range, behaviors relevant to the spread of cosmetics on the skin, such as applying a cream or lotion, are significative. This range is also important for processes like detergency under slow shear conditions. Shear rates from 10 to 1000 s−1 are typical when transferring cosmetics between containers. More robust applications like quickly applying sunscreen or cleansing cream require shear rates from 1000 to 10,000 s−1 or higher. In dispersion processes or scenarios, like brushing with toothpaste, extremely high shear rates ranging from 105 to 106 s−1 can be found [161,164].
Understanding and analyzing these varying shear rates is essential for a comprehensive rheological analysis of cosmetics, as they closely simulate practical applications. However, measuring these behaviors can be challenging due to the limitations of rotational rheometers, which typically max-out around 1000 s−1 (Figure 13). Especially with concentric cylinder geometries, cone–plate, or plate–plate, at very high shear rates, the sample may escape from the system, highlighting the need for careful consideration of both the application conditions of the product and the capabilities of rheological measurement techniques.
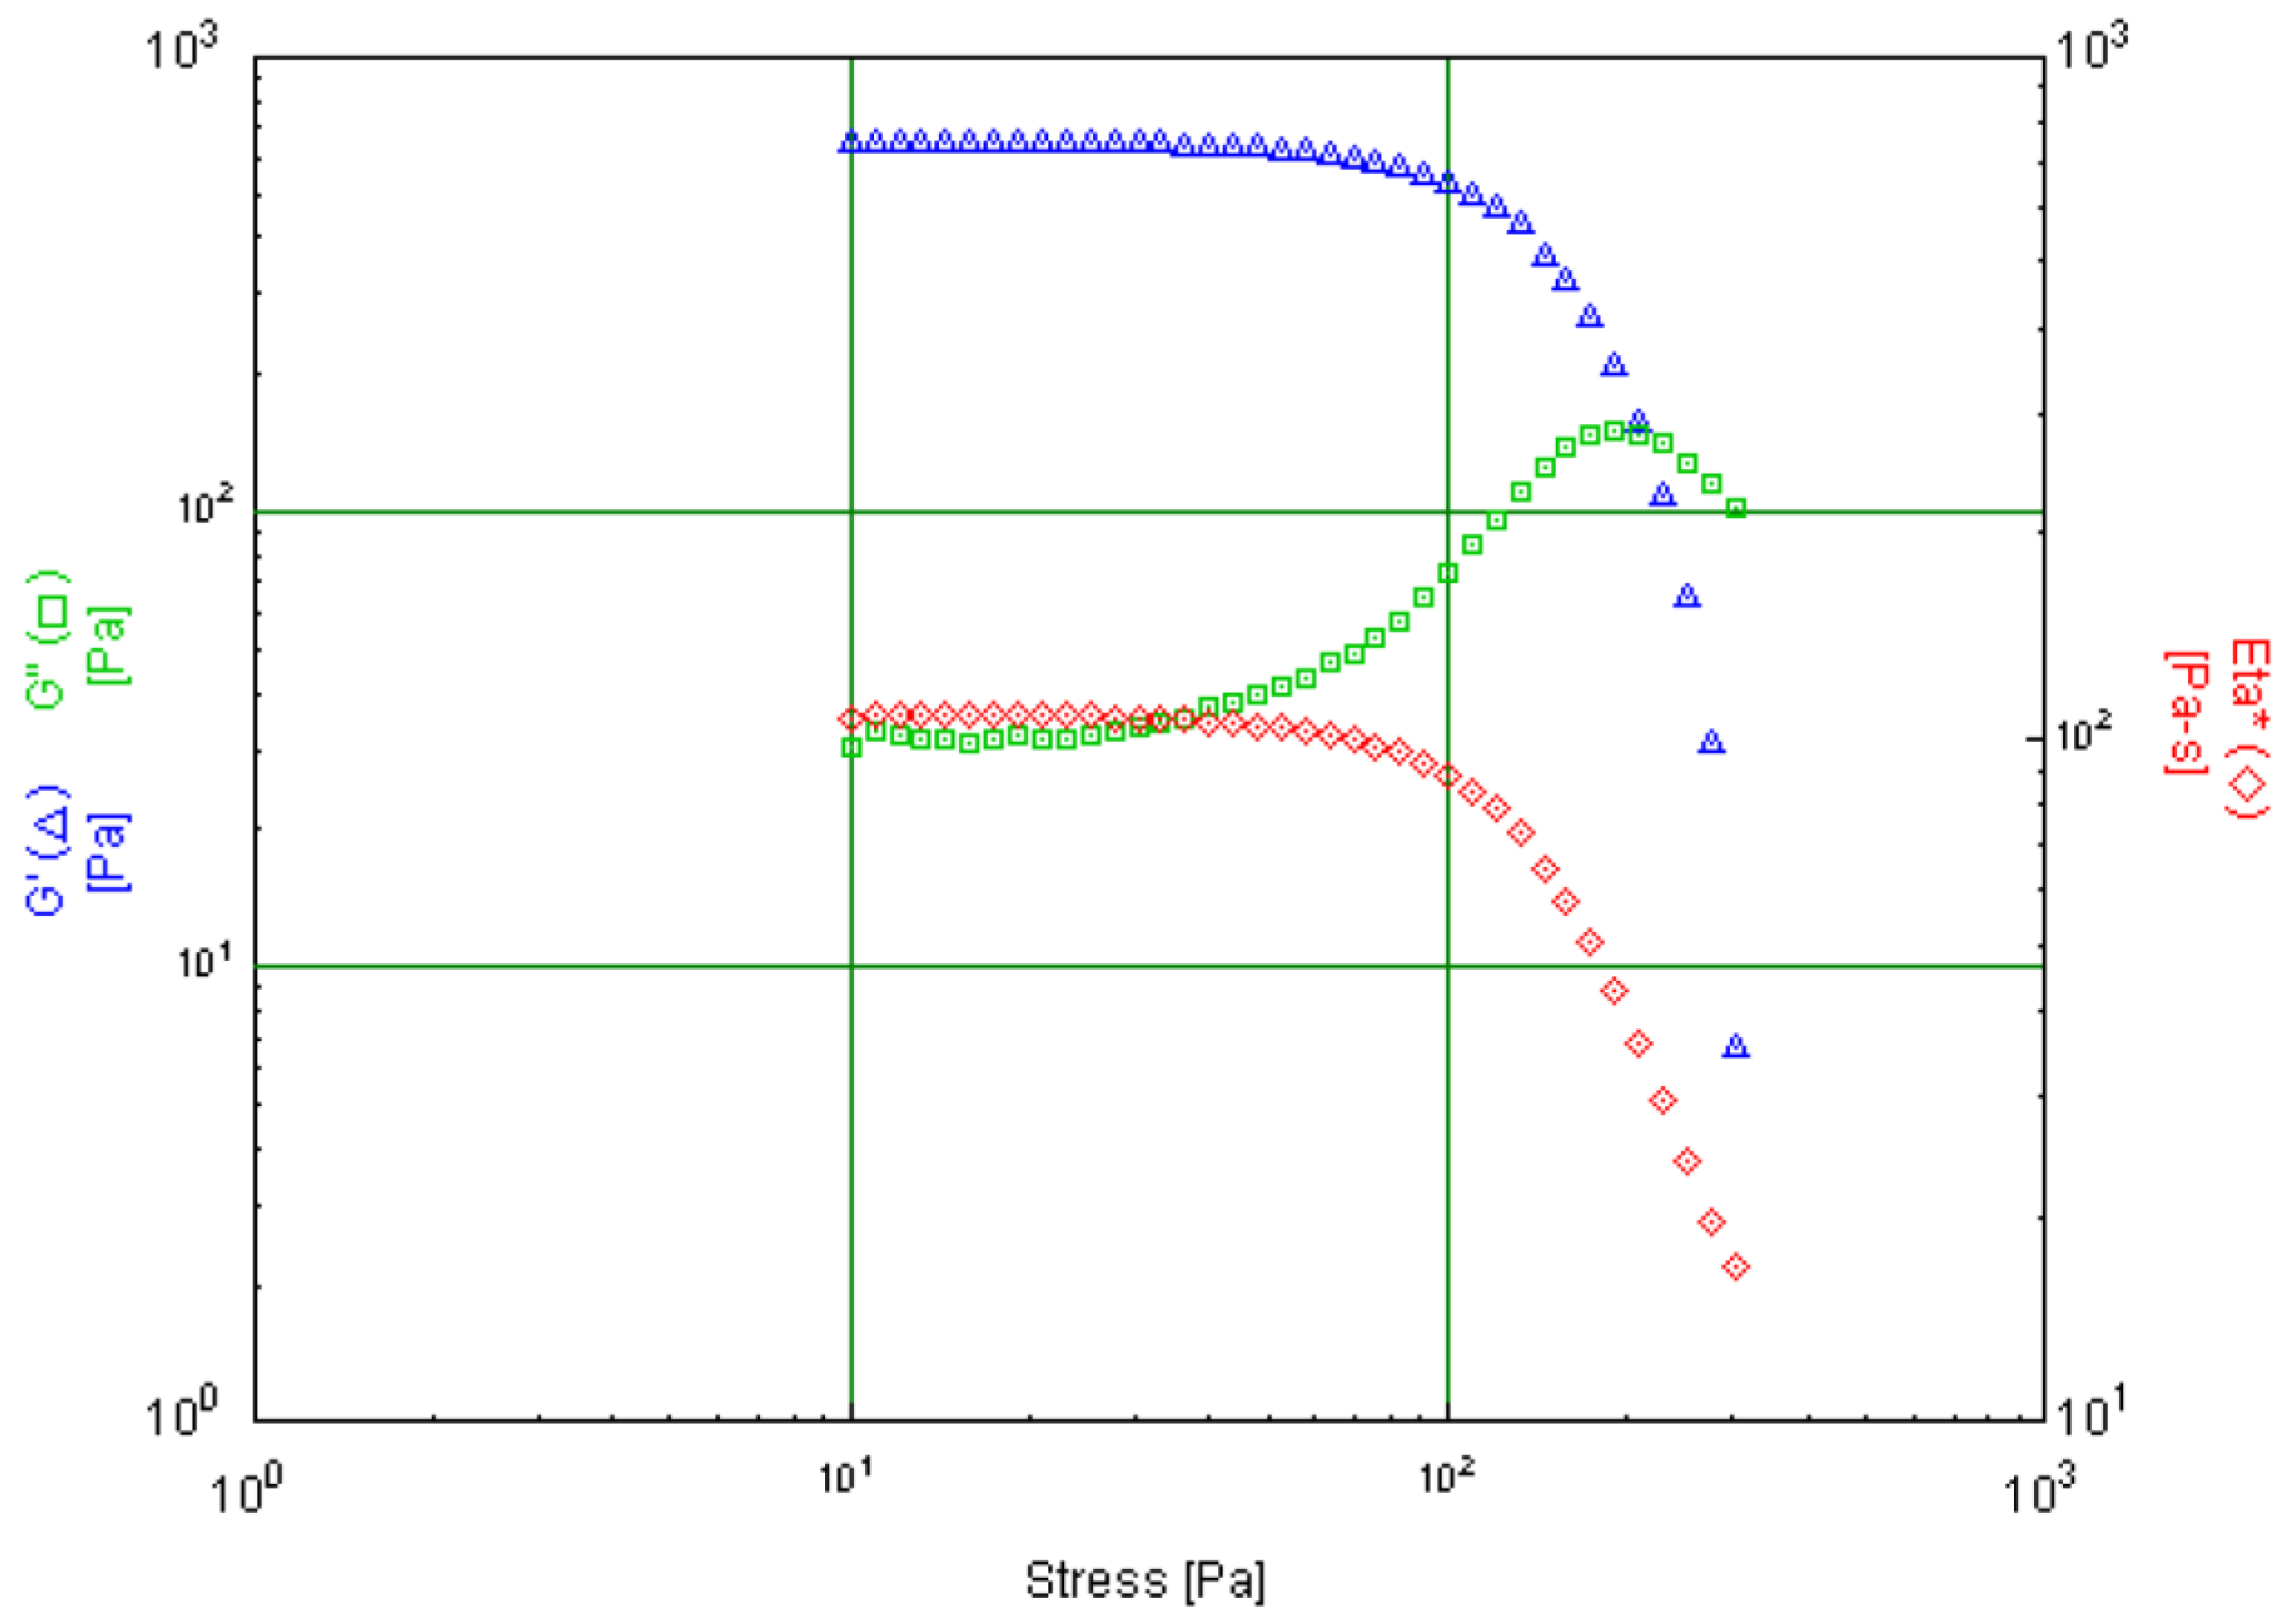
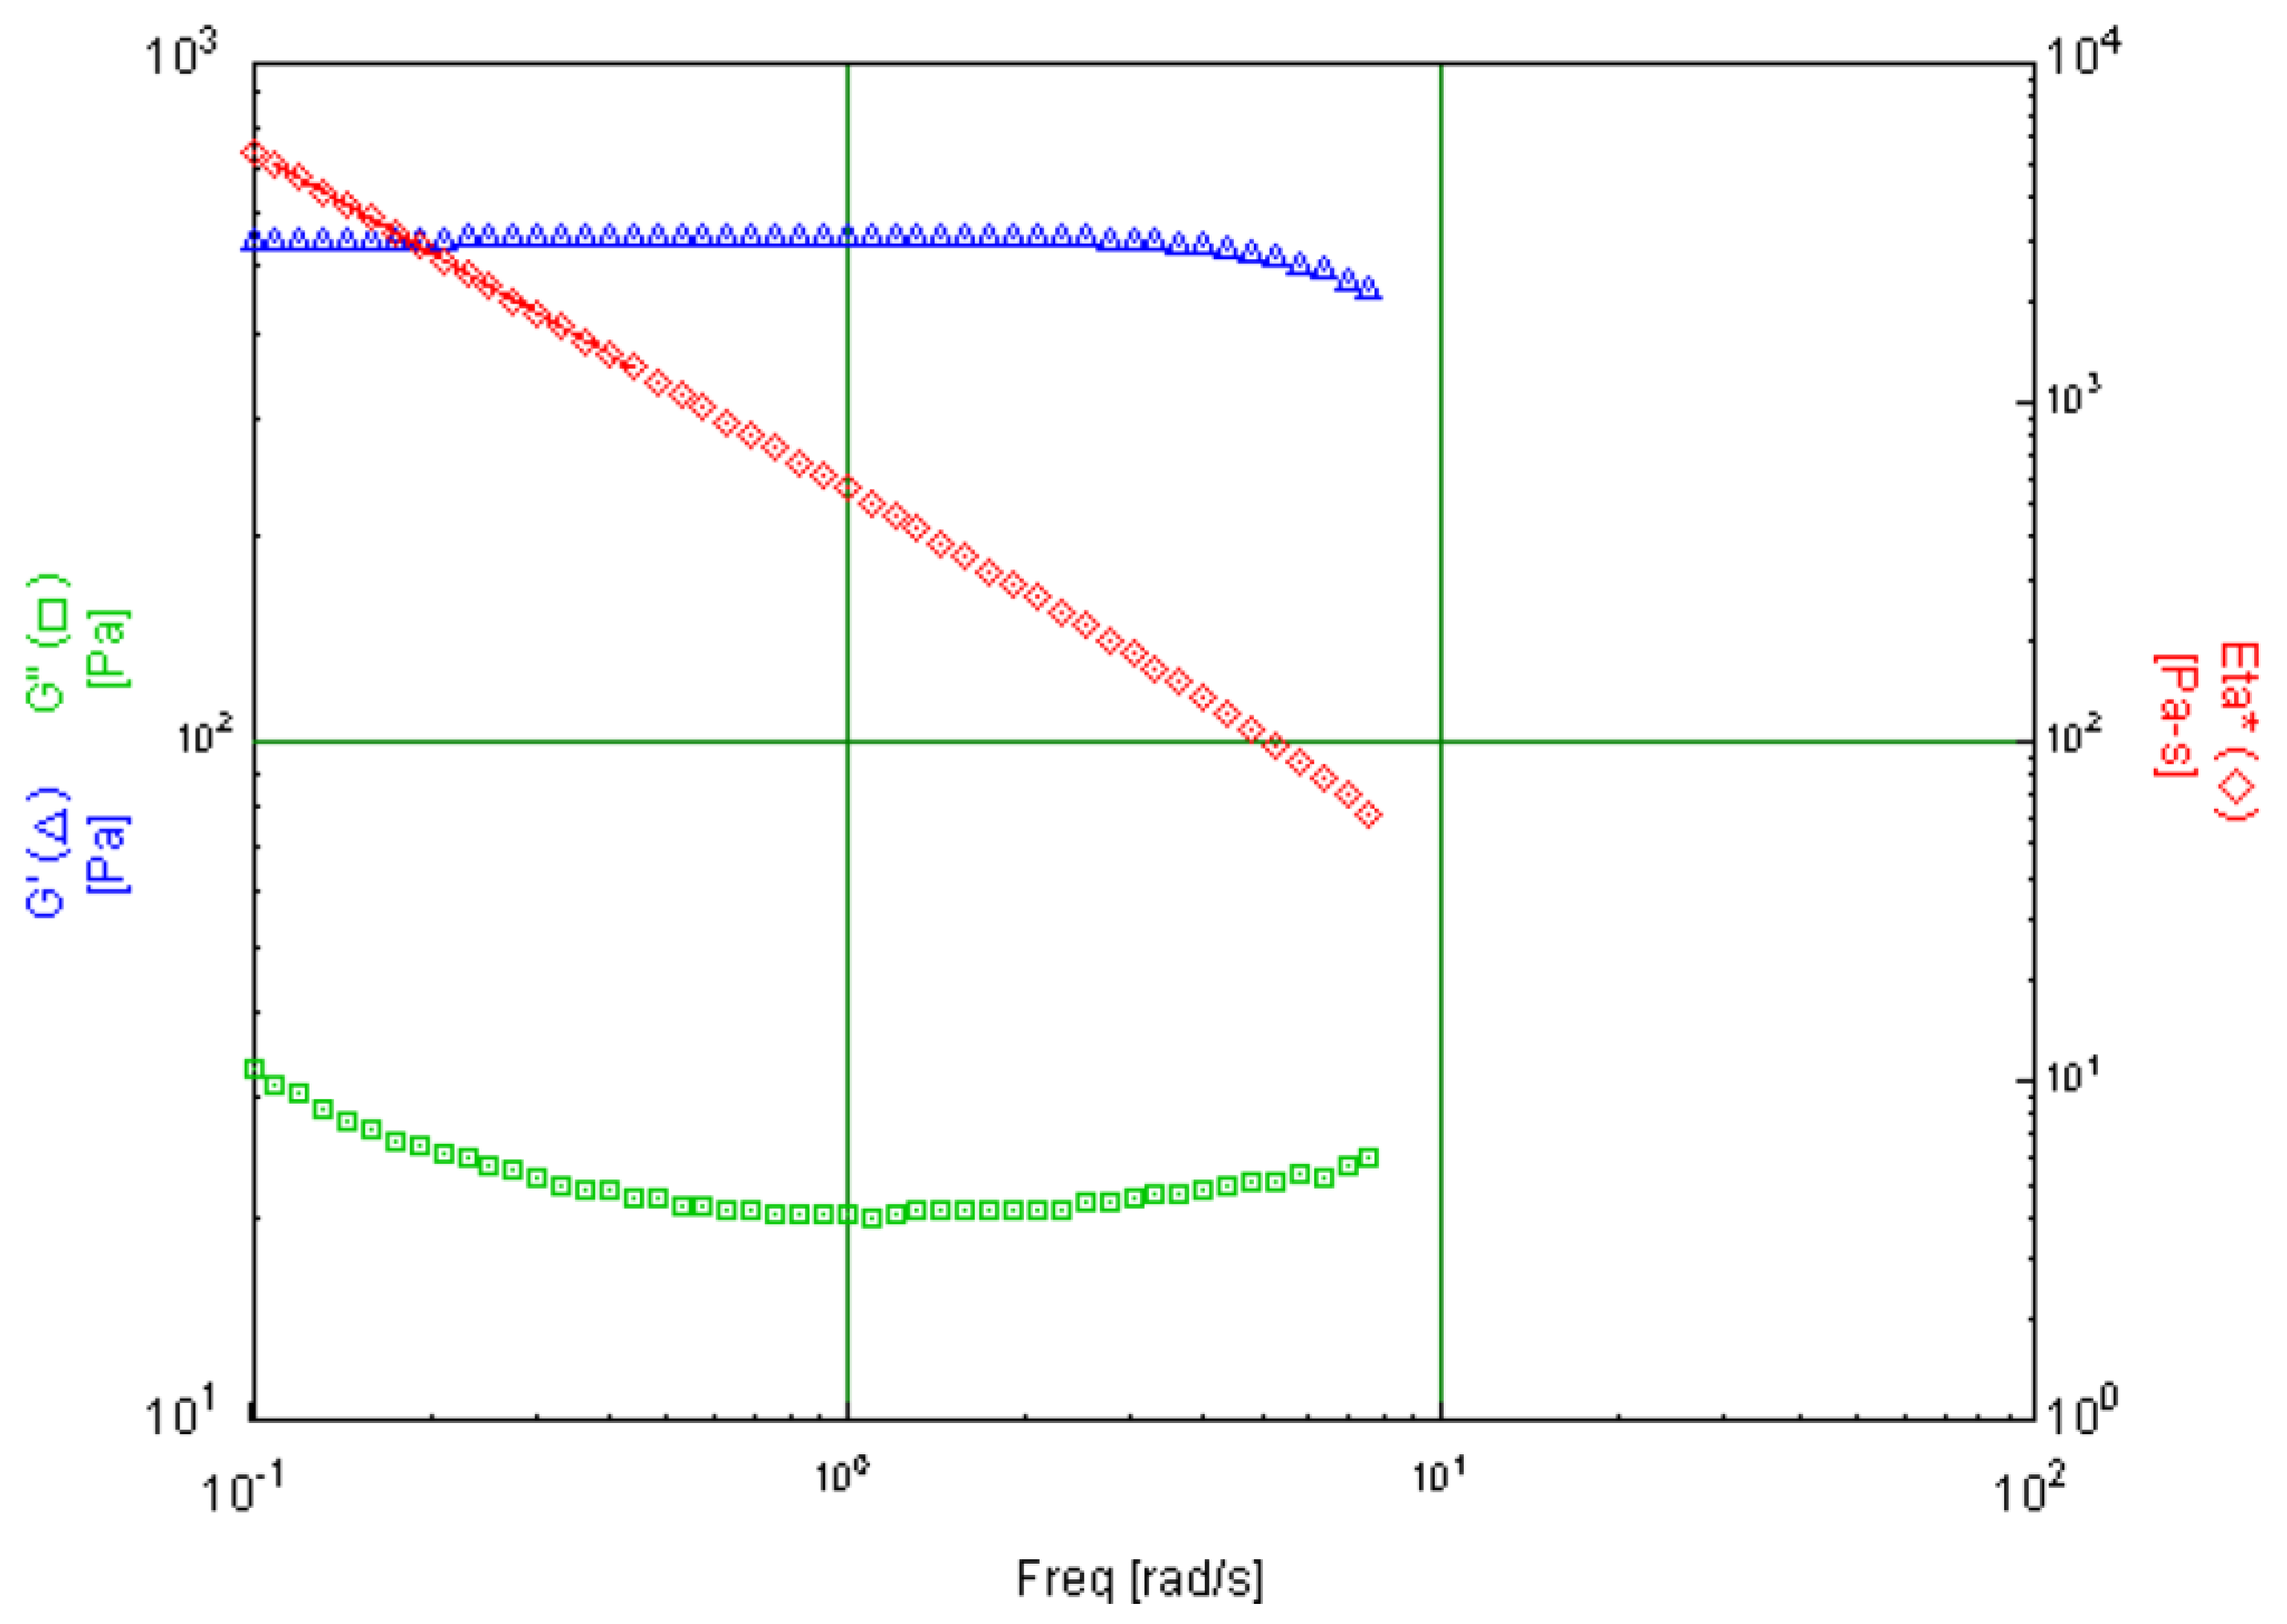
The use of oscillatory rheology in the measurement of cosmetics, particularly for understanding microstructure formation, is multifaceted [180,181]. In this context, materials forming microscopic networks, such as those with added polymers, particles, and polyelectrolytes, typically exhibit a viscoelastic response. This is characterized by a higher elastic modulus compared to the viscous modulus and a high complex modulus (Figure 14). For systems with little structure, the complex modulus is lower, and, in the absence of structure, the viscous modulus dominates, indicating a phase angle closer to 90 degrees, characteristic of viscous behavior.
Oscillatory rheology is pivotal in studying the initial formation of systems, especially dispersions. One key measurement is the fluid flow at very low shear rates, i.e., the yield stress, determined at the point where the system begins to deform under applied stress or at the intersection point of storage and loss curves during a frequency sweep. The relaxation time, another critical metric, is found at the low-frequency point where the curves of elastic and viscous behavior intersect [182].
Additionally, oscillatory rheology indirectly monitors the evolution of a system over time, assessing changes in the material structure after its formation. For example, in emulsion systems with added polymers, there is often an initial increase in the storage modulus relative to the viscous modulus as the system gains structure. This dynamic evolution is crucial for understanding the system’s formation and stability. This approach is essential for formulating cosmetic products that meet specific performance and sensory requirements [180,183,184].
In Figure 14, a rheological profile of a concentrated emulsion system is presented, consisting of triglyceride oil dispersed in an aqueous phase stabilized by a biobased surfactant (lecithin). The profile demonstrates that both the storage modulus (G′) and the loss modulus (G″) are both stress-dependent. G′ exceeds G″ by approximately an order of magnitude, suggesting a viscoelastic nature with a predominantly elastic character [179,182]. A critical point, where G′ and G″ intersect, marks the yield stress point (Figure 14, top panel). Such behavior is characteristic of a highly elastic system, in this case, a concentrated emulsion with an internal phase volume of around 50%, where droplets are almost touching each other under shear conditions.
Figure 14 (bottom panel) shows the frequency sweep results. The stress sweep is essential in determining the linear viscoelastic region, typically observed between 1 and 10 Pa [161]. During the frequency sweep, performed at a constant stress within this linear range, G′ consistently surpasses G″ as frequency increases, indicative of a system where elastic behavior predominates. G′ is about an order of magnitude larger than G″, while the complex viscosity exhibits a decline, with a slope near −1, further corroborating the system’s highly elastic nature and suggesting the formation of a network structure, likely attributable to the substantial surfactant concentration and internal phase. This study, initially aimed at developing pharmaceutical emulsions, also has implications for cosmetic products [182]. The triglyceride oil content, along with the potential addition of active components like vitamins or anti-aging agents, makes these emulsions suitable for cosmetic applications.
In the particular instance of a highly elastic system, the storage modulus significantly surpasses the loss modulus (Figure 14 bottom panel). However, in the majority of cosmetic emulsions, suspensions, or foams, these systems display viscoelastic properties, with their phase angles usually around 45 degrees, or, in some cases, the loss modulus may even exceed the storage modulus. This situation indicates the formation of some network within the system, although with less intense molecular interactions compared to a highly elastic system [161].
For researchers and quality control specialists in the cosmetics industry, it is essential to recognize the varied rheological behaviors that can arise in oscillatory rheology experiments. Cosmetic formulations may exhibit a broad spectrum of rheological properties, influenced by factors such as the composition of the formulation, the type of emulsifier used, and the concentration of the internal phase. Accurately interpreting rheological data and effectively applying them in both research and product development allows for the understanding of these differences [179].

6.4. Discussion of Specific Cases

The study of rheology is important for understanding the microstructure behavior in cosmetic samples. New rheological techniques are emerging, allowing for more precise measurements of the rheological properties of cosmetic samples [183]. Additionally, the use of computer modeling and simulation may become more prevalent, enabling predictions of the rheological behavior of cosmetic samples under a broader range of conditions [181]. In Table 6, a discussion of some examples of the use of rheometry in cosmetic samples is presented, including hair gel, nail polish, and skin cream [161,179,183,185].

7. Colorimetric Analysis in Cosmetics

Color plays a significant role in influencing consumer preferences and the acceptance of a product across diverse industries [186]. When assessing color, perception and sensory qualities are crucial for ensuring product quality and consistency. This is especially vital in the cosmetics industry, given the wide variety of products involved. For example, a pink shade in a lip gloss differs from that in a matte lipstick. Furthermore, within the same product category, there are various shades to manage, such as different red tones in lipsticks. Therefore, having a tool capable of distinguishing between these shades is essential for ensuring customer satisfaction [187].
Color evaluation of cosmetic products can be conducted in the following two ways: through visual assessment or instrumental analysis. Chromatic attributes and various geometric factors, such as texture, shape, etc., can be qualitatively evaluated by the human eye. In this process, the observer assesses the color of the sample under standard lighting conditions, and, following a comparison with defined color standards, the evaluation is articulated in terms of certain scores [188]. Such visual evaluation is subjective, relative, and depends on both the observer and the environmental conditions. On the other hand, colorimetric attributes can also be quantitatively assessed using different types of equipment like colorimeters, spectrophotometers, and spectroradiometers [189].
In contemporary times, color evaluation has evolved to a more sophisticated level. In the past, the primary aim was to simply compare a pattern to a sample to prevent disparities [190]. Building upon this knowledge, color holds paramount importance within the cosmetics industry. It serves multiple purposes, including meeting commercial quality standards, improving a product’s visual appeal, and assessing how human skin responds to the application of a specific formulation [187]. From the raw materials to the final product, different protocols exist to assess color. By employing advanced instruments, software, and controlled lighting environments, both researchers and manufacturers can expedite the development of superior products [191]. These tools enable the precise assessment and management of color characteristics in diverse samples, encompassing powders, semi-solids, liquids, and even human skin. Consequently, they facilitate the maintenance of a consistent quality across different production batches, thereby enhancing responsiveness to the current market requirements [192].

7.1. Color and Its Conformational Elements

A visual impression of the material is typically established by the color of its surface, and this is the initial sensory input for consumers when evaluating its acceptability [189]. Color is a facet of visual perception that proves challenging to precisely define or quantify; it is essentially the sensation through which an observer discerns variations between two visual fields, marked by differences in the spectral composition of the observed radiant energies [191]. In this context, the color of an opaque object is described by the relationship between its light reflectance and the wavelength of light [193].
The perception of any color by the human eye requires a combination of three essential elements: a light source illuminating an object, the object reflecting or transmitting light to an observer, and the observer perceiving the reflected light (Figure 15) [194].
Light sources emit the electromagnetic energy essential to trigger visual reactions. Humans can perceive electromagnetic energy within a wavelength range spanning approximately 400 nm to 700 nm, which is commonly referred to as the visible spectrum [186]. The chromatic attributes of light sources are defined using the following two methods: measurement and standardization. The distinction between these two techniques is clarified in the definition of light sources and illuminants [195]. Light sources are real physical emitters of visible energy. Incandescent bulbs, the sky at a given time, and fluorescent tubes represent examples of light sources. Illuminants, on the other hand, are simply standardized tables of values representing a typical spectral power distribution of some particular light source. Therefore, the CIE (Commission Internationale de l’Éclairage), the international authority on light, lighting, and color, has published spectral output data for various illuminants to facilitate and standardize colorimetric calculations [196]. These illuminants include the following: D65-daylight, color temperature 6500 K; A-tungsten, color temperature 2856K; F2-fluorescent, cool white; and F11-fluorescent, cool white narrow band. The spectral output data of the CIE illuminants are used in the process of calculating the color of illuminated objects [197].
In colored objects, the interaction of radiant energy with materials obeys the law of conservation of energy. There are only three destinations that radiant energy can have when it hits an object, as follows: absorption, reflection, and transmission [198,199]. As for the observer, the human eye/brain system perceives color through three types of sensors (cones), located in the retina of the eye. Thus, each type of these cones is selectively sensitive to light from a region of the visible electromagnetic spectrum: red (λ~650 nm), green (λ~530 nm), and blue (λ~430 nm). About 60% of these cones are red, 30% green, and only 10% are blue. Additionally, their distribution is not uniform along the retina. The processing of cone signals by the brain eventually produces output sensations interpreted as red, green, and blue (and/or combinations and differences of these primary colors) [200]. Based on the individual information that the three types of cones simultaneously send to the brain when stimulated by a chromatic stimulus, the brain can interpret all colors, which gives color perception its three-dimensional character [201]. It is proven that the human eye does not respond uniformly to the entire visible spectrum, being more sensitive to some radiations than others, hence the subjective nature of color perception [202].

7.2. The Metric of Color

Colorimetry, or the science of color measurement, allows for the description, ordering, and comparison of colored objects in a logical and repeatable manner, replacing subjective color responses with an objective numerical system, thus facilitating satisfactory color communication. Such successful color communications are essential for effective industrial colorimetric control [203].

7.2.1. Munsell Color System

In the history of color, many individuals have attempted to devise methods to express color quantitatively. As an example, in 1905, the artist Albert Henry Munsell introduced a systematic method for characterizing color by focusing on the concept of perceived equidistance. To achieve this, he utilized decimal notation instead of color names. For this purpose, Munsell used a large number of color chips of paper of different hue (Munsell hue), lightness (Munsell value), and saturation (Munsell chroma) for visual comparison with a standard color [204].
Thus, the Munsell system is represented using a circular scheme positioned at the center of the model. Additionally, it consists of an irregular cylinder with the axis of values (light/dark) running up and down through it. The dark colors are at the bottom of the tree and the light ones are at the top, measured from 1 (dark) to 10 (light) [205]. Each horizontal cut of the cylinder through the axis is a circle of hues, which is divided into five principal hues—red, yellow, green, blue, and purple—and five intermediates—yellow-red, green-yellow, blue-green, purple-blue, and red-purple (Figure 16).

7.2.2. CIE Color Systems

Other methods for expressing color numerically were developed by the CIE. The two most well-known methods are the Yxy color space, created in 1931 from the CIE-defined XYZ tristimulus values, and the Lab* color space, created in 1976 to provide more uniform color differences in relation to visual differences [202].

CIE 1931

This was the result of a series of experiments conducted in the late 1920s by William David Wright and John Guild. The experimental results were combined in the specification of the CIE RGB color space, from which the CIE XYZ color space is derived (Figure 17). It precisely defined the three primary colors of additive color synthesis, from which all other colors can be created [208]. In this model, Y signifies luminance; Z is roughly equal to the blue stimulus (S cones), and X is a mix tending toward the red-to-green sensitivity curve (L and M cones). Although the 1931 system proved useful, its practical application was limited as it did not express color differences in a perceptually uniform manner. Visual perceptions of differences (in luminance, purity, and dominant wavelength) often did not match the numerical information available in the system [209].

CIELAB 1976

The CIELAB system of 1976 improved the 1931 system by organizing colors so that numerical differences between colors matched visual perceptions. This improvement facilitated and simplified the communication of color difference information among parties [211].
The CIELAB color space can be visualized as a three-dimensional space in which each color can be uniquely located. The location of any color in the space is determined by its chromatic coordinates—L*, a*, and b*—as follows: L* luminance coordinate, a* red/green coordinate, with +a* indicating red and −a* indicating green, and b* yellow/blue coordinate, with +b* indicating yellow and −b* indicating blue (Figure 18). This approach follows the principle of opponent colors, i.e., it follows the idea that, at some point between the eye and the brain, the information coming from the eye’s cone receptors is encoded into signals of light–dark, red-green, and yellow-blue. The “opponent” basis of the concept is that a color cannot be red and green at the same time, or yellow and blue at the same time. However, a color can be considered a combination of red and yellow, red and blue, green and yellow, or green and blue [212].
A color can also be described and located in the CIELAB color space using an alternative method involving L*, C*, and h° (Figure 18). This is also three-dimensional, but the color is located using cylindrical coordinates, as follows: L* luminance coordinate, the same as in Lab*. C* is a chroma coordinate, the distance from the luminance axis, and h° is the hue angle, expressed in degrees, with 0° being a position on the +a* axis, continuing to 90° for the +b* axis, 180° for −a*, 270° for −b*, and back to 360° = 0°. Many users of the CIE system prefer the LCh* method for specifying a color, as the concept of hue and chroma aligns well with visual experience [213].

7.3. Color Measuring Techniques in the Cosmetic Industry

Spectrophotometry, colorimetry, reflectance spectrophotometry, and digital imaging play crucial roles in the cosmetics industry (Table 7). Spectrophotometry, a method dating back to the early 20th century, is pivotal for measuring the intensity of light absorbed or transmitted by colorants in products like lipsticks and foundation layers on the skin [214].
Colorimetry, particularly after the introduction of the CIELAB color space, allows for accurate color comparisons, essential for quality control in the production of cosmetics such as powders, creams, and lotions [212,215]. Reflectance spectrophotometry is integral for products requiring precise skin tone matching. Digital imaging, a late 20th century innovation, not only ensures batch consistency but is also increasingly employed alongside hyperspectral imaging to analyze the effects of anti-aging or anti-wrinkle cosmetics on the skin [216]. Recently, digital skin imaging applications and their role in enhancing the quality and accuracy of image acquisition in dermatology have been assessed, representing an expanding field in the cosmetics industry [217].
Table 7. Overview of various instruments and their principles used in the measurement of color in cosmetics.
Instrument TypePrinciple of MeasurementType of Cosmetic MeasuredReference
SpectrophotometerMeasures the intensity of light at specific wavelengths. The data are then compared against known standards to quantify color in products.All types of colored cosmetics[214,218,219]
ColorimeterCompares the color of a sample against a standard. t quantifies color based on the CIE Lab* color space, calculating differences in lightness (L*), red-green (a*), and yellow-blue (b*) coordinates.Powders, creams, and lotions[9,218]
Reflectance SpectrophotometerMeasures the amount of light reflected from the surface of a product. By analyzing the spectrum of the reflected light, it determines how the product’s color will appear under different lighting conditions.Foundations and powders[214,218]
Digital Camera ImagingCaptures and analyzes images to determine color properties. These images are then analyzed using software to assess color properties like hue, saturation, and brightness, offering a comprehensive color profile.Any visible cosmetic product[216,217]

8. Challenges and Opportunities of Using Meta-Analysis in the Formulation of Cosmetics with Biobased Products

Since the 1990s, the cosmetic industry has included sustainability among its priorities, mainly due to consumer perception and greater acceptance of “eco-friendly” products by new generational groups. Nowadays, the sustainability megatrend has generated the study of the carbon footprint of the industry’s raw materials and refining manufacturing processes alongside analyses of the entire life cycle of its products within its value chain [220]. However, a significant challenge persists in replacing conventional synthetic ingredients, known for their exceptional performance and low cost, with biobased ingredients that offer a comparable cost-to-performance ratio. Biobased products, derived from renewable sources like plants, microbes, or algae, are increasingly popular in the cosmetics industry for their sustainability and environmental benefits [221]. Analytical methods play a crucial role in ensuring the quality, safety, and efficacy of biobased formulations. Below are listed some of the main challenges and opportunities associated with the integration of analytical methods in the context of substituting conventional synthetic for biobased ingredients (Figure 19).

8.1. Challenges

1. Complexity of Biobased Ingredients: Biobased ingredients, being derived from natural sources, exhibit a wide range of chemical diversity. They contain various classes of compounds such as lipids, proteins, carbohydrates, and secondary metabolites, leading to a complex mixture [222,223,224]. Identifying and quantifying these diverse compounds is challenging. Analytical methods need to be sensitive enough to identify and quantify the diverse components present in these natural extracts. On the other hand, synthetic ingredients are often single compounds or present simpler chemical structures. Their composition is generally more straightforward, making them easier to characterize using standard analytical methods.
Biobased ingredients often contain multiple compounds that may interact synergistically, influencing the overall performance of the formulation [225]. Characterizing individual components and understanding their combined effects can be complex. Synthetic ingredients are designed to have specific chemical structures and functionalities. Their interactions are typically well-understood, and the characterization focuses on the individual compound’s properties. Some biobased compounds exist in different isomeric forms, adding complexity to their characterization [8,226]. Distinguishing between these isomers is crucial for understanding their functional properties. Isomerism is generally less prevalent in synthetic ingredients. Characterizing synthetic compounds often involves less complexity in terms of their structural isomers.
2. Variability in Raw Materials: The composition of biobased ingredients can vary based on factors like geographical location, climate conditions, and harvest time [227]. This variability introduces challenges in establishing consistent formulations and requires robust analytical methods to handle these variations. On the other hand, synthetic ingredients are manufactured under controlled conditions, resulting in more consistent and reproducible compositions. The lack of natural variability simplifies the characterization process for synthetic ingredients.
3. Stability and Shelf-Life: Biobased formulations may be more prone to degradation or spoilage compared to synthetic counterparts [228]. Analytical methods are essential for assessing the stability of these formulations over time and under different storage conditions.
4. Reference Standards: The availability of reference standards for biobased compounds may be limited, hindering the development and validation of analytical methods [229]. On the other hand, reference standards for synthetic compounds are often readily available, facilitating the accurate identification and quantification of synthetic ingredients. Overcoming these challenges involves the development and application of advanced analytical techniques tailored to the unique characteristics of biobased formulations in the cosmetics industry.
5. Regulatory Compliance: The regulatory compliance of biobased ingredients in cosmetics faces challenges due to the natural variability, complex composition, and limited standardization inherent to these ingredients [230]. Synthetic ingredients often benefit from greater consistency, simpler compositions, and more established testing methods, making regulatory compliance comparatively more straightforward in some cases. Addressing these challenges for biobased ingredients may involve collaborative efforts between industry stakeholders, regulatory bodies, and research institutions to establish robust standards and testing methodologies.

8.2. Opportunities

The complexity of biobased ingredients, when viewed as an opportunity, allows for the development of unique and innovative cosmetic formulations. The richness of bioactive profiles, synergistic effects, customization possibilities, consumer appeal, and advancements in analytical techniques all contribute to the potential advantages of utilizing complex biobased ingredients in cosmetics. While it presents challenges, this complexity can be leveraged to provide unique selling points and benefits.
1. Rich Bioactive Profiles: The diverse and complex composition of biobased ingredients often results in rich bioactive profiles [231,232,233]. These compounds may offer a wide range of beneficial properties, including antioxidant, anti-inflammatory, and moisturizing effects. Characterization can highlight the presence of specific bioactive compounds that contribute to the overall efficacy of a cosmetic product. Synthetic ingredients may not naturally contain the same array of bioactive compounds. The complexity of biobased ingredients can be marketed as a natural source of multiple active components, potentially providing a holistic approach to skincare.
2. Synergistic Effects: The interactions between different compounds in biobased ingredients can lead to synergistic effects, enhancing the overall performance and benefits of the cosmetic formulation. Characterization efforts can focus on understanding and promoting these synergies for improved skincare outcomes. Synthetic ingredients are often designed to have specific isolated effects. The synergistic potential of biobased ingredients can be positioned as a unique advantage in skincare formulations [5].
3. Consumer Acceptance: Consumers are increasingly interested in natural and sustainable products [7,12,234]. The complexity of biobased ingredients aligns with the growing demand for environmentally friendly and ethical choices. Characterization efforts can highlight the natural origin and sustainability of these ingredients, contributing to consumer preference. The natural complexity of biobased ingredients can serve as a key differentiator in the market, appealing to consumers seeking products with a closer connection to nature.
4. Innovation in Analytical Techniques: The need to characterize complex biobased ingredients has driven innovation in analytical techniques [235]. Advanced methods, such as FTIR, NMR, SEC/GPC, SEM, TGA, DSC, high-performance liquid chromatography (HPLC), mass spectrometry, and metabolomics, have been developed to provide more detailed insights into the composition of these ingredients. While analytical techniques are essential for both biobased and synthetic ingredients, the innovation in characterizing complex natural compounds can be positioned as an opportunity for advancement and differentiation in the cosmetics industry.

9. Conclusions and Perspectives

The analytical methodologies discussed in the present review are crucial in bridging the molecular and microstructure understanding to the pragmatic realm of product performance in the cosmetics industry. The ability to meticulously analyze and interpret the composition, microscopic and macroscopic properties, and rheological aspects of cosmetic formulations, the so-called meta-analysis, is essential for the formulation of products that have the desired properties, are safe, and consumer-friendly. This review emphasizes the necessity of continual advancements in analytical technologies and the value of interdisciplinary collaboration, which are crucial for fostering innovation, sustainability, and regulatory compliance in cosmetic product formulation. The future in this field is promising and challenging, inviting a coordinated effort from academia, industry, and regulatory bodies to advance the frontier of cosmetic science.
Aside from the properties related to the macrostructure, the importance of shelf-life properties, such as stability studies, in cosmetics provide critical insights into the behavior, performance, and long-term reliability of cosmetic products. The stability of emulsions significantly impacts the effectiveness, shelf-life, and user satisfaction associated with these products. Furthermore, tools such as surface tension measurements and fluid dynamics are not only relevant but extensively applied in the contemporary cosmetic industry. These analytical tools enhance the understanding and optimization of product formulations by providing quantitative data on various physicochemical properties.
The incorporation of these analytical tools aligns with the industry’s continual aim to achieve superior product quality and consumer satisfaction, making them indispensable in modern cosmetic formulation science. Accurate stability assessment and the use of advanced analytical tools enable cosmetic formulators and researchers to better understand the mechanisms affecting emulsion stability. This knowledge facilitates the development of innovative formulations that meet evolving consumer needs and preferences while adhering to stringent industry standards and regulatory requirements.
The integration of biobased ingredients into cosmetics represents both challenges and opportunities. This allows for the use of the current analytical methods and the development of innovative techniques to study these complex mixtures within cosmetics matrices. These natural components, composed of a variety of compounds such as lipids and proteins, present analytical challenges due to their variability and complex chemical interactions, necessitating advanced and sensitive methods for effective characterization. Despite the difficulties in achieving formulation consistency, stability, and meeting regulatory standards, biobased ingredients offer considerable opportunities. They exhibit rich bioactive profiles and the potential for synergistic effects, aligning with the increasing consumer demand for natural and sustainable products. The transition towards biobased ingredients in the cosmetic industry marks a significant historical moment in formulation and laboratory analytics, which is generating funding and new collaboration opportunities between public institutions, universities, and industry to work together to overcome the previously mentioned challenges.

Funding

This research received no external funding.

Conflicts of Interest

The authors declare no conflict of interest.

References

  1. Kumar, S. Exploratory Analysis of Global Cosmetic Industry: Major Players, Technology and Market Trends. Technovation 2005, 25, 1263–1272. [Google Scholar] [CrossRef]
  2. Ribechini, E.; Modugno, F.; Pérez-Arantegui, J.; Colombini, M.P. Discovering the Composition of Ancient Cosmetics and Remedies: Analytical Techniques and Materials. Anal. Bioanal. Chem. 2011, 401, 1727–1738. [Google Scholar] [CrossRef] [PubMed]
  3. Salager, J.-L.; Marquez, R.; Bullon, J.; Forgiarini, A. Formulation in Surfactant Systems: From-Winsor-to-HLDN. Encyclopedia 2022, 2, 778–839. [Google Scholar] [CrossRef]
  4. Poucher, W.A. Poucher’s Perfumes, Cosmetics and Soaps—Volume 1, 9th ed.; Springer: New Delhi, India, 1991; ISBN 0751404799. [Google Scholar]
  5. Dini, I.; Laneri, S. The New Challenge of Green Cosmetics: Natural Food Ingredients for Cosmetic Formulations. Molecules 2021, 26, 3921. [Google Scholar] [CrossRef] [PubMed]
  6. Statista Beauty & Personal Care. Available online: https://www.statista.com/outlook/cmo/beauty-personal-care/worldwide (accessed on 9 September 2023).
  7. Otto, S.; Strenger, M.; Maier-Nöth, A.; Schmid, M.; Otto, S.; Strenger, M.; Schmid, M. Food Packaging and Sustainability—Consumer Perception vs. Correlated Scientific Facts. J. Clean. Prod. 2021, 298, 126733. [Google Scholar] [CrossRef]
  8. Ortiz, M.S.; Alvarado, J.G.; Zambrano, F.; Marquez, R. Surfactants Produced from Carbohydrate Derivatives: A Review of the Biobased Building Blocks Used in Their Synthesis. J. Surfactants Deterg. 2022, 25, 147–183. [Google Scholar] [CrossRef]
  9. Mildau, G. Chapter 4—General Review of Official Methods of Analysis of Cosmetics. In Analysis of Cosmetic Products, 2nd ed.; Salvador, A., Chisvert, A.B.T.-A., Eds.; Elsevier: Boston, MA, USA, 2018; pp. 67–83. ISBN 978-0-444-63508-2. [Google Scholar]
  10. Mohamed, H.M. Green, Environment-Friendly, Analytical Tools Give Insights in Pharmaceuticals and Cosmetics Analysis. TrAC Trends Anal. Chem. 2015, 66, 176–192. [Google Scholar] [CrossRef]
  11. Luengo, G.S.; Fameau, A.-L.; Léonforte, F.; Greaves, A.J. Surface Science of Cosmetic Substrates, Cleansing Actives and Formulations. Adv. Colloid Interface Sci. 2021, 290, 102383. [Google Scholar] [CrossRef]
  12. Sajinčič, N.; Gordobil, O.; Simmons, A.; Sandak, A. An Exploratory Study of Consumers’ Knowledge and Attitudes about Lignin-Based Sunscreens and Bio-Based Skincare Products. Cosmetics 2021, 8, 78. [Google Scholar] [CrossRef]
  13. Singh, M.; Sharma, S.; Khokra, S.L.; Ram Kumar Sahu, R.J. Preparation and Evaluation of Herbal Cosmetic Cream. Pharmacologyonline 2011, 2, 1258–1264. [Google Scholar]
  14. Salager, J.-L.; Antón, R.E.; Bullón, J.; Forgiarini, A.; Marquez, R. How to Use the Normalized Hydrophilic-Lipophilic Deviation (HLDN) Concept for the Formulation of Equilibrated and Emulsified Surfactant-Oil-Water Systems for Cosmetics and Pharmaceutical Products. Cosmetics 2020, 7, 57. [Google Scholar] [CrossRef]
  15. Final Amended Report on the Safety Assessment of Methylparaben, Ethylparaben, Propylparaben, Isopropylparaben, Butylparaben, Isobutylparaben, and Benzylparaben as Used in Cosmetic Products. Int. J. Toxicol. 2008, 27, 1–82. [CrossRef]
  16. Calvo, F.; Gómez, J.M.; Ricardez-Sandoval, L.; Alvarez, O. Integrated Design of Emulsified Cosmetic Products: A Review. Chem. Eng. Res. Des. 2020, 161, 279–303. [Google Scholar] [CrossRef]
  17. Celeiro, M.; Garcia-Jares, C.; Llompart, M.; Lores, M. Recent Advances in Sample Preparation for Cosmetics and Personal Care Products Analysis. Molecules 2021, 26, 4900. [Google Scholar] [CrossRef] [PubMed]
  18. Singh, B.; Sharma, R.A. Plant Terpenes: Defense Responses, Phylogenetic Analysis, Regulation and Clinical Applications. 3 Biotech 2015, 5, 129–151. [Google Scholar] [CrossRef]
  19. Narloch, I.; Wejnerowska, G. An Overview of the Analytical Methods for the Determination of Organic Ultraviolet Filters in Cosmetic Products and Human Samples. Molecules 2021, 26, 4780. [Google Scholar] [CrossRef]
  20. Liberati, A.; Altman, D.G.; Tetzlaff, J.; Mulrow, C.; Gøtzsche, P.C.; Ioannidis, J.P.A.; Clarke, M.; Devereaux, P.J.; Kleijnen, J.; Moher, D. The PRISMA Statement for Reporting Systematic Reviews and Meta-Analyses of Studies That Evaluate Health Care Interventions: Explanation and Elaboration. Ann. Intern. Med. 2009, 151, W-65. [Google Scholar] [CrossRef]
  21. Miller, J.M. Chromatography: Concepts and Contrasts; John Wiley & Sons: Hoboken, NJ, USA, 2005; ISBN 978-0-471-98059-9. [Google Scholar]
  22. Zhou, W.; Wang, P.G.; Wittenberg, J.B.; Rua, D.; Krynitsky, A.J. Simultaneous Determination of Cosmetics Ingredients in Nail Products by Fast Gas Chromatography with Tandem Mass Spectrometry. J. Chromatogr. A 2016, 1446, 134–140. [Google Scholar] [CrossRef]
  23. Rastogi, S.C. Analysis of Fragrances in Cosmetics by Gas Chromatography–Mass Spectrometry. J. High Resolut. Chromatogr. 1995, 18, 653–658. [Google Scholar] [CrossRef]
  24. Sahu, P.K.; Ramisetti, N.R.; Cecchi, T.; Swain, S.; Patro, C.S.; Panda, J. An Overview of Experimental Designs in HPLC Method Development and Validation. J. Pharm. Biomed. Anal. 2018, 147, 590–611. [Google Scholar] [CrossRef]
  25. Fukuda, Y.; Morikawa, Y.; Matsumoto, I. Ion-Exchange Chromatographic Separation of N-Nitrosodiethanolamine in Cosmetics. Available online: https://pubs.acs.org/doi/pdf/10.1021/ac00236a013 (accessed on 30 July 2023).
  26. Lim, D.S.; Lim, S.K.; Kim, M.K.; Kwon, Y.C.; Roh, T.H.; Choi, S.M.; Yoon, S.; Kim, H.S.; Lee, B.-M. Formation and Inhibition of N-Nitrosodiethanolamine in Cosmetics under pH, Temperature, and Fluorescent, Ultraviolet, and Visual Light. J. Toxicol. Environ. Health A 2018, 81, 241–253. [Google Scholar] [CrossRef] [PubMed]
  27. Suárez-Hernández, L.A.; Camacho-Ruíz, R.M.; Arriola-Guevara, E.; Padilla-Camberos, E.; Kirchmayr, M.R.; Corona-González, R.I.; Guatemala-Morales, G.M. Validation of an Analytical Method for the Simultaneous Determination of Hyaluronic Acid Concentration and Molecular Weight by Size-Exclusion Chromatography. Molecules 2021, 26, 5360. [Google Scholar] [CrossRef] [PubMed]
  28. Salvador, A.; Chisvert, A. An Environmentally Friendly (“Green”) Reversed-Phase Liquid Chromatography Method for UV Filters Determination in Cosmetics. Anal. Chim. Acta 2005, 537, 15–24. [Google Scholar] [CrossRef]
  29. Schakel, D.J.; Kalsbeek, D.; Boer, K. Determination of Sixteen UV Filters in Suncare Formulations by High-Performance Liquid Chromatography. J. Chromatogr. A 2004, 1049, 127–130. [Google Scholar] [CrossRef] [PubMed]
  30. Wang, X.; Wang, J.; Du, T.; Kou, H.; Du, X.; Lu, X. Determination of Six Benzotriazole Ultraviolet Filters in Water and Cosmetic Samples by Graphene Sponge-Based Solid-Phase Extraction Followed by High-Performance Liquid Chromatography. Anal. Bioanal. Chem. 2018, 410, 6955–6962. [Google Scholar] [CrossRef] [PubMed]
  31. Wharton, M.; Geary, M.; O’Connor, N.; Murphy, B. A Rapid High Performance Liquid Chromatographic (HPLC) Method for the Simultaneous Determination of Seven UV Filters Found in Sunscreen and Cosmetics. Int. J. Cosmet. Sci. 2011, 33, 164–170. [Google Scholar] [CrossRef]
  32. Lee, M.-R.; Lin, C.-Y.; Li, Z.-G.; Tsai, T.-F. Simultaneous Analysis of Antioxidants and Preservatives in Cosmetics by Supercritical Fluid Extraction Combined with Liquid Chromatography–Mass Spectrometry. J. Chromatogr. A 2006, 1120, 244–251. [Google Scholar] [CrossRef]
  33. Liu, C.; Wang, J.; Yang, Y. High-Performance Liquid Chromatography Determination of Antioxidants in Cosmetics after Cloud Point Extraction Using Dodecylpolyoxyethylene Ether. Anal. Methods 2014, 6, 6038–6043. [Google Scholar] [CrossRef]
  34. Al-Halaseh, L.K.; Al-Adaileh, S.; Mbaideen, A.; Hajleh, M.N.A.; Al-Samydai, A.; Zakaraya, Z.Z.; Dayyih, W.A. Implication of Parabens in Cosmetics and Cosmeceuticals: Advantages and Limitations. J. Cosmet. Dermatol. 2022, 21, 3265–3271. [Google Scholar] [CrossRef]
  35. Khesina, Z.B.; Iartsev, S.D.; Revelsky, A.I.; Buryak, A.K. Microextraction by Packed Sorbent Optimized by Statistical Design of Experiment as an Approach to Increase the Sensitivity and Selectivity of HPLC-UV Determination of Parabens in Cosmetics. J. Pharm. Biomed. Anal. 2021, 195, 113843. [Google Scholar] [CrossRef]
  36. Matwiejczuk, N.; Galicka, A.; Brzóska, M.M. Review of the Safety of Application of Cosmetic Products Containing Parabens. J. Appl. Toxicol. 2020, 40, 176–210. [Google Scholar] [CrossRef] [PubMed]
  37. Piao, C.; Chen, L.; Wang, Y. A Review of the Extraction and Chromatographic Determination Methods for the Analysis of Parabens. J. Chromatogr. B 2014, 969, 139–148. [Google Scholar] [CrossRef] [PubMed]
  38. Cabaleiro, N.; de la Calle, I.; Bendicho, C.; Lavilla, I. An Overview of Sample Preparation for the Determination of Parabens in Cosmetics. TrAC Trends Anal. Chem. 2014, 57, 34–46. [Google Scholar] [CrossRef]
  39. Ocaña-González, J.A.; Villar-Navarro, M.; Ramos-Payán, M.; Fernández-Torres, R.; Bello-López, M.A. New Developments in the Extraction and Determination of Parabens in Cosmetics and Environmental Samples. A Review. Anal. Chim. Acta 2015, 858, 1–15. [Google Scholar] [CrossRef] [PubMed]
  40. Márquez-Sillero, I.; Aguilera-Herrador, E.; Cárdenas, S.; Valcárcel, M. Determination of Parabens in Cosmetic Products Using Multi-Walled Carbon Nanotubes as Solid Phase Extraction Sorbent and Corona-Charged Aerosol Detection System. J. Chromatogr. A 2010, 1217, 1–6. [Google Scholar] [CrossRef] [PubMed]
  41. Youngvises, N.; Chaida, T.; Khonyoung, S.; Kuppithayanant, N.; Tiyapongpattana, W.; Itharat, A.; Jakmunee, J. Greener Liquid Chromatography Using a Guard Column with Micellar Mobile Phase for Separation of Some Pharmaceuticals and Determination Ofparabens. Talanta 2013, 106, 350–359. [Google Scholar] [CrossRef] [PubMed]
  42. Gao, W.; Gray, N.; Heaton, J.; Smith, N.W.; Jia, Y.; Legido-Quigley, C. UV Gradient Combined with Principal Component Analysis: Highly Sensitive and Specific High Performance Liquid Chromatography Analysis of Cosmetic Creams. J. Chromatogr. A 2012, 1228, 324–328. [Google Scholar] [CrossRef] [PubMed]
  43. Gao, W.; Legido-Quigley, C. Fast and Sensitive High Performance Liquid Chromatography Analysis of Cosmetic Creams for Hydroquinone, Phenol and Six Preservatives. J. Chromatogr. A 2011, 1218, 4307–4311. [Google Scholar] [CrossRef]
  44. Shen, H.-Y.; Jiang, H.-L.; Mao, H.-L.; Pan, G.; Zhou, L.; Cao, Y.-F. Simultaneous Determination of Seven Phthalates and Four Parabens in Cosmetic Products Using HPLC-DAD and GC-MS Methods. J. Sep. Sci. 2007, 30, 48–54. [Google Scholar] [CrossRef]
  45. Fei, T.; Li, H.; Ding, M.; Ito, M.; Lin, J.-M. Determination of Parabens in Cosmetic Products by Solid-Phase Microextraction of Poly(Ethylene Glycol) Diacrylate Thin Film on Fibers and Ultra High-Speed Liquid Chromatography with Diode Array Detector. J. Sep. Sci. 2011, 34, 1599–1606. [Google Scholar] [CrossRef]
  46. Yamini, Y.; Saleh, A.; Rezaee, M.; Ranjbar, L.; Moradi, M. Ultrasound-Assisted Emulsification Microextraction of Various Preservatives from Cosmetics, Beverages, and Water Samples. J. Liq. Chromatogr. Relat. Technol. 2012, 35, 2623–2642. [Google Scholar] [CrossRef]
  47. Tahan, G.P.; Santos, N.; Albuquerque, A.C.; Martins, I. Determination of Parabens in Serum by Liquid Chromatography-Tandem Mass Spectrometry: Correlation with Lipstick Use. Regul. Toxicol. Pharmacol. 2016, 79, 42–48. [Google Scholar] [CrossRef] [PubMed]
  48. Zhang, Q.; Lian, M.; Liu, L.; Cui, H. High-Performance Liquid Chromatographic Assay of Parabens in Wash-off Cosmetic Products and Foods Using Chemiluminescence Detection. Anal. Chim. Acta 2005, 537, 31–39. [Google Scholar] [CrossRef]
  49. Guerra, E.; Llompart, M.; Garcia-Jares, C. Miniaturized Matrix Solid-Phase Dispersion Followed by Liquid Chromatography-Tandem Mass Spectrometry for the Quantification of Synthetic Dyes in Cosmetics and Foodstuffs Used or Consumed by Children. J. Chromatogr. A 2017, 1529, 29–38. [Google Scholar] [CrossRef] [PubMed]
  50. Guerra, E.; Celeiro, M.; Lamas, J.P.; Llompart, M.; Garcia-Jares, C. Determination of Dyes in Cosmetic Products by Micro-Matrix Solid Phase Dispersion and Liquid Chromatography Coupled to Tandem Mass Spectrometry. J. Chromatogr. A 2015, 1415, 27–37. [Google Scholar] [CrossRef] [PubMed]
  51. Franco, J.H.; Silva, B.F.; Zanoni, M.V.B. Using Ionic Liquid Combined with HPLC-DAD to Analyze Semi-Permanent Hair Dyes in Commercial Formulations. Anal. Methods 2015, 7, 1115–1122. [Google Scholar] [CrossRef]
  52. Miranda-Bermudez, E.; Harp, B.P.; Barrows, J.N. Qualitative Identification of Permitted and Non-Permitted Color Additives in Cosmetics. J. AOAC Int. 2014, 97, 1039–1047. [Google Scholar] [CrossRef]
  53. Guerra, E.; Llompart, M.; Garcia-Jares, C. Analysis of Dyes in Cosmetics: Challenges and Recent Developments. Cosmetics 2018, 5, 47. [Google Scholar] [CrossRef]
  54. Xian, Y.; Wu, Y.; Guo, X.; Lu, Y.; Luo, H.; Luo, D.; Chen, Y. Simultaneous Determination of 11 Restricted Dyes in Cosmetics by Ultra High-Performance Liquid Chromatography/Tandem Mass Spectrometry. Anal. Methods 2013, 5, 1965–1974. [Google Scholar] [CrossRef]
  55. Littlewood, A.B. Gas Chromatography: Principles, Techniques, and Applications; Elsevier: Amsterdam, The Netherlands, 2013; ISBN 978-1-4832-6098-3. [Google Scholar]
  56. Shellie, R.A. Chapter 9 Volatile Components of Plants, Essential Oils, and Fragrances. In Comprehensive Analytical Chemistry; Ramos, L., Ed.; Comprehensive Two Dimensional Gas Chromatography; Elsevier: Amsterdam, The Netherlands, 2009; Volume 55, pp. 189–213. [Google Scholar]
  57. Kumar, M.; Devi, A.; Sharma, M.; Kaur, P.; Mandal, U.K. Review on Perfume and Present Status of Its Associated Allergens. J. Cosmet. Dermatol. 2021, 20, 391–399. [Google Scholar] [CrossRef]
  58. Chen, J.; Yi, Z.; Sun, R.; Ning, W.; Zhou, C.; Tian, Z.; Sun, C.; Li, Y. Analysis of Fragrance Allergens in Personal Care Products, Toys, and Water Samples: A Review. J. AOAC Int. 2022, 105, 396–412. [Google Scholar] [CrossRef] [PubMed]
  59. Debonneville, C.; Thomé, M.-A.; Chaintreau, A. Hyphenation of Quadrupole MS to GC and Comprehensive Two-Dimensional GC for the Analysis of Suspected Allergens: Review and Improvement. J. Chromatogr. Sci. 2004, 42, 450–455. [Google Scholar] [CrossRef] [PubMed]
  60. Mondello, L.; Sciarrone, D.; Casilli, A.; Tranchida, P.Q.; Dugo, P.; Dugo, G. Fast Gas Chromatography-Full Scan Quadrupole Mass Spectrometry for the Determination of Allergens in Fragrances. J. Sep. Sci. 2007, 30, 1905–1911. [Google Scholar] [CrossRef] [PubMed]
  61. Divišová, R.; Vítová, E.; Diviš, P.; Zemanová, J.; Omelková, J. Validation of SPME-GC-FID Method for Determination of Fragrance Allergens in Selected Cosmetic Products. Acta Chromatogr. 2015, 27, 509–523. [Google Scholar] [CrossRef]
  62. Mazzucotelli, M.; Minteguiaga, M.A.; Sgorbini, B.; Sidisky, L.; Marengo, A.; Rubiolo, P.; Bicchi, C.; Cagliero, C. Ionic Liquids as Water-Compatible GC Stationary Phases for the Analysis of Fragrances and Essential Oils: Quantitative GC–MS Analysis of Officially-Regulated Allergens in Perfumes. J. Chromatogr. A 2020, 1610, 460567. [Google Scholar] [CrossRef]
  63. Chaintreau, A.; Joulain, D.; Marin, C.; Schmidt, C.-O.; Vey, M. GC-MS Quantitation of Fragrance Compounds Suspected To Cause Skin Reactions. 1. J. Agric. Food Chem. 2003, 51, 6398–6403. [Google Scholar] [CrossRef]
  64. Lamas, J.P.; Sanchez-Prado, L.; Garcia-Jares, C.; Lores, M.; Llompart, M. Development of a Solid Phase Dispersion-Pressurized Liquid Extraction Method for the Analysis of Suspected Fragrance Allergens in Leave-on Cosmetics. J. Chromatogr. A 2010, 1217, 8087–8094. [Google Scholar] [CrossRef]
  65. del Nogal Sánchez, M.; Pérez-Pavón, J.L.; Moreno Cordero, B. Determination of Suspected Allergens in Cosmetic Products by Headspace-Programmed Temperature Vaporization–Fast Gas Chromatography–Quadrupole Mass Spectrometry. Anal. Bioanal. Chem. 2010, 397, 2579–2591. [Google Scholar] [CrossRef]
  66. Saraji, M.; Mirmahdieh, S. Single-Drop Microextraction Followed by in-Syringe Derivatization and GC-MS Detection for the Determination of Parabens in Water and Cosmetic Products. J. Sep. Sci. 2009, 32, 988–995. [Google Scholar] [CrossRef]
  67. Yang, T.-J.; Tsai, F.-J.; Chen, C.-Y.; Yang, T.C.-C.; Lee, M.-R. Determination of Additives in Cosmetics by Supercritical Fluid Extraction On-Line Headspace Solid-Phase Microextraction Combined with Gas Chromatography–Mass Spectrometry. Anal. Chim. Acta 2010, 668, 188–194. [Google Scholar] [CrossRef]
  68. Wang, P.G.; Zhou, W. Rapid Determination of Parabens in Personal Care Products by Stable Isotope GC-MS/MS with Dynamic Selected Reaction Monitoring. J. Sep. Sci. 2013, 36, 1781–1787. [Google Scholar] [CrossRef] [PubMed]
  69. Alvarez-Rivera, G.; Vila, M.; Lores, M.; Garcia-Jares, C.; Llompart, M. Development of a Multi-Preservative Method Based on Solid-Phase Microextraction–Gas Chromatography–Tandem Mass Spectrometry for Cosmetic Analysis. J. Chromatogr. A 2014, 1339, 13–25. [Google Scholar] [CrossRef] [PubMed]
  70. Yi, X.; Guo, D.; Deng, X.; Li, B.; Fan, X.; Zhu, J. Determination of Methanol in Cosmetics by Headspace and Multidimensional Gas Chromatography with Mass Spectrometric Detection. J. AOAC Int. 2011, 94, 655–659. [Google Scholar] [CrossRef] [PubMed]
  71. Celeiro, M.; Varela, E.; Rodriguez, R.; Penedo, M.; Lores, M. Tracking Bacterial Spoilage in Cosmetics by a New Bioanalytical Approach: API-SPME-GC-MS to Monitor MVOCs. Cosmetics 2020, 7, 38. [Google Scholar] [CrossRef]
  72. Acree, T.E. Peer Reviewed: GC/Olfactometry GC With a Sense of Smell. Anal. Chem. 2011, 69, 170A–175A. [Google Scholar] [CrossRef]
  73. Aghoutane, Y.; Brebu, M.; Moufid, M.; Ionescu, R.; Bouchikhi, B.; El Bari, N. Detection of Counterfeit Perfumes by Using GC-MS Technique and Electronic Nose System Combined with Chemometric Tools. Micromachines 2023, 14, 524. [Google Scholar] [CrossRef]
  74. Van Asten, A. The Importance of GC and GC-MS in Perfume Analysis. TrAC Trends Anal. Chem. 2002, 21, 698–708. [Google Scholar] [CrossRef]
  75. Wardencki, W.; Chmiel, T.; Dymerski, T. Gas Chromatography-Olfactometry (GC-O), Electronic Noses (e-Noses) and Electronic Tongues (e-Tongues) for in Vivo Food Flavour Measurement. Instrum. Assess. Food Sens. Qual. 2013, 195–229. [Google Scholar] [CrossRef]
  76. De-La-fuente-blanco, A.; Ferreira, V. Gas Chromatography Olfactometry (GC-O) for the (Semi)Quantitative Screening of Wine Aroma. Foods 2020, 9, 1892. [Google Scholar] [CrossRef]
  77. Fuller, G.H.; Steltenkamp, R.; Tisserand, G.A. The Gas Chromatograph with Human Sensor: Perfumer Model. Ann. N. Y. Acad. Sci. 1964, 116, 711–724. [Google Scholar] [CrossRef]
  78. Reineccius, G. Choosing the Correct Analytical Technique in Aroma Analysis. In Flavour in Food; Elsevier: Amsterdam, The Netherlands, 2006; pp. 81–97. [Google Scholar]
  79. Delahunty, C.M.; Eyres, G.; Dufour, J.P. Gas Chromatography-Olfactometry. J. Sep. Sci. 2006, 29, 2107–2125. [Google Scholar] [CrossRef] [PubMed]
  80. Blank, I.; Fischer, K.-H.; Grosch, W. Intensive Neutral Odourants of Linden Honey Differences from Honeys of Other Botanical Origin. Z. Für Lebensm. Unters. Und Forsch. 1989, 189, 426–433. [Google Scholar] [CrossRef]
  81. Acree, T.E.; Barnard, J.; Cunningham, D.G. A Procedure for the Sensory Analysis of Gas Chromatographic Effluents. Food Chem. 1984, 14, 273–286. [Google Scholar] [CrossRef]
  82. Pollien, P.; Ott, A.; Montigon, F.; Baumgartner, M.; Muñoz-Box, R.; Chaintreau, A. Hyphenated Headspace-Gas Chromatography-Sniffing Technique:  Screening of Impact Odorants and Quantitative Aromagram Comparisons. J. Agric. Food Chem. 1997, 45, 2630–2637. [Google Scholar] [CrossRef]
  83. d’Acampora Zellner, B.; Dugo, P.; Dugo, G.; Mondello, L. Gas Chromatography-Olfactometry in Food Flavour Analysis. J. Chromatogr. A 2008, 1186, 123–143. [Google Scholar] [CrossRef] [PubMed]
  84. Stevens, S.S. Issues in Psychophysical Measurement. Psychol. Rev. 1971, 78, 426–450. [Google Scholar] [CrossRef]
  85. Plutowska, B.; Wardencki, W. Gas Chromatography-Olfactometry of Alcoholic Beverages. Alcohol. Beverages 2012, 101–130. [Google Scholar] [CrossRef]
  86. Karakaya, D.; Ulucan, O.; Turkan, M. Electronic Nose and Its Applications: A Survey. Int. J. Autom. Comput. 2020, 17, 179–209. [Google Scholar] [CrossRef]
  87. Apetrei, C.; Apetrei, I.M.; Villanueva, S.; de Saja, J.A.; Gutierrez-Rosales, F.; Rodriguez-Mendez, M.L. Combination of an E-Nose, an e-Tongue and an e-Eye for the Characterisation of Olive Oils with Different Degree of Bitterness. Anal. Chim. Acta 2010, 663, 91–97. [Google Scholar] [CrossRef]
  88. Tothill, I.E.; Turner, A.P.F. Biosensors. Encycl. Food Sci. Nutr. 2003, 489–499. [Google Scholar] [CrossRef]
  89. Mottram, D.S.; Elmore, J.S. Sensory Evaluation|Aroma. Encycl. Food Sci. Nutr. 2003, 5174–5180. [Google Scholar] [CrossRef]
  90. Sberveglieri, G.; Greco, G.; Genzardi, D.; Núñez-Carmona, E.; Pezzottini, S.; Sberveglieri, V. The Electronic Nose: Review on Sensor Arrays and Future Perspectives. Chem. Eng. Trans. 2022, 95, 265–270. [Google Scholar] [CrossRef]
  91. Pearce, T.C.; Schiffman, S.S.; Nagle, H.T.; Gardner, J.W. (Eds.) Handbook of Machine Olfaction: Electronic Nose Technology; Wiley VCH: Weinheim, Germany, 2006; Volume 7, pp. 956–963. [Google Scholar]
  92. Nagle, H.T.; Schiffman, S.S.; Gutierrez-Osuna, R. How and Why of Electronic Noses. IEEE Spectr. 1998, 35, 22–34. [Google Scholar] [CrossRef]
  93. Romain, A.C.; Nicolas, J. Long Term Stability of Metal Oxide-Based Gas Sensors for e-Nose Environmental Applications: An Overview. Sens. Actuators B Chem. 2010, 146, 502–506. [Google Scholar] [CrossRef]
  94. Berna, A. Metal Oxide Sensors for Electronic Noses and Their Application to Food Analysis. Sensors 2010, 10, 3882–3910. [Google Scholar] [CrossRef] [PubMed]
  95. Chen, P.-C.; Shen, G.; Zhou, C. Chemical Sensors and Electronic Noses Based on 1-D Metal Oxide Nanostructures. IEEE Trans. Nanotechnol. 2008, 7, 668–682. [Google Scholar] [CrossRef]
  96. Arshak, K.; Moore, E.; Lyons, G.M.; Harris, J.; Clifford, S. A Review of Gas Sensors Employed in Electronic Nose Applications. Sens. Rev. 2004, 24, 181–198. [Google Scholar] [CrossRef]
  97. Korotcenkov, G. Metal Oxides for Solid-State Gas Sensors: What Determines Our Choice? Mater. Sci. Eng. B 2007, 139, 1–23. [Google Scholar] [CrossRef]
  98. Muñoz, B.C.; Steinthal, G.; Sunshine, S. Conductive Polymer-Carbon Black Composites-Based Sensor Arrays for Use in an Electronic Nose. Sens. Rev. 1999, 19, 300–305. [Google Scholar] [CrossRef]
  99. Scott, S.M.; James, D.; Ali, Z. Data Analysis for Electronic Nose Systems. Microchim. Acta 2006, 156, 183–207. [Google Scholar] [CrossRef]
  100. Julian, T.; Hidayat, S.N.; Rianjanu, A.; Dharmawan, A.B.; Wasisto, H.S.; Triyana, K. Intelligent Mobile Electronic Nose System Comprising a Hybrid Polymer-Functionalized Quartz Crystal Microbalance Sensor Array. ACS Omega 2020, 5, 29492–29503. [Google Scholar] [CrossRef] [PubMed]
  101. Rivai, M.; Purwanto, D.; Juwono, H.; Sujono, H.A. Electronic Nose Using Gas Chromatography Column and Quartz Crystal Microbalance. Telkomnika Telecommun. Comput. Electron. Control 2011, 9, 319–326. [Google Scholar] [CrossRef]
  102. Huang, X.; Bai, Q.; Hu, J.; Hou, D. A Practical Model of Quartz Crystal Microbalance in Actual Applications. Sensors 2017, 17, 1785. [Google Scholar] [CrossRef] [PubMed]
  103. Blank, I. Gas Chromatography-Olfactometry in Food Aroma Analisys. In Flavor, Fragrance and Odor Analysis; CRC Press: Boca Raton, FL, USA, 2002; pp. 297–331. [Google Scholar]
  104. Swift, K.A.D. Advances in Flavours and Fragrances: From the Sensation to the Synthesis; Royal Society of Chemistry: London, UK, 2002; Volume 124, p. 7877. ISBN 0854048219. [Google Scholar]
  105. Guć, M.; Cegłowski, M.; Pawlaczyk, M.; Kurczewska, J.; Reszke, E.; Schroeder, G. Application of FAPA Mass Spectrometry for Analysis of Fragrance Ingredients Used in Cosmetics. Measurement 2021, 168, 108326. [Google Scholar] [CrossRef]
  106. Mishra, J.; Sahgal, N. Navigating the Noteworthy: Regulating the Vulnerability of the Fragrance Industry. Indian J. Intellect. Prop. Law 2017, 8, 27. [Google Scholar]
  107. Dunn, M.S.; Vulic, N.; Shellie, R.A.; Whitehead, S.; Morrison, P.; Marriott, P.J. Targeted multidimensional gas chromatography for the quantitative analysis of suspected allergens in fragrance products. J. Chromatogr. A 2006, 1130, 122–129. [Google Scholar] [CrossRef]
  108. Cano, M.; Borrego, V.; Roales, J.; Idígoras, J.; Lopes-Costa, T.; Mendoza, P.; Pedrosa, J.M. Rapid discrimination and counterfeit detection of perfumes by an electronic olfactory system. Sens. Actuators B Chem. 2011, 156, 319–324. [Google Scholar] [CrossRef]
  109. Penza, M.; Cassano, G.; Tortorella, F.; Zaccaria, G. Classification of Food, Beverages and Perfumes by WO3 Thin-Film Sensors Array and Pattern Recognition Techniques. Sens. Actuators B Chem. 2001, 73, 76–87. [Google Scholar] [CrossRef]
  110. Hayase, M. Chapter 10—Introduction to Cosmetic Materials. In Cosmetic Science and Technology; Sakamoto, K., Lochhead, R.Y., Maibach, H.I., Yamashita, Y., Eds.; Elsevier: Amsterdam, The Netherlands, 2017; pp. 149–154. ISBN 978-0-12-802005-0. [Google Scholar]
  111. Marquez, R.; Forgiarini, A.M.; Langevin, D.; Salager, J.-L. Instability of Emulsions Made with Surfactant–Oil–Water Systems at Optimum Formulation with Ultralow Interfacial Tension. Langmuir 2018, 34, 9252–9263. [Google Scholar] [CrossRef]
  112. Wu, F.; Deng, J.; Hu, L.; Zhang, Z.; Jiang, H.; Li, Y.; Yi, Z.; Ngai, T. Investigation of the Stability in Pickering Emulsions Preparation with Commercial Cosmetic Ingredients. Colloids Surf. Physicochem. Eng. Asp. 2020, 602, 125082. [Google Scholar] [CrossRef]
  113. Ravera, F.; Dziza, K.; Santini, E.; Cristofolini, L.; Liggieri, L. Emulsification and Emulsion Stability: The Role of the Interfacial Properties. Adv. Colloid Interface Sci. 2021, 288, 102344. [Google Scholar] [CrossRef] [PubMed]
  114. Benson, H.A.E.; Benson, H.; Roberts, M.S.; Leite-Silva, V.R.; Walters, K. Cosmetic Formulation: Principles and Practice; CRC Press: Boca Raton, FL, USA, 2019; ISBN 978-1-4822-3540-1. [Google Scholar]
  115. Cosmetic Creams: Development, Manufacture and Marketing of Effective Skin Care Products|Wiley. Available online: https://www.wiley.com/en-us/Cosmetic+Creams%3A+Development%2C+Manufacture+and+Marketing+of+Effective+Skin+Care+Products-p-9783527812455 (accessed on 2 October 2023).
  116. Marquez, R.; Zwilling, J.; Zambrano, F.; Tolosa, L.; Marquez, M.E.; Venditti, R.; Jameel, H.; Gonzalez, R. Nanoparticles and Essential Oils with Antiviral Activity on Packaging and Surfaces: An Overview of Their Selection and Application. J. Surfactants Deterg. 2022, 25, 667–701. [Google Scholar] [CrossRef]
  117. Shao, P.; Feng, J.; Sun, P.; Xiang, N.; Lu, B.; Qiu, D. Recent Advances in Improving Stability of Food Emulsion by Plant Polysaccharides. Food Res. Int. 2020, 137, 109376. [Google Scholar] [CrossRef] [PubMed]
  118. Langevin, D. Recent Advances on Emulsion and Foam Stability. Langmuir 2023, 39, 3821–3828. [Google Scholar] [CrossRef] [PubMed]
  119. Marquez, R.; Ontiveros, J.F.; Barrios, N.; Tolosa, L.; Palazzo, G.; Nardello-Rataj, V.; Salager, J.L. Advantages and Limitations of Different Methods to Determine the Optimum Formulation in Surfactant–Oil–Water Systems: A Review. J. Surfactants Deterg. 2023, n/a. [Google Scholar] [CrossRef]
  120. Zamora, J.M.; Marquez, R.; Forgiarini, A.M.; Langevin, D.; Salager, J.-L. Interfacial Rheology of Low Interfacial Tension Systems Using a New Oscillating Spinning Drop Method. J. Colloid Interface Sci. 2018, 519, 27–37. [Google Scholar] [CrossRef] [PubMed]
  121. Marquez, R.; Forgiarini, A.M.; Fernández, J.; Langevin, D.; Salager, J.-L. New Interfacial Rheology Characteristics Measured Using a Spinning-Drop Rheometer at the Optimum Formulation of a Simple Surfactant–Oil–Water System. J. Surfactants Deterg. 2018, 21, 611–623. [Google Scholar] [CrossRef]
  122. Langevin, D. An Adventure into the World of Soft Matter. Annu. Rev. Condens. Matter Phys. 2023, 14, 21–33. [Google Scholar] [CrossRef]
  123. Alsmaeil, A.W.; Kouloumpis, A.; Potsi, G.; Hammami, M.A.; Kanj, M.Y.; Giannelis, E.P. Probing the Interfacial Properties of Oil–Water Interfaces Decorated with Ionizable, pH Responsive Silica Nanoparticles. Langmuir 2023, 39, 3118–3130. [Google Scholar] [CrossRef]
  124. Beltrán, R.A.P. Johnbrynner García Thermal Behavior of Waxes and Its Correlation with Mascara Stability Tests: A DSC Study. In Cosmetic Products and Industry; Ahmad, U., Akhtar, J., Eds.; IntechOpen: Rijeka, Croatia, 2023; p. Ch. 5. ISBN 978-1-83768-623-0. [Google Scholar]
  125. Capra, P.; Musitelli, G.; Perugini, P. Wetting and Adhesion Evaluation of Cosmetic Ingredients and Products: Correlation of in Vitro-in Vivo Contact Angle Measurements. Int. J. Cosmet. Sci. 2017, 39, 393–401. [Google Scholar] [CrossRef] [PubMed]
  126. McClements, D.J. Critical Review of Techniques and Methodologies for Characterization of Emulsion Stability. Crit. Rev. Food Sci. Nutr. 2007, 47, 611–649. [Google Scholar] [CrossRef] [PubMed]
  127. Niu, H.; Wang, W.; Dou, Z.; Chen, X.; Chen, X.; Chen, H.; Fu, X. Multiscale Combined Techniques for Evaluating Emulsion Stability: A Critical Review. Adv. Colloid Interface Sci. 2023, 311, 102813. [Google Scholar] [CrossRef] [PubMed]
  128. Mancuso, A.; Tarsitano, M.; Udongo, B.P.; Cristiano, M.C.; Torella, D.; Paolino, D.; Fresta, M. A Comparison between Silicone-Free and Silicone-Based Emulsions: Technological Features and in Vivo Evaluation. Int. J. Cosmet. Sci. 2022, 44, 514–529. [Google Scholar] [CrossRef] [PubMed]
  129. Li, D.; Zhao, Y.; Wang, X.; Tang, H.; Wu, N.; Wu, F.; Yu, D.; Elfalleh, W. Effects of (+)-Catechin on a Rice Bran Protein Oil-in-Water Emulsion: Droplet Size, Zeta-Potential, Emulsifying Properties, and Rheological Behavior. Food Hydrocoll. 2020, 98, 105306. [Google Scholar] [CrossRef]
  130. Sęk, A.; Perczyk, P.; Wydro, P.; Gruszecki, W.I.; Szcześ, A. Effect of Trace Amounts of Ionic Surfactants on the Zeta Potential of DPPC Liposomes. Chem. Phys. Lipids 2021, 235, 105059. [Google Scholar] [CrossRef] [PubMed]
  131. Hong, I.K.; Kim, S.I.; Lee, S.B. Effects of HLB Value on Oil-in-Water Emulsions: Droplet Size, Rheological Behavior, Zeta-Potential, and Creaming Index. J. Ind. Eng. Chem. 2018, 67, 123–131. [Google Scholar] [CrossRef]
  132. Li, J.-M.; Nie, S.-P. The Functional and Nutritional Aspects of Hydrocolloids in Foods. Food Hydrocoll. 2016, 53, 46–61. [Google Scholar] [CrossRef]
  133. Geremias-Andrade, I.M.; Souki, N.P.D.B.G.; Moraes, I.C.F.; Pinho, S.C. Rheological and Mechanical Characterization of Curcumin-Loaded Emulsion-Filled Gels Produced with Whey Protein Isolate and Xanthan Gum. LWT 2017, 86, 166–173. [Google Scholar] [CrossRef]
  134. Khasa, H.; Kilby, G.; Chen, X.; Wang, C. Analytical Band Centrifugation for the Separation and Quantification of Empty and Full AAV Particles. Mol. Ther. Methods Clin. Dev. 2021, 21, 585–591. [Google Scholar] [CrossRef]
  135. Ullmann, C.; Babick, F.; Koeber, R.; Stintz, M. Performance of Analytical Centrifugation for the Particle Size Analysis of Real-World Materials. Powder Technol. 2017, 319, 261–270. [Google Scholar] [CrossRef]
  136. Mehn, D.; Rio-Echevarria, I.M.; Gilliland, D.; Kaiser, M.; Vilsmeier, K.; Schuck, P.; Wohlleben, W. Identification of nanomaterials: A validation report of two laboratories using analytical ultracentrifugation with fixed and ramped speed options. NanoImpact 2018, 10, 87–96. [Google Scholar] [CrossRef]
  137. Laue, T.M. Analytical Ultracentrifugation. Curr. Protoc. Protein Sci. 1996, 4, 7.5.1–7.5.9. [Google Scholar] [CrossRef]
  138. Schuldt, U.; Woehlecke, H.; Lerche, D. Characterization of Mechanical Parameters of Microbeads by Means of Analytical Centrifugation. Food Hydrocoll. 2019, 86, 201–209. [Google Scholar] [CrossRef]
  139. Oshima, K.; Nakamura, K.; Guo, H.; Smith, R.L. Mini-Review on Application of Analytical Centrifugation, Ultracentrifugation and Centrifugal Devices to Phase Equilibria and Separation Processes. Fluid Phase Equilibria 2022, 558, 113457. [Google Scholar] [CrossRef]
  140. Cole, J.L. Centrifugation|Analytical Ultracentrifugation; Elsevier: Amsterdam, The Netherlands, 2013. [Google Scholar] [CrossRef]
  141. Wohlleben, W.; Coleman, V.A.; Gilliland, D. Chapter 3.3.1—Analytical Centrifugation. In Characterization of Nanoparticles; Hodoroaba, V.-D., Unger, W.E.S., Shard, A.G., Eds.; Micro and Nano Technologies; Elsevier: Amsterdam, The Netherlands, 2020; pp. 225–247. ISBN 978-0-12-814182-3. [Google Scholar]
  142. Detloff, T.; Sobisch, T.; Lerche, D. Particle Size Distribution by Space or Time Dependent Extinction Profiles Obtained by Analytical Centrifugation (Concentrated Systems). Powder Technol. 2007, 174, 50–55. [Google Scholar] [CrossRef]
  143. Pereira, I.; Zielińska, A.; Ferreira, N.R.; Silva, A.M.; Souto, E.B. Optimization of Linalool-Loaded Solid Lipid Nanoparticles Using Experimental Factorial Design and Long-Term Stability Studies with a New Centrifugal Sedimentation Method. Int. J. Pharm. 2018, 549, 261–270. [Google Scholar] [CrossRef]
  144. Tehrani-Bagha, A.R. Cationic Gemini Surfactant with Cleavable Spacer: Emulsion Stability. Colloids Surf. Physicochem. Eng. Asp. 2016, 508, 79–84. [Google Scholar] [CrossRef]
  145. Kadiya, K.; Ghosh, S. Analytical Photo-Centrifuge-Based Prediction of Shelf-Life and Droplet Packing Behaviour of Nanoemulsions upon Removal of Excess Micelles. Colloids Surf. Physicochem. Eng. Asp. 2021, 612, 125869. [Google Scholar] [CrossRef]
  146. Delforce, L.; Ontiveros, J.F.; Nardello-Rataj, V.; Aubry, J.-M. Rational Design of O/W Nanoemulsions Based on the Surfactant Dodecyldiglyceryl Ether Using the Normalized HLD Concept and the Formulation-Composition Map. Colloids Surf. Physicochem. Eng. Asp. 2023, 671, 131679. [Google Scholar] [CrossRef]
  147. Delforce, L.; Nardello-Rataj, V.; Lebeuf, R.; Aubry, J.-M.; Ontiveros, J.F. Self-Aggregation, Dilational Surface Rheology and Foaming Properties of 1-O-Dodecyl Diglyceryl Ether Compared to n-Dodecyl-β-D-Maltoside and Pentaethyleneglycol Monododecyl Ether. J. Mol. Liq. 2023, 388, 122795. [Google Scholar] [CrossRef]
  148. Marquez, R.; Bullon, J.; Forgiarini, A.; Salager, J.-L. The Oscillatory Spinning Drop Technique. An Innovative Method to Measure Dilational Interfacial Rheological Properties of Brine-Crude Oil Systems in the Presence of Asphaltenes. Colloids Interfaces 2021, 5, 42. [Google Scholar] [CrossRef]
  149. Ricardo, F.; Ruiz-Puentes, P.; Reyes, L.H.; Cruz, J.C.; Alvarez, O.; Pradilla, D. Estimation and Prediction of the Air–Water Interfacial Tension in Conventional and Peptide Surface-Active Agents by Random Forest Regression. Chem. Eng. Sci. 2023, 265, 118208. [Google Scholar] [CrossRef]
  150. Li, P.; Huang, H.; Fang, Y.; Wang, Y.; No, D.S.; Bhatnagar, R.S.; Abbaspourrad, A. Interfacial Engineering of Clear Emulsions: Surfactant Hydrophobicity and the Hidden Role of Chain Structure. Colloids Surf. Physicochem. Eng. Asp. 2023, 676, 132242. [Google Scholar] [CrossRef]
  151. Ho, T.M.; Razzaghi, A.; Ramachandran, A.; Mikkonen, K.S. Emulsion Characterization via Microfluidic Devices: A Review on Interfacial Tension and Stability to Coalescence. Adv. Colloid Interface Sci. 2022, 299, 102541. [Google Scholar] [CrossRef]
  152. Vera, R.E.; Salazar-Rodríguez, F.; Marquez, R.; Forgiarini, A.M. How the influence of different salts on interfacial properties of surfactant–oil–water systems at optimum formulation matches the Hofmeister series ranking. J. Surfactants Deterg. 2020, 23, 603–615. [Google Scholar] [CrossRef]
  153. Aubry, J.-M.; Ontiveros, J.F.; Salager, J.-L.; Nardello-Rataj, V. Use of the Normalized Hydrophilic-Lipophilic-Deviation (HLDN) Equation for Determining the Equivalent Alkane Carbon Number (EACN) of Oils and the Preferred Alkane Carbon Number (PACN) of Nonionic Surfactants by the Fish-Tail Method (FTM). Adv. Colloid Interface Sci. 2020, 276, 102099. [Google Scholar] [CrossRef]
  154. Labarre, L.; Squillace, O.; Liu, Y.; Fryer, P.J.; Kaur, P.; Whitaker, S.; Marsh, J.M.; Zhang, Z.J. Hair Surface Interactions against Different Chemical Functional Groups as a Function of Environment and Hair Condition. Int. J. Cosmet. Sci. 2023, 45, 224–235. [Google Scholar] [CrossRef]
  155. Eudier, F.; Savary, G.; Grisel, M.; Picard, C. Skin Surface Physico-Chemistry: Characteristics, Methods of Measurement, Influencing Factors and Future Developments. Adv. Colloid Interface Sci. 2019, 264, 11–27. [Google Scholar] [CrossRef]
  156. Rossi, D.; Realdon, N. Surface Tensiometry Approach to Characterize Cosmetic Products in the Beauty Sector. In Surface Science and Adhesion in Cosmetics; John Wiley & Sons, Ltd.: Hoboken, NJ, USA, 2021; pp. 309–352. ISBN 978-1-119-65492-6. [Google Scholar]
  157. Influence of the Sebum and the Hydrolipidic Layer in Skin Wettability and Friction. In Agache’s Measuring the Skin; SpringerLink: Berlin/Heidelberg, Germany, 2017; Available online: https://link.springer.com/referenceworkentry/10.1007/978-3-319-32383-1_19 (accessed on 3 October 2023).
  158. Forgiarini, A.M.; Marquez, R.; Salager, J.-L. Formulation Improvements in the Applications of Surfactant–Oil–Water Systems Using the HLDN Approach with Extended Surfactant Structure. Molecules 2021, 26, 3771. [Google Scholar] [CrossRef]
  159. Chao, C.; Génot, C.; Rodriguez, C.; Magniez, H.; Lacourt, S.; Fievez, A.; Len, C.; Pezron, I.; Luart, D.; van Hecke, E. Emollients for Cosmetic Formulations: Towards Relationships between Physico-Chemical Properties and Sensory Perceptions. Colloids Surf. Physicochem. Eng. Asp. 2018, 536, 156–164. [Google Scholar] [CrossRef]
  160. Beard, B.C.; Hare, J. Surface interaction of quaternary amines with hair. J. Surfact Deterg. 2002, 5, 145–150. [Google Scholar] [CrossRef]
  161. Tadros, T.F. Rheology of Dispersions: Principles and Applications; Wiley-VCH Verlag & Co. KGaA: Weinheim, Germany, 2010; ISBN 9783527320035. [Google Scholar]
  162. Gallegos, C.; Franco, J.M. Rheology of Food, Cosmetics and Pharmaceuticals. Curr. Opin. Colloid Interface Sci. 1999, 4, 288–293. [Google Scholar] [CrossRef]
  163. Förster, T. Principles of Emulsion Formation. Surfactants Cosmet. Second Ed. Revis. Expand. 2017, 68, 105–126. [Google Scholar] [CrossRef]
  164. Tadros, T.F. Colloids in Cosmetics and Personal Care. In Colloids and Interface Science Vol. 4; Tadros, T.F., Ed.; Wiley-VCH Verlag & Co. KGaA: Weinheim, Germany, 2008; Volume 4, ISBN 9783527319916. [Google Scholar]
  165. Barnes, H.A. Rheology of Emulsions—A Review. Colloids Surf. Physicochem. Eng. Asp. 1994, 91, 89–95. [Google Scholar] [CrossRef]
  166. Ajayi, O.; Davies, A.; Amin, S. Impact of Processing Conditions on Rheology, Tribology and Wet Lubrication Performance of a Novel Amino Lipid Hair Conditioner. Cosmetics 2021, 8, 77. [Google Scholar] [CrossRef]
  167. Guzmán, E.; Ortega, F.; Rubio, R.G. Chitosan: A Promising Multifunctional Cosmetic Ingredient for Skin and Hair Care. Cosmetics 2022, 9, 99. [Google Scholar] [CrossRef]
  168. Tadros, T. Application of Rheology for Assessment and Prediction of the Long-Term Physical Stability of Emulsions. Adv. Colloid Interface Sci. 2004, 108–109, 227–258. [Google Scholar] [CrossRef]
  169. Salager, J.L.; Antón, R.E.; Briceno, M.I.; Choplin, L.; Márquez, L.; Pizzino, A.; Rodriguez, M.P. The Emergence of Formulation Engineering in Emulsion Making—Transferring Know-How from Research Laboratory to Plant. Polym. Int. 2003, 52, 471–478. [Google Scholar] [CrossRef]
  170. Szymula, M. The Influence of Ascorbic Acid on the Rheological Properties of the Microemulsion Region of the SDS/Pentanol/Water System. J. Cosmet. Sci. 2005, 56, 267–277. [Google Scholar] [CrossRef]
  171. Pons, R.; Solans, C.; Stebé, M.J.; Erra, P.; Ravey, J.C. Stability and Rheological Properties of Gel Emulsions. Trends Colloid Interface Sci. VI 2007, 113, 110–113. [Google Scholar] [CrossRef]
  172. Derkach, S.; Zhabyko, I.; Voron’ko, N.; Maklakova, A.; Dyakina, T. Stability and the Rheological Properties of Concentrated Emulsions Containing Gelatin-κ-Carrageenan Polyelectrolyte Complexes. Colloids Surf. Physicochem. Eng. Asp. 2015, 483, 216–223. [Google Scholar] [CrossRef]
  173. Hou, Y.Y.; Kassim, H.O. Instrument Techniques for Rheometry. Rev. Sci. Instrum. 2005, 76, 1–19. [Google Scholar] [CrossRef]
  174. Kao, S.V.; Mason, S.G. Dispersion of Particles by Shear. Nature 1975, 253, 619–621. [Google Scholar] [CrossRef]
  175. Lequeux, F. Emulsion Rheology. Curr. Opin. Colloid Interface Sci. 1998, 3, 408–411. [Google Scholar] [CrossRef]
  176. Chanamai, R.; McClements, D.J. Dependence of Creaming and Rheology of Monodisperse Oil-in-Water Emulsions on Droplet Size and Concentration. Colloids Surf. Physicochem. Eng. Asp. 2000, 172, 79–86. [Google Scholar] [CrossRef]
  177. Matos, M.; Gutiérrez, G.; Iglesias, O.; Coca, J.; Pazos, C. Characterization, Stability and Rheology of Highly Concentrated Monodisperse Emulsions Containing Lutein. Food Hydrocoll. 2015, 49, 156–163. [Google Scholar] [CrossRef]
  178. Hirschman, J.; Venkataramani, D.; Murphy, M.I.; Patel, S.M.; Du, J.; Amin, S. Application of Thin Gap Rheometry for High Shear Rate Viscosity Measurement in Monoclonal Antibody Formulations. Colloids Surf. Physicochem. Eng. Asp. 2021, 626, 127018. [Google Scholar] [CrossRef]
  179. Venkataramani, D.; Tsulaia, A.; Amin, S. Fundamentals and Applications of Particle Stabilized Emulsions in Cosmetic Formulations. Adv. Colloid Interface Sci. 2020, 283, 102234. [Google Scholar] [CrossRef]
  180. Farias, B.V.; Khan, S.A. Probing Gels and Emulsions Using Large-Amplitude Oscillatory Shear and Frictional Studies with Soft Substrate Skin Surrogates. Colloids Surf. B Biointerfaces 2021, 201, 111595. [Google Scholar] [CrossRef]
  181. Lee, S.; Kim, S.R.; Lee, H.-J.; Kim, B.S.; Oh, H.; Lee, J.B.; Park, K.; Yi, Y.J.; Park, C.H.; Park, J.D. Predictive Model for the Spreadability of Cosmetic Formulations Based on Large Amplitude Oscillatory Shear (LAOS) and Machine Learning. Phys. Fluids 2022, 34, 103109. [Google Scholar] [CrossRef]
  182. Márquez, R.; Bullón, J.; Márquez, L.; Cárdenas, A.; Briceño, M.I.; Forgiarini, A. Rheological Changes of Parenteral Emulsions During Phase-Inversion Emulsification. J. Dispers. Sci. Technol. 2008, 29, 621–627. [Google Scholar] [CrossRef]
  183. Huynh, A.; Garcia, A.G.; Young, L.K.; Szoboszlai, M.; Liberatore, M.W.; Baki, G. Measurements Meet Perceptions: Rheology–Texture–Sensory Relations When Using Green, Bio-Derived Emollients in Cosmetic Emulsions. Int. J. Cosmet. Sci. 2021, 43, 11–19. [Google Scholar] [CrossRef] [PubMed]
  184. Tai, A.; Bianchini, R.; Jachowicz, J. Texture Analysis of Cosmetic/Pharmaceutical Raw Materials and Formulations. Int. J. Cosmet. Sci. 2014, 36, 291–304. [Google Scholar] [CrossRef] [PubMed]
  185. Anton Paar Rheology of Cosmetics 2023. Available online: https://wiki.anton-paar.com/us-en/basics-of-rheology/rheological-investigation-of-cosmetics-and-pharmaceuticals/ (accessed on 10 October 2023).
  186. Morris, R. Spectrophotometry. Curr. Protoc. Essent. Lab. Tech. 2008, 00, 2.1.1–2.1.24. [Google Scholar] [CrossRef]
  187. Measure Color in the Cosmetics Industry. Konica Minolta Sens. Available online: https://sensing.konicaminolta.us/us/learning-center/youtube/measure-color-in-the-cosmetics-industry/ (accessed on 10 October 2023).
  188. Weisz, A.; Milstein, S.R.; Scher, A.L.; Hepp, N.M. Chapter 7—Colouring Agents in Cosmetics: Regulatory Aspects and Analytical Methods. In Analysis of Cosmetic Products, 2nd ed.; Salvador, A., Chisvert, A., Eds.; Elsevier: Boston, MA, USA, 2018; pp. 123–157. ISBN 978-0-444-63508-2. [Google Scholar]
  189. Samanta, A.K. Colorimetry; Intechopen: London, UK, 2022; ISBN 978-1-83962-940-2. [Google Scholar]
  190. Raluca, B. A Review of Color Measurments in the Textile Industry; Editura Universităţii din Oradea: Oradea, Romania, 2016. [Google Scholar]
  191. Choudhury, A.K.R. Principles of Colour and Appearance Measurement: Object Appearance, Colour Perception and Instrumental Measurement; Elsevier: Amsterdam, The Netherlands, 2014; ISBN 978-0-85709-924-2. [Google Scholar]
  192. Kuehni, R.G. Colour Difference Formulaes; Accurate Enough for Objective Colour Quality Control of Textiles? Color. Technol. 2003, 119, 164–169. [Google Scholar] [CrossRef]
  193. Volz, H.G. Industrial Color Testing: Fundamentals and Techniques/Hans G. Volz; Translated by Ben Teague; Wiley-VCH: Weinheim, Germany; New York, NY, USA, 2001; ISBN 978-3-527-30436-3. [Google Scholar]
  194. Meyers, R.A. Encyclopedia of Physical Sciences and Technology; Academic Press: Cambridge, MA, USA, 1992. [Google Scholar]
  195. Mukthy, A.A.; Vik, M.; Viková, M. A Comparison of Two Different Light Booths for Measuring Color Difference of Metameric Pairs. Textiles 2021, 1, 558–570. [Google Scholar] [CrossRef]
  196. Fotios, S.; Cheal, C.; Boyce, P. Light Source Spectrum, Brightness Perception and Visual Performance in Pedestrian Environments: A Review. Light. Res. Technol. 2005, 37, 271–291. [Google Scholar] [CrossRef]
  197. Standard Practice for Visual Appraisal of Colors and Color Differences of Diffusely-Illuminated Opaque Materials. Available online: https://www.astm.org/d1729-22.html (accessed on 23 October 2023).
  198. Sha, D.R.K. The Concepts of Color Matching and Shade Selection in Prosthodontics; Book Rivers: Lucknow, India, 2021; ISBN 978-93-91000-32-5. [Google Scholar]
  199. Zollinger, H. Color Chemistry: Syntheses, Properties, and Applications of Organic Dyes and Pigments; John Wiley & Sons: Hoboken, NJ, USA, 2003; ISBN 978-3-906390-23-9. [Google Scholar]
  200. Zelanski, P.; Fisher, M.P. Color; Ediciones AKAL: Madrid, Spain, 2001; ISBN 978-84-89840-21-8. [Google Scholar]
  201. Hubel, D.H. Ojo, Cerebro y Visión; EDITUM, Universidad de Murcia: Murcia, Spain, 2000; ISBN 978-84-8371-143-9. [Google Scholar]
  202. Capilla, P.; Artigas, J.M.; Pujol, J. Fundamentos de Colorimetría; Universitat de València: Valencia, Spain, 2002; ISBN 978-84-370-5420-9. [Google Scholar]
  203. Gilchrist, A.; Nobbs, J. Colorimetry, Theory; Academic Press: Cambridge, MA, USA, 2000; pp. 337–343. ISBN 978-0-12-226680-5. [Google Scholar]
  204. Ji, K.; Xue, Y.; Cui, Z. A New Method for Colors Characterization of Colored Stainless Steel Using CIE and Munsell Color Systems. Opt. Mater. 2015, 47, 180–184. [Google Scholar] [CrossRef]
  205. Atlas of the Munsell Color System; Munsell Color Syst. Color Matching Munsell Color Co. Malden, Mass., Wadsworth, Howland & Co.: Wadsworth, OU, USA, 2014.
  206. Priest, I.G.; Gibson, K.S.; McNicholas, H.J. An Examination of the Munsell Color System: I. Spectral and Total Reflection and the Munsell Scale of Value; U.S. Government Printing Office: Washington, DC, USA, 1920.
  207. Wang, J.; Shi, G. Comparative Study on the Origin and Characteristics of Chinese (Manas) and Russian (East Sayan) Green Nephrites. Minerals 2021, 11, 1434. [Google Scholar] [CrossRef]
  208. González, A.M.; Vicente, I. El color en la Industria de los Alimentos; Editorial Universitaria: Habana, Cuba, 2020; ISBN 978-959-16-0582-5. [Google Scholar]
  209. Monedero Isorna, J. Simulación Visual de Materiales: Teoría, Técnicas, Análisis de Casos; Iniciativa Digital Politècnica: Madrid, Spain, 2015; ISBN 978-84-9880-564-2. [Google Scholar]
  210. Alizadeh Ghazijahani, H.; Abdollahzadeh, M.; Seyedarabi, H.; Musevi Niya, M.J. On Error and Bitrate Tradeoff in Visible Light Communication System to Ensure HEVC Video Quality. Int. J. Inf. Commun. Technol. Res. 2016, 8, 19–27. [Google Scholar]
  211. McLaren, K. The Development of the CIE 1976 (L*a*b*) Uniform Colour-Space and Colour-Difference Formula. J. Soc. Dye. Colour. 2008, 92, 338–341. [Google Scholar] [CrossRef]
  212. Ly, B.C.K.; Dyer, E.B.; Feig, J.L.; Chien, A.L.; Del Bino, S. Research Techniques Made Simple: Cutaneous Colorimetry: A Reliable Technique for Objective Skin Color Measurement. J. Invest. Dermatol. 2020, 140, 3–12.e1. [Google Scholar] [CrossRef] [PubMed]
  213. Hunt, R.W.G.; Pointer, M.R. Measuring Colour; John Wiley & Sons: Hoboken, NJ, USA, 2011; ISBN 978-1-119-97537-3. [Google Scholar]
  214. Yoshida, K.; Okiyama, N. Estimation of Reflectance, Transmittance, and Absorbance of Cosmetic Foundation Layer on Skin Using Translucency of Skin. Opt. Express 2021, 29, 40038–40050. [Google Scholar] [CrossRef] [PubMed]
  215. Wyszecki, G.; Stiles, W.S. Color Science: Concepts and Methods, Quantitative Data and Formulae; John Wiley & Sons: Hoboken, NJ, USA, 2000; Volume 40, ISBN 0-471-39918-3. [Google Scholar]
  216. Blaksley, C.; Casolino, M.; Cambié, G. Design and Performance of a Hyperspectral Camera for Full-Face in Vivo Imaging. Rev. Sci. Instrum. 2021, 92, 055108. [Google Scholar] [CrossRef] [PubMed]
  217. Sun, M.D.; Kentley, J.; Wilson, B.W.; Soyer, H.P.; Curiel-Lewandrowski, C.N.; Rotemberg, V.; Halpern, A.C. ISIC Technique Working Group Digital Skin Imaging Applications, Part I: Assessment of Image Acquisition Technique Features. Skin Res. Technol. 2022, 28, 623–632. [Google Scholar] [CrossRef] [PubMed]
  218. Fernandes, G.M.; Silva, W.R.; Barreto, D.N.; Lamarca, R.S.; Lima Gomes, P.C.F.; Flávio da S Petruci, J.; Batista, A.D. Novel Approaches for Colorimetric Measurements in Analytical Chemistry—A Review. Anal. Chim. Acta 2020, 1135, 187–203. [Google Scholar] [CrossRef]
  219. Berns, R.S. Billmeyer and Saltzman’s Principles of Color Technology; John Wiley & Sons: Hoboken, NJ, USA, 2019; ISBN 1-119-36722-0. [Google Scholar]
  220. Rocca, R.; Acerbi, F.; Fumagalli, L.; Taisch, M. Sustainability Paradigm in the Cosmetics Industry: State of the Art. Clean. Waste Syst. 2022, 3, 100057. [Google Scholar] [CrossRef]
  221. Kassim, M.A.; Meng, T.K.; Serri, N.A.; Yusoff, S.B.; Shahrin, N.A.M.; Seng, K.Y.; Bakar, M.H.A.; Keong, L.C. Sustainable Biorefinery Concept for Industrial Bioprocessing. In Biorefinery Production Technologies for Chemicals and Energy; Wiley: Hoboken, NJ, USA, 2020; pp. 15–53. ISBN 978-1-119-59306-5. [Google Scholar]
  222. Vinod, A.; Sanjay, M.R.; Suchart, S.; Jyotishkumar, P. Renewable and Sustainable Biobased Materials: An Assessment on Biofibers, Biofilms, Biopolymers and Biocomposites. J. Clean. Prod. 2020, 258, 120978. [Google Scholar] [CrossRef]
  223. Barrios, N.; Marquez, R.; McDonald, J.D.; Hubbe, M.A.; Venditti, R.A.; Pal, L. Innovation in Lignocellulosics Dewatering and Drying for Energy Sustainability and Enhanced Utilization of Forestry, Agriculture, and Marine Resources—A Review. Adv. Colloid Interface Sci. 2023, 318, 102936. [Google Scholar] [CrossRef]
  224. Marquez, R.; Barrios, N.; Vera, R.E.; Mendez, M.E.; Tolosa, L.; Zambrano, F.; Li, Y. A Perspective on the Synergistic Potential of Artificial Intelligence and Product-Based Learning Strategies in Biobased Materials Education. Educ. Chem. Eng. 2023, 44, 164–180. [Google Scholar] [CrossRef]
  225. Ariyanta, H.A.; Santoso, E.B.; Suryanegara, L.; Arung, E.T.; Kusuma, I.W.; Azman Mohammad Taib, M.N.; Hussin, M.H.; Yanuar, Y.; Batubara, I.; Fatriasari, W. Recent Progress on the Development of Lignin as Future Ingredient Biobased Cosmetics. Sustain. Chem. Pharm. 2023, 32, 100966. [Google Scholar] [CrossRef]
  226. Tinôco, D.; Borschiver, S.; Coutinho, P.L.; Freire, D.M.G. Technological Development of the Bio-Based 2,3-Butanediol Process. Biofuels Bioprod. Biorefining 2021, 15, 357–376. [Google Scholar] [CrossRef]
  227. Kenney, K.L.; Smith, W.A.; Gresham, G.L.; Westover, T.L. Understanding Biomass Feedstock Variability. Biofuels 2013, 4, 111–127. [Google Scholar] [CrossRef]
  228. Goyal, N.; Jerold, F. Biocosmetics: Technological Advances and Future Outlook. Environ. Sci. Pollut. Res. 2023, 30, 25148–25169. [Google Scholar] [CrossRef]
  229. Besselink, H.; Brouwer, B.; van der Burg, B. Validation and Regulatory Acceptance of Bio-Based Approaches to Assure Feedstock, Water & Product Quality in a Bio-Based Economy. Chall. Build. Sustain. Biobased Econ. 2017, 106, 138–145. [Google Scholar] [CrossRef]
  230. Narayan, R. Rationale, Drivers, Standards, and Technology for Biobased Materials. In Renewable Resources and Renewable Energy: A Global Challenge; CRC Press-Taylor and Francis Group: Boca Raton, FL, USA, 2007; pp. 3–18. [Google Scholar]
  231. Ngoc, L.T.; Moon, J.-Y.; Lee, Y.-C. Insights into Bioactive Peptides in Cosmetics. Cosmetics 2023, 10, 111. [Google Scholar] [CrossRef]
  232. Ugoeze, K.C.; Odeku, O.A. Chapter 7—Herbal Bioactive–Based Cosmetics. In Herbal Bioactive-Based Drug Delivery Systems; Bakshi, I.S., Bala, R., Madaan, R., Sindhu, R.K., Eds.; Academic Press: Cambridge, MA, USA, 2022; pp. 195–226. ISBN 978-0-12-824385-5. [Google Scholar]
  233. de Oliveira, C.A.; Dario, M.F. Bioactive Cosmetics. In Handbook of Ecomaterials; Martínez, L.M.T., Kharissova, O.V., Kharisov, B.I., Eds.; Springer International Publishing: Cham, Switzerland, 2019; pp. 3537–3559. ISBN 978-3-319-68255-6. [Google Scholar]
  234. Mitterer-Daltoé, M.L.; Martins, V.B.; Parabocz, C.R.B.; da Cunha, M.A.A. Use of Cosmetic Creams and Perception of Natural and Eco-Friendly Products by Women: The Role of Sociodemographic Factors. Cosmetics 2023, 10, 78. [Google Scholar] [CrossRef]
  235. Herrero, Y.R.; Camas, K.L.; Ullah, A. Chapter 4—Characterization of Biobased Materials. In Advanced Applications of Biobased Materials; Ahmed, S., Annu, Eds.; Elsevier: Amsterdam, The Netherlands, 2023; pp. 111–143. ISBN 978-0-323-91677-6. [Google Scholar]
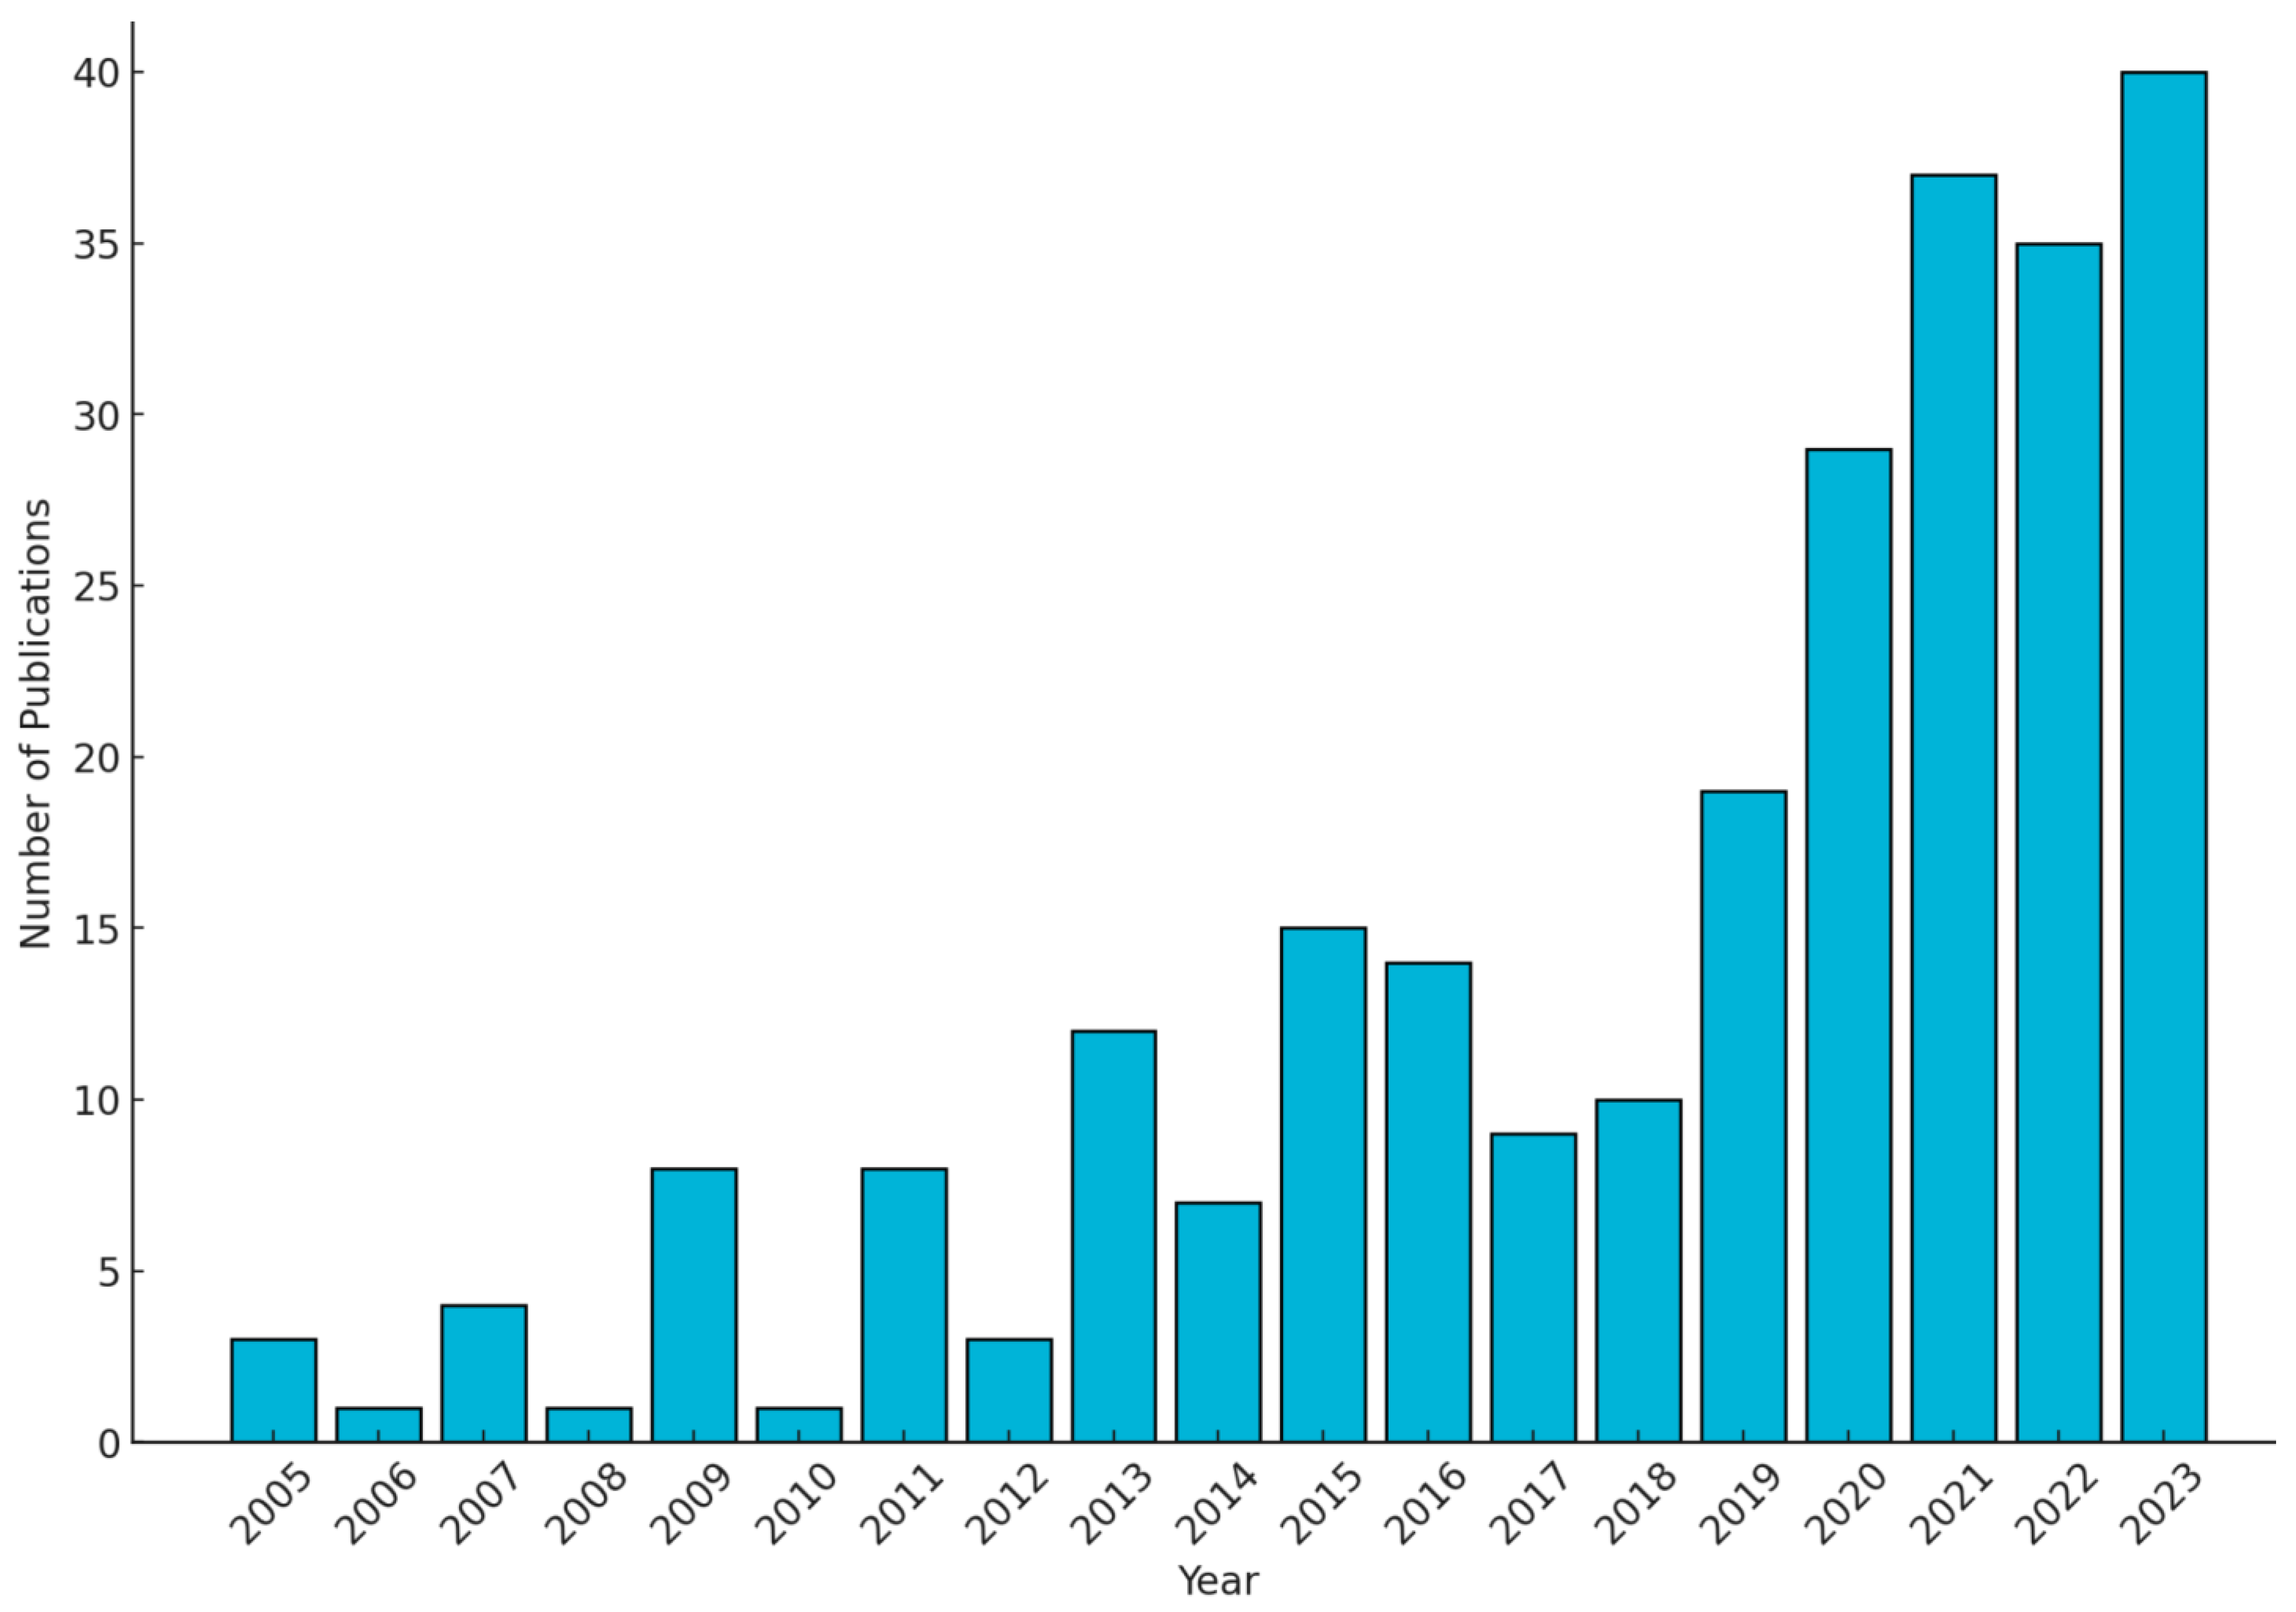
Figure 1. Number of publications of research papers with the keywords “cosmetic”, “analysis”, “stability”, and “formulation” in their titles and abstracts from 2005 to 2023, obtained in a search in the Dimensions and Scopus databases.
Cosmetics 11 00001 g001
Figure 2. Main keywords in publications from the Dimensions and Scopus databases identified through a bibliometric analysis. The data were gathered using the keywords “cosmetic”, “analysis”, “stability”, and “formulation” in the titles and abstracts of publications. The analysis involved 257 publications, analyzed with the VoSviewer text analytics module from Leiden University, Netherlands (available at https://www.vosviewer.com, accessed on 10 October 2023). The bibliographic connections are illustrated in a visual format, where the size and connectivity of the circles and lines represent the volume of publications, the extent of citations, and the degree of collaborations. Five distinct research clusters were identified: analysis of formulation in cosmetics (red), physicochemical properties (green), product properties evaluation (blue), emulsions (purple), and antioxidant addition (yellow). The live plot website can be found at the following address: https://app.vosviewer.com/?json=https%3A%2F%2Fdrive.google.com%2Fuc%3Fid%3D1MA6NHvqTSquemkM6lmaDoqSI9lLd28Wy, accessed on 17 December 2023.
Cosmetics 11 00001 g002
Figure 3. Radar charts of advantages (left), and limitations (right) of analytical techniques in cosmetics. A scale from 1 to 5 in aspects such as cost, specificity, ease of use, precision, environmental impact, and equipment requirements is used. The analysis was performed alongside the analysis of 257 publications and involved assigning a semi-empirical value to each category.
Cosmetics 11 00001 g003
Figure 4. Diagram of a gas chromatograph coupled with an olfactometer. This system has a Y splitter (three-way splitter or two-way splitter) that allows the sample to reach one or two instrumental detectors as well as the olfactometer. (Image created with BioRender.com).
Cosmetics 11 00001 g004
Figure 5. Comparison of simulated olfactograms for six compounds using different methods: (a) AEDA (aroma extract dilution analysis), (b) CHARM (combined hedonic aroma response measurement), (c) frequency detection, and (d) direct intensity (Osme) (adapted from [79]).
Cosmetics 11 00001 g005
Figure 6. Comparison of the biological olfactory system and the electronic nose. The sensor array acts as an olfactory receptor that detects chemical compounds and emits a signal, which is then processed. (Image created with BioRender.com, accessed on 7 July 2023).
Cosmetics 11 00001 g006
Figure 7. Schematic of dispersion instability phenomena: creaming, flocculation, coalescence, sedimentation, and Ostwald ripening. Adapted from [117].
Cosmetics 11 00001 g007
Figure 8. Optical microscopy of an emulsion based on silicone emulsions at different dilutions from (a) concentrated, (b) 50/50 vol./vol., to (c) diluted.
Cosmetics 11 00001 g008
Figure 9. General structure for the LUMiSizer. From the LUMiSizer Manual.
Cosmetics 11 00001 g009
Figure 11. Forces associated with interfacial tension.
Cosmetics 11 00001 g011
Figure 12. Contact angles less than 90 degrees indicate that the droplet wets the surface. A contact angle of 90 degrees signifies that the cohesion and adhesion forces are equal, typically observed when a solid particle exhibits mixed wettability between oil and water. Contact angles greater than 90 degrees imply that the droplet does not wet the surface.
Cosmetics 11 00001 g012
Figure 13. Representation of a flow curve for shear-thinning cosmetic products (green line). Cosmetic products are mainly dispersions that present sedimentation phenomena at very low shear rates. Then, higher shear applications such as gentle spreading on the skin, transfer between containers and fluid flow, quick application to hair or skin, and dispensing, bottling, and brushing are represented by very-high shear processes that cannot be measured using conventional rotational rheometers.
Cosmetics 11 00001 g013
Figure 14. Storage modulus G′ and the loss modulus G″ as a function of stress (Top panel) and frequency (Bottom panel). In this example, both the stress and frequency sweep present a storage modulus G′ larger than the loss modulus G″, representing a viscoelastic behavior, with a phase angle lower than 45 degrees. The complex viscosity as a function of frequency (Bottom panel) provides information on the viscoelastic behavior. Eta* with a slope = -1 indicates the highly elastic behavior of the sample, which can be related to a network formed between the components in the system [182].
Cosmetics 11 00001 g014aCosmetics 11 00001 g014b
Figure 15. Elements for color perception: a light source illuminating an object, the object reflecting or transmitting light to an observer, and the observer perceiving the reflected light.
Cosmetics 11 00001 g015
Figure 16. Munsell tree. Hue: the dominant wavelength of color. This property grants the quality of distinction among other colors. Lightness or value measures the clarity or darkness. This scale is also called the Tonal Value Scale or Chiaroscuro. In the Munsell model, this scale corresponds to the trunk of his color tree. Chromaticity or saturation: this property measures the intensity or purity of color. That is, it includes what goes from the absence of color seen in neutral colors to the most vivid or saturated colors [206,207].
Cosmetics 11 00001 g016
Figure 17. CIE 1931 color space. Y signifies luminance; Z is roughly equal to the blue stimulus (S cones), and X is a mix tending toward the red-to-green sensitivity curve [210].
Cosmetics 11 00001 g017
Figure 18. CIE 1976 color space where L* luminance, C* chroma coordinate, and h° hue angle, expressed in degrees [212].
Cosmetics 11 00001 g018
Figure 19. Challenges and opportunities of the introduction of biobased raw materials in the formulation of cosmetic products and the use of meta-analysis techniques to tailor the required properties, including consumer perception.
Cosmetics 11 00001 g019
Table 1. Stages in the meta-analysis of cosmetics formulation.
StageDescription
Systematic ReviewBegins with a thorough literature review to identify relevant studies using various analytical methods, aiming to cover a broad spectrum of research related to cosmetic analysis.
Comprehensive Data CollectionInvolves gathering data from different analytical techniques specific to a cosmetic product, such as chromatography for chemical composition, rheology for texture and consistency, electronic nose for fragrance, and stability testing for shelf-life.
Data Integration and SynthesisIntegrates the collected data, which can be challenging due to their diversity. This step often includes standardizing different data forms for a comparative analysis.
Statistical Analysis and ModelingUtilizes advanced statistical techniques and models to analyze the combined data set. This may include meta-regression analyses to understand variable relationships and their impact on a cosmetic product’s overall performance and quality.
Holistic InterpretationAims to provide a comprehensive understanding of a cosmetic product by interpreting the integrated data in terms of chemical composition, physical properties, sensory attributes, stability, and how these collectively define the product’s characteristics.
Application in Product Development and Quality ControlApplies the insights from the meta-analysis to guide product formulation, development, and quality control, ensuring informed decisions which consider various factors affecting the product’s efficacy, safety, and consumer acceptance.
Table 2. Advantages, limitations, and comparison between techniques and recent developments in analytical methods for cosmetics.
Type of TechniqueAdvantagesLimitationsComparison with Other TechniquesRecent Developments
LC-MS/MSHigh specificity, sensitive in complex matricesHigh cost, expertise neededMore sensitive than HPLCAdvancements in detection limits and sample preparation techniques
HPLCVersatile, widely availableLess sensitive than LC-MS/MSMore accessible than LC-MS/MSImprovements in column technology for better separation
GC-MSExcellent for volatile compoundsNot suitable for high molecular weight compoundsSuperior for volatiles compared to HPLC and LC-MS/MSEnhanced sensitivity and faster analysis times
Electronic NoseRapid, suitable for complex aromasLimited by sensor types, less specificFaster, more holistic for aroma analysisImproved sensor technology for better specificity
ColorimetrySimple, quick for color analysisLimited to surface color, can be subjectiveObjective analysis of color compared to other techniquesIntegration with digital imaging for enhanced accuracy
RheologyCrucial for texture and viscosity assessmentCan be complex and equipment-dependentProvides more detailed analysis than simple viscosity measurementsAdvances in automation and precision of measurements
Surface TensionImportant for understanding foamability and surfactant micellization performance Limited to specific types of analysisMore detailed than simple foam stability testsInnovations in measurement techniques for faster and more accurate results
Table 3. Examples of liquid chromatography in cosmetics.
IngredientSampleMethodDetectionReference/Year
UV FiltersSamples with sunscreensLiChrospher® RP-18 (12.5 cm × 4 mm i.d., 5 μm)UV-Vis[28]/2005
[29]/2004
UV FiltersSkin lotion, skin emulsion, skin cream, and sunscreen.Agilent C18 HPLC column (150 mm × 4.6 mm, 5 μm)UV-Vis[30]/2018
UV FiltersSunscreenHypersil C18 BDS (100 mm × 4.6 mm i.d. 3 μm)UV-Vis[31]/ 2011
Antioxidants and PreservativesSkin creamColumn C18 (4.6 mm × 250 mm, 5 μm) MS[32]/2006
PreservativesCreams, lotions, shampoos, conditioners, and liquid soapZorbax SB-C18 column (12.5 × 4.6 mm i.d., 5 μm)
Mobile phase with SDS.
UV-Vis[41]/2013
PreservativesCreamsZorbax Bonus-RP column (100 mm × 2.1 mm i.d., 3.5 μm)
Mobile phase: a methanol and ammonium formate solution 0.05 mol/L (pH = 3.0).
UV-Vis[42]/2012
[43]/2011
Phthalates and ParabensHair sprays, perfumes, deodorants, creams, and lotionsZorbax C8 column (150 mm × 4.6 mm i.d., 3 μm) Mobile phase: methanol and water.DAD[44]/2007
PreservativesSunblock, hand cream, body cream, and toothpaste.Column ODS-3 (150 mm × 4.0 mm, 3 μm).DAD[45]/2011
[46]/2012
PreservativesSerumColumn SHIM-PACK XR-ODS® column (100 × 3.0 mm i.d., 2.2 μm)MS[47]/2016
PreservativesBath productsColumn Zorbax Eclipse XDB-C8 (150 × 4.6 mm i.d., 5 μm)Quimioluminiscence[48]/2005
ColorantsLip balm, hair spray, eye shadow, soap, nail polish, shampoos, toothpaste, and face paints.Column Phenomenex Kinetex C18 (100 mm × 2.1 mm, 2.6 μm)MS/MS[49]/2017
ColorantsLipsticks, lip gloss, nail polish, lip balm, shampoo, perfumes, liquid soaps, shower gels, mouthwashes, and regenerative creams.Column Thermo Scientific Hypersil Gold (100 mm × 2.1 mm, 1.9 μm)MS/MS[50]/2015
ColorantsHair dyeShimadzu CLC-ODS, C18, (25 cm × 4.6 mm, 5 μm)UV[51]/2015
ColorantsLipsticks, nail polishes, eye products, blushes, body glitter, face paints, bath products, creams, and toothpaste.Column Xterra RP18 (250 × 4.6 mm i.d., 5 μm)PDA[52]/2014
Table 6. Rheological aspects and testing methodologies for cosmetic products.
Type of Cosmetic ProductCharacteristicsMeasured PropertiesModel UsedImportant Parameters
Hair GelViscoelastic system with high molecular weight polymers, forming a three-dimensional network.Viscosity, Yield StressHerschel–Bulkley model for yield stress calculationHigh viscosity during production, high yield stress for consumer perception
Nail PolishThixotropic material with time-dependent viscosity behavior.Thixotropic Recovery, ViscosityThree-interval thixotropy step testThixotropic recovery rates affecting application
Skin CreamEmulsion with key focus on tactile experience and long-term stability.Storage Modulus (G′), Loss Modulus (G″)Amplitude sweeps in oscillation testsStorage and loss modulus in the low strain/stress range
Disclaimer/Publisher’s Note: The statements, opinions and data contained in all publications are solely those of the individual author(s) and contributor(s) and not of MDPI and/or the editor(s). MDPI and/or the editor(s) disclaim responsibility for any injury to people or property resulting from any ideas, methods, instructions or products referred to in the content.