Article

The Potential of Grapevine Leaf Extract in Treating Hyperpigmentation

1
Chemical Engineering Department, Ariel University, Ariel 40700, Israel
2
Eastern Regional R&D Center, Ariel 40700, Israel
*
Authors to whom correspondence should be addressed.
Cosmetics 2024, 11(1), 2; https://doi.org/10.3390/cosmetics11010002
Submission received: 7 November 2023 / Revised: 13 December 2023 / Accepted: 14 December 2023 / Published: 22 December 2023
(This article belongs to the Collection Feature Papers in Cosmetics in 2023)

Abstract

:
Hyperpigmentation, characterized by the excessive accumulation of melanin in the skin, is a common dermatological concern triggered by various factors, including UV radiation exposure. This study investigates the potential of grapevine leaf extracts in treating hyperpigmentation induced by UV radiation, focusing on 11 European and 12 Israeli grapevine varieties. Our research explores the correlations between total polyphenol content (TPC), tyrosinase inhibition, sun protection factor (SPF), and half-maximal inhibitory concentration (IC50) of these extracts. Our findings reveal substantial variation in TPC among grapevine varieties’ leaves, with the Israeli varieties showing higher TPC levels than the European ones. Correlation analysis demonstrates a robust link between TPC and SPF, indicating that increased TPC contributes to enhanced sun protection properties. However, TPC alone does not strongly correlate with tyrosinase inhibition, suggesting the importance of specific polyphenols in tyrosinase inhibition. Furthermore, the study identifies specific peaks in the HPLC analysis that correlate with desired activities. In summary, our research highlights the potential of grapevine leaf extracts, especially those from Israeli indigenous varieties, in addressing hyperpigmentation. It emphasizes the importance of specific polyphenols rather than TPC alone in achieving the desired effects. These findings open doors for further investigation into identifying and isolating active compounds from grapevine leaves for skincare applications.

1. Introduction

The skin is a vital layer of the human body that protects us from harmful environmental factors, including UV radiation [1,2]. The skin has several natural defenses against UV radiation, including (1) melanin, the pigment that gives skin its color; it absorbs UV radiation and protects it from harmful effects [3,4,5]. (2) keratin, the tough protein that makes up the epidermis of the skin, which helps protect the skin from UV radiation [6,7], and (3) Langerhans cells: These immune cells help to fight off damage caused by UV radiation [8]. However, excessive UV radiation exposure can damage this defense system, leading to several skin disorders. For example, UV radiation can damage the elastin and collagen of the skin, causing premature aging [9], wrinkles [10], sunburn, age spots [11], skin cancer [12], and hyperpigmentation [1,2,13,14,15,16,17].
Hyperpigmentation refers to the uneven darkening of the skin due to the heavy accumulation of melanin [18]. It is characterized by the development of melanin-rich areas on the skin and is frequently observed on facial and cervical regions, as well as on arms and hands [1,2,13,14,15,16,17].
Hyperpigmentation is widespread, affecting people of various skin types and ages [17,18]. The visible nature of hyperpigmentation can cause individuals to feel insecure about their appearance, leading to a negative body image and low self-esteem [19]. Consequently, affected individuals may be excessively preoccupied with how others perceive them, resulting in anxiety and self-consciousness in social settings [20]. Hyperpigmentation is commonly associated with various forms of skin damage, including inflammation [21], DNA damage [22], and oxidative stress [23], which can be triggered by UV radiation [24]. Other factors contributing to hyperpigmentation include genetic background, hormonal changes, and inflammatory skin conditions [1,2,13,14,15,16,17,18]. Although the skin has many ways to protect itself from UV radiation, melanin production is one of the most important ways to protect itself from the harmful effects of UV radiation and reduce DNA damage [3,4,5].
Tyrosinase plays a pivotal role in the biosynthesis of melanin pigment in various organisms, including mammals [25]. It is predominantly localized within melanocytes, specialized cells responsible for synthesizing and secretion of pigment granules [26]. Tyrosinase activity is a critical factor in regulating melanogenesis, the process of melanin synthesis through a series of reactions involving tyrosinase and other melanogenesis-related proteins [27].
Traditional methods for hyperpigmentation treatment involve topical substances (ointments, salves, and emollients), chemical peels, and laser treatments. Nevertheless, these techniques exhibit numerous adverse effects. For instance, topical lotions and creams occasionally induce irritation, redness, and hypersensitive responses (This is more prevalent in ointments that incorporate hydroquinone, corticosteroid, and kojic acid in elevated concentrations) [28]. Laser therapy can give rise to transient redness, inflammation, and blistering [29]. The adverse effects of chemical peels entail scabbing, post-inflammatory hyperpigmentation, and erythema [30]. Therefore, there is a growing interest in identifying natural bioactive compounds with potential photoprotective properties, aiming to block UV radiation damages and additionally conferring tyrosinase inhibition effects that can be utilized for managing skin hyperpigmentation.
Various chemicals and phytochemicals were found to be effective against hyperpigmentation. Hyaluronic acid-based microneedle patches loaded with anti-melanogenic bioactive compounds niacinamide, ascorbic acid 2-glucoside, tranexamic acid, resveratrol, 4-n-butyl-resorcinol, along with Halidrys siliquosa extract were found to be effective against hyperpigmentation [31]. Isobutylamido-thiazolyl-resorcinol (Thiamidol) was also identified as a potent inhibitor of human tyrosinase and showed effectiveness in preventing post-inflammatory hyperpigmentation induced by epidermal wounding and acne [32]. In addition, anti-hyperpigmentation properties of various compounds, such as arbutin, ascorbic acid, flavonoids, hydroxyquinone, kojic acid, thioctic acid, retinoic acid, retinol, azelaic acid, aloesin was shown [33], as well as that of isofraxidin 7-O-(6′-O-p-coumaroyl)-β-glucopyranoside from Artemisia capillaris, showing anti-hyperpigmentation activity in the zebrafish model and mammalian melanocytes [34].
Another way to prevent hyperpigmentation is the prevention of UV irradiation damage. Various skincare applications’ sun protection factor (SPF) is vital in managing hyperpigmentation [35,36]. The labeled SPF value on sunscreens primarily indicates their protection against UVB radiation, which causes sunburn. However, the labeled SPF does not always accurately represent UVA radiation protection, which is responsible for premature aging and skin cancer. Studies have shown that the measured UVA protection of sunscreens can be significantly lower than their labeled SPF values [37].
Polyphenols are naturally occurring bioactive compounds found in plants. They are known for their antioxidant and anti-inflammatory properties, associated with various health benefits. Some studies suggest that certain polyphenols may have the potential to manage hyperpigmentation due to their ability to inhibit melanin synthesis or reduce oxidative stress. One polyphenol that has received attention for its potential role in treating hyperpigmentation is resveratrol [38,39,40]. Resveratrol is found in grapes, berries, and red wine, and it has been shown to possess antioxidant and anti-inflammatory properties [38]. A recent study found that resveratrol significantly inhibited melanin synthesis by suppressing tyrosinase activity [39,40]. In addition, ellagic acid reduces melanin production and protects against UV-induced damage by inhibiting the activation of tyrosinase in melanogenesis [41].
The cultivation of Grapevine (Vitis vinifera) is mainly connected with wine production or table grapes, where the emphasis is clearly on the fruit rather than the leaves. However, grapevine leaves have been acknowledged for their potential bioactivity due to their composition of diverse bioactive chemicals, including various polyphenols [42,43,44]. There is a consensus that these substances manifest a diverse range of advantageous qualities, such as anti-inflammatory and antioxidant effects, which might also protect the skin [45]. The inhibitory effect of leaf extracts from a few V. vinifera varieties concerning tyrosinase has been recorded in previous studies [45,46,47]. Therefore, investigating the potential of bioactive compounds of grapevine leaves becomes an attractive research direction due to the widespread occurrence of skin hyperpigmentation and the demand for natural and efficacious treatments. Nevertheless, as grape varieties significantly differ in their fruit chemical composition, we hypothesize that they also differ in their leaf extract composition, which may affect their efficacy for UV protection and tyrosinase inhibition. Thus, a comprehensive analysis of a broad set of grapevine varieties, comparing their leaf extract activity and selecting varieties with higher activity, can support the efforts to develop an effective natural hyperpigmentation treatment.
The Israeli indigenous varieties collected and characterized by our group [48,49] have lately been shown to have been domesticated from the local Vitis vinifera ssp. sylvestris populations are still growing wild in northern Israel [50,51,52]. We also hypothesize that these domesticated varieties may have developed drought, heat, and irradiation resistance mechanisms due to their domestication and multiple selections in the Levant area, characterized by hot temperatures and radiation levels. Lately, we presented initial evidence supporting this theory, showing that a group of Israeli varieties developed a drought avoidance mechanism [53]. Indeed, other irradiation resistance mechanisms include the overproduction of phytochemicals to cope with the damages caused by access radiation rates [54,55], which may be good candidates for protecting the human skin from similar effects.
This study explores the potential of bioactive compounds of a broad set of Israeli and European grape varieties’ leaf extracts for treating skin hyperpigmentation. Through biochemical assays, including tyrosinase activity inhibition, SPF analysis, and determination of total phenolic levels, we aim to distinguish between highly active extracts and low ones and use these measurements and the HPLC analysis of the extract composition to widen our understanding of the mechanisms leading to both the photoprotective effects of grapevine leaf extracts, and their tyrosinase inhibitory effects. Furthermore, this study will contribute to the broader understanding of natural photoprotective bioactive compounds and their potential applications in skincare and dermatology.

2. Materials and Methods

2.1. Plant Material Preparation

Extractions were made from leaves of 11 European and 12 Israeli grapevine (Vitis vinifera) varieties. Three repetitions were carried out for each variety. The leaves underwent a washing and drying process in an oven set at 60 °C for an entire night. Subsequently, the dried leaves were crushed in a mortar until they reached a powdered consistency. A specialized extraction solvent, composed of methanol, acetone, water, and acetic acid in proportions of 30%, 42%, 27.5%, and 0.5% v/v, respectively, was employed to extract polyphenols. The extraction protocol was followed with minor modifications, as outlined in reference [56]. 38.00 mg of the powdered material was weighed and combined with 1.5 mL of the extraction solvent. After a brief vortex mixing, the mixture was sonicated for 15 min in ice water. Subsequently, it was centrifuged for 5 min at 14 R.P.M. Finally, 1 mL of the upper liquid phase was collected and transferred for drying in a CentriVap Benchtop Vacuum Concentrator device. The dried extract was resuspended in 10% (v/v) of DMSO in double distilled water.

2.2. Total Phenolic Content

The microplate total phenolic content (TPC) assay was adapted from the 96-well microplate Folin–Ciocalteu (FC) method, initially described by Al-Duais et al. [57] and Müller et al. [58], with minor modifications [59]. Briefly, 20 μL of the diluted extract (6 mg/mL) was added to 100 μL of FC reagent (diluted at a 1:4 ratio and thoroughly mixed for 1 min) and placed in a flat-bottom 96-well microplate (NUNC, Roskilde, Denmark). This mixture was allowed to stand for 240 s, following which 75 μL of sodium carbonate solution (100 g/L) was added, and the resulting mixture was shaken at medium speed for 1 min. After incubation for 2 h at room temperature, the absorbance was measured at 750 nm utilizing the microplate reader integrated into a Thermo Scientific Multiskan GO spectrophotometer (Thermo Fisher Scientific). To obtain the TPC, the absorbance of a control reaction, utilizing water as the sample, was subtracted from the absorbance of the sample. Gallic acid solutions ranging from 10 to 200 mg/L were used as standards to create the calibration curve. Following the determination of the extract’s TPC in mg Gallic acid equivalent (GAE) per L via spectroscopy analysis (see above), the TPC concentration was further normalized by the total initial dry leaves weight used for the extraction (38 mg).

2.3. Tyrosinase Inhibition Assay

The inhibition of tyrosinase was assessed using the modified dopachrome technique [26,28], with l-3,4-dihydroxyphenylalanine (L-DOPA) as the substrate [60,61]. The experiments employed 96-Well Microtiter Microplates, with absorbance measurements conducted at 490 nm using a plate reader. The extracts were dissolved in their respective solvents and subjected to sonication to achieve a final concentration of 6 mg/mL. In each well, 40 µL of the sample having 80 µL of phosphate buffer (0.1 M, pH 6.8), 40 µL of tyrosinase (312.5 units/mL), and 40 µL of L-DOPA (5 mM). A corresponding blank well was prepared for each sample with all components except for the tyrosinase enzyme. The results were then compared with a control group that did not receive any sample extracts. Kojic acid served as the positive control in the experiment. The solution was incubated for 15 min. at 37 °C, following which the absorbance was measured at a wavelength of 492 nm using a microplate reader, specifically the Infinite 200 PRO from Tecan, Switzerland. The calculation of the percentage of tyrosinase inhibition was performed in the following manner: The equation for calculating percentage inhibition is as follows: % inhibition = (Ac − Ab) − (As − Ab) × 100% (Ac − Ab). In this context, Ac represents the absorbance value of the control reaction, which encompasses all reagents except for the sample extract. As refers to the absorbance value of the sample extract, whereas Ab represents the absorbance value of the blank.

2.4. The Half-Maximal Inhibitory Concentration-IC50

An alternative approach to characterize the potency and capability of the extract to impede the enzyme tyrosinase is using IC50 [45,62]. In our investigation, we employed the subsequent concentrations: 6, 1.5, 0.75, 0.3750, 0.1875 [mg/mL] to formulate an equation from which the IC50 value of the diverse extracts was assessed, and Kojic acid was employed as a positive control.

2.5. The Sun Protection Factor

The Sun Protection Factor (SPF) was computed following the methodology of Mansur et al. [63]. The optical density of samples was measured within the UV-B wavelength range (290–320 nm), with 5-nm increments, and three determinations were performed at each point [60]. The concentrations of the extracts were diluted from 6 mg/mL to 1.5 mg/mL due to the measurement sensitivity of the device, as the spectrophotometer apparatus cannot provide accurate readings beyond an absorption value of 3. After multiple experiments, it was concluded that the ideal concentration for evaluating all the extracts is 1.5 mg/mL.

2.6. Determination of Leaf Extract Composition Using High-Performance Liquid Chromatography (HPLC) Analysis

In this study, the composition of grapevine leaf extracts was determined using HPLC analysis [64]. The chromatographic system consists of a UV/V is detector (UV-4070), an RHPLC Pump (PU-4180), a Column oven (CO-4060), and an RHPLC Autosampler (AS-4150) Jasco Extrema. Separation was carried out on a reversed-phase Luna column with dimensions of 250 mm × 4.6 mm inner diameter, 5 μm particle size, and a 100 Å pore size (Phenomenex). The column temperature was maintained at 30 °C, with a 1.0 mL/min flow rate. The mobile phase comprised 0.05% formic acid in water (mobile phase A) and acetonitrile (mobile phase B). The separation was achieved through the application of a solvent gradient as follows: 5% (5 min), 10% (10 min), 15% (15 min), 20% (25 min), 25% (35 min), 30% (45 min), and 35% (50 min). The injection volume for the samples was set at 10 µL, and spectrophotometric detection was conducted at 280 nm, 257 nm, and 325 nm. Prior to chromatographic analysis, all samples were filtered through a 0.22 µm PTFE filter with a 13 mm diameter.

2.7. Statistical Analysis and Correlation

A two-factor analysis of variance (ANOVA) with factors interaction was performed using JMP Pro 16 statistical analysis software (SAS Institute Inc., Cary, NC, USA) to identify differences between the different groups. A Tukey’s HSD (honest significant difference) test was performed for multiple comparisons of means [65]. Data are reported as mean and standard deviation. If not stated elsewhere, each analysis was performed in triplicate, and statistical significance refers to p < 0.05. Correlation analysis was performed using the Row-Wise method [66]. The correlation is summarized as a matrix that contains the linear relationships between each pair of response (Y) variables. The values of the correlation are represented with R2. Principal component analysis (PCA) was performed using JMP Pro 16 to interpret the effects of different polyphenols in the leaf extract on the other checked parameters.

3. Results and Discussion

3.1. Characterization of Extracts from Red and White Grapevine Varieties

3.1.1. The Tested Red and White Grapevine Varieties of Israel and Europe

This study assessed the potential of extracts from 11 European and 12 Israeli grapevine varieties to treat hyperpigmentation. The tested varieties consisted of both red and white grapevines, as presented in Table 1.
Previously, polyphenols have demonstrated various pharmacological properties, including antioxidant, anti-inflammatory, and UV protection properties, making them promising candidates for treating multiple dermatological diseases [67,68]. Thus, we have used an optimized polyphenols extraction protocol to extract the polyphenols from the leaf samples [56]. The dry weights and TPC for each of the extracts are presented in Table S1. Our work is the first to evaluate the anti-hyperpigmentation potential of a large set of grape varieties. Other efforts show different concentrations of mixed red vine leaf extract (RVLE) [45], a single variety using different extraction methods [46], or a comparison between plant species [69]. In addition, our work compares European and Israeli varieties originating from domestication efforts in two areas with very different eco-geographic conditions. Also, it compares red and white varieties from both regions, in which grapes have dramatic differences in TPC.

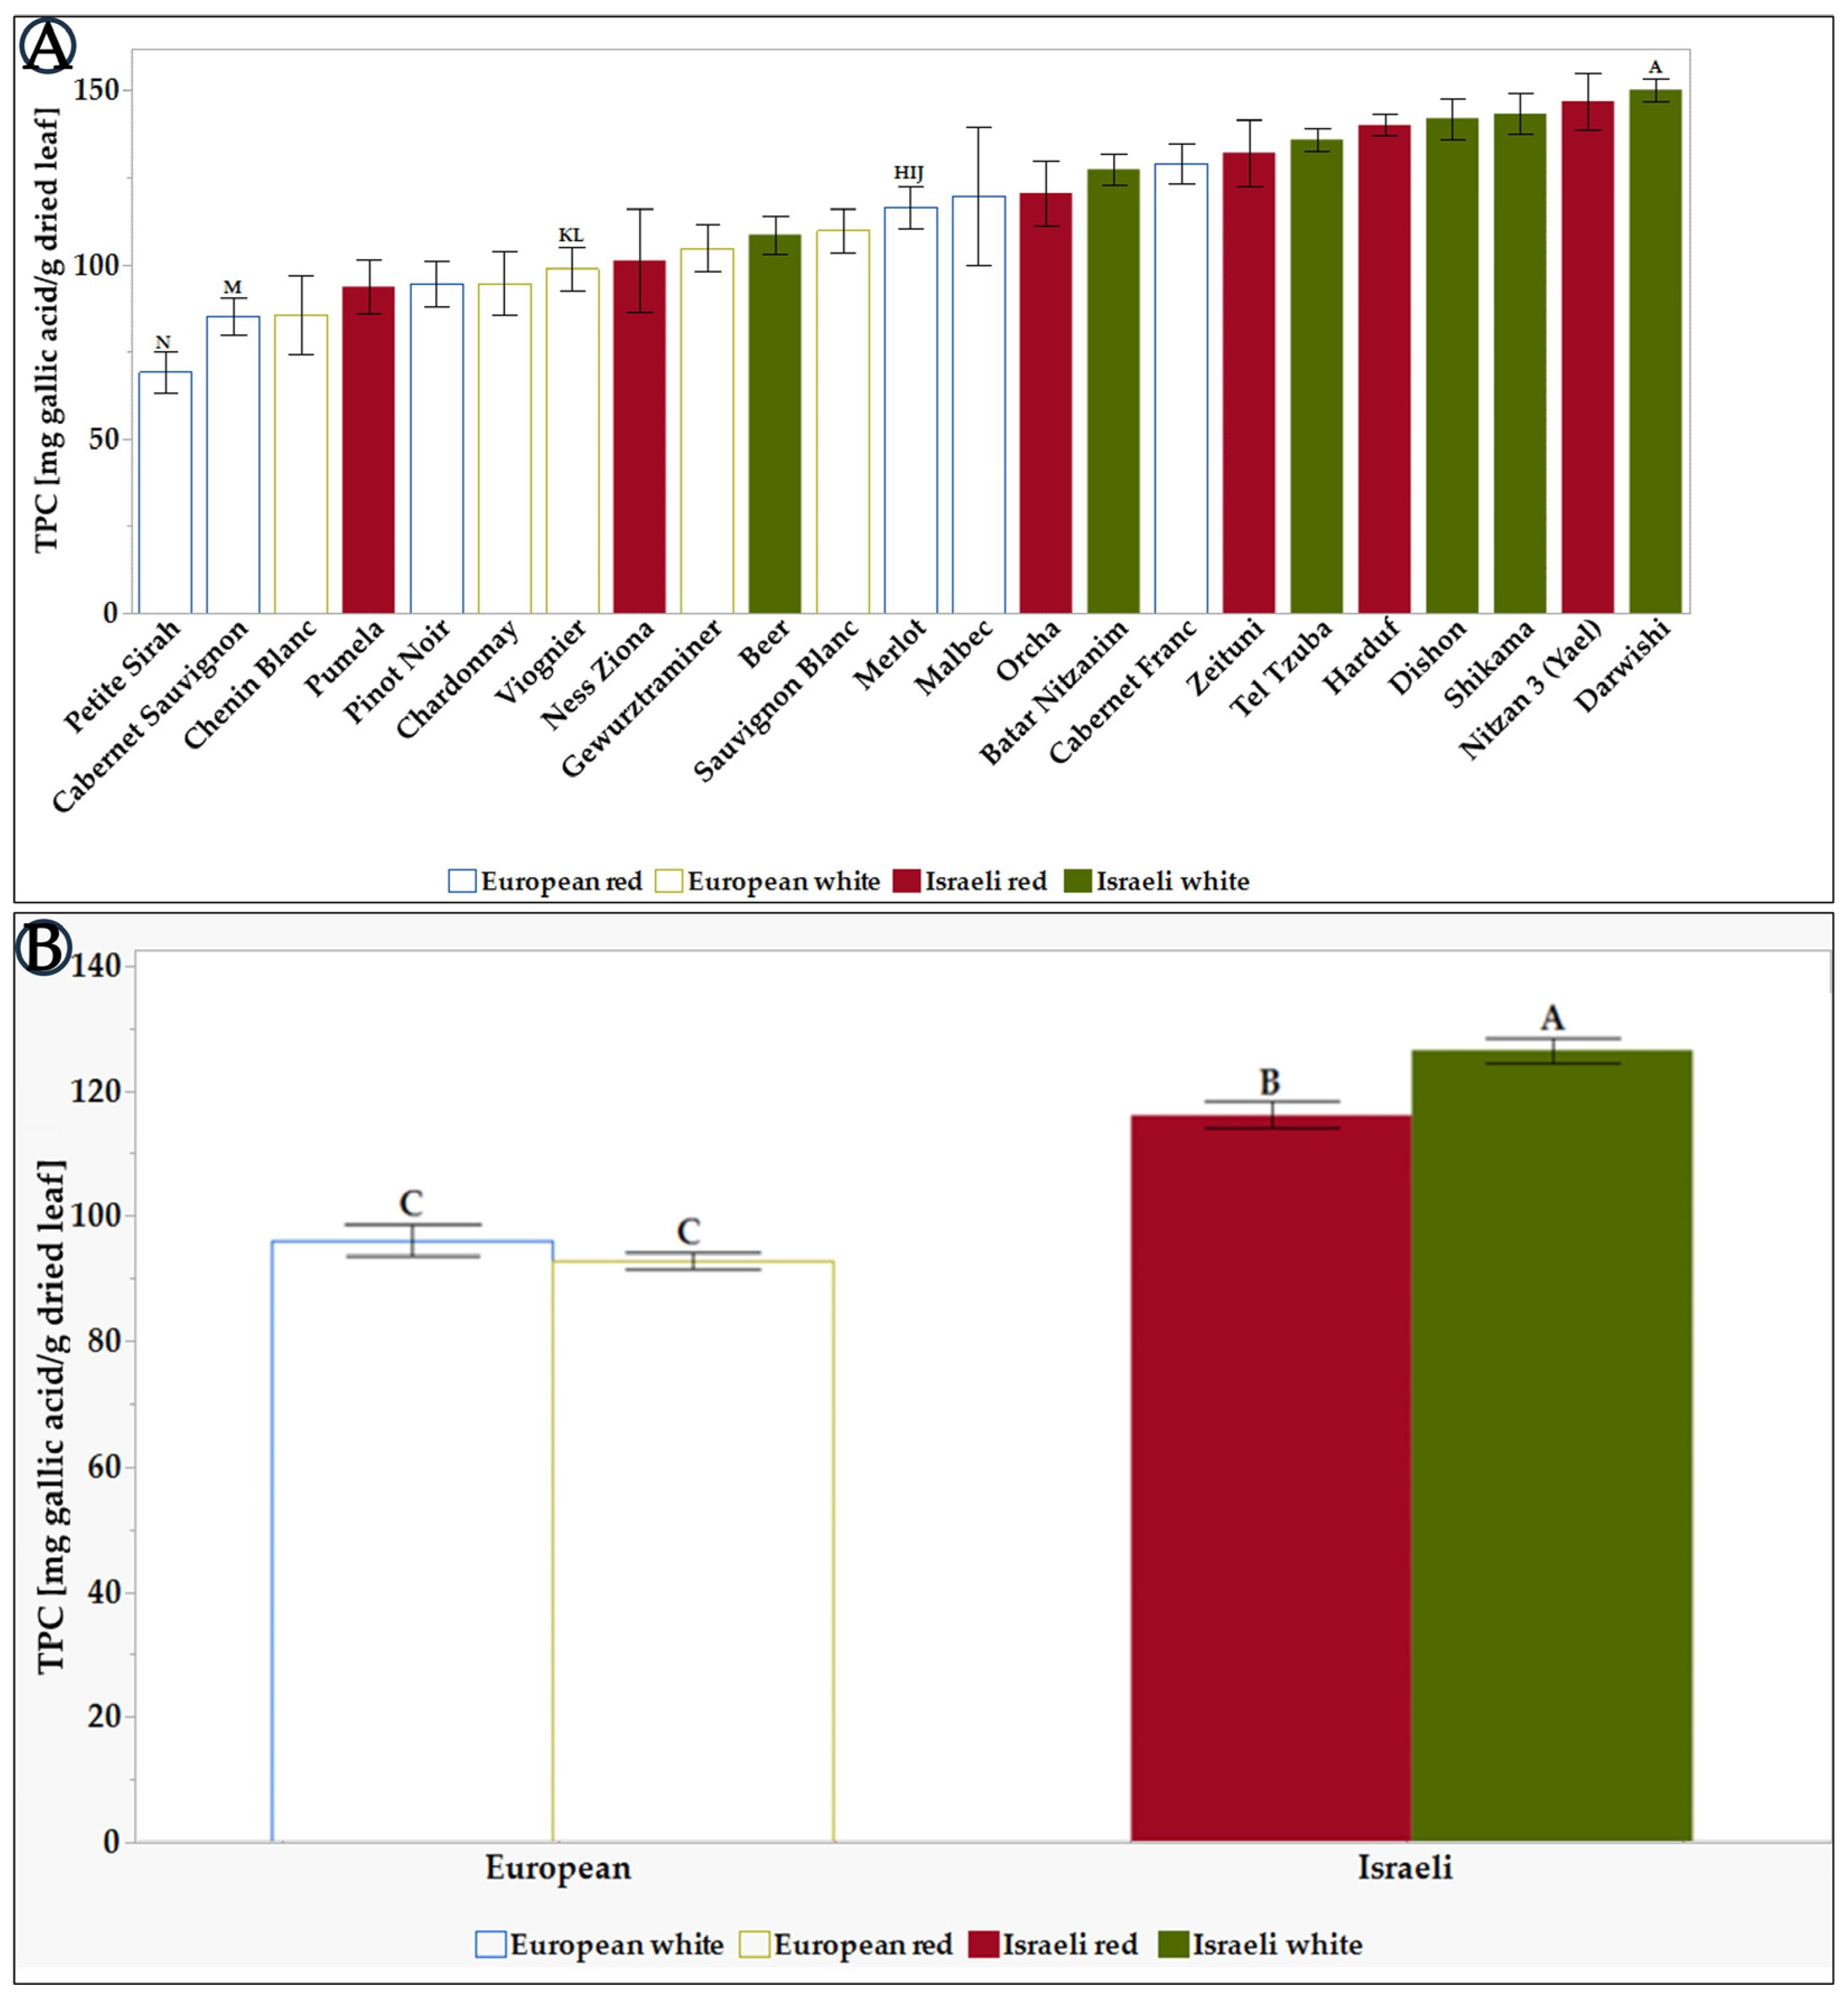
3.1.2. Assessment of Total Polyphenolic Content in Grapevine Leaf Extracts

Next, the extracts’ total polyphenolic contents (TPC) were evaluated in a 6 mg/mL extract concentration, dissolved in a solution comprising 10% (v/v) DMSO in water. The results are presented below in Figure 1.
As shown in Figure 1A, the concentration of TPC varied between the different grapevine varieties. The leaf extract of grapevine varieties Darwishi, Nitzan 3 (Yael), Shikama, Dishon, Harduf, Tel Tzuba, and Zeituni exhibited the highest TPC content (>150 mg /g dried leaf extract). In contrast, Petite Sirah, Cabernet Sauvignon, and Chenin Blanc had the lowest TPC content (<100 mg/g dried leaf extract). Comparing the TPC levels for the European and Israeli varieties shows that the Israeli varieties have a higher TPC, as seen in Figure 1B. In addition, it can be seen that in the group of European grapevines, there are no significant differences between the white and red varieties (87 vs. 90, respectively). When focusing on the Israeli varieties, there is a distinct difference between the red varieties (117) and the white varieties (124). These differences between red and white varieties could be explained by the fact that red grapevines use the phenyl propanoid pathway precursors to produce high levels of polyphenols in the fruit skin [70]. In contrast, white grapevines, producing less phenolics in the skin, may use these precursors to create polyphenols in the leaves.
When we compare the TPC levels found in this study with the data published in other works, the TPC in the Israeli varieties is relatively high. For example, Darwishi, Shikama, Dishon, Harduf, and Tel Tzuba TPCs range from 115 to 150 mg GAE/g dry leaf, while the TPC in the varieties examined in the work from Marko Anđelković [56] And from Djemaa-Landri [71] articles is between 45 and 115 mg GAE/g.

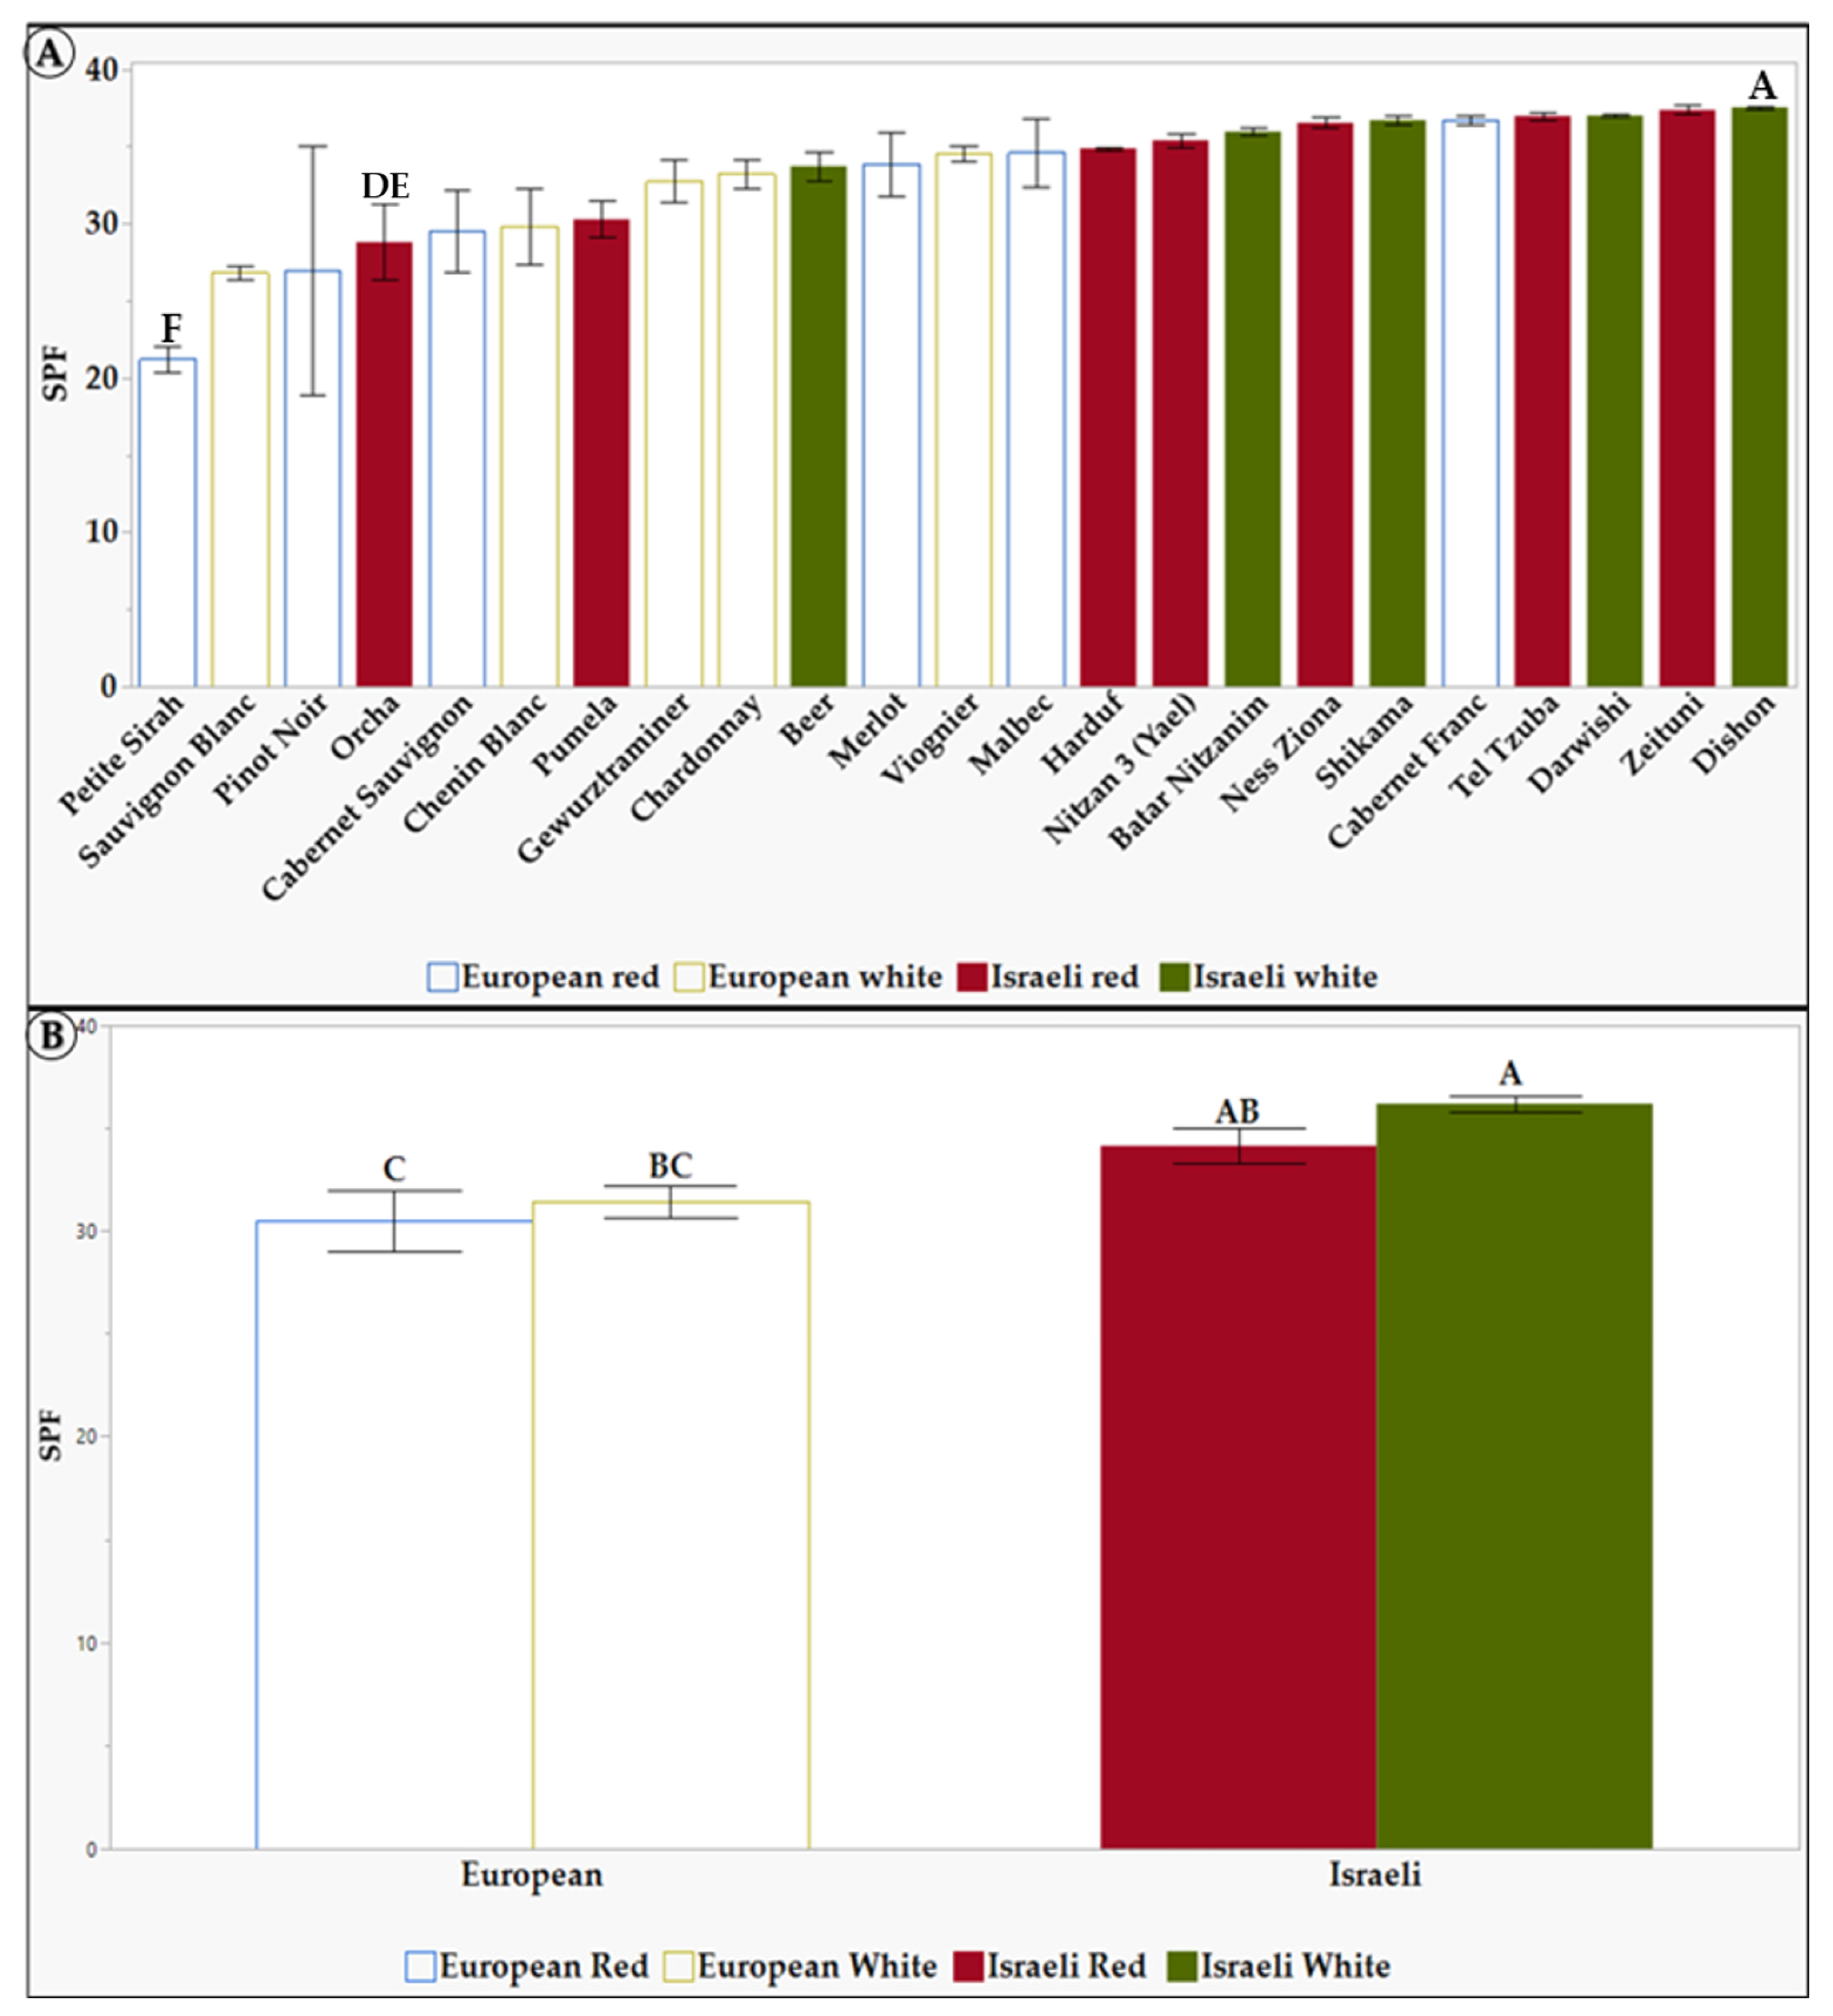
3.1.3. The Sun Protection Factor of Grapevine Leaf Extracts

As described above, SPF (unitless) plays a pivotal role in protecting the skin against the harmful effects of solar radiation. Moreover, it is essential in developing formulations for treating hyperpigmentation [35,36]. Therefore, we evaluated the SPF levels of all the tested grapevine extracts at a concentration of 1.5 mg/mL, as at higher concentrations, the absorption is above the method’s sensitivity (Figure 2).
As seen in Figure 2A, the grapevine varieties Pinot Noir, Sauvignon Blanc, and Petite Sirah have been identified with the lowest SPF levels. In contrast, the varieties Dishon, Darwishi, Tel Tzuba, and Cabernet Franc exhibited the highest SPF levels, up to 37. When comparing Israeli and European varieties (Figure 2B), there is a distinct difference between the group of white and red Israeli extracts, with an SPF level of 35, 36 (respectively), compared to the white (31) and red (30) European varieties. One explanation for the higher SPF (Figure 2) levels observed in the Israeli varieties is that these varieties were selected in the Levant, where conditions consist of exposure to higher radiation and temperatures than European varieties [72]. As a result, these environmental stressors have caused the vines to adapt and develop complex mechanisms to synthesize protective substances [72,73,74]. Lastly, since white grapevine varieties also showed higher TPC as well as higher SPF, this suggests that there may be a correlation between TPC and SPF. In this study, we obtained comparatively high values of SPF (ranging between 23 and 37), even though we used a relatively low extract concentration (1.5 mg/L). At the same time, summarizing a comparison between different plant species, a maximum SPF of 24 was found [69].

3.1.4. Determination of Leaf Extract Composition Using HPLC Analysis

HPLC analysis was performed to generate a preliminary fingerprint of each grapevine leaf extract and quantify the relative amount of each compound in all samples (see an example in Figure S1). While the extraction solution is optimized to extract phenolic compounds, it is essential to note that other biomaterials may also be present in the grapevine leaf extract and could influence the observed activity. However, for convenience throughout the article, we will assume that the specific extraction method allows us to work mainly with polyphenols.
Principal component analysis (PCA) allows us to visualize which samples have similar phenolic composition and which do not, using the entire data set of the various phenolic levels found in the extracts. In addition, it is possible to study the impact of each phenolic found in the analysis on dividing the varieties into separate groups in the PCA coordinates, as shown in Figure 3.
Figure 3A shows that the extracts of the European grapevine varieties were tightly grouped on all three PC’A. In contrast, the Israeli red and white varieties’ extract showed a more widespread nature, mainly on PC 1 and PC 3, and tended to be positioned on the right side of PC1. These results indicate that the European extracts are very similar, while those of the Israeli varieties are more polymorphic. Figure 3B shows that peaks 6, 8, 10, 12, and 22 are more pronounced in the European varieties, while peaks 4, 7, 9, 17, 19, 20, and 34 are more prominent in the Israeli ones. These distinguishable differences in the composition of the extract, based on the geographical source of the varieties, maybe the reason for the elevated activity found for the Israeli varieties.
Israeli grapevine leaf extracts may have a higher TPC and a more comprehensive range of compounds due to their evolutionary need to adapt to challenging abiotic factors such as radiation and heat. This could lead to increased TPC production (Figure 3) and improved SPF (Figure 2). Previous studies have shown that the phenolic content of grapevine leaves varies depending on the grapevine variety and geographical origin [75,76,77,78]. This is likely due to a combination of genetic and environmental factors. For example, some grape varieties are naturally higher in phenolic compounds than others, and different environmental conditions, such as soil type, climate, and viticultural practices, can also affect the phenolic content of grapevine leaves [75,76,77,78]. Phytochemicals and natural extracts rich in polyphenols effectively treat hyperpigmentation disorders such as melasma [9,15,68]. Polyphenols have many cellular actions that effectively treat hyperpigmentation [9,15,68]. Therefore, an extract with a higher TPC and a more comprehensive range of compounds may be more favorable for treating hyperpigmentation. As we showed, the geographic origin of grapevine varieties significantly influences the composition of their leaf extracts. This is supported by a study by Pantelić et al. [78], which analyzed the phenolic content, radical scavenging activity, and mineral composition of grape leaves from diverse grapevine varieties. In the study, PCA revealed a clear separation between grape leaves from different geographical regions, suggesting that environmental and genetic factors influence grape leaf chemical composition [78].

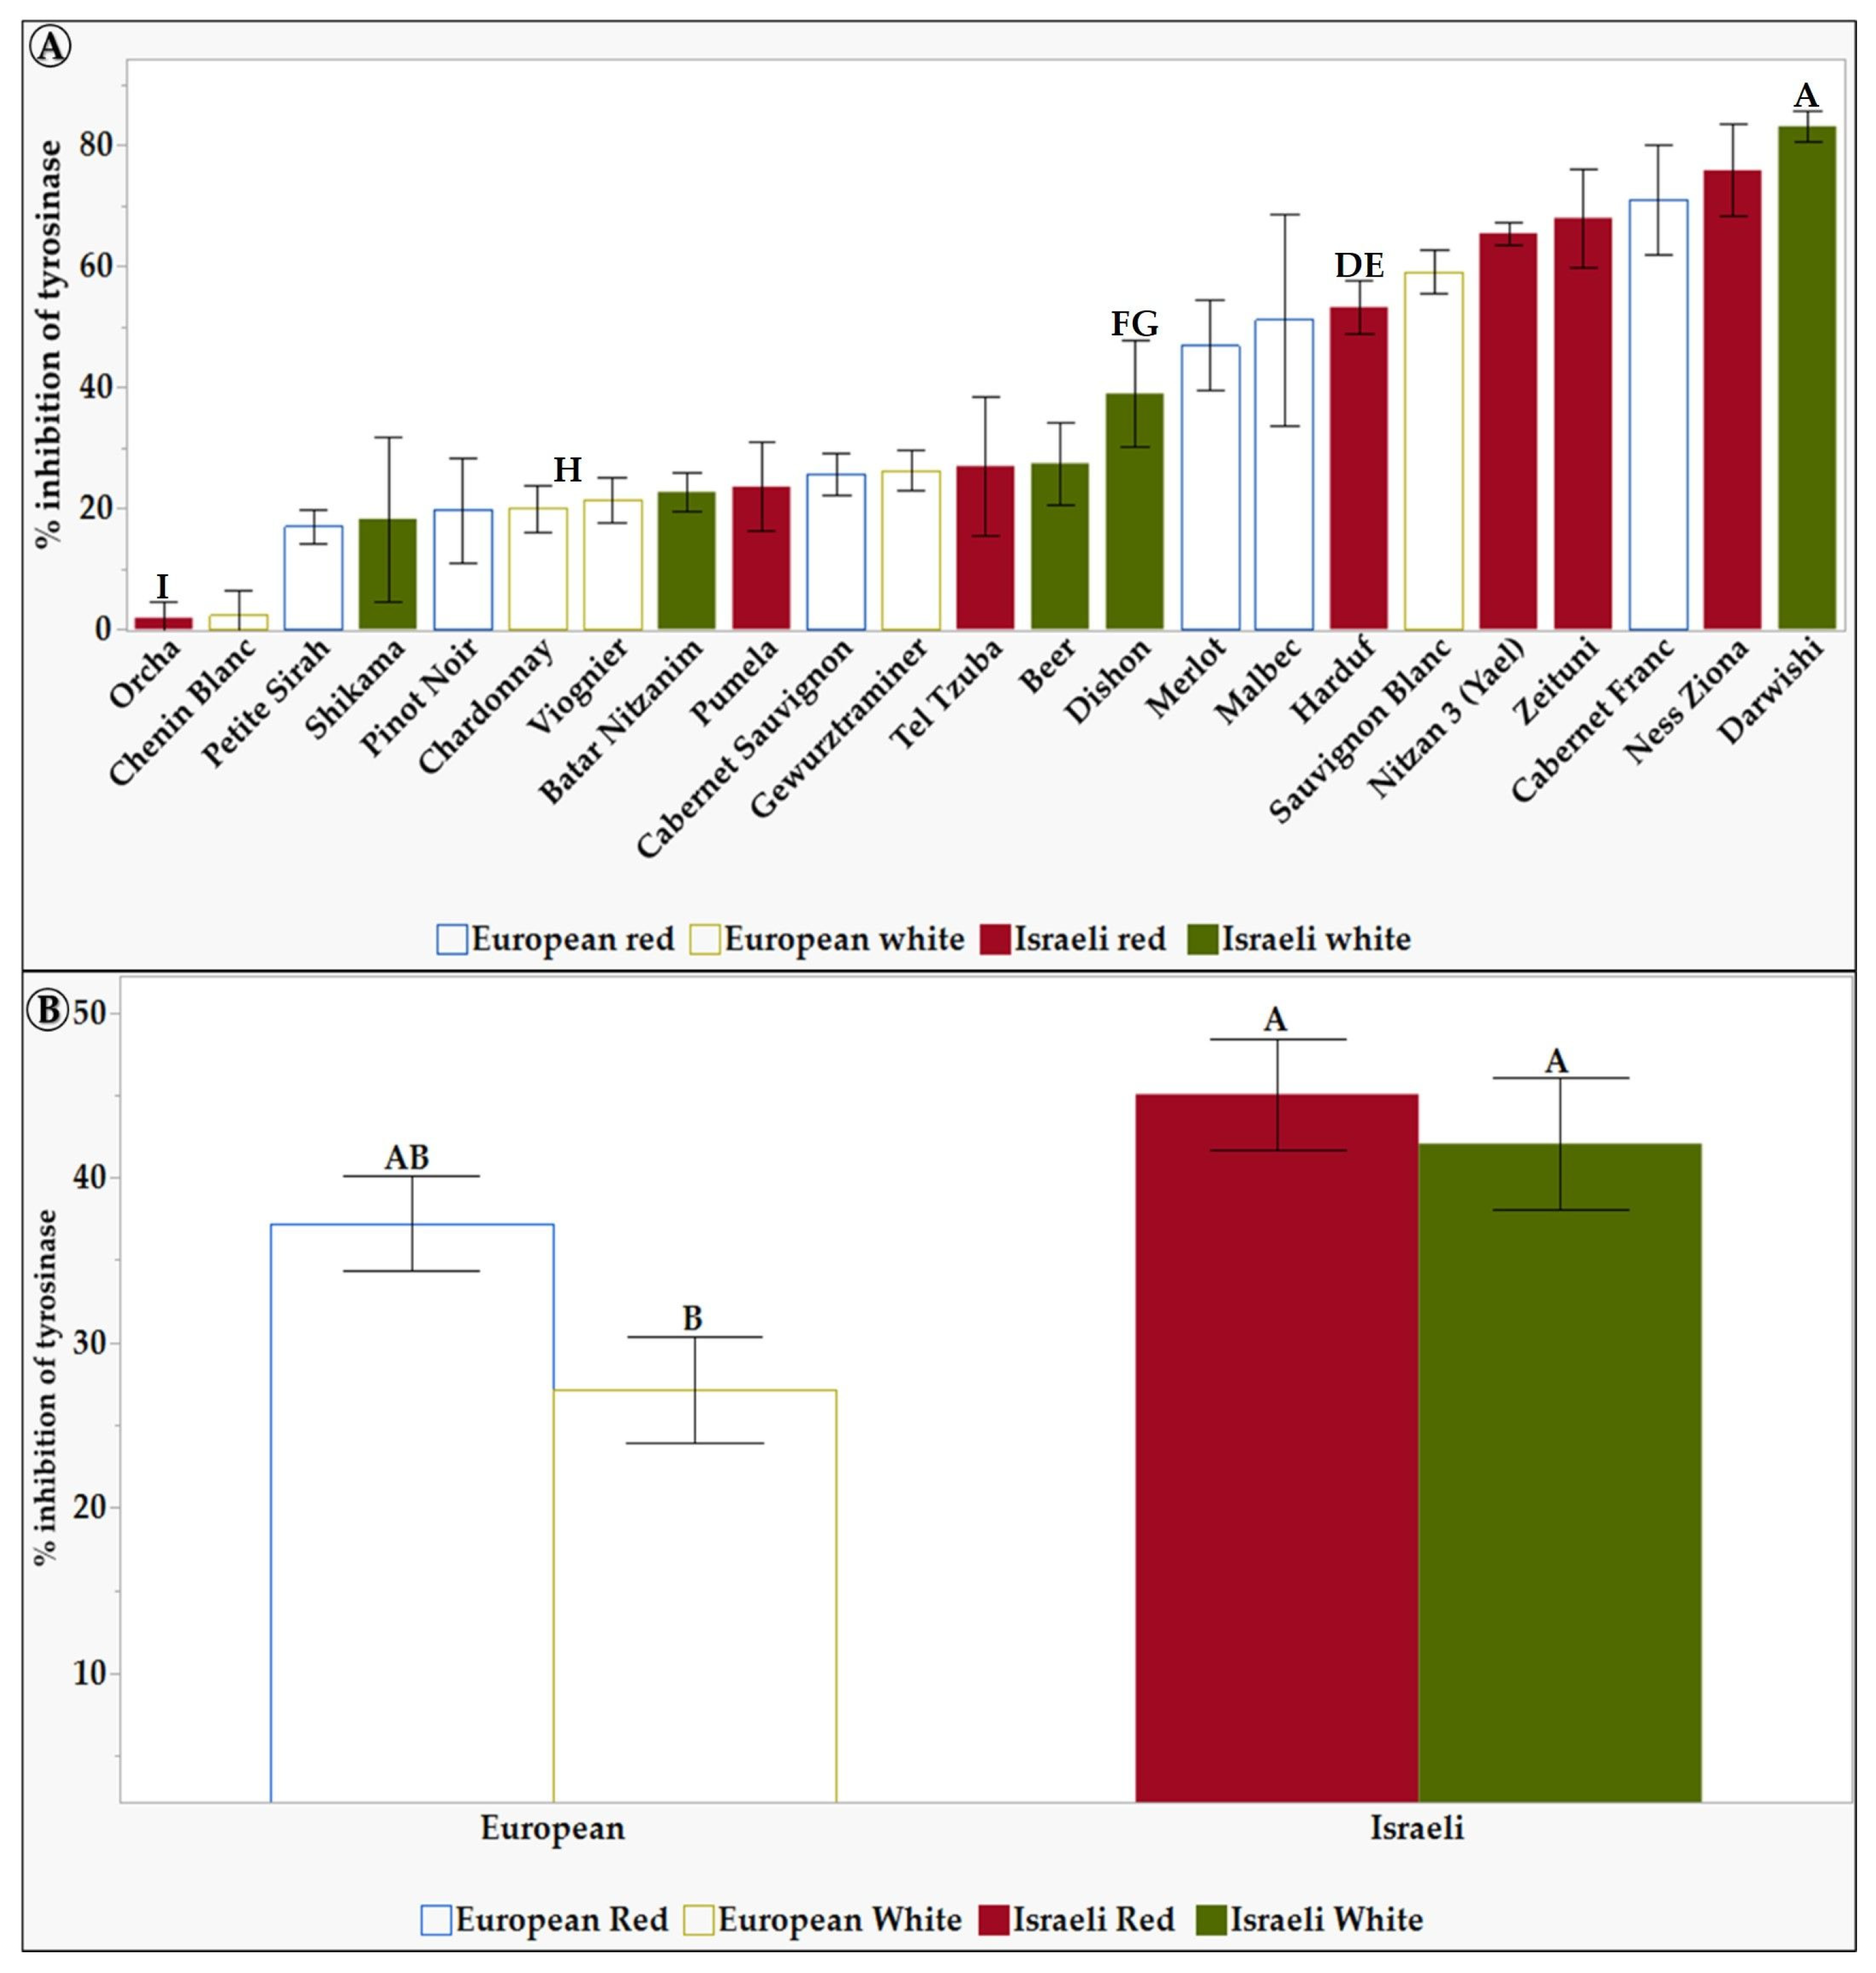
3.1.5. Tyrosinase Inhibitory Effect of Grapevine Leaf Extracts

Tyrosinase is a crucial enzyme in melanin production responsible for skin pigmentation. To assess the tyrosinase inhibitory effect of the grapevine leaf extracts, we measured the percentage of reduction in tyrosinase-mediated degradation of the substance L-dopa in the presence of the various leaf extracts (Figure 4).
Figure 4A shows a significant difference in the tyrosinase inhibitory effect between some grapevine vareties leaf extracts. The Israeli varieties Darwishi, Nitzan 3, and Ness Ziona showed a high tyrosinase inhibition effect of 83%, 76%, and 73%, respectively. In contrast, Chenin Blanc and Orcha varieties showed the lowest inhibition effect of 2.2% and 1.8%, respectively. Figure 4B shows that, in general, Israeli grapevine varieties exhibited a statitically significant higher tyrosinase inhibitory effect compared to the European white grapevine varieties, exhibiting the lowest inhibition effect of 27%. This suggests that Israeli grapevine varieties may be a better source of tyrosinase inhibitors for cosmetic products. Tyrosinase inhibitors are used to lighten the skin and reduce hyperpigmentation. Thus—and due to the higher SPF levels—these results suggest that Israeli grapevine leaf extracts could help cosmetic formulators create effective and natural products to treat hyperpigmentation.

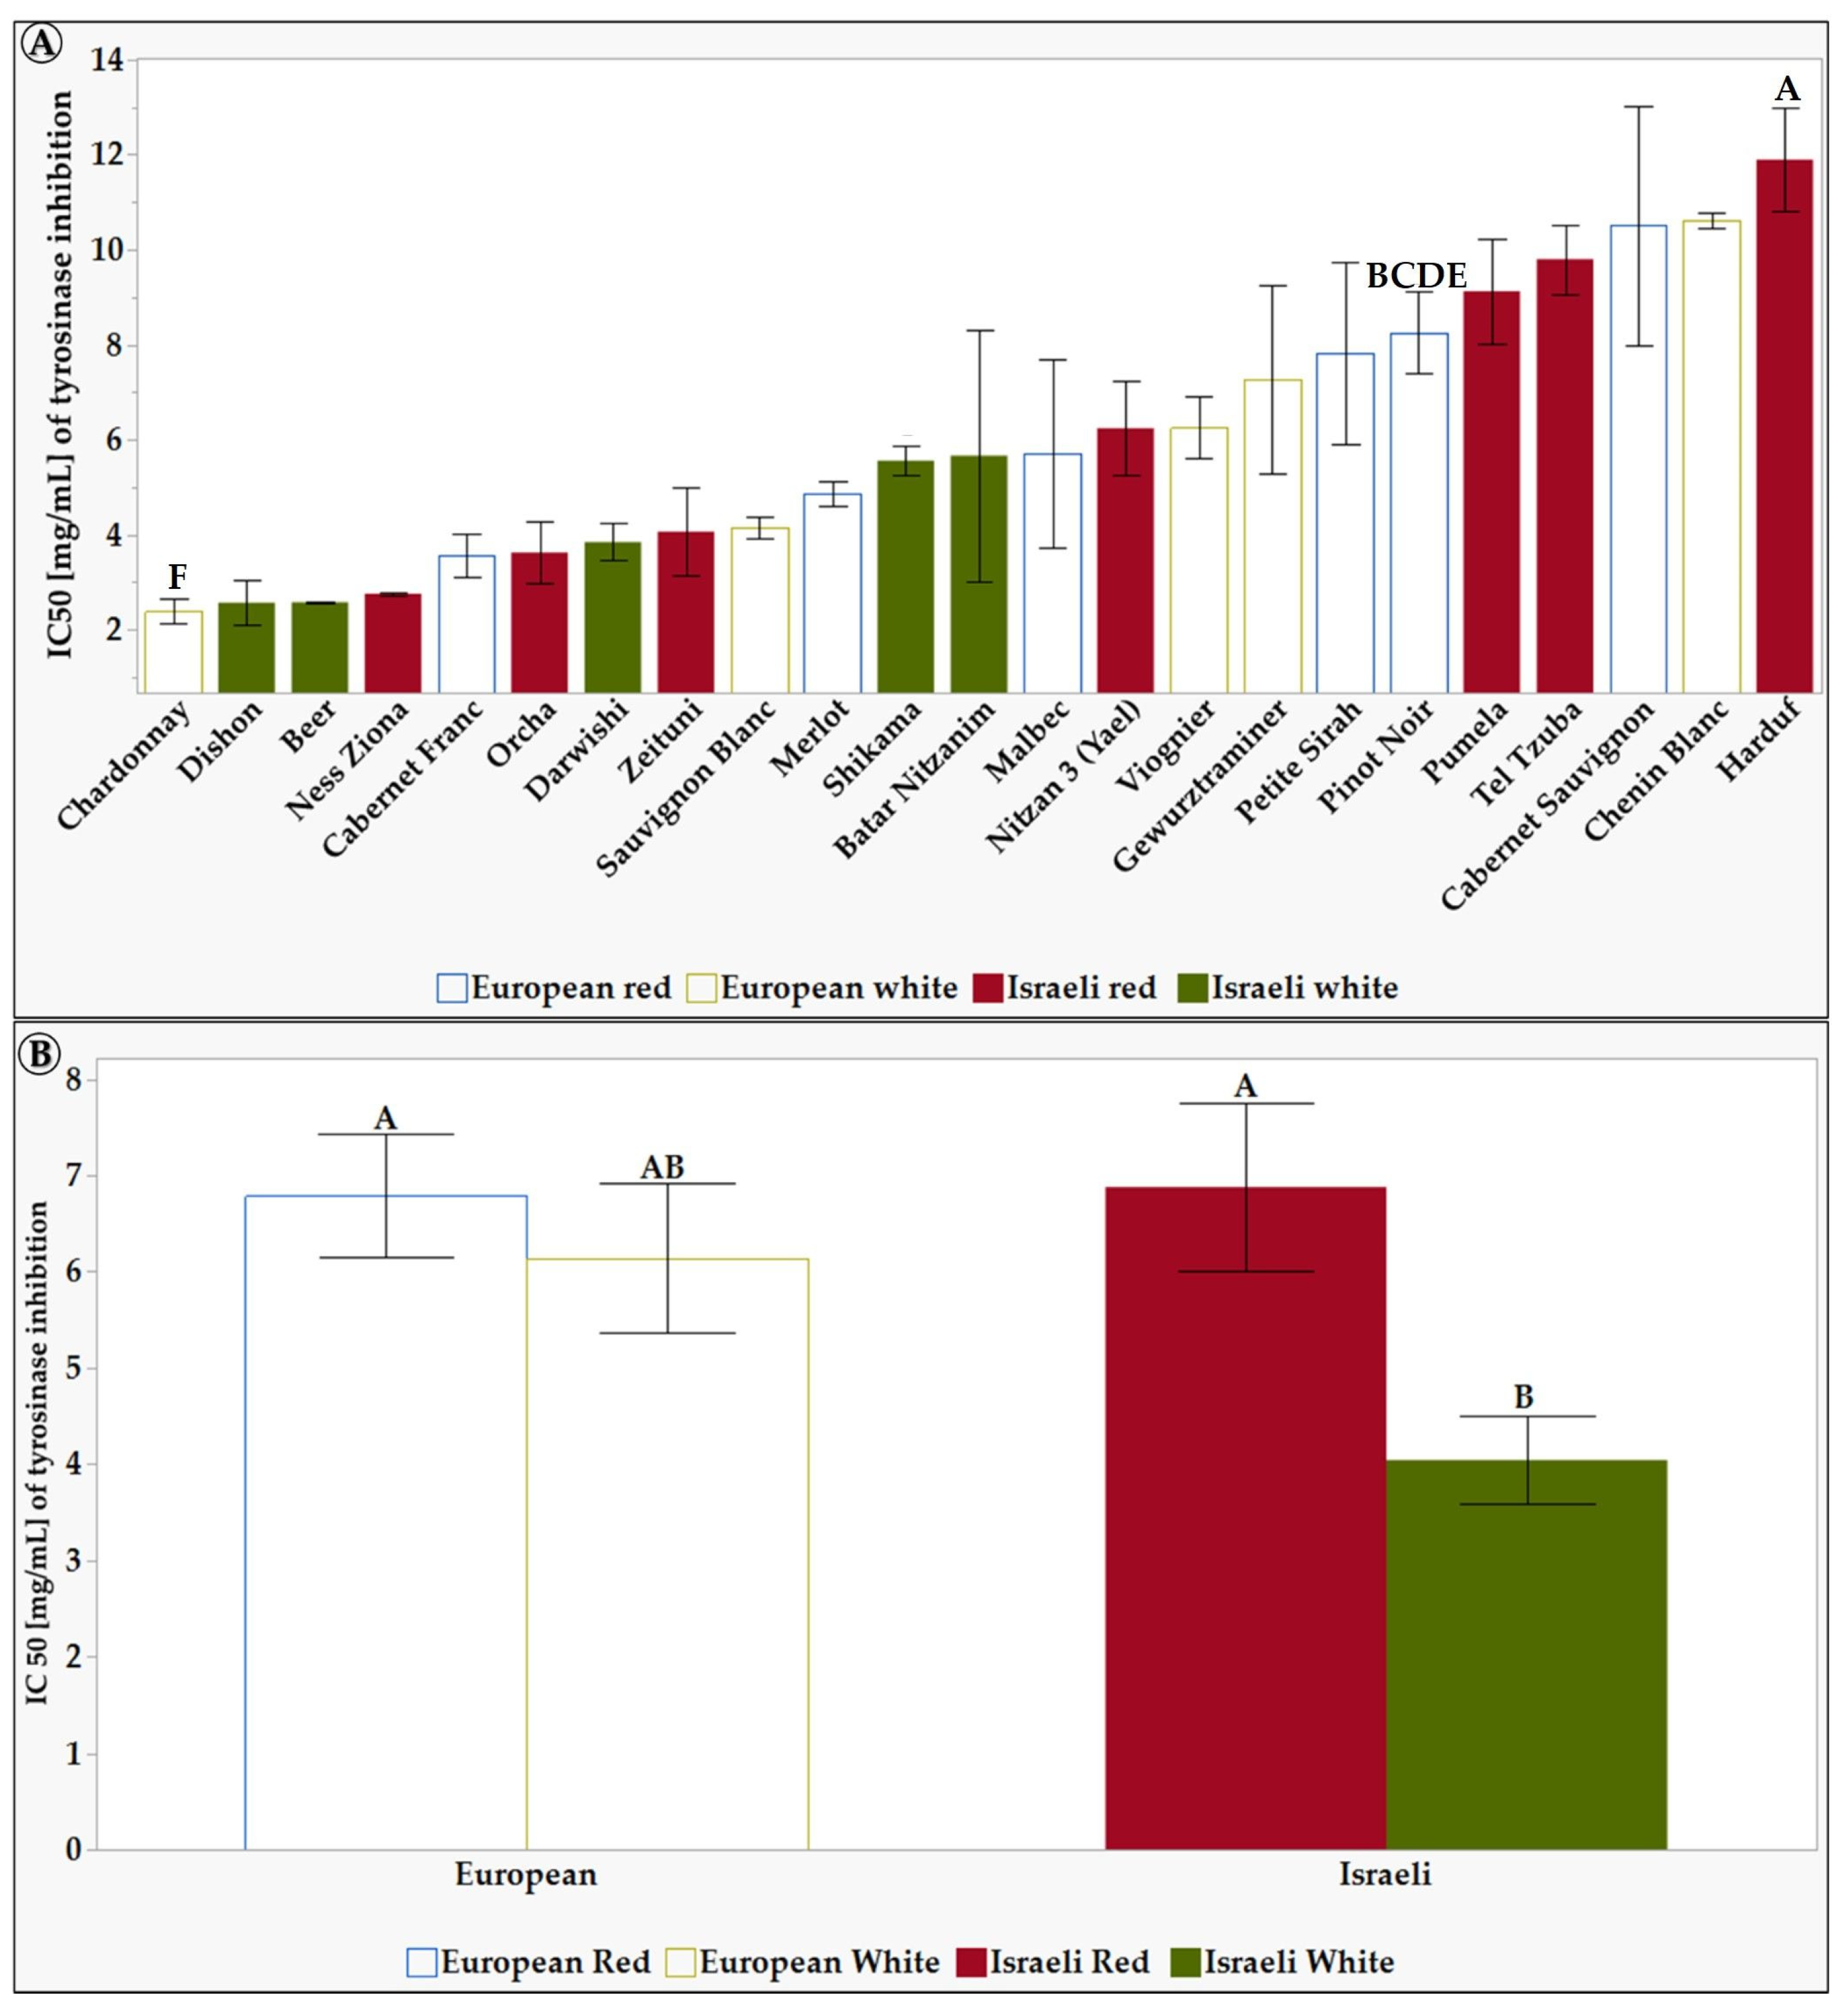
3.1.6. Analysis of the IC50 of Grapevine Leaf Extracts on Tyrosinase Activity

The IC50 is used to quantify the efficacy/potency of an inhibitor. The IC50 is defined as the inhibitor concentration required to inhibit an enzyme’s activity by 50% [79,80]. The lower the IC50 value, the more potent the inhibitor is. The calculated IC50 values of the tested grapevine leaf extracts are presented in Figure 5.
As seen in Figure 5A, the grapevine variety Chenin Blanc had a very high IC50 value of 10.6 mg/mL, indicating that it is a weak tyrosinase inhibitor. In contrast, Beer and Chardonnay grapevine varieties had low IC50 values (2.6 mg/mL and 2.4 mg/mL), indicating they are potent tyrosinase inhibitors. Figure 5B shows that, on average, the white Israeli grapevine varieties have a lower IC50 than the European and Israeli red grapevine varieties and European white grapevine varieties. This means that the white Israeli grapevine varieties are more potent tyrosinase inhibitors. Tyrosinase inhibitors have been studied for their potential in treating hyperpigmentation. Several compounds, including natural and synthetic phenolic compounds, have been identified as effective tyrosinase inhibitors [34]. These inhibitors have shown promising results in reducing melanin content in the skin and inhibiting tyrosinase activity [81].
Our findings indicate that the Israeli white grapevine varieties displayed a more significant tyrosinase inhibitory potential than the European red and white grapevine varieties and Israeli red grapevine varieties (Figure 4) and possessed a potent extract capable of achieving a 50% reduction in enzyme activity at low concentrations (Figure 5). Each group of varieties has a different effect on the enzyme tyrosinase. In addition, it seems that the Israeli varieties both have a higher tyrosinase inhibitory capacity than the European varieties (Figure 4) and also have a potent extract that, in its low concentration, manages to inhibit enzyme activity (IC50) by 50% (Figure 5).
Darwishi and Ness Ziona varieties exhibit the highest tyrosinase inhibition activity (over 75%) compared to Orcha and Chenin Blanc (Figure 4A). Higher TPC contributes to the efficacy of treatments for skin conditions like hyperpigmentation. Polyphenols also have antioxidant and anti-inflammatory effects. They can balance the cell cycle, induce apoptosis, and have various other effects on skin melanoma, making them potential chemopreventive agents for skin cancer [82]. Additionally, polyphenols have been proposed as effective functional ingredients for anti-aging properties and have been shown to protect the skin and mitigate inflammatory conditions [82,83]. Therefore, the higher TPC content of grapevine leaf extract can be utilized in treatments for skin conditions like hyperpigmentation and may enhance their effectiveness due to the antioxidant, anti-inflammatory, and other beneficial properties of polyphenols. For example, Darwishi has the highest TPC and is also the most potent tyrosinase inhibitor, while Chenin Blanc has a lower TPC and is less effective in inhibiting tyrosinase. On the other hand, Ness Ziona is a potent tyrosinase inhibitor with moderate TPC. Interestingly, upon closer examination of the number of peaks derived from HPLC analysis (Table S6), Ness Ziona exhibits the maximal number of polyphenols, indicating the presence of a diverse range of polyphenolics. Consequently, one of the polyphenols within the Ness Ziona leaf extract may possess significant tyrosinase inhibitory properties, or a combination of the polyphenols within Ness Ziona may exert a synergistic effect on tyrosinase activity. Similarly, Orcha is ineffective in inhibiting tyrosinase activity, even though its TPC is moderate. However, it is noteworthy that Orcha has a lower variety of polyphenols than Ness Ziona. Only two works were found in the literature dealing with the tyrosinase enzyme activity of grape leaves [45,46], both showing a maximal tyrosinase inhibition of 50%. In contrast, in this work, some varieties show up to 83% inhibition.

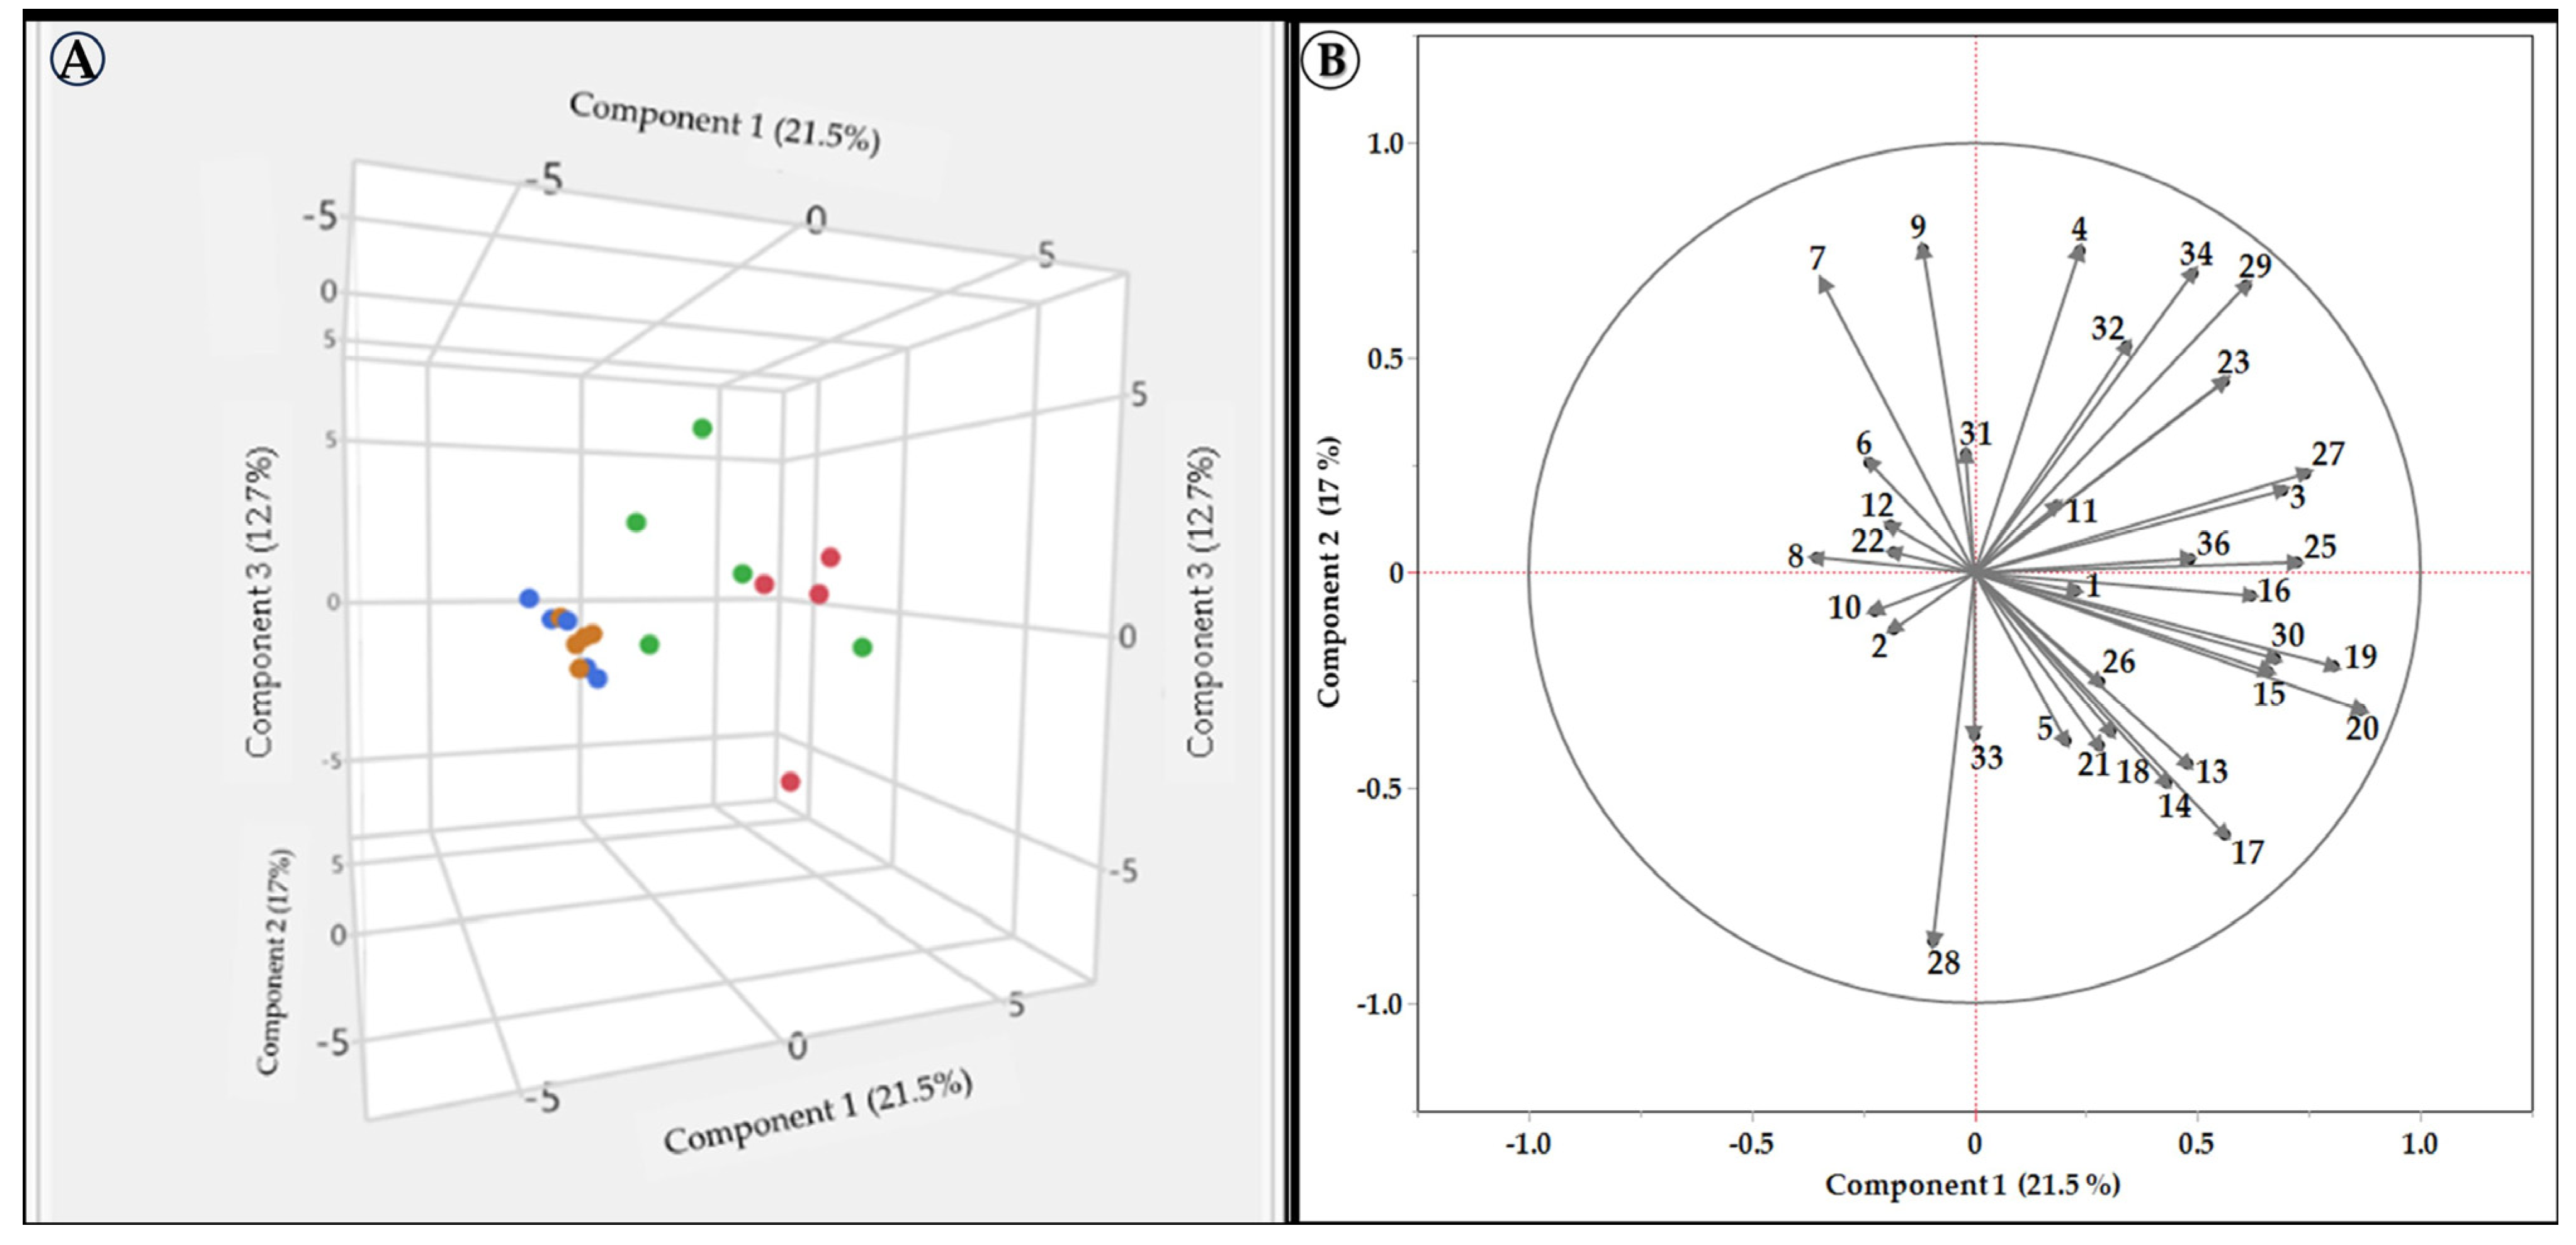
3.2. Correlations and Comparison between the Different Groups

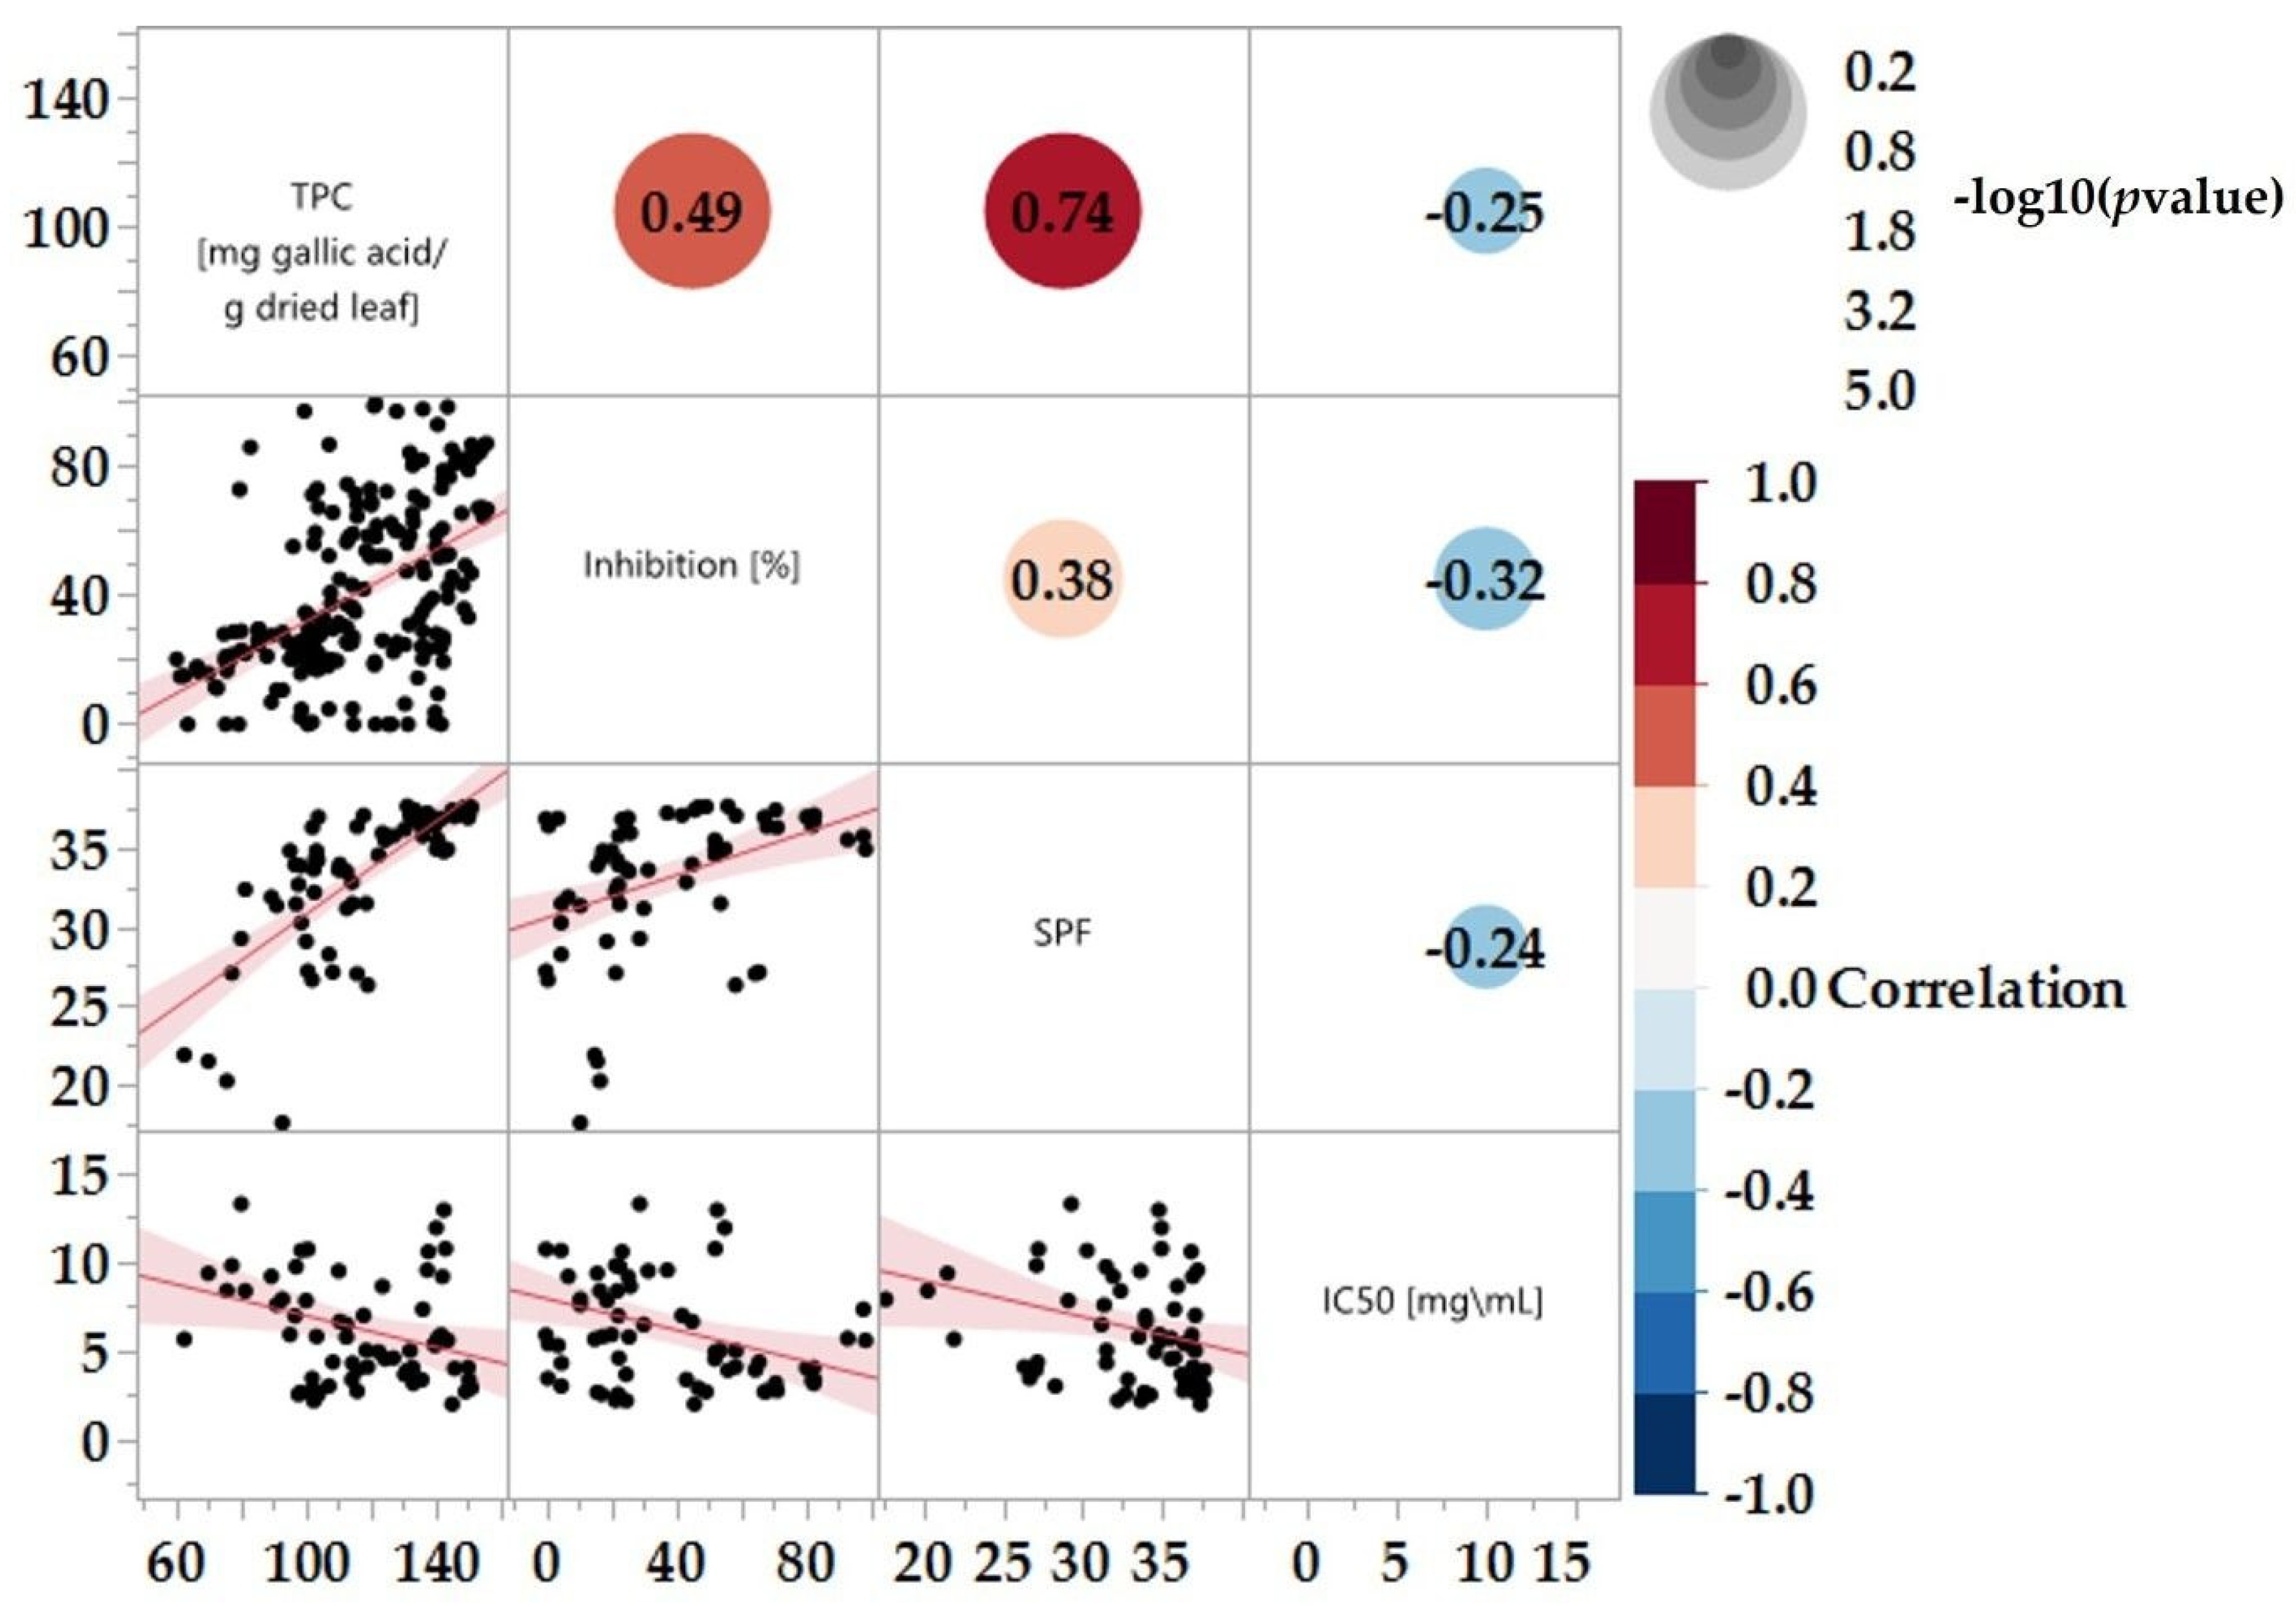
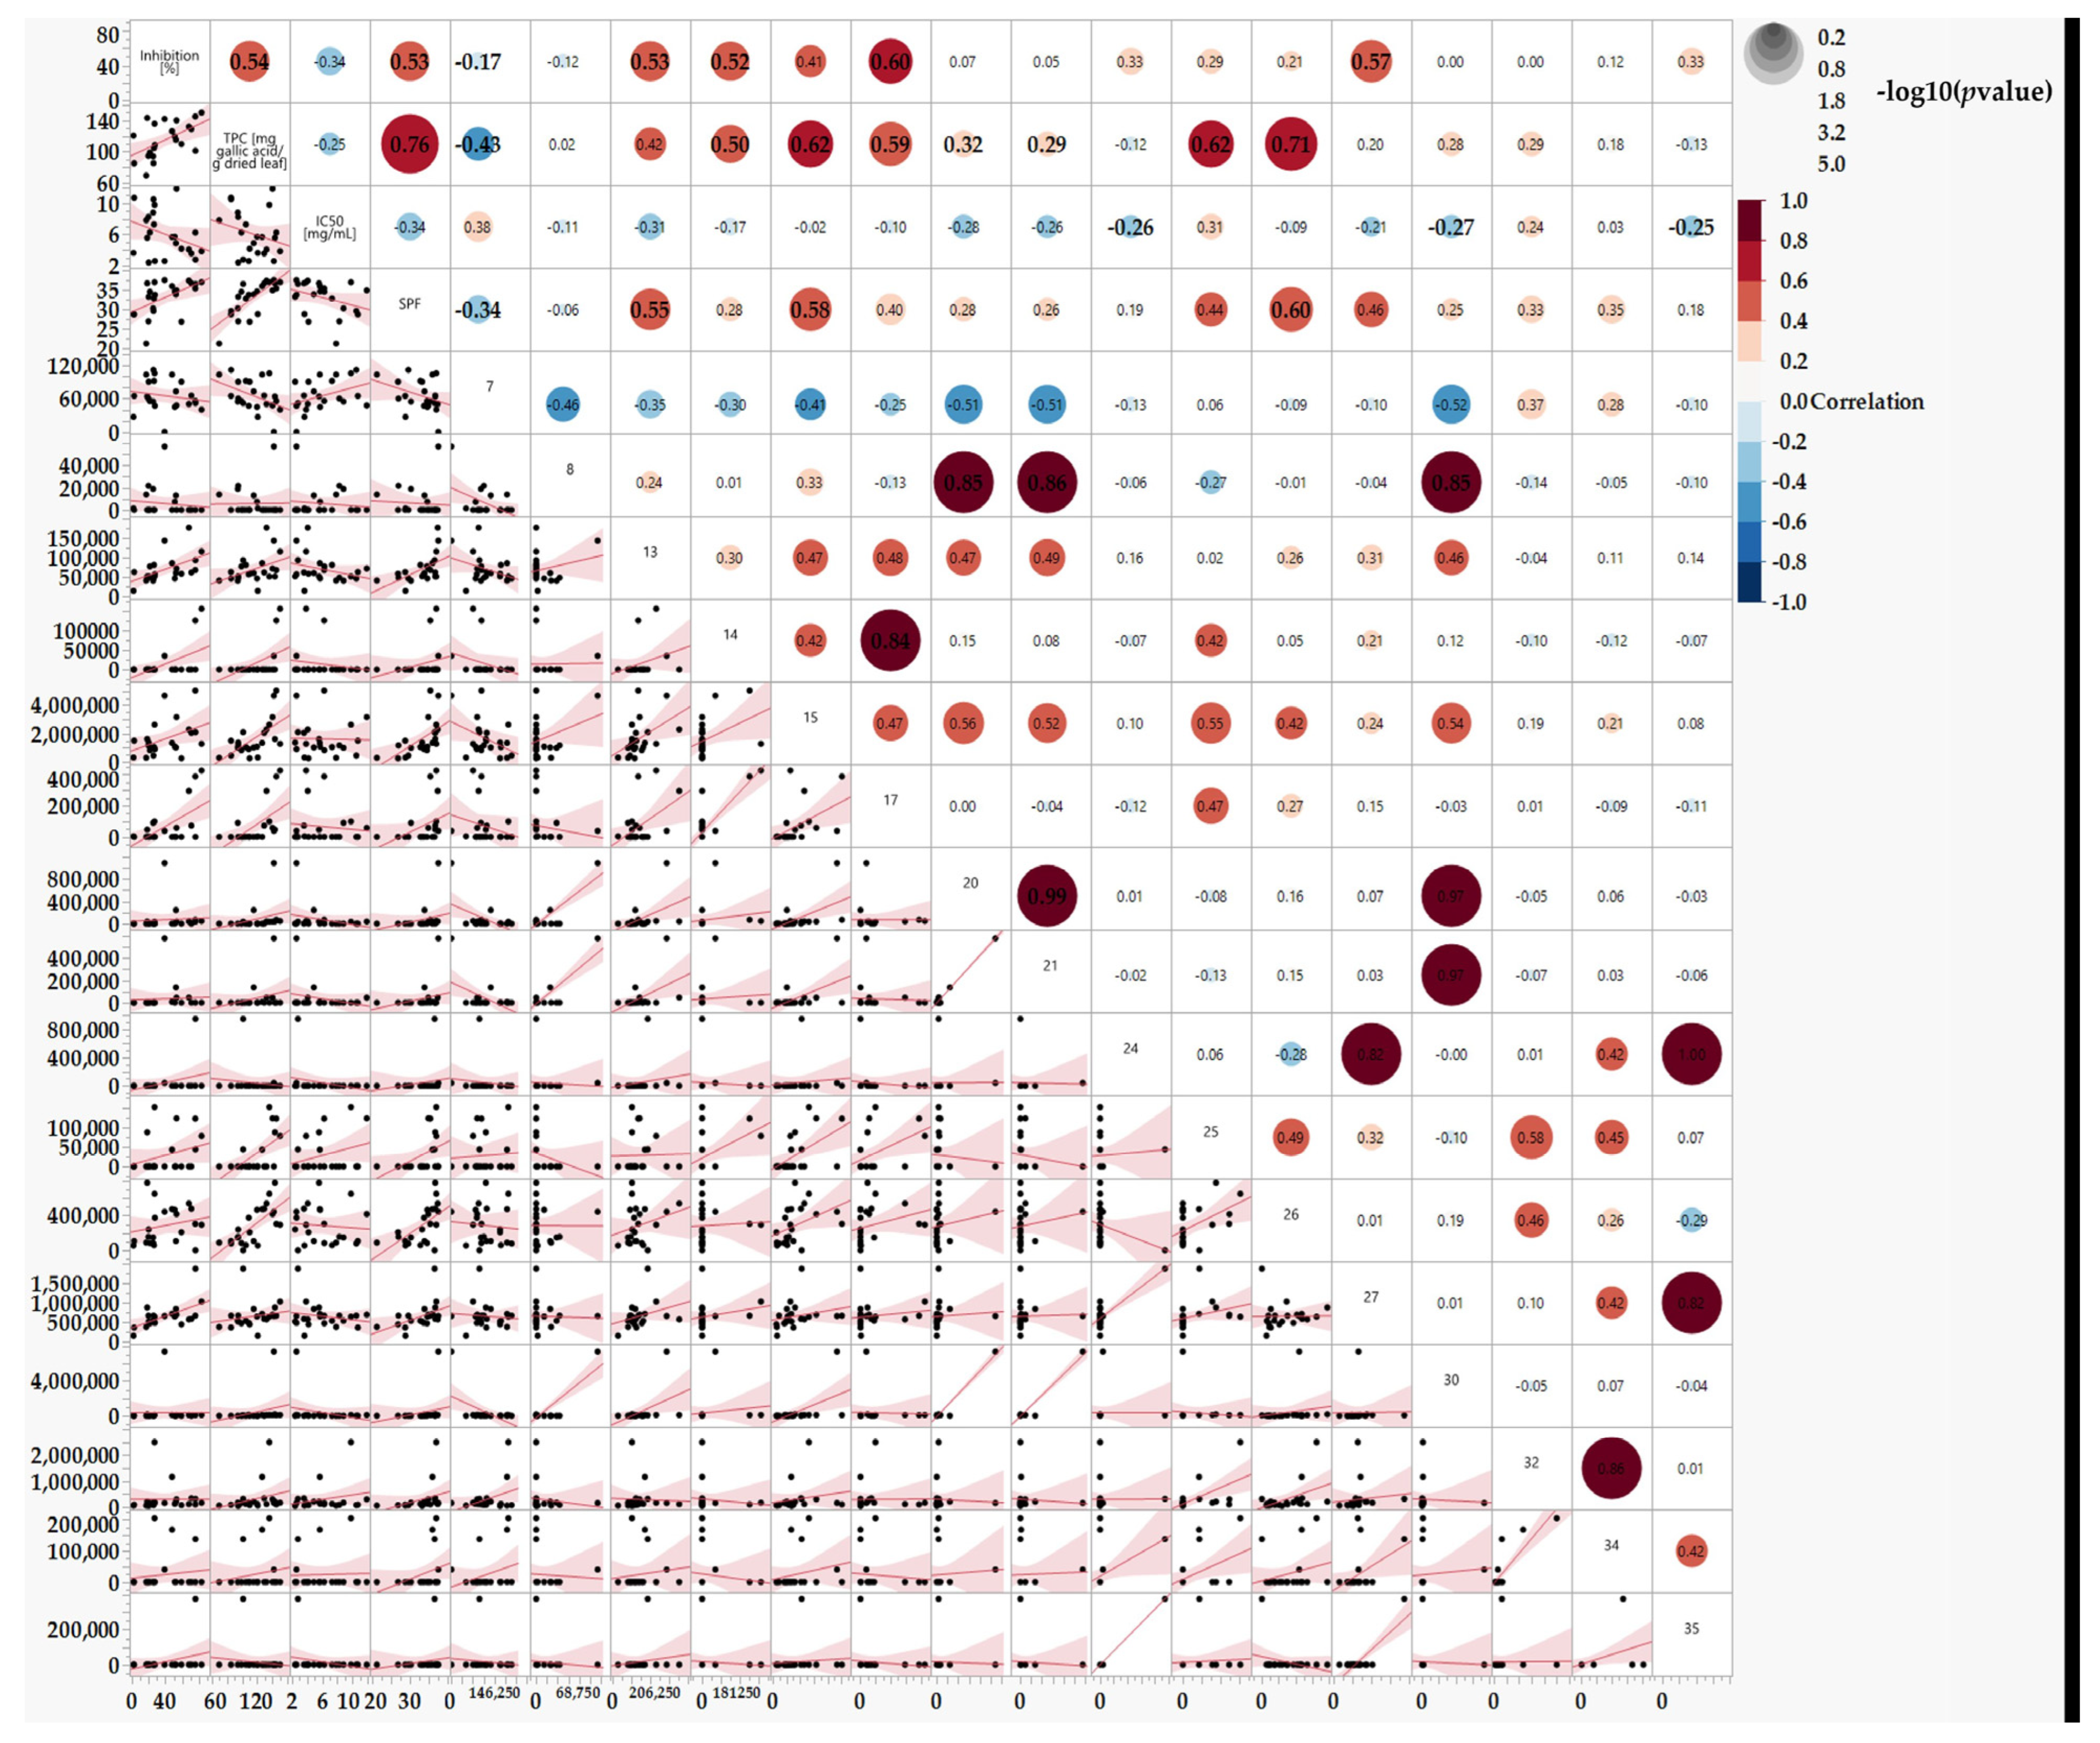
3.2.1. Correlations between TPC, SPF, % Inhibition, and the IC50 of All Grapevine Varieties

As shown and discussed, the various extracts offer a wide array of SPF, TPC, and tyrosinase enzyme inhibitory effects. A correlation matrix was produced to study the correlations between these factors, as shown in Figure 6.
A notably strong correlation between TPC and SPF is evident, with a coefficient of 0.74 (Figure 6). This strong correlation can be attributed to the well-established fact that polyphenols can absorb ultraviolet (UV) radiation [67]. As TPC increases, so does SPF. However, a weaker correlation was observed between TPC and tyrosinase inhibition, resulting in a coefficient of 0.49. This observation underscores the importance of not solely relying on TPC as a predictive indicator for enzyme inhibition. It is essential to consider the specific polyphenolic components that might be involved in the tyrosinase inhibition process. The Pearson correlation coefficient (r) for all three correlations were relatively low (Figure 6), indicating a limited adherence to linearity. This lack of strong linear correlation may be due to specific polyphenolic compounds influencing the extract’s effectiveness.

3.2.2. Comparison of Israeli and European Grapevine Varieties: Initial HPLC Results, TPC, SPF, % Tyrosinase Inhibition, and IC50

In this section, we used the results of the specific peak areas for each peak acquired from the HPLC analysis. We established a correlation matrix between the detected HPLC peaks and the tested factors: TPC, SPF, % Inhibition, and the IC50 (Figure 7).
Figure 7 shows interesting correlations between the identified peaks (representing polyphenols) and their bioeffects. For example, peak 17 strongly correlates with TPC and the tyrosinase enzyme inhibition effect. Therefore, peak 17 emerges as a promising candidate for further investigation as an active substance in the next phase of the study. Moreover, Combining several peaks could lead to synergistic activity and an extract with an efficient and good effect, such as combining peaks 15 and 17. Conversely, peak 7 appears to yield undesired results. Thus, we plan to investigate the effect of fractions excluding such peaks.

4. Conclusions

This study examined a large number of Israeli and European grapevine leaf extracts for their ability to improve or treat the skin disease hyperpigmentation. Several interesting conclusions can be drawn. White grapevine varieties have more polyphenols in their leaves compared to red varieties. This is likely because red grapevine varieties deposit most of their phenolic compounds in their fruit rather than their leaves. There is no strong correlation between TPC and tyrosinase inhibition. This suggests that specific polyphenolic compounds may be more important than the overall TPC of an extract in determining its efficacy against hyperpigmentation. Israeli grapevine varieties are more effective and active than European grapevine varieties in all categories tested. This suggests that Israeli grapevine leaves are a promising source of active ingredients for cosmetic products targeting hyperpigmentation, possibly due to their domestication in the harsh Levan climate. Overall, this study highlights the potential of Israeli grapevine leaves as a source of active ingredients for cosmetic products targeting hyperpigmentation. Further research is needed to identify and characterize the specific polyphenolic compounds responsible for the anti-hyperpigmentation activity of grapevine extracts. In the next phase of our investigation, we plan to fractionate the samples and subject them to various testing methods for a more in-depth analysis. From this correlation, we can understand that the TPC analysis may not be a reliable predictor of the extract activity, but rather the levels of specific polyphenols; this data allows us to continue working and identify the materials and separation into fractions.

Supplementary Materials

The following supporting information can be downloaded at: https://www.mdpi.com/article/10.3390/cosmetics11010002/s1, Table S1: Total normalized polyphenol content and the dry weight yield of L. extracts (following the drying of 1 mL) for each of the tested varieties; Table S2: The Tukey-Kramer test statistically different groups of the mean TPC (in mg GAE per gram dried leaf weight) of the tested grape L. extracts; Table S3: The Tukey-Kramer test statistically different groups of the mean sun protection factor values of wild, Israeli, and European grape L. extracts. Table S4: The Tukey-Kramer test statistically different groups of the mean percentage level of tyrosinase inhibition of the various in the tested varieties’ leaf extracts. Table S5: The Tukey-Kramer test statistically different groups of tyrosinase enzyme’s mean IC50 (mg/mL) in the tested varieties’ extracts. Figure S1: HPLC chromatogram. Table S6: The specific number of peaks detected in the HPLC chromatogram analysis of each of the tested grape L. extracts.

Author Contributions

Conceptualization: E.D., S.S. and A.A.; methodology: S.S. formal analysis: S.S., E.D. and A.A. resources and funding acquisition: E.D. and A.A.; data curation: S.S. and A.A.; writing—original draft: S.S., E.D., A.A. and M.M.K.D, writing—review and editing: all authors; supervision and project administration: E.D. and A.A. All authors have read and agreed to the published version of the manuscript.

Funding

This research was conducted with the generous support of the Eastern R&D Center; Ariel; Israel; and the generous support of the Israeli MOST and Ministry of Agriculture Israel (Funding no. 31010043).

Data Availability Statement

Data are contained within the article and Supplementary Materials.

Acknowledgments

We would like to thank Liran Winer for his assistance in collecting grapevine leaves.

Conflicts of Interest

The authors claim that no conflict of interest were present in this research.

References

  1. Desai, S.R. Hyperpigmentation Therapy: A Review. J. Clin. Aesthetic Dermatol. 2014, 7, 13–17. [Google Scholar]
  2. Ortonne, J.P.; Bissett, D.L. Latest Insights into Skin Hyperpigmentation. J. Investig. Dermatol. Symp. Proc. 2008, 13, 10–14. [Google Scholar] [CrossRef] [PubMed]
  3. Brenner, M.; Hearing, V.J. The Protective Role of Melanin against UV Damage in Human Skin. Photochem. Photobiol. 2008, 84, 539–549. [Google Scholar] [CrossRef] [PubMed]
  4. Diepgen, T.L.; Mahler, V. Photoprotective Properties of Skin Melanin. Br. J. Dermatol. Suppl. 2002, 146, 7–10. [Google Scholar] [CrossRef]
  5. Moreiras, H.; Seabra, M.C.; Barral, D.C. Melanin Transfer in the Epidermis: The Pursuit of Skin Pigmentation Control Mechanisms. Int. J. Mol. Sci. 2021, 22, 4466. [Google Scholar] [CrossRef] [PubMed]
  6. Chamcheu, J.C.; Siddiqui, I.A.; Syed, D.N.; Adhami, V.M.; Liovic, M.; Mukhtar, H. Keratin Gene Mutations in Disorders of Human Skin and Its Appendages. Arch. Biochem. Biophys. 2011, 508, 123–137. [Google Scholar] [CrossRef] [PubMed]
  7. Gu, L.H.; Coulombe, P.A. Keratin Function in Skin Epithelia: A Broadening Palette with Surprising Shades. Curr. Opin. Cell Biol. 2007, 19, 13–23. [Google Scholar] [CrossRef]
  8. Clausen, B.E.; Kel, J.M. Langerhans Cells: Critical Regulators of Skin Immunity. Immunol. Cell Biol. 2010, 88, 351–360. [Google Scholar] [CrossRef]
  9. Bharadvaja, N.; Gautam, S.; Singh, H. Natural Polyphenols: A Promising Bioactive Compounds for Skin Care and Cosmetics. Mol. Biol. Rep. 2023, 50, 1817–1828. [Google Scholar] [CrossRef]
  10. Padilla, V.S. Negative Effects of Solar Radiation on the Skin. Bionatura 2018, 3, 492–493. [Google Scholar] [CrossRef]
  11. Puglia, C.; Offerta, A.; Saija, A.; Trombetta, D.; Venera, C. Protective Effect of Red Orange Extract Supplementation against UV-Induced Skin Damages: Photoaging and Solar Lentigines. J. Cosmet. Dermatol. 2014, 13, 151–157. [Google Scholar] [CrossRef] [PubMed]
  12. Lee, J.W.; Ratnakumar, K.; Hung, K.; Rokunohe, D.; Kawasumi, M. Deciphering UV-induced DNA Damage Responses to Prevent and Treat Skin Cancer. Photochem. Photobiol. 2020, 96, 478–499. [Google Scholar] [CrossRef] [PubMed]
  13. Taylor, S.; Grimes, P.; Lim, J.; Im, S.; Lui, H. Postinflammatory Hyperpigmentation. J. Cutan. Med. Surg. 2009, 13, 183–191. [Google Scholar] [CrossRef] [PubMed]
  14. Leyden, J.J.; Shergill, B.; Micali, G.; Downie, J.; Wallo, W. Natural Options for the Management of Hyperpigmentation. J. Eur. Acad. Dermatol. Venereol. 2011, 25, 1140–1145. [Google Scholar] [CrossRef] [PubMed]
  15. Hollinger, J.C.; Angra, K.; Halder, R.M. Are Natural Ingredients Effective in the Management of Hyperpigmentation? A Systematic Review. J. Clin. Aesthet. Dermatol. 2018, 11, 28–37. [Google Scholar] [PubMed]
  16. Nautiyal, A.; Wairkar, S. Management of Hyperpigmentation: Current Treatments and Emerging Therapies. Wiley 2021, 34, 1000–1014. [Google Scholar] [CrossRef] [PubMed]
  17. Schalka, S. New Data on Hyperpigmentation Disorders. J. Eur. Acad. Dermatol. Venereol. 2017, 31, 18–21. [Google Scholar] [CrossRef]
  18. Pandya, A.G.; Guevara, I.L. Disorders of Hyperpigmentation. Dermatol. Clin. 2000, 18, 91–98. [Google Scholar] [CrossRef]
  19. Darji, K.; Varade, R.; West, D.; Armbrecht, E.S.; Guo, M.A. Psychosocial Impact of Postinflammatory Hyperpigmentation in Patients with Acne Vulgaris. J. Clin. Aesthet. Dermatol. 2017, 10, 18–23. [Google Scholar]
  20. Ekore, R.I.; Ekore, J.O. Excoriation (Skin-Picking) Disorder among Adolescents and Young Adults with Acne-Induced Postinflammatory Hyperpigmentation and Scars. Int. J. Dermatol. 2021, 60, 1488–1493. [Google Scholar] [CrossRef]
  21. Chaowattanapanit, S.; Silpa-archa, N.; Kohli, I.; Lim, H.W.; Hamzavi, I. Postinflammatory Hyperpigmentation: A Comprehensive Overview: Treatment Options and Prevention. J. Am. Acad. Dermatol. 2017, 77, 607–621. [Google Scholar] [CrossRef] [PubMed]
  22. Kato, M.; Iida, M.; Goto, Y.; Kondo, T.; Yajima, I. Sunlight Exposure-Mediated DNA Damage in Young Adults. Cancer Epidemiol. Biomark. Prev. 2011, 20, 1622–1628. [Google Scholar] [CrossRef] [PubMed]
  23. Xing, X.; Dan, Y.; Xu, Z.; Xiang, L. Implications of Oxidative Stress in the Pathogenesis and Treatment of Hyperpigmentation Disorders. Oxid. Med. Cell Longev. 2022, 2022, 7881717. [Google Scholar] [CrossRef] [PubMed]
  24. Rathee, P.; Kumar, S.; Kumar, D.; Kumari, B.; Yadav, S.S. Skin Hyperpigmentation and Its Treatment with Herbs: An Alternative Method. Pharm. Sci. 2021, 6, 132. [Google Scholar] [CrossRef]
  25. Oh, K.E.; Shin, H.; Lee, M.K.; Park, B.; Lee, K.Y. Characterization and Optimization of the Tyrosinase Inhibitory Activity of Vitis amurensis Root Using Lc-q-Tof-Ms Coupled with a Bioassay and Response Surface Methodology. Molecules 2021, 26, 446. [Google Scholar] [CrossRef]
  26. Kamkaen, N.; Mulsri, N.; Treesak, C. Screening of Some Tropical Vegetables for Anti-Tyrosinase Activity. Thai Pharm. Health Sci. J. 2007, 2, 15–19. [Google Scholar]
  27. Cordero, R.J.B.; Casadevall, A. Melanin. Curr. Biol. 2020, 30, R142–R143. [Google Scholar] [CrossRef]
  28. Hapsari, R.; Elya, B.; Amin, J. Formulation and Evaluation of Antioxidant and Tyrosinase Inhibitory Effect from Gel Containing the 70% Ethanolic Pleurotus Ostreatus Extract. Int. J. Med. Aromat. Plants 2012, 2, 135–140. [Google Scholar]
  29. Khalkhal, E.; Razzaghi, M.; Rostami-Nejad, M.; Rezaei-Tavirani, M.; Heidari Beigvand, H.; Rezaei Tavirani, M. Evaluation of Laser Effects on the Human Body after Laser Therapy. J. Lasers Med. Sci. 2020, 11, 91–97. [Google Scholar] [CrossRef]
  30. Vemula, S.; Maymone, M.B.C.; Secemsky, E.A.; Widjajahakim, R.; Patzelt, N.M.; Saade, D.; Vashi, N.A. Assessing the Safety of Superficial Chemical Peels in Darker Skin: A Retrospective Study. J. Am. Acad. Dermatol. 2018, 79, 508–513.e2. [Google Scholar] [CrossRef]
  31. Avcil, M.; Akman, G.; Klokkers, J.; Jeong, D.; Çelik, A. Clinical Efficacy of Dissolvable Microneedles Armed with Anti-Melanogenic Compounds to Counter Hyperpigmentation. J. Cosmet. Dermatol. 2021, 20, 605–614. [Google Scholar] [CrossRef]
  32. Roggenkamp, D.; Dlova, N.; Mann, T.; Batzer, J.; Riedel, J.; Kausch, M.; Zoric, I.; Kolbe, L. Effective Reduction of Post-Inflammatory Hyperpigmentation with the Tyrosinase Inhibitor Isobutylamido-Thiazolyl-Resorcinol (Thiamidol). Int. J. Cosmet. Sci. 2021, 43, 292–301. [Google Scholar] [CrossRef]
  33. Lajis, A.F.B.; Ariff, A.B. Discovery of New Depigmenting Compounds and Their Efficacy to Treat Hyperpigmentation: Evidence from in Vitro Study. J. Cosmet. Dermatol. 2019, 18, 703–727. [Google Scholar] [CrossRef]
  34. Panzella, L.; Napolitano, A. Natural and Bioinspired Phenolic Compounds as Tyrosinase Inhibitors for the Treatment of Skin Hyperpigmentation: Recent Advances. Cosmetics 2019, 6, 57. [Google Scholar] [CrossRef]
  35. Amici, J.M.; Cogrel, O.; Jourdan, M.; Raimbault, C.; Canchy, L.; Kerob, D.; Madfes, D.C.; Tian, Y.; Araviiskaia, E. Expert Recommendations on Supportive Skin Care for Non-Surgical and Surgical Procedures. J. Eur. Acad. Dermatol. Venereol. 2023, 37, 16–33. [Google Scholar] [CrossRef] [PubMed]
  36. Bacardit, A.; Cartoixà, X. Revisiting the Role of Irradiance in the Determination of Sunscreens’ Sun Protection Factor. J. Phys. Chem. Lett. 2020, 11, 1209–1214. [Google Scholar] [CrossRef] [PubMed]
  37. Andrews, D.Q.; Rauhe, K.; Burns, C.; Spilman, E.; Temkin, A.M.; Perrone-Gray, S.; Naidenko, O.V.; Leiba, N. Laboratory Testing of Sunscreens on the US Market Finds Lower in Vitro SPF Values than on Labels and Even Less UVA Protection. Photodermatol. Photoimmunol. Photomed. 2022, 38, 224–232. [Google Scholar] [CrossRef] [PubMed]
  38. Na, J.I.; Shin, J.W.; Choi, H.R.; Kwon, S.H.; Park, K.C. Resveratrol as a Multifunctional Topical Hypopigmenting Agent. Int. J. Mol. Sci. 2019, 20, 956. [Google Scholar] [CrossRef]
  39. Lee, T.H.; Seo, J.O.; Baek, S.H.; Kim, S.Y. Inhibitory Effects of Resveratrol on Melanin Synthesis in Ultraviolet B-Induced Pigmentation in Guinea Pig Skin. Biomol. Ther. 2014, 22, 35–40. [Google Scholar] [CrossRef]
  40. Zimmermann Franco, D.C.; De Carvalho, G.S.G.; Rocha, P.R.; Da Silva Teixeira, R.; Da Silva, A.D.; Barbosa Raposo, N.R. Inhibitory Effects of Resveratrol Analogs on Mushroom Tyrosinase Activity. Molecules 2012, 17, 11816–11825. [Google Scholar] [CrossRef]
  41. Yoshimura, M.; Watanabe, Y.; Kasai, K.; Yamakoshi, J.; Koga, T. Inhibitory Effect of an Ellagic Acid-Rich Pomegranate Extract on Tyrosinase Activity and Ultraviolet-Induced Pigmentation. Biosci. Biotechnol. Biochem. 2005, 69, 2368–2373. [Google Scholar] [CrossRef]
  42. Goufo, P.; Singh, R.K.; Cortez, I. A Reference List of Phenolic Compounds (Including Stilbenes) in Grapevine (Vitis vinifera L.) Roots, Woods, Canes, Stems, and Leaves. Antioxidants 2020, 9, 398. [Google Scholar] [CrossRef] [PubMed]
  43. Griesser, M.; Weingart, G.; Schoedl-Hummel, K.; Neumann, N.; Becker, M.; Varmuza, K.; Liebner, F.; Schuhmacher, R.; Forneck, A. Severe Drought Stress Is Affecting Selected Primary Metabolites, Polyphenols, and Volatile Metabolites in Grapevine Leaves (Vitis vinifera Cv. Pinot Noir). Plant Physiol. Biochem. 2015, 88, 17–26. [Google Scholar] [CrossRef] [PubMed]
  44. Jaradat, N.A.; Zaid, A.N.; Hussen, F.; Ali, I. The Effects of Preservation Methods of Grapevine Leaves on Total Phenols, Total Flavonoids and Antioxidant Activity. Marmara Pharm. J. 2017, 21, 291–297. [Google Scholar] [CrossRef]
  45. Lin, Y.; Chen, H.; Huang, J.; Lee, P.; Tsai, C.; Hsu, T.; Huang, W. Kinetics of Tyrosinase Inhibitory Activity Using Vitis vinifera Leaf Extracts. BioMed Res. Int. 2017, 2017, 5232680. [Google Scholar] [CrossRef] [PubMed]
  46. Labanca, F.; Faraone, I.; Nolè, M.R.; Hornedo-Ortega, R.; Russo, D.; García-Parrilla, M.C.; Chiummiento, L.; Bonomo, M.G.; Milella, L. New Insights into the Exploitation of Vitis vinifera L. Cv. Aglianico Leaf Extracts for Nutraceutical Purposes. Antioxidants 2020, 9, 708. [Google Scholar] [CrossRef] [PubMed]
  47. Thanh, N.; Nhi, T.; Khiem, T.G.; Doan, T.; Luan, T.T.; Hoang, N.; Thi, L.; Lan, T.; Thanh, N.; Nhi, T.; et al. Inhibition of Tyrosinase Activity by Grape Leaf Extract Vitis vinifera L. (Vitaceae). TNU J. Sci. Technol. 2022, 227, 10–15. [Google Scholar]
  48. Drori, E.; Rahimi, O.; Henig, Y.; Lorenzi, S.; Brauner, H.; Marrano, A.; Amar, Z.; Netzer, Y.; Failla, O.; Grando, M.S. Ampelographic and Genetic Characterization of an Initial Israeli Grapevine Germplasm Collection. Vitis—J. Grapevine Res. 2015, 54, 107–110. [Google Scholar]
  49. Drori, E.; Rahimi, O.; Marrano, A.; Henig, Y.; Brauner, H.; Salmon-Divon, M.; Netzer, Y.; Prazzoli, M.L.; Stanevsky, M.; Failla, O.; et al. Collection and Characterization of Grapevine Genetic Resources (Vitis vinifera) in the Holy Land, towards the Renewal of Ancient Winemaking Practices. Sci. Rep. 2017, 7, 44463. [Google Scholar] [CrossRef]
  50. Sivan, A.; Rahimi, O.; Lavi, B.; Salmon-Divon, M.; Weiss, E.; Drori, E.; Hübner, S. Genomic Evidence Supports an Independent History of Levantine and Eurasian Grapevines. Plants People Planet 2021, 3, 414–427. [Google Scholar] [CrossRef]
  51. Dong, Y.; Duan, S.; Xia, Q.; Liang, Z.; Dong, X.; Margaryan, K.; Musayev, M.; Goryslavets, S.; Zdunić, G.; Bert, P.-F.; et al. Dual Domestications and Origin of Traits in Grapevine Evolution. Science 2023, 379, 892–901. [Google Scholar] [CrossRef] [PubMed]
  52. Rahimi, O.; Berger, J.Z.; Shtein, I.; Kher, M.M.; Frumin, S.; Hubner, S. Wild Grapevine (Vitis vinifera L. Subsp. Sylvestris (C.C. Gmelin) Hegi)—Novel Species to the Israeli Flora. Horticulturae 2023, 9, 998. [Google Scholar] [CrossRef]
  53. Shecori, S.; Kher, M.M.; Tyagi, K.; Lerno, L.; Netzer, Y.; Lichter, A.; Ebeler, S.E.; Drori, E. A Field Collection of Indigenous Grapevines as a Valuable Repository for Applied Research. Plants 2022, 11, 2563. [Google Scholar] [CrossRef] [PubMed]
  54. Weiss, J.F.; Landauer, M.R. Protection against Ionizing Radiation by Antioxidant Nutrients and Phytochemicals. Toxicology 2003, 189, 1–20. [Google Scholar] [CrossRef] [PubMed]
  55. Radhiga, T.; Agilan, B.; Muzaffer, U.; Karthikeyan, R.; Kanimozhi, G.; Paul, V.; Prasad, N. Phytochemicals as Modulators of Ultraviolet-b Radiation Induced Cellular and Molecular Events: A Review. J. Radiat. Cancer Res. 2016, 7, 2. [Google Scholar] [CrossRef]
  56. Anđelković, M.; Radovanović, B.; Anđelković, A.M.; Radovanović, V. Phenolic Compounds and Bioactivity of Healthy and Infected Grapevine Leaf Extracts from Red Varieties Merlot and Vranac (Vitis vinifera L.). Plant Foods Hum. Nutr. 2015, 70, 317–323. [Google Scholar] [CrossRef] [PubMed]
  57. Al-Duais, M.; Müller, L.; Böhm, V.; Jetschke, G. Antioxidant Capacity and Total Phenolics of Cyphostemma Digitatum before and after Processing: Use of Different Assays. Eur. Food Res. Technol. 2009, 228, 813–821. [Google Scholar] [CrossRef]
  58. Müller, L.; Gnoyke, S.; Popken, A.M.; Böhm, V. Antioxidant Capacity and Related Parameters of Different Fruit Formulations. LWT—Food Sci. Technol. 2010, 43, 992–999. [Google Scholar] [CrossRef]
  59. Bobo-García, G.; Davidov-Pardo, G.; Arroqui, C.; Vírseda, P.; Marín-Arroyo, M.R.; Navarro, M. Intra-Laboratory Validation of Microplate Methods for Total Phenolic Content and Antioxidant Activity on Polyphenolic Extracts, and Comparison with Conventional Spectrophotometric Methods. J. Sci. Food Agric. 2015, 95, 204–209. [Google Scholar] [CrossRef]
  60. Pomerantz, S.H. Separation, Purification, and Properties of Two Tyrosinases from Hamster Melanoma. J. Biol. Chem. 1963, 238, 2351–2357. [Google Scholar] [CrossRef]
  61. Huang, K.F.; Chen, Y.W.; Chang, C.T.; Chou, S.T. Studies on the Inhibitory Effect of Graptopetalum paraguayense E. Walther Extracts on Mushroom Tyrosinase. Food Chem. 2005, 89, 583–587. [Google Scholar] [CrossRef]
  62. Rachkeeree, A.; Kantadoung, K.; Puangpradub, R.; Suksathan, R. Phytochemicals, Antioxidants and Anti-Tyrosinase Analyses of Selected Ginger Plants. Pharmacogn. J. 2020, 12, 872–883. [Google Scholar] [CrossRef]
  63. Mansur, J.S.; Breder, M.N.; Mansur, M.C.; Azulay, R.D. Determination of Sun Protection Factor by Spectrophotometry. An. Bras. Dermatol. 1986, 61, 121–124. [Google Scholar]
  64. Rosenzweig, T.; Skalka, N.; Rozenberg, K.; Elyasiyan, U.; Pinkus, A.; Green, B.; Stanevsky, M.; Drori, E. Red Wine and Wine Pomace Reduced the Development of Insulin Resistance and Liver Steatosis in HFD-Fed Mice. J. Funct. Foods 2017, 34, 379–389. [Google Scholar] [CrossRef]
  65. Driscoll, W.C. Robustness of the ANOVA and Tukey-Kramer Statistkal Tests. Comput. Ind. Eng. 1996, 31, 265–268. [Google Scholar] [CrossRef]
  66. Vries, H. de The Rowwise Correlation between Two Proximity Matrices and the Partial Rowwise Correlation. Psychometrika 1993, 58, 53–69. [Google Scholar] [CrossRef]
  67. Nichols, J.A.; Katiyar, S.K. Skin Photoprotection by Natural Polyphenols: Anti-Inflammatory, Antioxidant and DNA Repair Mechanisms. Arch. Dermatol. Res. 2010, 302, 71–83. [Google Scholar] [CrossRef] [PubMed]
  68. Tuong, W.; Walker, L.; Sivamani, R.K. Polyphenols as Novel Treatment Options for Dermatological Diseases: A Systematic Review of Clinical Trials. J. Dermatol. Treat. 2015, 26, 381–388. [Google Scholar] [CrossRef]
  69. Mohamed, A.A.A.; Sorour, W.A.A. Assessment of Photoprotective, Antioxidant and Anti-Skin Cancer Activities of Leaf Extracts of Certain Medicinal Plants. Egypt. J. Bot. 2020, 60, 749–762. [Google Scholar] [CrossRef]
  70. Ferreira, V.; Matus, J.T.; Pinto-Carnide, O.; Carrasco, D.; Arroyo-García, R.; Castro, I. Genetic Analysis of a White-to-Red Berry Skin Color Reversion and Its Transcriptomic and Metabolic Consequences in Grapevine (Vitis vinifera Cv. ‘Moscatel Galego’). BMC Genom. 2019, 20, 952. [Google Scholar] [CrossRef]
  71. Djemaa-Landri, K.; Hamri-Zeghichi, S.; Valls, J.; Cluzet, S.; Tristan, R.; Boulahbal, N.; Kadri, N.; Madani, K. Phenolic Content and Antioxidant Activities of Vitis vinifera L. Leaf Extracts Obtained by Conventional Solvent and Microwave-Assisted Extractions. J. Food Meas. Charact. 2020, 14, 3551–3564. [Google Scholar] [CrossRef]
  72. Bernardo, S.; Dinis, L.-T.; Machado, N.; Moutinho-Pereira, J. Grapevine Abiotic Stress Assessment and Search for Sustainable Adaptation Strategies in Mediterranean-like Climates. A Review. Agron. Sustain. Dev. 2018, 38, 66. [Google Scholar] [CrossRef]
  73. Lovisolo, C.; Lavoie-Lamoureux, A.; Tramontini, S.; Ferrandino, A. Grapevine Adaptations to Water Stress: New Perspectives about Soil/Plant Interactions. Theor. Exp. Plant Physiol. 2016, 28, 53–66. [Google Scholar] [CrossRef]
  74. Teixeira, A.; Eiras-Dias, J.; Castellarin, S.D.; Gerós, H. Berry Phenolics of Grapevine under Challenging Environments. Int. J. Mol. Sci. 2013, 14, 18711–18739. [Google Scholar] [CrossRef]
  75. Martín-Tornero, E.; de Jorge Páscoa, R.N.M.; Espinosa-Mansilla, A.; Martín-Merás, I.D.; Lopes, J.A. Comparative Quantification of Chlorophyll and Polyphenol Levels in Grapevine Leaves Sampled from Different Geographical Locations. Sci. Rep. 2020, 10, 6246. [Google Scholar] [CrossRef] [PubMed]
  76. Martín-Tornero, E.; Durán Martín-Merás, I.; Espinosa Mansilla, A.; Almeida Lopes, J.; Nuno Mendes de Jorge Páscoa, R. Geographical Discrimination of Grapevine Leaves Using Fibre Optic Fluorescence Data and Chemometrics. Determination of Total Polyphenols and Chlorophylls along Different Vegetative Stages. Microchem. J. 2022, 181, 107647. [Google Scholar] [CrossRef]
  77. Pajović-Šćepanović, R.; Wendelin, S.; Eder, R. Phenolic Composition and Varietal Discrimination of Montenegrin Red Wines (Vitis vinifera Var. Vranac, Kratošija, and Cabernet Sauvignon). Eur. Food Res. Technol. 2018, 244, 2243–2254. [Google Scholar] [CrossRef]
  78. Pantelić, M.M.; Zagorac, D.Č.D.; Ćirić, I.; Pergal, M.V.; Relić, D.J.; Todić, S.R.; Natić, M.M. Phenolic Profiles, Antioxidant Activity and Minerals in Leaves of Different Grapevine Varieties Grown in Serbia. J. Food Compos. Anal. 2017, 62, 76–83. [Google Scholar] [CrossRef]
  79. Garcia-Molina, P.; Garcia-Molina, F.; Teruel-Puche, J.A.; Rodriguez-Lopez, J.N.; Garcia-Canovas, F.; Muñoz-Muñoz, J.L. The Relationship between the IC50 Values and the Apparent Inhibition Constant in the Study of Inhibitors of Tyrosinase Diphenolase Activity Helps Confirm the Mechanism of Inhibition. Molecules 2022, 27, 3141. [Google Scholar] [CrossRef]
  80. Neeley, E.; Fritch, G.; Fuller, A.; Wolfe, J.; Wright, J.; Flurkey, W. Variations in IC50 Values with Purity of Mushroom Tyrosinase. Int. J. Mol. Sci. 2009, 10, 3811–3823. [Google Scholar] [CrossRef]
  81. Zolghadri, S.; Bahrami, A.; Hassan Khan, M.T.; Munoz-Munoz, J.; Garcia-Molina, F.; Garcia-Canovas, F.; Saboury, A.A. A Comprehensive Review on Tyrosinase Inhibitors. J. Enzym. Inhib. Med. Chem. 2019, 34, 279–309. [Google Scholar] [CrossRef] [PubMed]
  82. Pop, T.D.; Diaconeasa, Z. Recent Advances in Phenolic Metabolites and Skin Cancer. Int. J. Mol. Sci. 2021, 22, 9707. [Google Scholar] [CrossRef] [PubMed]
  83. Awang Ismail, F. Muhammad Syukri Bin Razali Zuraimy Ali Total Phenolic Content (TPC) in Catharanthus Roseus and Clitoria Ternatea Leaves Extract. J. Trop. Resour. Sustain. Sci. 2022, 10, 58–62. [Google Scholar] [CrossRef]
Figure 1. Normalized TPC content of leaf Extracts of the tested grapevine varieties. (A) the differences between all 23 tested varieties. (B) There are differences between the average TPCs of the different groups: European, Israeli, white, and red varieties. Results represent the mean ± standard deviation (S.D.) of n > 11. TPC levels were compared via the Tukey-Kramer test (Table S2), where statistical significance was defined as p < 0.05. Different capital letters mentioned above the columns represent results which were found to be significantly different by the statistical analysis.
Cosmetics 11 00002 g001
Figure 2. Sun protection factor (SPF) of 1.5 mg/mL of L. Extracts in 10% DMSO of the tested grapevine varieties. (A) the differences between the 23 tested grapevine varieties. (B) the differences between the different groups: European, Israeli, white, and red grapevine varieties. Results represent the mean ± standard deviation (S.D.) of n > 3. Statistical analysis was conducted using the Tukey-Kramer test, as shown in Table S3, with statistical significance defined as p < 0.05. Different capital letters mentioned above the columns represent results which were found to be significantly different by the statistical analysis.
Cosmetics 11 00002 g002
Figure 3. PCA analysis using the areas of the different peaks (found in the initial HPLC analysis) for each tested variety’s extract. (A) a 3D distribution of the different varieties on the first three PCs, in the groups’ colors: Red Israeli, White Israeli, Red European, and White European. (B) the effect of different vectors on the distribution of varieties in space. The colors represent the other groups.
Cosmetics 11 00002 g003
Figure 4. The inhibition of tyrosinase activity of 6 mg/mL of L. Extracts in 10% DMSO of the tested grapevine varieties. (A) shows the differences between the 23 tested varieties. (B) shows the differences between the different groups: European, Israeli, white, and red varieties. Results represent the mean ± standard deviation (S.D.) of n > 3. Statistical analysis was conducted using the Tukey-Kramer test, as shown in Table S4, with statistical significance defined as p < 0.05. Different capital letters mentioned above the columns represent results which were found to be significantly different by the statistical analysis.
Cosmetics 11 00002 g004
Figure 5. The half-maximal inhibitory concentration-IC50 [mg/mL] of L. Extracts of the tested grapevine varieties in 10% DMSO. Results represent the mean ± standard deviation (S.D.) of n > 3. Statistical analysis was conducted using the Tukey-Kramer test, as shown in Table S5, with statistical significance defined as p < 0.05. (A) shows the differences between the 23 tested varieties. (B) shows the differences between the different groups: European, Israeli, white, and red varieties. Different capital letters mentioned above the columns represent results which were found to be significantly different by the statistical analysis.
Cosmetics 11 00002 g005
Figure 6. Correlations between 23 varieties in different categories, n > 3. Statistical analyses are estimated by the Restricted Maximum Likelihood (REML). Based on the fitting method selected.
Cosmetics 11 00002 g006
Figure 7. Correlations between TPC, SPF, % Inhibition, and the IC50 and Substances found in the leaf extracts using HPLC peaks, n = 1. Statistical analyses are estimated by the REML.
Cosmetics 11 00002 g007
Table 1. The 23 grapevine varieties tested were categorized into four groups: Israeli, European, red, and white. For clarity, we have color-coded the different groups (also used in the following figures) as follows: Red Israeli grapevines—Red, White Israeli grapevines—Green, Red European grapevines—Blue, and White European grapevines—Yellow.
IsraeliEuropean
RedOrchaMalbec
DishonMerlot
HardufCabernet Sauvignon
ZeituniPetite Sirah
Nitzan 3 (Yael)Pinot Noir
Ness ZionaCabernet Franc
Pumela
Tel Tzuba
WhiteBeerSauvignon Blanc
Batar NitzanimGewurztraminer
DarwishiViognier
ShikamaChenin Blanc
Chardonnay
Disclaimer/Publisher’s Note: The statements, opinions and data contained in all publications are solely those of the individual author(s) and contributor(s) and not of MDPI and/or the editor(s). MDPI and/or the editor(s) disclaim responsibility for any injury to people or property resulting from any ideas, methods, instructions or products referred to in the content.

