Article

Genome-Wide Association Identifies Candidate Genes for Salt Tolerance in Soybean at Emergence and Seedling Stages
1
State Key Laboratory of Crop Gene Resources and Breeding, National Key Facility for Gene Resources and Genetic Improvement, Key Laboratory of Crop Germplasm Utilization of Ministry of Agriculture, Institute of Crop Sciences, Chinese Academy of Agricultural Sciences, Beijing 100081, China
2
Institute of Crops, Ningxia Academy of Agricultural and Forestry Sciences, Yinchuan 750002, China
3
The Shennong Laboratory, Zhengzhou 450002, China
*
Authors to whom correspondence should be addressed.
These authors contributed equally to this work.
Biology 2026, 15(16), 1409; https://doi.org/10.3390/biology15161409
Submission received: 28 May 2026 / Revised: 30 July 2026 / Accepted: 13 August 2026 / Published: 17 August 2026
(This article belongs to the Section Plant Science)

Simple Summary

Soil salinization is an expanding threat to soybean production worldwide. Resolving the genetic basis of salt tolerance at early growth stages supports the development of resilient cultivars. In this study, we evaluated 256 soybean accessions for salt tolerance at emergence and seedling stages and conducted genome-wide association analysis (GWAS) using a high-density single nucleotide polymorphism (SNP) array. We identified 19 genomic regions (quantitative trait loci, QTLs) associated with salt tolerance, including 16 at the emergence stage and 3 at the seedling stage, along with four putative candidate genes with predicted functions in stress responses. Salt tolerance at the two developmental stages was weakly correlated, indicating that tolerance is stage-specific and that at each stage requires separate selection. These findings provide genetic targets for breeding salt-tolerant soybean varieties.

Abstract

Salt stress is an abiotic constraint on crop production, impairing growth while reducing yield and quality. As a source of edible oil and protein, soybean is particularly vulnerable to salt stress during emergence and seedling establishment, so the genetic basis of salt tolerance bears directly on productive cultivation. Here, a natural population of 256 soybean accessions was phenotyped for salt tolerance at emergence and seedling stages and genotyped using the Zhongdouxin No.1 (ZDX1) single nucleotide polymorphism (SNP) array. Genome-wide association analysis identified 60 salt tolerance-associated SNPs consolidated into 19 quantitative trait loci (QTL), 16 associated with emergence-stage and 3 with seedling-stage salt tolerance. Five QTLs mapped to chromosomal regions harboring previously reported stress-tolerance genes, including GmSALT3, approximately 192 kb from qSTG-SSB-03. Four putative candidate genes were prioritized: Glyma.10G040000, encoding a glutathione S-transferase (GST), was identified at the emergence stage, while Glyma.10G148700, Glyma.10G149200, and Glyma.10G149600, encoding a calmodulin-binding protein (CaM), drought-induced protein 19 (Di19), and a protein phosphatase 2C (PP2C), respectively, were identified at the seedling stage, all with reported roles in salt-stress responses.

1. Introduction

Soybean (Glycine max [L.] Merr.) is a food and oilseed crop whose stable production underpins global food security and agricultural economies [1]. Soil salinization limits soybean growth, development, and yield by disrupting cellular homeostasis through ion toxicity, osmotic stress, and oxidative damage, suppressing germination, root development, photosynthetic efficiency, and biomass accumulation [2,3]. Globally, an estimated 950 million hectares are affected by salinity, including roughly 20% of the 230 million hectares of irrigated land, with the affected area expanding at approximately 10% annually [4,5,6,7]. Developing salt-tolerant cultivars is therefore among the lowest-cost strategies to address this challenge [8].
Salt tolerance in soybean is a quantitative trait governed by multiple genes operating through a complex regulatory network [9]. Tolerance is developmentally stage-specific: an accession tolerant at germination or seedling establishment does not necessarily perform well at maturity, and tolerance across stages is often uncorrelated [10,11,12,13]. Furthermore, salt stress during early development suppresses canopy establishment and vegetative growth, with cascading effects on subsequent stages that ultimately reduce both seed yield and protein content [14,15,16]. Mapping genetic loci underlying salt tolerance specifically at emergence and seedling stages therefore supports the breeding of improved cultivars [17].
Early efforts to map soybean salt tolerance relied on biparental populations. Lee et al. [18] used an F2:5 population from a cross between the salt-tolerant cultivar S-100 and the salt-sensitive cultivar Tokyo. This study mapped a major seedling-stage quantitative trait loci (QTL) to a 3.6 cM interval flanked by simple sequence repeat (SSR) markers Sat_091 and Satt237 on chromosome 3. This locus was detected again in subsequent studies [19,20,21,22]. In 2014, Qi et al. [23] and Guan et al. [24] independently cloned the underlying gene, Glyma03g32900, from wild and cultivated soybean, naming it GmCHX1 and GmSALT3, respectively; the encoded cation Na+/H+ transporter limits Na+ accumulation in seedling leaves, markedly improving salt tolerance. Do et al. [20] crossed salt-tolerant Fiskeby III with moderately salt-sensitive Williams 82, generating 132 F2 families, and mapped a QTL on chromosome 13 linked to leaf sodium concentration (LSC). More recently, Li et al. [25] used a recombinant inbred line (RIL) population derived from Williams 82 × PI483460B to map qSalt_Gm18 on chromosome 18, alongside qSalt_Gm03, which co-localizes with GmCHX1 on chromosome 3. To date, 68 soybean salt tolerance QTLs identified from biparental populations have been cataloged in SoyBase (https://www.soybase.org).
Relative to biparental linkage mapping, genome-wide association studies (GWASs) exploit linkage disequilibrium (LD) within natural populations with distinct advantages: broader allelic diversity, finer mapping resolution, and no requirement to construct segregating populations [26,27,28]. High-density single nucleotide polymorphism (SNP)-based GWAS has been widely deployed across crops, including rice [29], cowpea [30], rapeseed [31], cotton [32], alfalfa [33], and sesame [34], and is now routine in plant molecular breeding [35]. Recent GWASs have expanded our understanding of salt tolerance loci in soybean. Kan et al. [36] applied GWAS to 191 landraces at the germination stage, identifying one significant SNP on chromosome 9 associated with the germination index ratio and seven SNPs on chromosomes 2, 3, 9, 12, and 13 associated with the germination rate ratio. Wang et al. [37] detected 1841 significant SNPs associated with germination-stage salt tolerance, developed Kompetitive Allele-Specific PCR (KASP) markers, and validated three candidate genes with elevated expression under salt stress via quantitative real-time polymerase chain reaction (qRT-PCR). Do et al. [38] identified an additional seedling-stage salt tolerance locus on chromosome 8 beyond the GmSALT3 region on chromosome 3 through high-resolution GWAS. Dong et al. [39] identified a major salt tolerance locus controlled by E2, a homolog of Arabidopsis GIGANTEA (GI), using leaf chlorosis as the phenotypic indicator; E2 knockout enhanced tolerance by promoting peroxidase activity and reducing reactive oxygen species (ROS) accumulation under salt stress. Pruthi et al. [40] conducted association mapping across cultivated and wild soybean accessions, identifying candidate genes such as GmKUP6 and GmWRKY33.
Despite these advances, genetic studies of salt tolerance specifically at the emergence stage remain limited. In this study, a natural population of 256 soybean accessions was evaluated for salt tolerance at both emergence and seedling stages under controlled salt stress and genotyped with a high-density SNP array. GWAS was then conducted to identify associated loci and candidate genes, providing a resource for gene cloning and marker-assisted selection.

2. Materials and Methods

2.1. Materials

A total of 256 soybean accessions were used, comprising 255 Chinese accessions and one accession of foreign origin (Table S1). The salt-tolerant accession Zhonghuang 39 and the salt-sensitive accession NY27-38 served as controls throughout emergence-stage evaluations.

2.2. Salt Stress Treatment and Tolerance Assessment at the Emergence Stage

For each accession, 60 mature, uniformly sized seeds of consistent shape and color were selected. Small pots (7 × 7 × 8 cm) were filled with vermiculite to 2 cm below the rim, sown with 10 seeds each, and topped with vermiculite to the rim. Every 24 pots were arranged in a large container (46 × 32 × 10 cm). For salt treatment, 6 L of 150 mmol/L NaCl solution was added to each large container; after 5 min of saturation, the small pots were transferred to a clean container. Subsequently, 3 L of reverse-osmosis water (RO water) was replenished every 3 days. Once the vermiculite reached its maximum water-holding capacity, the pots were immediately moved to a fresh container to prevent salt leaching. Control treatments were conducted identically, substituting 6 L of RO water for the NaCl solution. All treatments were performed in triplicate.
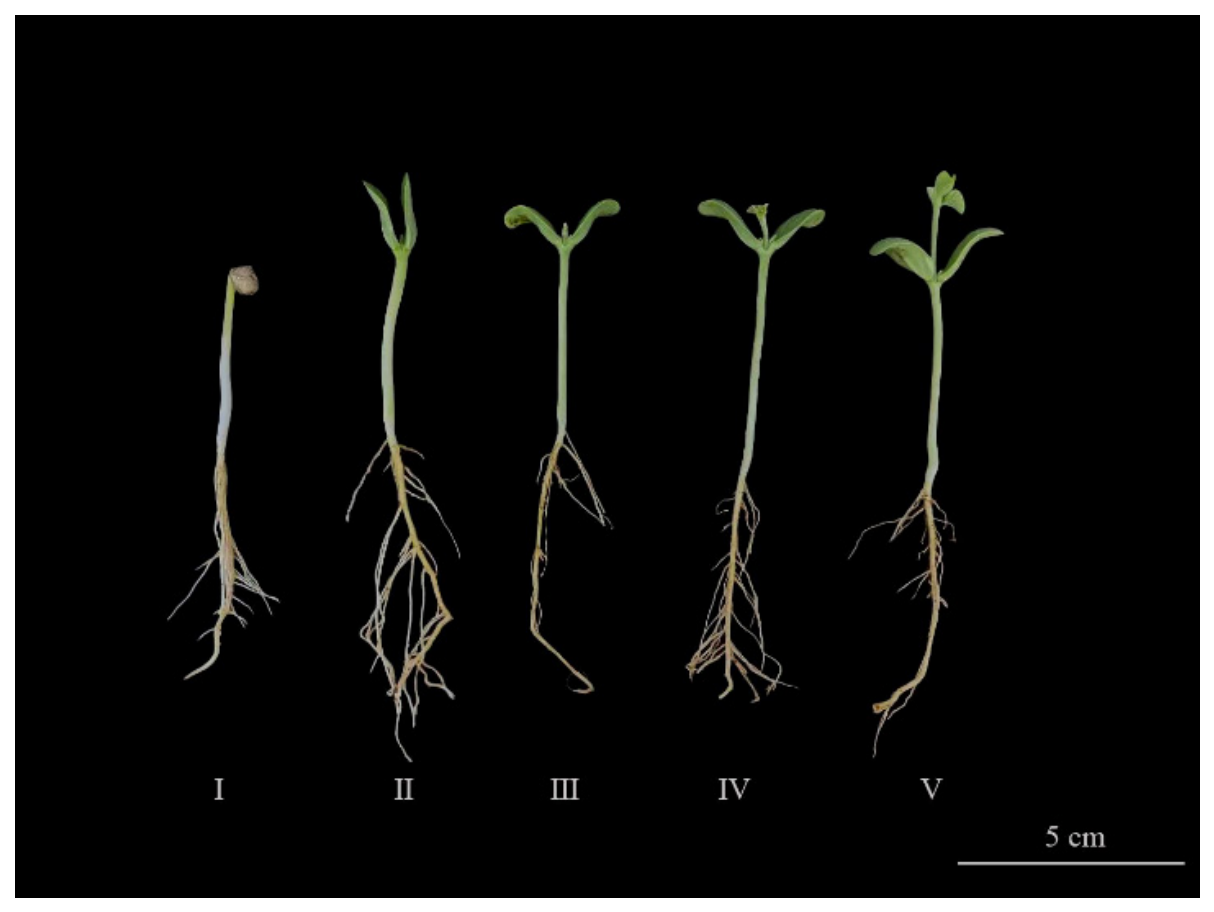
Emergence was scored daily from the appearance of the first seedling, defined as cotyledon protrusion above the vermiculite surface, until NY27-38 displayed salt-injury symptoms (severely suppressed emergence and failure of cotyledon expansion). At the same time, Zhonghuang 39 remained unaffected, with normal emergence and cotyledon expansion. At this endpoint, the number of fully established seedlings (those with expanded cotyledons and leaves) was recorded. Salt tolerance phenotypes were assessed using an individual-plant classification scheme (Figure 1; Table S2) according to Liu et al. [41], from which the salt tolerance index (SI) was calculated. Emergence-stage salt tolerance grade (STG-SI) was assigned based on the mean SI across three replicates according to Table S2 (Figure S1). The SI was calculated as:
SI = ( I × N i ) / ( 10 × 5 )
where I is the individual-plant category value, Ni is the number of plants in category I, 10 is the number of seeds sown per pot, and 5 is the maximum category value. The salt tolerance coefficient (ST) was the percentage of emerged seedlings under salt stress relative to the control.

2.3. Salt Stress Treatment and Tolerance Assessment at the Seedling Stage

Seed preparation and sowing for the seedling-stage assay followed the same protocol as described for the emergence stage. After sowing, 6 L of RO water was added to each large container. After 5 min of saturation, the pots were transferred to a clean container, and 3 L of RO water was replenished every 3 days using the same procedure. Once unifoliate leaves were fully expanded (approximately 10 days after sowing), salt treatment was initiated by adding 3 L of 200 mmol/L NaCl solution to each container. Following saturation, pots were moved to clean containers, and this treatment was repeated on days 13 and 16. Five days after the final salt application, leaf salt-injury symptoms were scored in each replicate according to a five-grade scale (Table S3; Figure S2) following Liu [42]: grade 1, highly tolerant; grade 2, tolerant; grade 3, moderately tolerant; grade 4, sensitive; grade 5, highly sensitive. The mean grade across three replicates was calculated to assign the final seedling-stage salt tolerance grade (STG-SS), with means between consecutive integers rounded to the higher grade.

2.4. Phenotypic Data Processing and Analysis

Descriptive statistics and normality testing were performed in SPSS (v25.0, IBM), and one-way ANOVA was performed in R (v4.4.2). The emergence-stage salt tolerance coefficient (ST) and salt tolerance index (SI) were standardized by rank-based inverse normal transformation (INT) following Zachary et al. [43], yielding the transformed traits ST-INT and SI-INT, respectively.
For ordinal traits with small, skewed distributions, binarization is a recognized strategy in GWAS that sharpens contrast between phenotypic extremes and increases power to detect association signals [44]. Accordingly, STG-SI and STG-SS were each binarized: accessions scoring below 3 were classified as strongly tolerant (coded 1) and those scoring 3 or above were weakly tolerant (coded 0), producing binary traits STG-SIB and STG-SSB, respectively. Pearson correlation coefficients among ST-INT, SI-INT, STG-SIB, and STG-SSB were computed using the psych package (v2.6.3) in R (v4.4.2) and visualized with the ggpairs function in the GGally package (v2.4.0).

2.5. Quality Control of Genotype Data

Genomic DNA was extracted from all 256 accessions and genotyped using a ZDX1 SNP array, co-developed by the Institute of Crop Sciences, Chinese Academy of Agricultural Sciences, and Beijing Compass Biotechnology Co., Ltd. (Beijing, China) SNP quality control followed Sun et al. [45], with PLINK (v1.9) used to remove SNPs with genotype missing rate > 0.4 or minor allele frequency < 0.05.

2.6. Linkage Disequilibrium Estimation

Linkage disequilibrium (LD) decay was estimated using PopLDdecay (v3.31; BGI Genomics) and visualized in R (v4.4.2) with ggplot2 (v3.4.3). The physical distance at which r2 declined to half of its maximum value (i.e., from an initial r2 of approximately 1.0 to r2 ≈ 0.5) was taken as the LD decay distance for this population.

2.7. Population Structure and Kinship Analysis

K-means clustering was conducted using the kmeans function in R (v4.4.2), with the optimal number of subpopulations identified by the elbow method, plotting the sum of squared errors (SSEs) for K = 2–10 and selecting the K at which SSE decline flattened. Principal component analysis (PCA) was conducted with the prcomp function in R (v4.4.2). A neighbor-joining (NJ) phylogenetic tree was constructed from pairwise genetic distance matrices using the ape (v5.8-1) and ggtree (v3.16.0) packages. Population structure was additionally estimated with ADMIXTURE across K = 2–8, with the optimal K selected by minimizing cross-validation (CV) error. The final subpopulation assignment integrated results from K-means clustering, PCA, the NJ tree, and ADMIXTURE. A kinship matrix was computed from SNP data using GAPIT (v3.5; http://zzlab.net/GAPIT, accessed on 14 September 2025), and relatedness within and between subpopulations was visualized as a heatmap.

2.8. Genome-Wide Association Analysis (GWAS)

GWAS was conducted using the GAPIT platform (v3.5; http://zzlab.net/GAPIT, accessed on 14 September 2025) with seven models, including GLM, MLM, CMLM, MLMM, SUPER, FarmCPU, and BLINK, with population structure and kinship coefficients included as covariates to control false positives. Association loci were declared at a suggestive threshold of −log10(P) ≥ 4. Only those detected by at least three of the seven models were retained to minimize false positives, and results were visualized using ggplot2 (v3.4.3) in R (v4.4.2). Adjacent significant SNPs on the same chromosome, with pairwise distances within the LD decay distance (~50 kb), were consolidated into a single QTL. The SNP with the highest −log10(P) value within each QTL was the peak SNP.
All seven models implemented in GAPIT are based on linear or linear mixed model frameworks. For the binary traits (STG-SIB and STG-SSB), linear models were applied to the 0/1 coded variables. Although logistic models are theoretically more appropriate for binary outcomes, linear models have been widely adopted in plant GWAS for binary and categorical traits and perform adequately when category distributions are reasonably balanced, as in the present study (60.16% vs. 39.84% for STG-SIB; 62.50% vs. 37.50% for STG-SSB). Concordant QTL signals from the continuous emergence-stage traits (ST-INT and SI-INT) support the binary-trait results at that stage; no continuous trait was measured at the seedling stage, so STG-SSB carries no equivalent support.

2.9. Candidate Gene Identification

Haplotype blocks around significant SNPs were identified using LDBlockShow (v1.40). For each stable LD block, the SNP with the highest −log10(P) value was the peak SNP, and protein-coding genes within the haplotype block boundaries extended by 50 kb on either side were identified as candidate genes based on the population-specific LD decay distance. Tissue-level expression profiles of candidate genes were examined using the Soybean eFP Browser (https://bar.utoronto.ca/efp_soybean/, accessed on 25 June 2026). Putative candidate genes were prioritized based on functional annotation for stress-related roles, expression in relevant tissues, and published evidence of involvement in salt tolerance.

3. Results

3.1. Phenotypic Evaluation of Salt Tolerance at Emergence and Seedling Stages

At the emergence stage, the mean emergence rate under control conditions was 0.93 (range: 0.4–1.0). Salt stress reduced this to a mean of 0.85 (range: 0–1.0), a difference supported by one-way ANOVA (p < 0.0001) (Figure S3).
At the emergence stage, mean ST was 89.32 (range: 33.33–100) and mean SI was 0.62 (range: 0.09–1.00) (Table 1). Both traits deviated markedly from normality: ST was left-skewed (skewness = −1.90) with a leptokurtic distribution (kurtosis = 4.60), while SI exhibited mild left skewness (skewness = −0.50). Rank-based inverse normal transformation was applied to both, and the resulting ST-INT and SI-INT approximated normal distributions, with skewness and kurtosis near zero, means near zero, and variance near one (Table 1; Figure S4A,B). STG-SI and STG-SS were both right-skewed (skewness = 0.52 and 0.66, respectively; Table 1) and were thus binarized, yielding STG-SIB and STG-SSB with strongly tolerant proportions of 60.16% and 62.50%, sufficiently balanced for association analysis (Figure S4C,D). All four transformed traits were carried forward for GWAS.

3.2. Correlation Analysis

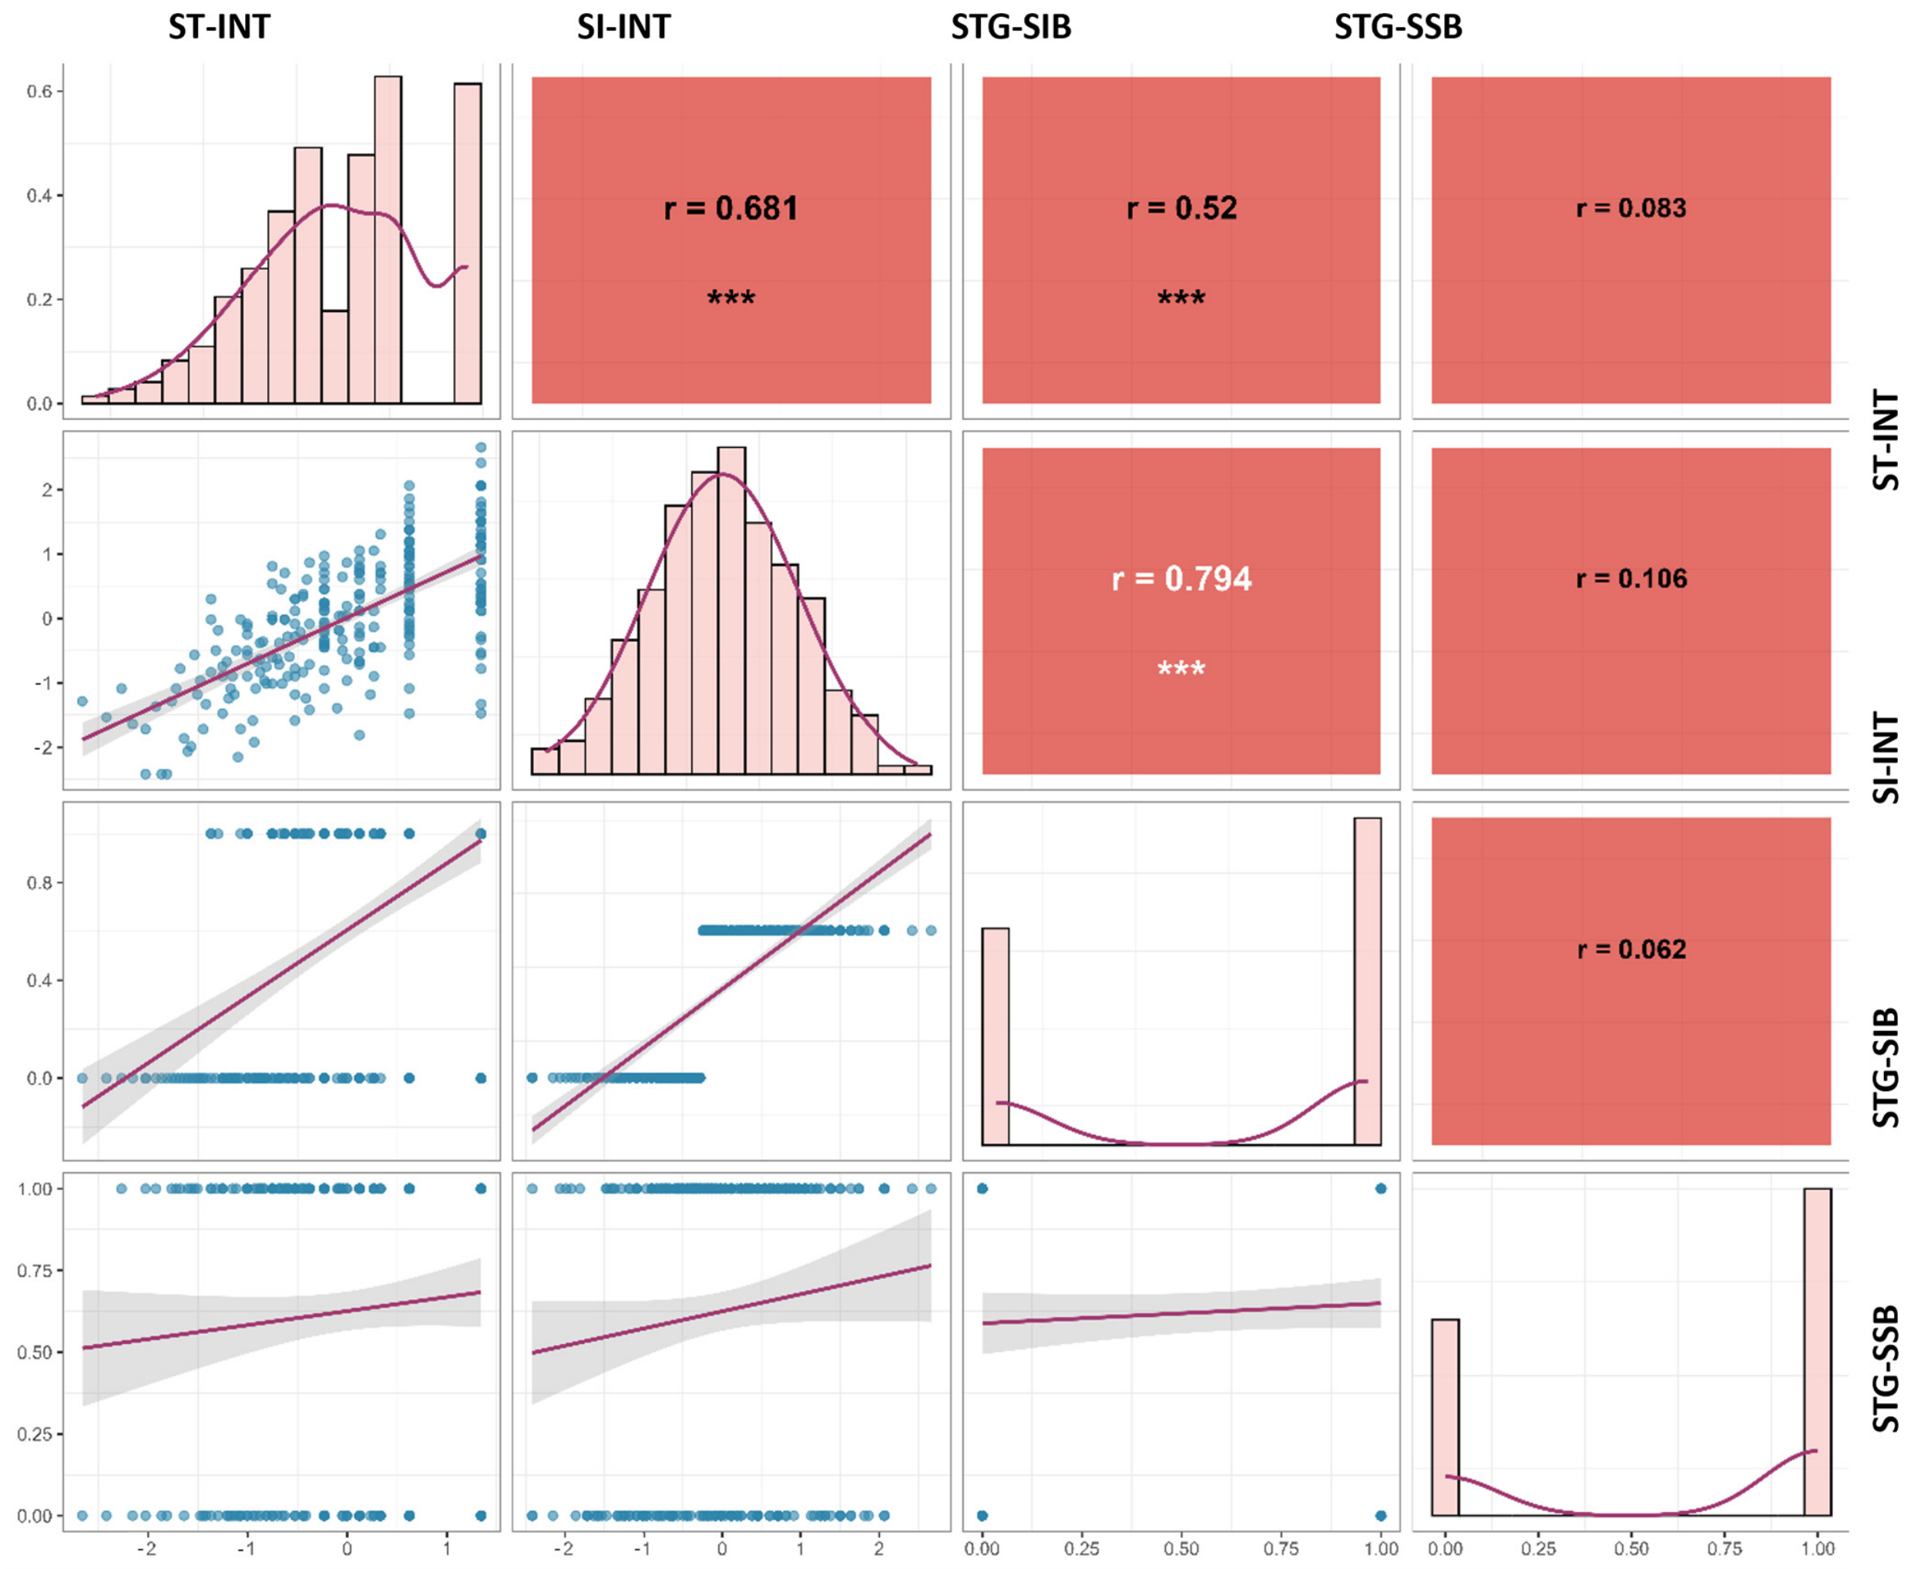
Pearson correlation analysis among ST-INT, SI-INT, STG-SIB, and STG-SSB showed positive associations among all three emergence-stage traits (Figure 2): ST-INT vs. SI-INT, r = 0.681; ST-INT vs. STG-SIB, r = 0.520; SI-INT vs. STG-SIB, r = 0.794, all significant. In contrast, the seedling-stage trait STG-SSB showed negligible correlations with STG-SIB (r = 0.062), ST-INT (r = 0.083), and SI-INT (r = 0.106), indicating that salt tolerance at emergence and at the seedling stage are weakly correlated in this population, likely reflecting distinct aspects of the salt stress response.

3.3. Genotype Data Quality Control

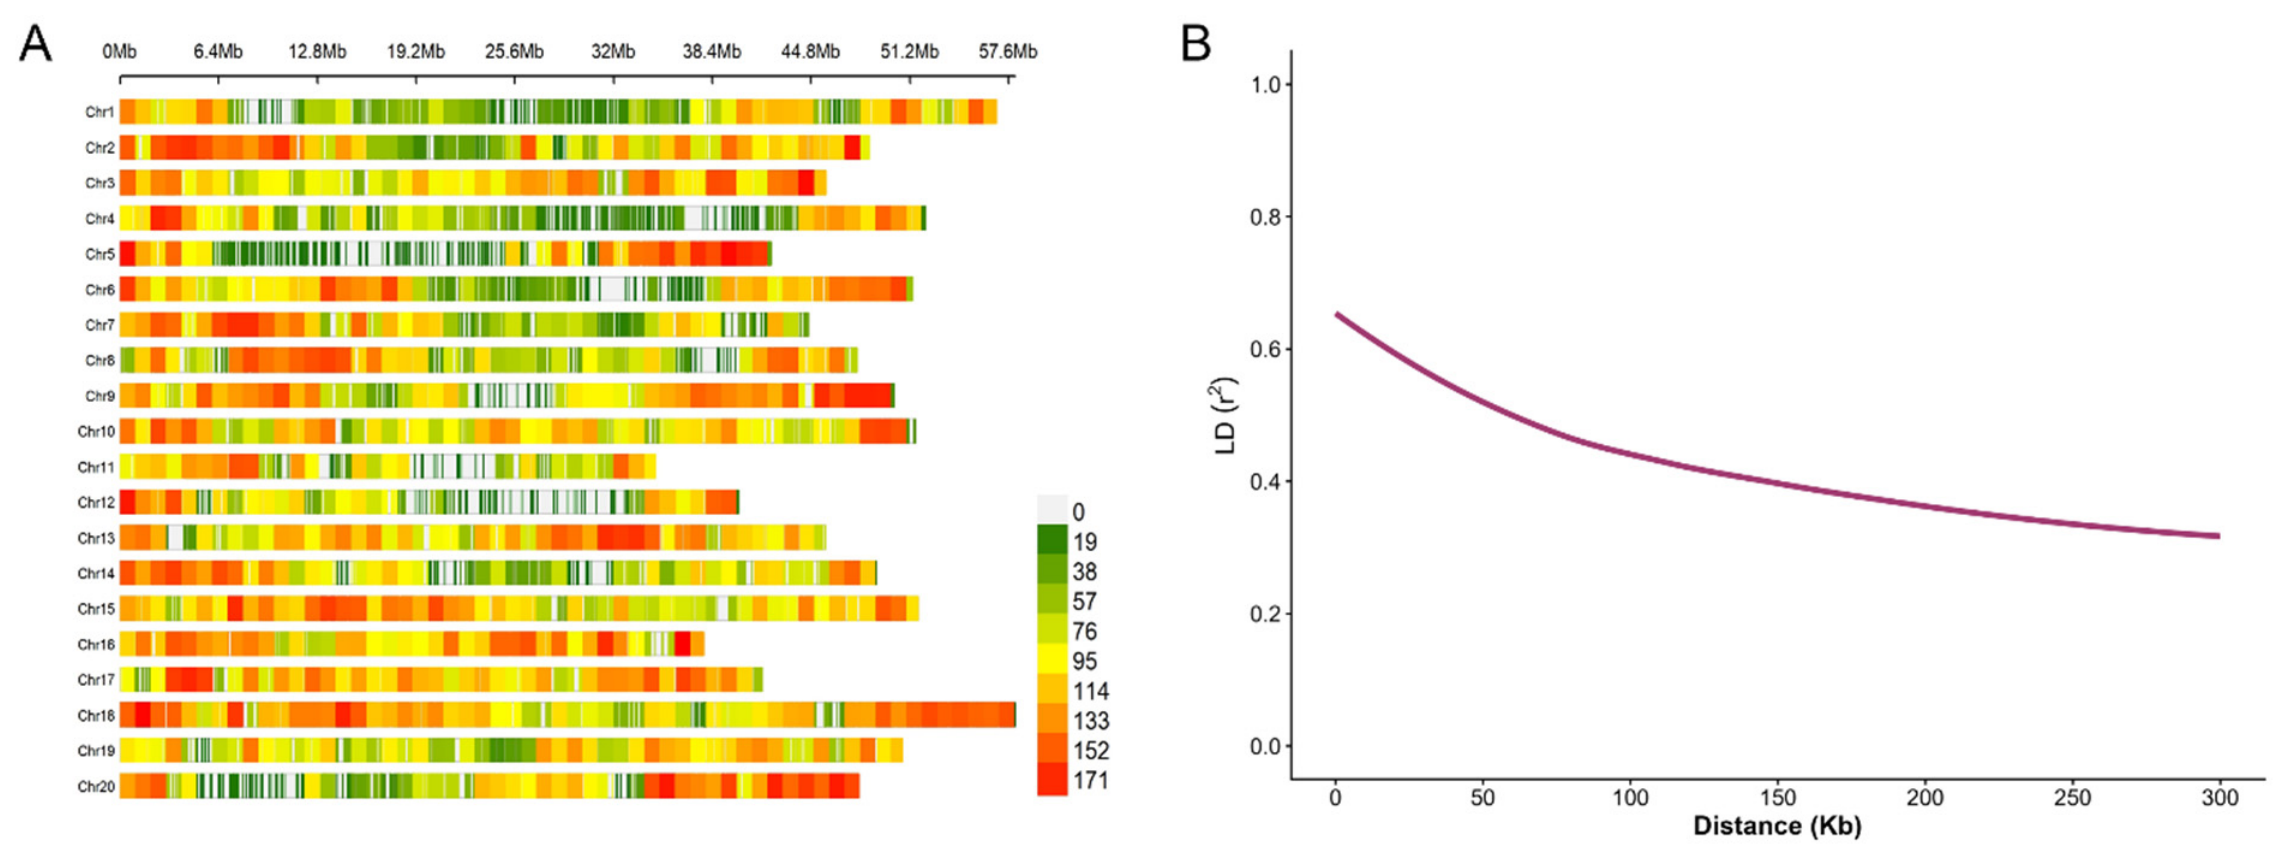
ZDX1 SNP array genotyping across all 256 accessions initially yielded 159,064 SNPs (Figure 3A). Following PLINK-based filtering for missing rate and minor allele frequency, 89,361 SNPs were retained for GWAS.

3.4. Linkage Disequilibrium

PopLDdecay analysis showed that r2 declined with increasing physical distance, from an initial r2 of approximately 1.0 to half of its maximum value (r2 ≈ 0.5) at approximately 50 kb (Figure 3B), which was defined as the LD decay distance for candidate gene interval definition.

3.5. Population Structure Analysis Based on Clustering, Phylogeny, and Principal Components

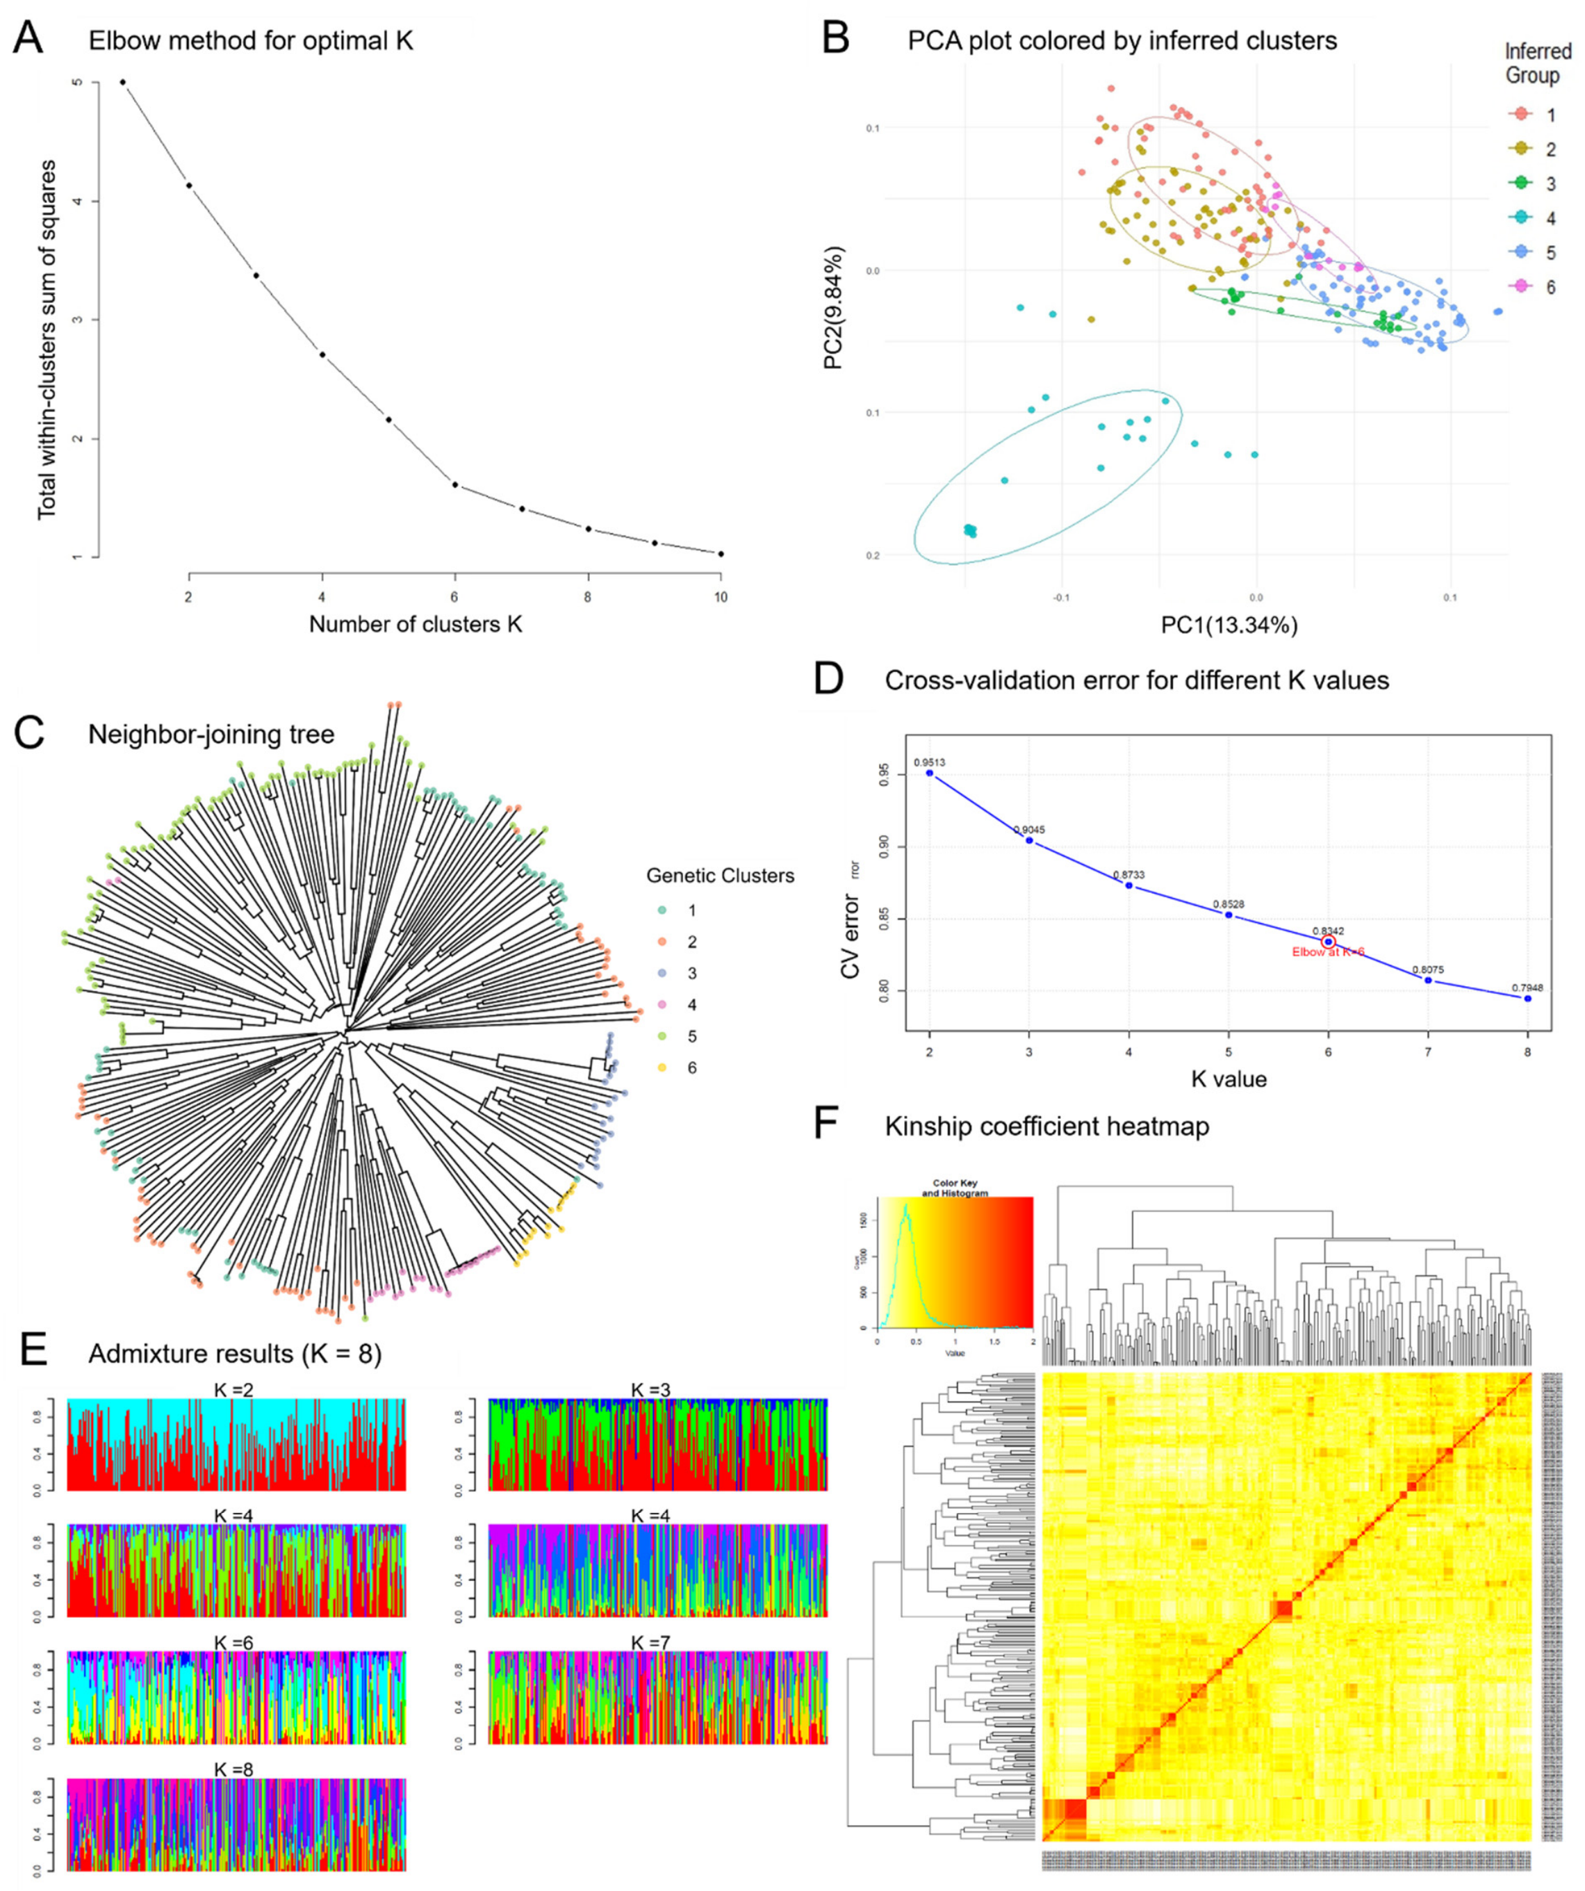
Four complementary methods were employed to characterize the structure of this population. K-means clustering with the elbow method showed an inflection point in the within-cluster sum of squares at K = 6, taken as the clustering solution (Figure 4A). PCA was consistent with this result, showing genetic stratification in which PC1 and PC2 explained 13.34% and 9.84% of total genetic variation, respectively, with accessions forming six discernible clusters in PC1–PC2 space (Figure 4B). NJ phylogenetic analysis independently grouped all accessions into six distinct branches (Figure 4C). ADMIXTURE analysis produced a broadly concordant outcome (Figure 4D,E): cross-validation error declined continuously with increasing K, but the rate of decrease plateaued beyond K = 6. Integrating this pattern with the results from K-means clustering, PCA, and NJ phylogenetic analysis, all supporting six subgroups, K = 6 was adopted as the optimal solution, with subpopulations 1 through 6 containing 17, 74, 24, 97, 14, and 30 accessions (Table S4), respectively. This subpopulation assignment was incorporated into all subsequent GWAS models. The kinship heatmap showed elevated relatedness among accessions within subpopulations alongside clear genetic differentiation between them (Figure 4F), consistent with within-group homogenization and between-group divergence.

3.6. Genome-Wide Association Study of Salt Tolerance-Related Traits

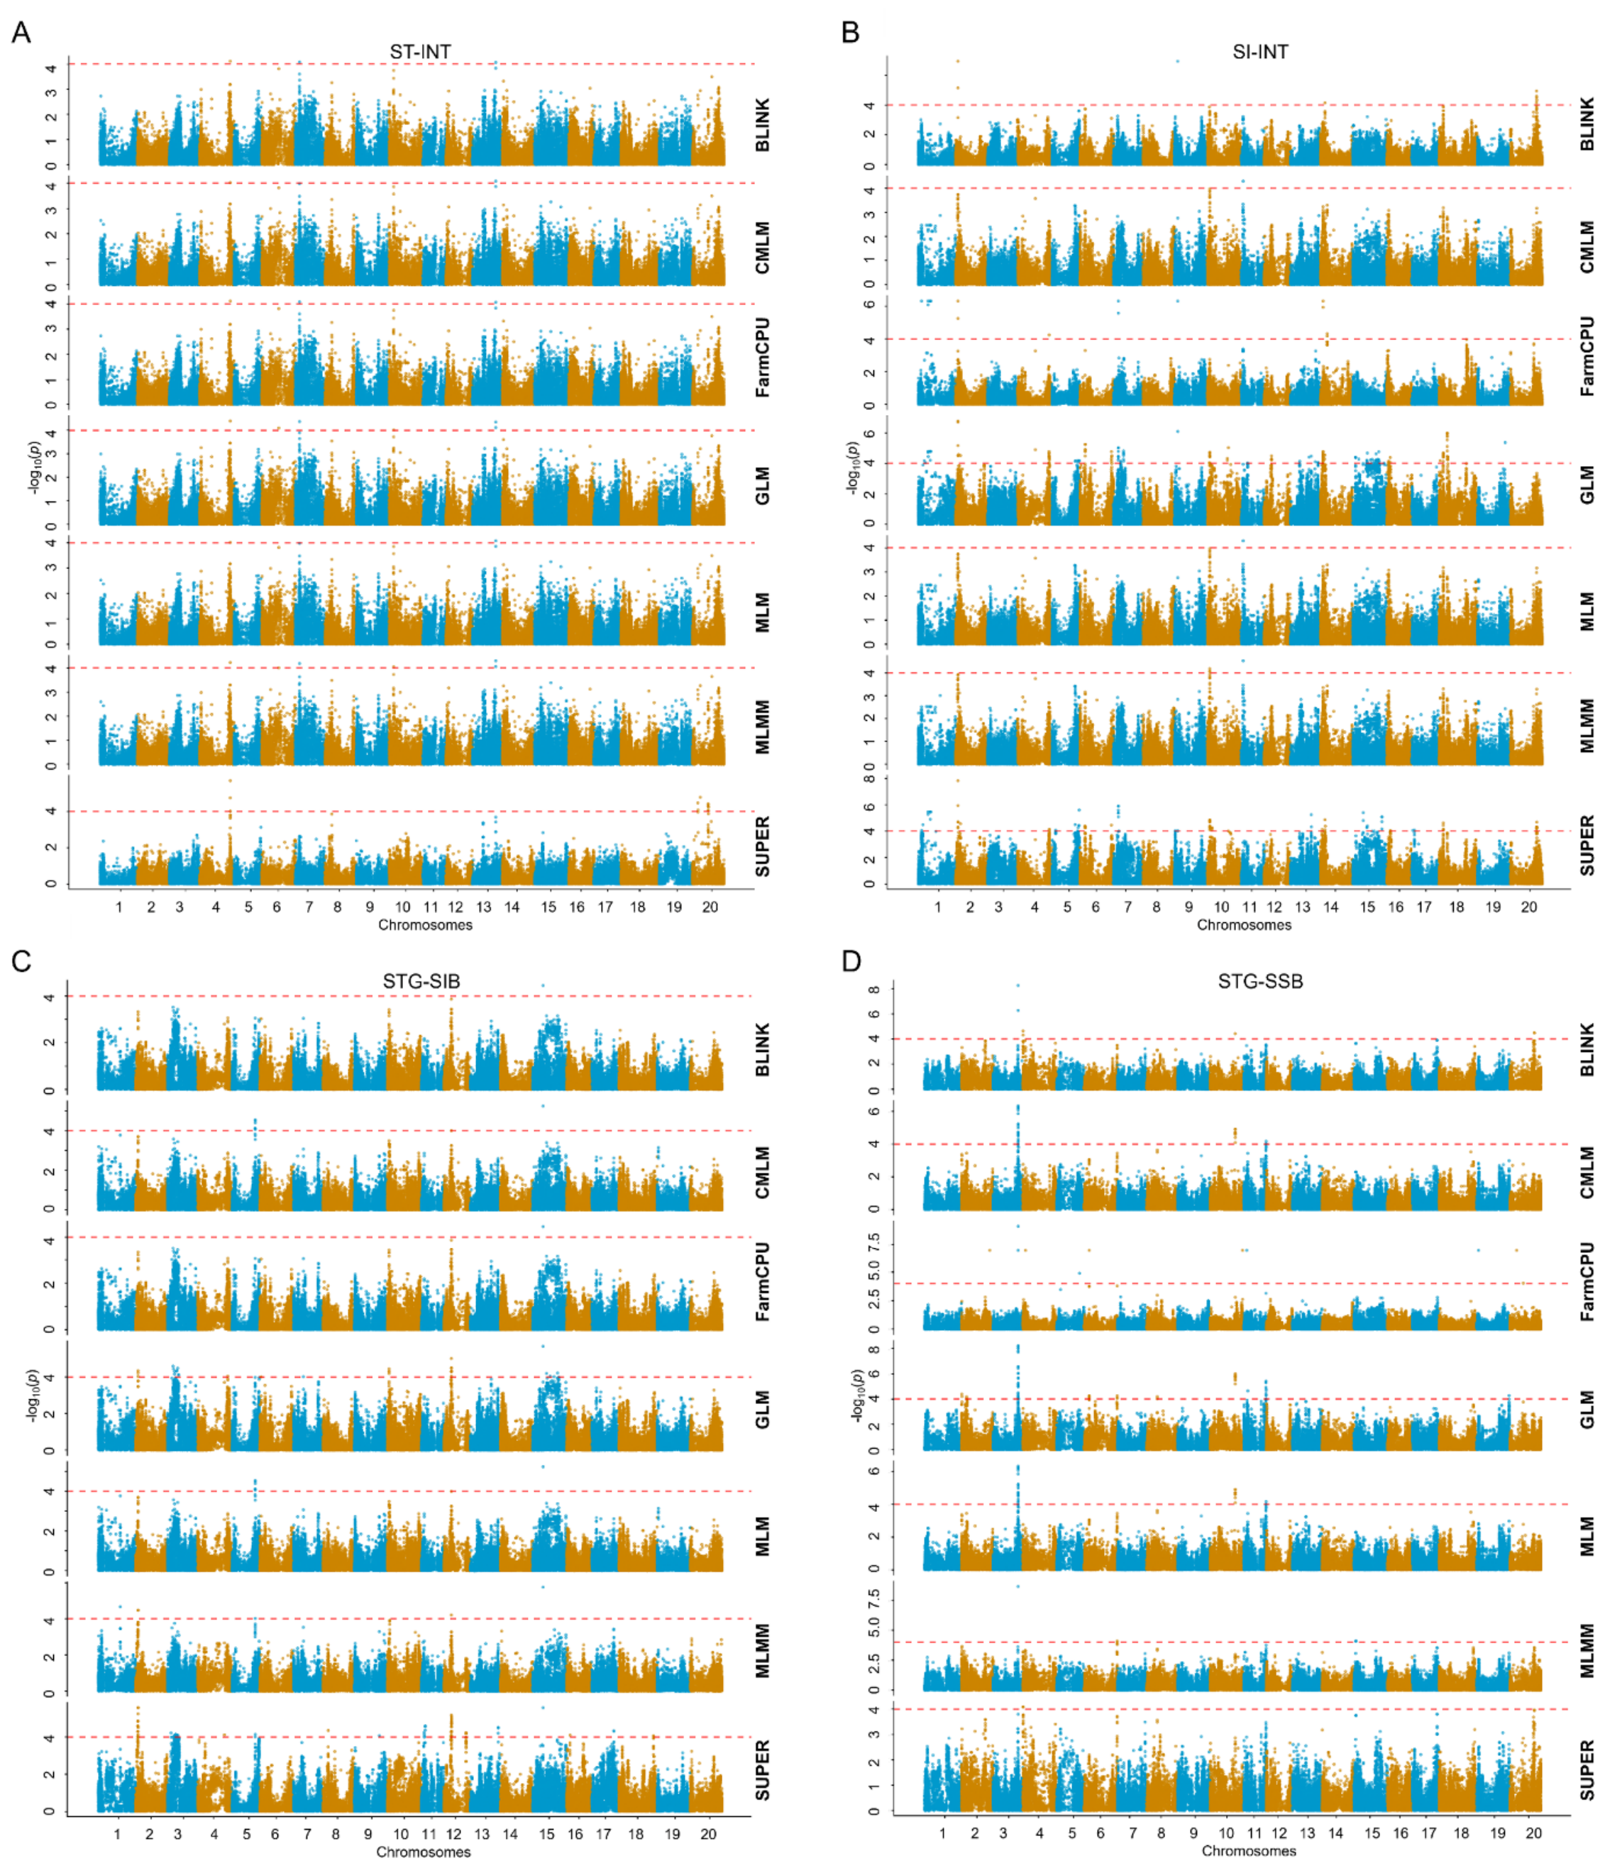
GWAS was performed on the GAPIT platform for all four transformed traits, ST-INT, SI-INT, STG-SIB, and STG-SSB, using the full SNP dataset. To minimize false positives, only loci detected by at least three of the seven association models were retained. This yielded 60 significant SNPs (Table S5), which were consolidated into 19 QTLs based on LD decay distance (~50 kb), with the number of SNPs per QTL ranging from 1 to 20 (Table 2; Figure 5 and Figure 6).
Three QTLs for the emergence-stage trait ST-INT were mapped to chromosomes 4, 7, and 13 (Table 2). The strongest signal was qST-INT-04 (Gm04_46793849) on chromosome 4 (−log10(P) = 5.7). The chromosome 13 locus qST-INT-13 (Gm13_35700100) was situated approximately 0.87 Mb from GmbZIP132 [46] and 1.39 Mb from GmBIN2 [47] (Table S6). GmbZIP132 encodes a bZIP transcription factor induced by salt and drought that increases salt tolerance at seed germination [46], whereas GmBIN2 encodes a GSK3-type kinase also induced by both stresses and a positive regulator of stress tolerance [47].
Ten QTLs for the emergence-stage trait SI-INT were identified across chromosomes 1 (four loci), 2, 7, 9, 10, 11, and 14 (Table 2). The strongest signal came from qSI-INT-02 (Gm02_3640916–Gm02_3649811) on chromosome 2, spanning two SNPs. The chromosome 9 locus qSI-INT-09 (Gm09_5191652) mapped approximately 1.70 Mb from GmPHD6 [48] (Table S6), whose overexpression in soybean hairy roots enhances salt tolerance while knockout increases sensitivity. The chromosome 10 locus qSI-INT-10 (Gm10_3521576–Gm10_3614887) lay approximately 2.54 Mb from GmWRKY54 [49] and 2.14 Mb from GmERF75 [50] (Table S6), both implicated in salt tolerance. The chromosome 14 locus qSI-INT-14 (Gm14_6728116) was located 0.76 Mb from a previously reported marker associated with GsPRX, a gene involved in oxidative stress responses [51] (Table S6). Each of these distances exceeds the LD decay distance estimated for this population (~50 kb), so the reported genes lie outside the linkage disequilibrium blocks of the associated loci and are not proposed here as causal.
Three QTLs for the emergence-stage binary trait STG-SIB were detected on chromosomes 5, 12, and 15 (Table 2), with qSTG-SIB-15 (Gm15_15831968) on chromosome 15 producing the strongest signal (−log10(P) = 5.74).
Three QTLs for the seedling-stage trait STG-SSB were mapped to chromosomes 3, 10, and 11 (Table 2). The chromosome 3 locus, qSTG-SSB-03 (Gm03_38525925–Gm03_38815291), was the most prominent, spanning a 0.29 Mb interval supported by 20 SNPs, with peak signal at Gm03_38688580 (−log10(P) = 9.08). This QTL lies approximately 192 kb from Glyma03g32900 (GmSALT3/GmCHX1), the major seedling-stage salt tolerance gene cloned independently by Guan et al. [24] and Qi et al. [23] (Table S6). This distance exceeds the LD decay threshold (~50 kb), indicating that qSTG-SSB-03 and GmSALT3 likely reside in distinct LD blocks. qSTG-SSB-03 is therefore treated here as a locus separate from GmSALT3, and haplotype analysis across the interval would test whether the two signals are independent.

3.7. Candidate Gene Analysis

To refine candidate intervals and clarify local haplotype structure, candidate gene identification focused on qSI-INT-10 (Gm10_3521576–Gm10_3614887) for emergence-stage salt tolerance and qSTG-SSB-10 (Gm10_38386826–Gm10_38472859) for seedling-stage salt tolerance, the QTLs with the greatest number of significant SNPs outside the chromosome 3 locus. LDBlockShow analysis resolved seven LD blocks (Figure S5). For qSI-INT-10, a consistent LD block was detected with the GLM, MLMM, and SUPER models (Figure S5A–C), while for qSTG-SSB-10, the same block was identified in the BLINK, CMLM, GLM, and MLM models (Figure S5D–G).
From each stable LD block, the SNP with the highest −log10(P) value (i.e., the peak association SNP) was recorded as the peak association SNP, and protein-coding genes within the LD block boundaries extended by 50 kb on either side were taken as candidates, following the estimated LD decay distance. Within the emergence-stage QTL qSI-INT-10, 23 candidate genes were identified (Table 3), spanning functions including cell wall biosynthesis and remodeling (e.g., cellulose synthase A4 Glyma.10G039600 and the KATAMARI1 homolog Glyma.10G040700, encoding a xyloglucan galactosyltransferase), transcriptional regulation (e.g., MYB-family transcription factor APL homolog Glyma.10G039700 and auxin response factor 1 Glyma.10G040400), stress response and metabolism (e.g., glutathione S-transferase Glyma.10G040000 and alcohol dehydrogenase 1 Glyma.10G041000), and protein kinase activity and methylation (e.g., Glyma.10G041300 and Glyma.10G040100). For the seedling-stage QTL qSTG-SSB-10, 18 candidate genes were identified (Table 3), enriched for roles in DNA metabolism and repair (e.g., RecQ family helicase Glyma.10G148300, Werner syndrome-like exonuclease Glyma.10G148600, and single-stranded DNA-binding protein Glyma.10G149700) and stress response (e.g., drought-induced protein 19 Glyma.10G149200 and calmodulin-binding protein Glyma.10G148700), along with four uncharacterized proteins, two proteins annotated as unknown, and one protein of unknown function. Based on functional annotation and established relevance to salt stress, four genes, namely Glyma.10G040000, Glyma.10G148700, Glyma.10G149200, and Glyma.10G149600, were prioritized as putative candidate genes and are discussed below.

4. Discussion

Salt tolerance in soybean is developmentally stage-specific [52], and tolerance at germination often exceeds that at emergence. Timely post-sowing irrigation can reduce surface salinity and partially mitigate this vulnerability [53]. In soils with dry-weight salt content below 1.0%, emergence is reduced even when germination rates remain high across genotypes. This distinction is illustrated by the Williams cultivar, which maintained a germination rate of 81% at 330 mM NaCl, yet seedling growth fell to 5% under the lower concentration of 220 mM NaCl [54]. Under field conditions, seeds may germinate successfully in saline soil but fail to penetrate a salt-hardened surface crust. This underscores the need to evaluate salt tolerance, map relevant loci, and identify candidate genes specifically at the emergence stage.
Relatively few soybean salt-tolerance genes have been cloned through forward genetics to date, including the seedling-stage genes GmSALT3/GmCHX1 [23,24] and GsERD15B [55], and the germination-stage gene GmCDF1 [56]. Our GWAS yielded four putative candidate genes, one emergence-stage and three seedling-stage. The emergence-stage candidate Glyma.10G040000, located within qSI-INT-10, encodes a GST. GSTs are well-established contributors to plant salt tolerance, acting through ROS homeostasis and thereby limiting salt-induced oxidative damage; transgenic overexpression of GST genes increases salt tolerance [57]. MYB and WRKY transcription factors act upstream of GST expression, placing these enzymes within broader stress-response networks [58]. In soybean specifically, the tau-class member GmGSTU23 enhances salt tolerance through elevated glutathione transferase activity [59], suggesting that Glyma.10G040000 may increase tolerance through comparable biochemical activity in ROS detoxification. However, eFP Browser analysis showed low expression in roots and root hairs under normal conditions, warranting further investigation of its expression under salt stress.
The three seedling-stage putative candidate genes all map to qSTG-SSB-10. Glyma.10G148700 encodes a calmodulin-binding protein, which decodes salt-induced cytosolic Ca2+ transients and translates them into adaptive physiological responses. In rice, the calmodulin-binding protein OsMSR2 is induced by salt stress, and its overexpression in Arabidopsis increases tolerance through ABA signaling and downstream stress-response gene expression [60]. Conversely, the Medicago truncatula ortholog MtCML40 is a negative regulator: its overexpression increases salt sensitivity, accompanied by Na+ accumulation in shoots and suppression of the sodium efflux genes MtHKT1;1 and MtHKT1;2 [61]. The contrasting roles of these orthologs show that calmodulin-binding proteins act in the salt-stress response with species-dependent direction, which leaves the direction of any effect of Glyma.10G148700 open to testing. However, its expression in roots was low under normal conditions.
Glyma.10G149200 encodes drought-induced protein 19 (Di19), with documented roles in plant salt tolerance. In soybean, GmDi19-5 is a negative regulator that interacts with the E3 ubiquitin ligase GmPUB21 and is degraded in an ABA-dependent manner, enabling fine-tuned modulation of stress responses [62]. In maize, ZmDi19-1 enhances salt tolerance by activating downstream stress-responsive genes and increasing antioxidant capacity [63], while in cotton, GhDi19-3 and GhDi19-4 improve salt tolerance through Ca2+ and ABA signaling and concurrent ROS scavenging [64]. Di19 proteins therefore function where several stress pathways converge, which supports Glyma.10G149200 as a candidate for salt tolerance. Moderate basal expression in roots is consistent with a potential role in stress signal transduction.
Glyma.10G149600 encodes a PP2C family protein. In Arabidopsis, PP2Cs are negative regulators of ABA signaling and can directly interact with and inhibit the plasma membrane Na+/H+ antiporter SOS1, a sodium efflux transporter [65]. In peanut, PP2C genes including AhPP2C45 and AhPP2C134 are upregulated under salt stress [66]. Through direct action on sodium transport and compartmentalization, PP2Cs function in adaptation to saline environments, which supports a role for Glyma.10G149600 in soybean salt tolerance. Expression peaked in root tips, a site of salt perception, and increased following rhizobium inoculation at 12 and 48 h, consistent with the stress-responsive expression pattern reported for PP2C genes in other species.
These candidate genes await experimental validation, and their roles in soybean salt tolerance should be tested through salt-stress expression profiling and functional assays via transgenic or gene-editing approaches. Moreover, the QTLs reported here were identified under controlled NaCl conditions and may not fully reflect the genetic architecture of tolerance to complex saline–alkaline soils in the field. Field transferability of these loci warrants validation through multi-environment trials prior to marker-assisted breeding deployment.
Beyond gene discovery, translating genomic findings into practical breeding requires broader consideration of how and when salt stress is evaluated. Unlike many abiotic stresses, salt-alkali stress persists throughout most or all of the crop growth cycle [67]. Current soybean salt-tolerance research is often focused on seedlings, assuming that early vegetative vigor reliably predicts agronomic performance. This assumption does not always hold, as excessive salinity can redirect photosynthate from growth to stress tolerance. Indeed, some salt-tolerant genotypes show early vigor comparable to sensitive genotypes yet outperform them under field conditions [53]. Multi-stage field evaluation therefore carries information that single-stage assays do not. Furthermore, most laboratory assays use NaCl as the sole treatment, while salinized soils worldwide vary widely in pH and ionic composition [68]. Salinization and alkalization frequently co-occur, yet their combined effects on plant growth are not additive. The severity ranking from greatest to least is saline–alkaline stress, alkaline stress, then salt stress alone, and mixed saline–alkaline injury substantially exceeds the sum of the individual stresses [69,70]. As research on mixed saline–alkaline tolerance remains limited, future efforts should extend beyond single-salt or single-alkali treatments to encompass the complex stress combinations encountered in the field.

5. Conclusions

GWAS combining ZDX1 SNP array data from 256 soybean accessions with salt-tolerance phenotypes at emergence and seedling stages identified 60 significant SNPs consolidated into 19 QTLs, with 16 associated with emergence-stage and 3 with seedling-stage salt tolerance. Previously reported stress-tolerance genes reside within the broader chromosomal regions of 5 of these QTLs; the seedling-stage QTL qSTG-SSB-03 lies 192 kb from the major salt-tolerance gene GmSALT3. This distance is beyond the linkage disequilibrium decay of this population. Four putative candidate genes were prioritized: the emergence-stage gene Glyma.10G040000, encoding a glutathione S-transferase, and the seedling-stage genes Glyma.10G148700, Glyma.10G149200, and Glyma.10G149600, encoding a calmodulin-binding protein, drought-induced protein 19, and a PP2C family protein, respectively. These candidates await experimental validation through gene expression analysis and functional assays.

Supplementary Materials

The following supporting information can be downloaded at: https://www.mdpi.com/article/10.3390/biology15161409/s1, Figure S1: Representative phenotypes of each salt tolerance grade at the emergence stage; Figure S2: Representative phenotypes of salt-injury symptoms at the seedling stage; Figure S3: Analysis of variance of soybean emergence rate for salt treatment and control; Figure S4: Phenotypic distributions of salt tolerance traits. Frequency histograms for ST-INT (A) and SI-INT (B); bar charts for STG-SIB (C) and STG-SSB (D); Figure S5: Candidate regions for qSI-INT-10 (SI-INT) in the GLM, MLMM, and SUPER models (A–C) and for qSTG-SSB-10 (STG-SSB) in the GLM, MLM, CMLM, and BLINK models (D–G); Table S1: Detailed information for 256 soybean accessions; Table S2: Salt damage symptoms and salt tolerance index grades at soybean emergence stage under salt stress; Table S3: Grading criteria and corresponding salt-injury symptoms at the soybean seedling stage under salt stress; Table S4: Accessions were assigned to six subpopulations (Pop 1–6) based on ADMIXTURE analysis at K = 6; Table S5: SNPs significantly associated with salt-tolerance-related traits; Table S6: Previously reported stress-tolerance genes located near QTLs identified in this study.

Author Contributions

Z.L. and L.Q.: Conceptualization and Writing-Revision and editing, Z.L. and L.Q.: Resources, X.L., Z.L. and Y.J.: Investigation, X.L., Y.J., J.X., Y.G. and J.W.: Data curation and analysis, X.L., Z.L., Y.J., J.X., Y.G. and J.W.: Writing—Original draft. All authors have read and agreed to the published version of the manuscript.

Funding

This work was supported by the National Key R&D Program of China (2021YFD1201104), the Agricultural Science and Technology Innovation Program of the Chinese Academy of Agricultural Sciences (CAAS).

Institutional Review Board Statement

Not applicable.

Informed Consent Statement

Not applicable.

Data Availability Statement

The original data presented in the study are openly available at Supplementary Materials.

Conflicts of Interest

The authors declare no conflicts of interest.

References

  1. He, Y.; Chen, Y.; Yu, C.; Lu, K.; Jiang, Q.; Fu, J.; Wang, G.; Jiang, D. Photosynthesis and yield traits in different soybean lines in response to salt stress. Photosynthetica 2016, 54, 630–635. [Google Scholar] [CrossRef]
  2. Lu, M.; Riaz, M.; Tong, K.; Hao, W.; Yang, Y.; Zhao, X.; Wang, L.; Niu, Y.; Yan, L. Boron-induced phenylpropanoid metabolism, Na+/K+ homeostasis and antioxidant defense mechanisms in salt-stressed soybean seedlings. J. Hazard. Mater. 2025, 491, 138036. [Google Scholar] [CrossRef] [Scilit] [PubMed]
  3. Singleton, P.; Bohlool, B. Effect of salinity on nodule formation by soybean. Plant Physiol. 1984, 74, 72–76. [Google Scholar] [CrossRef] [Scilit] [PubMed]
  4. Ajay, S. Soil salinity: A global threat to sustainable development. Soil. Use Manag. 2022, 38, 39–67. [Google Scholar] [CrossRef] [Scilit]
  5. Liu, Y.; Wang, P.; Ruan, H.; Wang, T.; Yu, J.; Cheng, Y.; Kulmatoy, R. Sustainable use of groundwater resources in the transboundary aquifers of the five central Asian countries: Challenges and perspectives. Water 2020, 12, 2101. [Google Scholar] [CrossRef] [Scilit]
  6. Muchate, N.; Nikalje, G.; Rajurkar, N.; Suprasanna, P.; Nikam, T. Physiological responses of the halophyte Sesuvium portulacastrum to salt stress and their relevance for saline soil bio-reclamation. Flora 2016, 224, 96–105. [Google Scholar] [CrossRef] [Scilit]
  7. Radanielson, A.; Angeles, O.; Li, T.; Ismail, A.; Gaydon, D. Describing the physiological responses of different rice genotypes to salt stress using sigmoid and piecewise linear functions. Field Crops Res. 2018, 220, 46–56. [Google Scholar] [CrossRef] [Scilit] [PubMed]
  8. Sheng, X.; Ai, Z.; Tan, Y.; Hu, Y.; Guo, X.; Liu, X.; Sun, Z.; Yu, D.; Chen, J.; Tang, N.; et al. Novel salinity-tolerant third-generation hybrid rice developed via CRISPR/Cas9-mediated gene editing. Int. J. Mol. Sci. 2023, 24, 8025. [Google Scholar] [CrossRef] [Scilit] [PubMed]
  9. Fu, S.; Wang, L.; Li, C.; Zhao, Y.; Zhang, N.; Yan, L.; Li, C.; Niu, Y. Integrated transcriptomic, proteomic, and metabolomic analyses revealed molecular mechanism for salt resistance in soybean (Glycine max L.) seedlings. Int. J. Mol. Sci. 2024, 25, 13559. [Google Scholar] [CrossRef] [Scilit] [PubMed]
  10. EI-Hendawy, S.; Hu, Y.; Yakout, G.; Awad, A.; Hafiz, S.; Schmidhalter, U. Evaluating salt tolerance of wheat genotypes using multiple parameters. Eur. J. Agron. 2005, 22, 243–253. [Google Scholar] [CrossRef] [Scilit]
  11. Kingsbury, R.; Epstein, E. Selection for salt-resistant spring wheat. Crop Sci. 1984, 24, 310–315. [Google Scholar] [CrossRef] [Scilit]
  12. Manchanda, G.; Garg, N. Salinity and its effects on the functional biology of legumes. Acta Physiol. Plant 2008, 30, 595–618. [Google Scholar] [CrossRef] [Scilit]
  13. Vicente, O.; Boscaiu, M.; Naranjo, M.; Estrelles, E.; Belles, J.; Soriano, P. Responses to salt stress in the halophyte Plantago crassifolia (Plantaginaceae). J. Arid. Environ. 2004, 58, 463–481. [Google Scholar] [CrossRef] [Scilit]
  14. Francois, L.; Maas, E.; Donovan, T.; Youngs, V. Effect of salinity on grain-yield and quality, vegetative growth, and germination of semidwarf and durum-wheat. Agron. J. 1986, 78, 1053–1058. [Google Scholar] [CrossRef] [Scilit]
  15. Saisho, D.; Takumi, S.; Matsuoka, Y. Salt tolerance during germination and seedling growth of wild wheat Aegilops tauschii and its impact on the species range expansion. Sci. Rep. 2016, 6, 38554. [Google Scholar] [CrossRef] [Scilit] [PubMed]
  16. Shannon, M.; Grieve, C. Tolerance of vegetable crops to salinity. Sci. Hortic. 1999, 78, 5–38. [Google Scholar] [CrossRef] [Scilit]
  17. Morton, M.; Awlia, M.; Al-Tamimi, N.; Saade, S.; Pailles, Y.; Negrão, S.; Tester, M. Salt stress under the scalpel-dissecting the genetics of salt tolerance. Plant J. 2019, 97, 148–163. [Google Scholar] [CrossRef] [Scilit] [PubMed]
  18. Lee, G.J.; Carter, T.E.; Villagarcia, M.R.; Li, Z.; Zhou, X.; Gibbs, M.O.; Boerma, H.R. A major QTL conditioning salt tolerance in S-100 soybean and descendent cultivars. Theor. Appl. Genet. 2004, 109, 1610–1619. [Google Scholar] [CrossRef] [Scilit] [PubMed]
  19. Chen, H.; Cui, S.; Fu, S.; Gai, J.; Yu, D. Identification of quantitative trait loci associated with salt tolerance during seedling growth in soybean (Glycine max L.). Aust. J. Agric. Res. 2008, 59, 1086–1091. [Google Scholar] [CrossRef] [Scilit]
  20. Do, T.D.; Vuong, T.D.; Dunn, D.; Smothers, S.; Patil, G.; Yungbluth, D.C.; Chen, P.; Scaboo, A.; Xu, D.; Carter, T.E.; et al. Mapping and confirmation of loci for salt tolerance in a novel soybean germplasm, Fiskeby III. Theor. Appl. Genet. 2018, 131, 513–524. [Google Scholar] [CrossRef] [Scilit] [PubMed]
  21. Hamwieh, A.; Tuyen, D.; Cong, H.; Benitez, E.; Takahashi, R.; Xu, D. Identification and validation of a major QTL for salt tolerance in soybean. Euphytica 2011, 179, 451–459. [Google Scholar] [CrossRef] [Scilit]
  22. Shi, X.; Yan, L.; Yang, C.; Yan, W.; Moseley, D.O.; Wang, T.; Liu, B.; Di, R.; Chen, P.; Zhang, M. Identification of a major quantitative trait locus underlying salt tolerance in ‘Jidou 12’ soybean cultivar. BMC Res. Notes 2018, 11, 95. [Google Scholar] [CrossRef] [Scilit] [PubMed]
  23. Qi, X.; Li, M.; Xie, M.; Liu, X.; Ni, M.; Shao, G.; Song, C.; Yim, A.K.Y.; Tao, Y.; Wong, F.L.; et al. Identification of a novel salt tolerance gene in wild soybean by whole-genome sequencing. Nat. Commun. 2014, 5, 4340. [Google Scholar] [CrossRef] [Scilit] [PubMed]
  24. Guan, R.X.; Qu, Y.; Guo, Y.; Yu, L.; Liu, Y.; Jiang, J.; Chen, J.; Ren, Y.; Liu, G.; Tian, L.; et al. Salinity tolerance in soybean is modulated by natural variation in GmSALT3. Plant J. 2014, 80, 937–950. [Google Scholar] [CrossRef] [Scilit] [PubMed]
  25. Li, Y.; Ye, H.; Vuong, T.D.; Zhou, L.; Do, T.D.; Chhapekar, S.S.; Zhao, W.; Li, B.; Jin, T.; Gu, J.; et al. A novel natural variation in the promoter of GmCHX1 regulates the conditional gene expression to improve salt tolerance in soybean. J. Exp. Bot. 2023, 75, 1051–1062. [Google Scholar] [CrossRef] [Scilit] [PubMed]
  26. Hu, D.; Zhao, Y.; Zhu, L.; Li, X.; Zhang, J.; Cui, X.; Li, W.; Hao, D.; Yang, Z.; Wu, F.; et al. Genetic dissection of ten photosynthesis-related traits based on InDel-and SNP-GWAS in soybean. Theor. Appl. Genet. 2024, 137, 96. [Google Scholar] [CrossRef] [Scilit] [PubMed]
  27. Jang, S.; Park, S.; Lar, S.; Zhang, H.; Lee, A.; Cao, F.; Seo, J.; Ham, T.; Lee, J.; Kwon, S. Genome-wide association study (GWAS) of mesocotyl length for direct seeding in rice. Agronomy 2021, 11, 2527. [Google Scholar] [CrossRef] [Scilit]
  28. Sahito, J.; Zhang, H.; Gishkori, Z.; Ma, C.; Wang, Z.; Ding, D.; Zhang, X.; Tang, J. Advancements and prospects of genome-wide association studies (GWAS) in maize. Int. J. Mol. Sci. 2024, 25, 1918. [Google Scholar] [CrossRef] [Scilit] [PubMed]
  29. Shi, H.; Zhang, W.; Cao, H.; Zhai, L.; Song, Q.; Xu, J. Identification of candidate genes for cold tolerance at seedling stage by GWAS in rice (Oryza sativa L.). Biology 2024, 13, 784. [Google Scholar] [CrossRef] [Scilit] [PubMed]
  30. Xiong, H.; Chen, Y.; Ravelombola, W.; Mou, B.; Sun, X.; Zhang, Q.; Xiao, Y.; Tian, Y.; Luo, Q.; Alatawi, I.; et al. Genetic dissection of diverse seed coat patterns in cowpea through a comprehensive GWAS approach. Plants 2024, 13, 1275. [Google Scholar] [CrossRef] [Scilit] [PubMed]
  31. Zhang, F.; Xiao, X.; Xu, K.; Cheng, X.; Xie, T.; Hu, J.; Wu, X. Genome-wide association study (GWAS) reveals genetic loci of lead (Pb) tolerance during seedling establishment in rapeseed (Brassica napus L.). BMC Genom. 2020, 21, 139. [Google Scholar] [CrossRef] [Scilit] [PubMed]
  32. Wang, L.; Yang, Y.; Qin, J.; Ma, Q.; Qiao, K.; Fan, S.; Qu, Y. Integrative GWAS and transcriptomics reveal GhAMT2 as a key regulator of cotton resistance to Verticillium wilt. Front. Plant Sci. 2025, 16, 1563466. [Google Scholar] [CrossRef] [Scilit] [PubMed]
  33. He, F.; Xu, M.; Liu, H.; Xu, Y.; Long, R.; Kang, J.; Yang, Q.; Chen, L. Unveiling alfalfa root rot resistance genes through an integrative GWAS and transcriptome study. BMC Plant Biol. 2025, 25, 58. [Google Scholar] [CrossRef] [Scilit] [PubMed]
  34. Li, D.; Dossa, K.; Zhang, Y.; Wei, X.; Wang, L.; Zhang, Y.; Liu, A.; Zhou, R.; Zhang, X. GWAS uncovers differential genetic bases for drought and salt tolerances in sesame at the germination stage. Genes 2018, 9, 87. [Google Scholar] [CrossRef] [Scilit] [PubMed]
  35. Li, B. Identification of genes conferring plant salt tolerance using GWAS: Current success and perspectives. Plant Cell Physiol. 2020, 61, 1419–1426. [Google Scholar] [CrossRef] [Scilit] [PubMed]
  36. Kan, G.; Zhang, W.; Yang, W.; Ma, D.; Zhang, D.; Hao, D.; Hu, Z.; Yu, D. Association mapping of soybean seed germination under salt stress. Mol. Genet. Genom. 2015, 290, 2147–2162. [Google Scholar] [CrossRef] [Scilit] [PubMed]
  37. Wang, J.; Zhou, M.; Zhang, H.; Liu, X.; Zhang, W.; Wang, Q.; Jia, Q.; Xu, D.; Chen, H.; Su, C. A genome-wide association analysis for salt tolerance during the soybean germination stage and development of KASP markers. Front. Plant Sci. 2024, 15, 1352465. [Google Scholar] [CrossRef] [Scilit] [PubMed]
  38. Do, T.D.; Vuong, T.D.; Dunn, D.; Clubb, M.; Valliyodan, B.; Patil, G.; Chen, P.; Xu, D.; Nguyen, H.T.; Shannon, J.G. Identification of new loci for salt tolerance in soybean by high-resolution genome-wide mapping. BMC Genom. 2019, 20, 318. [Google Scholar] [CrossRef] [Scilit] [PubMed]
  39. Dong, L.; Hou, Z.; Li, H.; Li, Z.; Fang, C.; Kong, L.; Li, Y.; Du, H.; Li, T.; Wang, L.; et al. Agronomical selection on loss-of-function of GIGANTEA simultaneously facilitates soybean salt tolerance and early maturity. J. Integr. Plant Biol. 2022, 64, 1866–1882. [Google Scholar] [CrossRef] [Scilit] [PubMed]
  40. Pruthi, R.; Chaudhary, C.; Chapagain, S.; Abozaid, M.M.E.; Rana, P.; Kondi, R.K.R.; Fritsche-Neto, R.; Subudhi, P.K. Deciphering the genetic basis of salinity tolerance in a diverse panel of cultivated and wild soybean accessions by genome-wide association mapping. Theor. Appl. Genet. 2024, 137, 238. [Google Scholar] [CrossRef] [Scilit] [PubMed]
  41. Liu, X.X.; Chang, R.Z.; Guan, R.X.; Qiu, L.J. Establishment of salt tolerance identification method at soybean seedling emergence stage and screening of salt-tolerant germplasm. Acta Agron. Sin. 2020, 46, 1–8. [Google Scholar]
  42. Liu, X.X. Development and Utilization of Marker for Salt-Tolerant Gene GmSALT3 and Identification of Salt-Tolerant QTL at Seedling Emergence Stage in Soybean. Master’s Thesis, Chinese Academy of Agricultural Sciences, Beijing, China, 2019. [Google Scholar]
  43. Zachary, R.; Jacqueline, M.; Richa, S.; Susan, R.; Lin, X. Operating characteristics of the rank-based inverse normal transformation for quantitative trait analysis in genome-wide association studies. Biometr 2020, 76, 1262–1272. [Google Scholar] [CrossRef] [Scilit] [PubMed]
  44. Bi, W.; Zhou, W.; Zhang, P.; Sun, Y.; Yue, W.; Lee, S. Scalable mixed model methods for set-based association studies on large-scale categorical data analysis and its application to exome-sequencing data in UK Biobank. Am. J. Hum. Genet. 2023, 110, 762–773. [Google Scholar] [CrossRef] [Scilit] [PubMed]
  45. Sun, R.; Sun, B.; Tian, Y.; Su, S.; Zhang, Y.; Zhang, W.; Wang, J.; Yu, P.; Guo, B.; Li, H.; et al. Dissection of the practical soybean breeding pipeline by developing ZDX1, a high-throughput functional array. Theor. Appl. Genet. 2022, 135, 1413–1427. [Google Scholar] [CrossRef] [Scilit] [PubMed]
  46. Liao, Y.; Zhang, J.; Chen, S.; Zhang, W. Role of soybean GmbZIP132 under abscisic acid and salt stresses. Plant Physiol. Biochem. 2008, 50, 221–230. [Google Scholar] [CrossRef] [Scilit] [PubMed]
  47. Wang, L.; Chen, Q.; Xin, D.; Qi, Z.; Zhang, C.; Li, S.; Jin, Y.; Li, M.; Mei, H.; Su, A.; et al. Overexpression of GmBIN2, a soybean glycogen synthase kinase 3 gene, enhances tolerance to salt and drought in transgenic Arabidopsis and soybean hairy roots. J. Integr. Agric. 2018, 17, 1959–1971. [Google Scholar] [CrossRef] [Scilit]
  48. Wei, W.; Tao, J.; Chen, H.; Li, Q.; Zhang, W.; Ma, B.; Lin, Q.; Zhang, J.; Chen, S. A histone code reader and a transcriptional activator interact to regulate genes for salt tolerance. Plant Physiol. 2017, 175, 1304–1320. [Google Scholar] [CrossRef] [Scilit] [PubMed]
  49. Wei, W.; Liang, D.; Bian, X.; Shen, M.; Xiao, J.; Zhang, W.; Ma, B.; Lin, Q.; Lv, J.; Chen, X.; et al. GmWRKY54 improves drought tolerance through activating genes in abscisic acid and Ca2+ signaling pathways in transgenic soybean. Plant J. 2019, 100, 384–398. [Google Scholar] [CrossRef] [Scilit] [PubMed]
  50. Zhao, M.; Yin, L.; Liu, Y.; Ma, J.; Zheng, J.; Lan, J.; Fu, J.; Chen, M.; Xu, Z.; Ma, Y. The ABA-induced soybean ERF transcription factor gene GmERF75 plays a role in enhancing osmotic stress tolerance in Arabidopsis and soybean. BMC Plant Biol. 2019, 19, 506. [Google Scholar] [CrossRef] [Scilit] [PubMed]
  51. Jin, T.; Sun, Y.; Zhao, R.; Shan, Z.; Gai, J.; Li, Y. Overexpression of peroxidase gene GsPRX9 confers salt tolerance in soybean. Int. J. Mol. Sci. 2019, 20, 3745. [Google Scholar] [CrossRef] [Scilit] [PubMed]
  52. Shelke, D.B.; Pandey, M.; Nikalje, G.C.; Zaware, B.N.; Suprasanna, P.; Nikam, T.D. Salt responsive physiological, photosynthetic and biochemical attributes at early seedling stage for screening soybean genotypes. Plant Physiol. Biochem. 2017, 118, 519. [Google Scholar] [CrossRef] [Scilit] [PubMed]
  53. Liu, Y.; Yu, L.L.; Qu, Y.; Chen, J.L.; Liu, X.X.; Hong, H.L.; Liu, Z.X.; Chang, R.Z.; Gilliham, M.; Qiu, L.J.; et al. GmSALT3, which confers improved soybean salt tolerance in the field, increases leaf Cl- exclusion prior to Na+ Exclusion but does not improve early vigor under salinity. Front. Plant Sci. 2016, 7, 1485. [Google Scholar] [CrossRef] [Scilit] [PubMed]
  54. Hosseini, M.K.; Powell, A.A.; Bingham, I.J. Comparison of the seed germination and early seedling growth of soybean in saline conditions. Seed Sci. Res. 2002, 12, 165–172. [Google Scholar] [CrossRef] [Scilit]
  55. Jin, T.; Sun, Y.; Shan, Z.; He, J.; Wang, N.; Gai, J.; Li, Y. Natural variation in the promoter of GsERD15B affects salt tolerance in soybean. Plant Biotechnol. J. 2021, 19, 1155–1169. [Google Scholar] [CrossRef] [Scilit] [PubMed]
  56. Zhang, W.; Liao, X.; Cui, Y.; Ma, W.; Zhang, X.; Du, H.; Ma, Y.; Ning, L.; Wang, H.; Huang, F.; et al. A cation diffusion facilitator, GmCDF1, negatively regulates salt tolerance in soybean. PLoS Genet. 2019, 15, e1007798. [Google Scholar] [CrossRef] [Scilit] [PubMed]
  57. Meng, H.; Zhao, J.; Yang, Y.; Diao, K.; Zheng, G.; Li, T.; Dai, X.; Li, J. PeGSTU58, a glutathione s-transferase from Populus euphratica, enhances salt and drought stress tolerance in transgenic Arabidopsis. Int. J. Mol. Sci. 2023, 24, 9354. [Google Scholar] [CrossRef] [Scilit] [PubMed]
  58. Yuan, L.; Dang, J.; Zhang, J.; Wang, L.; Zheng, H.; Li, G.; Li, J.; Zhou, F.; Khan, A.; Zhang, Z.; et al. A glutathione S-transferase regulates lignin biosynthesis and enhances salt tolerance in tomato. Plant Physiol. 2024, 196, 2989–3006. [Google Scholar] [CrossRef] [Scilit] [PubMed]
  59. Li, X.; Pang, Y.; Zhong, Y.; Cai, Z.; Ma, Q.; Wen, K.; Nian, H. GmGSTU23 encoding a tau class glutathione s-transferase protein enhances the salt tolerance of soybean (Glycine max L.). Int. J. Mol. Sci. 2023, 24, 5547. [Google Scholar] [CrossRef] [Scilit] [PubMed]
  60. Xu, G.; Rocha, P.; Wang, M.; Xu, M.; Cui, Y.; Li, L.; Zhu, Y.; Xia, X. A novel rice calmodulin-like gene, OsMSR2, enhances drought and salt tolerance and increases ABA sensitivity in Arabidopsis. Plant 2022, 234, 47–59. [Google Scholar]
  61. Zhang, X.; Wang, T.; Liu, M.; Sun, W.; Zhang, W. Calmodulin-like gene MtCML40 is involved in salt tolerance by regulating MtHKTs transporters in Medicago truncatula. Environ. Exp. Bot. 2019, 157, 79–90. [Google Scholar] [CrossRef] [Scilit]
  62. Yang, Y.; Ren, R.; Karthikeyan, A.; Yin, J.; Jin, T.; Fang, F.; Cai, H.; Liu, M.; Wang, D.; Zhi, H.; et al. The soybean GmPUB21-interacting protein GmDi19-5 responds to drought and salinity stresses via an ABA-dependent pathway. Crop J. 2023, 11, 1152–1162. [Google Scholar] [CrossRef] [Scilit]
  63. Zhang, X.; Cai, H.; Lu, M.; Wei, Q.; Xu, L.; Bo, C.; Ma, Q.; Zhao, Y.; Cheng, B. A maize stress-responsive Di19 transcription factor, ZmDi19-1, confers enhanced tolerance to salt in transgenic Arabidopsis. Plant Cell Rep. 2019, 38, 1563–1578. [Google Scholar] [CrossRef] [Scilit] [PubMed]
  64. Zhao, L.; Li, Y.; Li, Y.; Chen, W.; Yao, J.; Fang, S.; Lv, Y.; Zhang, Y.; Zhu, S. Systematical characterization of the cotton Di19 gene family and the role of GhDi19-3 and GhDi19-4 as two negative regulators in response to salt stress. Antioxidants 2022, 11, 2225. [Google Scholar] [CrossRef] [Scilit] [PubMed]
  65. Fu, H.; Yu, X.; Jiang, Y.; Wang, Y.; Yang, Y.; Chen, S.; Chen, Q.; Guo, Y. SALT OVERLY SENSITIVE 1 is inhibited by clade D Protein phosphatase 2C D6 and D7 in Arabidopsis thaliana. Plant Cell 2023, 35, 279–297. [Google Scholar] [CrossRef] [Scilit] [PubMed]
  66. Wu, Z.; Luo, L.; Wan, Y.; Liu, F. Genome-wide characterization of the PP2C gene family in peanut (Arachis hypogaea L.) and the identification of candidate genes involved in salinity-stress response. Front. Plant Sci. 2023, 14, 1093913. [Google Scholar] [CrossRef] [Scilit] [PubMed]
  67. Ha, B.K.; Vuong, T.D.; Velusamy, V.; Nguyen, H.T.; Shannon, J.G.; Lee, J.D. Genetic mapping of quantitative trait loci conditioning salt tolerance in wild soybean (Glycine soja) PI 483463. Euphytica 2013, 193, 79–88. [Google Scholar] [CrossRef] [Scilit]
  68. Rengasamy, P. Soil processes affecting crop production in salt-affected soils. Funct. Plant Biol. 2010, 37, 613–620. [Google Scholar] [CrossRef] [Scilit]
  69. Gong, B.; Wang, X.F.; Wei, M.; Li, Y.; Shi, Q.H. Overexpression of S-adenosylmethionine synthetase 1 enhances tomato callus tolerance to alkali stress through polyamine and hydrogen peroxide cross-linked networks. Plant Cell Tissue Organ. Cult. 2016, 124, 377–391. [Google Scholar] [CrossRef] [Scilit]
  70. Wang, X.P.; Jiang, P.; Ma, Y.; Geng, S.J.; Wang, S.C.; Shi, D.C. Physiological strategies of sunflower exposed to salt or alkali stresses: Restriction of ion transport in the cotyledon node zone and solute accumulation. Agron. J. 2015, 107, 2181–2192. [Google Scholar] [CrossRef] [Scilit]
Figure 1. Individual-plant classification criteria for salt tolerance at the emergence stage.
Biology 15 01409 g001
Figure 2. Phenotypic trait correlation matrix. Upper triangle: Pearson correlation coefficients with significance indicators (*** p < 0.001); diagonal: frequency distribution histograms for ST-INT, SI-INT, STG-SIB, and STG-SSB; lower triangle: scatter plots with fitted regression lines. ST-INT is the salt tolerance coefficient after inverse normal transformation at the emergence stage; SI-INT is the salt tolerance index after inverse normal transformation at the emergence stage; STG-SIB is the salt tolerance index grades after binary conversion at the emergence stage; STG-SSB is the salt tolerance grades following binary conversion at the seedling stage.
Biology 15 01409 g002
Figure 3. Genomic distribution of SNP markers and linkage disequilibrium in the 256-accession panel. (A) Density of the 89,361 SNPs across the 20 soybean chromosomes in 1 Mb windows; (B) LD decay curve showing the decline in r2 with increasing physical distance.
Biology 15 01409 g003
Figure 4. Genetic structure and relatedness of 256 soybean accessions. (A) Elbow plot from K-means clustering showing the inflection point at K = 6; (B) PCA scatter plot (PC1 vs. PC2) with accessions colored by the six inferred subpopulations; (C) Neighbor-joining phylogenetic tree with branches colored by subpopulation assignment; (D) Cross-validation error curves across K = 2–8 used to guide ADMIXTURE model selection; (E) ADMIXTURE ancestry plots for K = 2–8, where each vertical bar represents one accession and colored segments denote the proportional ancestry contribution from each inferred source population; (F) Kinship heatmap from hierarchical clustering of all 256 accessions, with darker shading indicating closer relatedness.
Biology 15 01409 g004
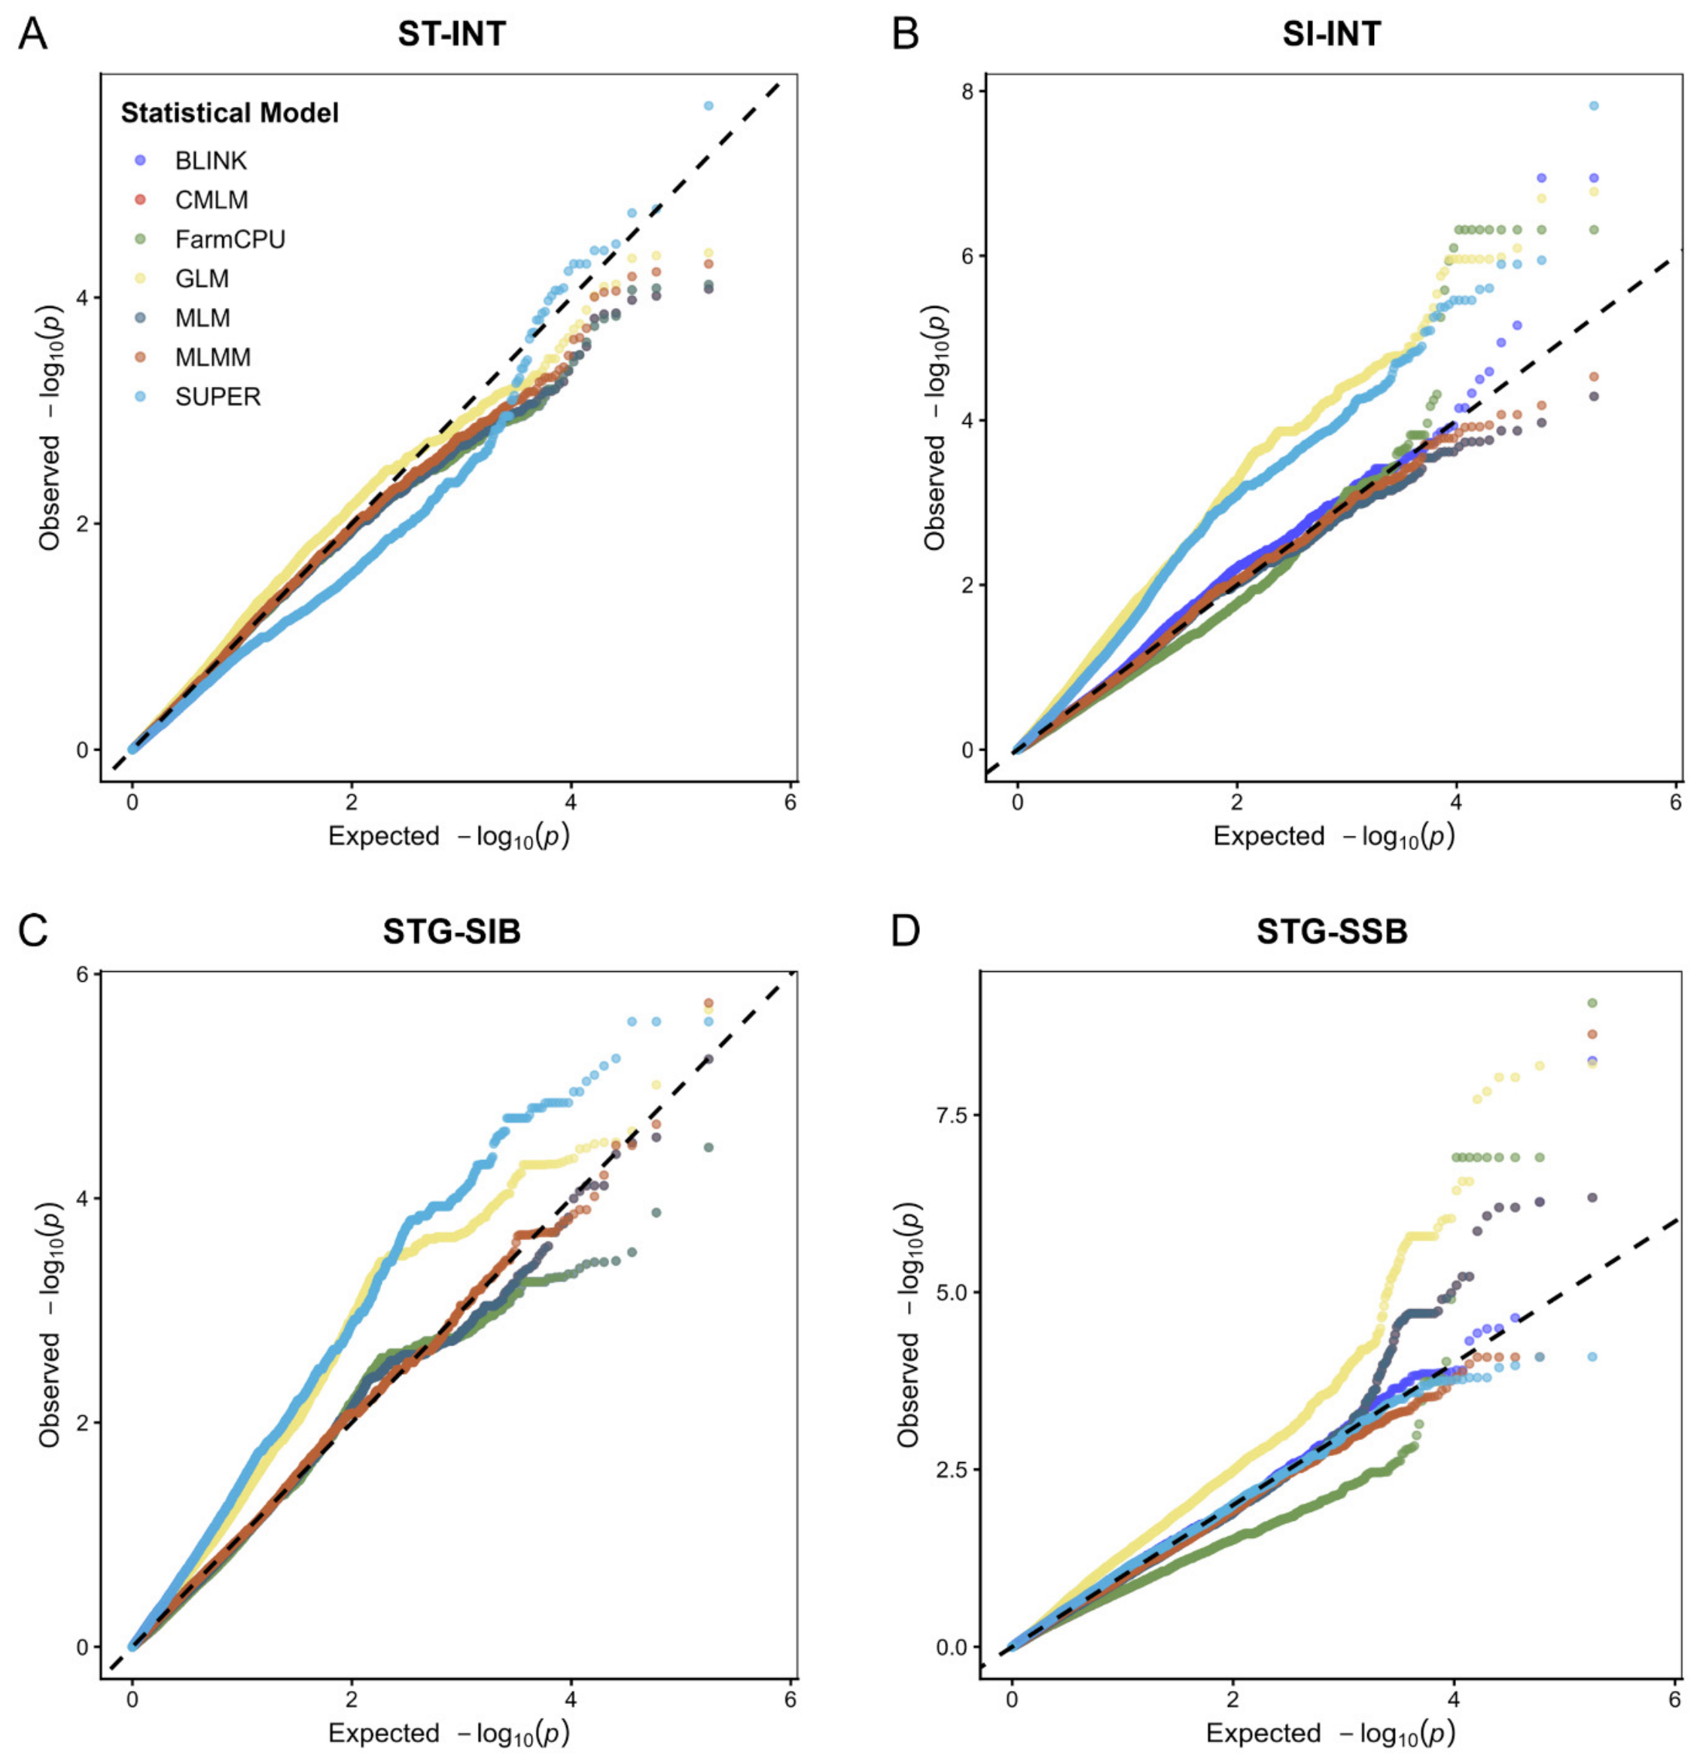
Figure 5. Quantile–quantile plots for ST-INT (A), SI-INT (B), STG-SIB (C), and STG-SSB (D) across the BLINK, CMLM, FarmCPU, GLM, MLM, MLMM, and SUPER models. ST-INT is the salt tolerance coefficient after inverse normal transformation at the emergence stage; SI-INT is the salt tolerance index after inverse normal transformation at the emergence stage; STG-SIB is the salt tolerance index grades after binary conversion at the emergence stage; STG-SSB is the salt tolerance grades following binary conversion at the seedling stage.
Biology 15 01409 g005
Figure 6. Manhattan plots for ST-INT (A), SI-INT (B), STG-SIB (C), and STG-SSB (D) across the BLINK, CMLM, FarmCPU, GLM, MLM, MLMM, and SUPER models. ST-INT is the salt tolerance coefficient after inverse normal transformation at the emergence stage; SI-INT is the salt tolerance index after inverse normal transformation at the emergence stage; STG-SIB is the salt tolerance index grades after binary conversion at the emergence stage; STG-SSB is the salt tolerance grades following binary conversion at the seedling stage.
Biology 15 01409 g006
Table 1. Descriptive statistics of salt tolerance at emergence and seedling stages.
TraitsMaximumMinimumMeanVarianceSD aSkewnessKurtosis
ST b100.0033.3389.32128.8211.35−1.904.60
SI c1.000.090.620.050.23−0.50−0.66
STG-SI d5.001.002.431.301.140.52−0.63
STG-SS e5.001.002.301.541.240.66−0.63
ST-INT f1.34−2.66−0.020.880.94−0.26−0.57
SI-INT g2.66−2.4200.960.980−0.28
STG-SIB h1.0000.600.240.49−0.41−1.84
STG-SSB i1.0000.630.240.49−0.51−1.74
a SD is standard deviation; b ST is salt tolerance coefficient at emergence stage; c SI is salt tolerance index at emergence stage; d STG-SI is salt tolerance index grades at emergence stage; e STG-SS is salt tolerance grades at seedling stage; f ST-INT is salt tolerance coefficient after inverse normal transformation at emergence stage; g SI-INT is salt tolerance index after inverse normal transformation at emergence stage; h STG-SIB is salt tolerance index grades after binary conversion at emergence stage; i STG-SSB is salt tolerance grades following binary conversion at seedling stage.
Table 2. Quantitative trait loci (QTL) for salt tolerance identified by GWAS in this study.
QTL NameAssociated TraitsChr.SNP IntervalSNP Number ContainedHighest Association SNP−log10(P)
qST-INT-04ST-INT a4Gm04_467938491Gm04_467938495.70
qST-INT-07ST-INT7Gm07_62794241Gm07_62794244.37
qST-INT-13ST-INT13Gm13_357001001Gm13_357001004.35
qSI-INT-01-1SI-INT b1Gm01_14874637-149272412Gm01_148746376.09–6.32
qSI-INT-01-2SI-INT1Gm01_174364771Gm01_174364776.32
qSI-INT-01-3SI-INT1Gm01_185067801Gm01_185067806.32
qSI-INT-01-4SI-INT1Gm01_191519801Gm01_191519806.32
qSI-INT-02SI-INT2Gm02_3640916-36498112Gm02_36498116.78–7.82
qSI-INT-07SI-INT7Gm07_7238076-72508042Gm07_72380765.90–6.32
qSI-INT-09SI-INT9Gm09_51916521Gm09_51916526.95
qSI-INT-10SI-INT10Gm10_3521576-36148873Gm10_3521576, Gm10_36148874.73–4.84
qSI-INT-11SI-INT11Gm11_28446351Gm11_28446354.53
qSI-INT-14SI-INT14Gm14_67281161Gm14_67281164.86
qSTG-SIB-05STG-SIB c5Gm05_35273972-353033852Gm05_353033854.39–4.50
qSTG-SIB-12STG-SIB12Gm12_111123351Gm12_111123355.18
qSTG-SIB-15STG-SIB15Gm15_158319681Gm15_158319685.74
qSTG-SSB-03STG-SSB d3Gm03_38525925-3881529120Gm03_386885804.41–9.08
qSTG-SSB-10STG-SSB10Gm10_38386826-3847285916Gm10_383987745.20–6.01
qSTG-SSB-11STG-SSB11Gm11_34520086-345226302Gm11_345226304.67–4.81
a ST-INT is the salt tolerance coefficient after inverse normal transformation at the emergence stage; b SI-INT is the salt tolerance index after inverse normal transformation at the emergence stage; c STG-SIB is the salt tolerance index grades after binary conversion at the emergence stage; d STG-SSB is the salt tolerance grades after binary conversion at the seedling stage.
Table 3. Candidate genes and functional annotations.
QTL NameGene IDChr.StartEndGene Function
qSI-INT-10Glyma.10G039200Gm1034760293482210Tetratricopeptide repeat protein 7B-like
Glyma.10G039300Gm1034843133487965Rho GDP-dissociation inhibitor 1
Glyma.10G039400Gm1034895523494424Exocyst complex component EXO84B-like
Glyma.10G039500Gm1034959333498821Uncharacterized protein LOC100793067
Glyma.10G039600Gm1034981563501931Cellulose synthase A4
Glyma.10G039700Gm1035093653515838Myb family transcription factor APL-like
Glyma.10G039800Gm1035231333524397Unknown protein
Glyma.10G039900Gm103528125352956360S ribosomal L23-like protein
Glyma.10G040000Gm1035323033534011Glutathione S-transferase family protein
Glyma.10G040100Gm1035343813541727Histone-lysine N-methyltransferase SUVR2-like
Glyma.10G040200Gm1035470513547805Mitochondrial import receptor subunit TOM9-2-like
Glyma.10G040300Gm1035487443550403Uncharacterized protein LOC102667717
Glyma.10G040400Gm1035571613561101Auxin response factor 1
Glyma.10G040500Gm1035615423565454ATP-binding/protein serine/threonine kinase
Glyma.10G040600Gm1035685503571109Photosystem II reaction center PSB28 protein
Glyma.10G040700Gm1035727693575692Xyloglucan galactosyltransferase KATAMARI1-like
Glyma.10G040800Gm1035857963589311Proline-rich protein precursor
Glyma.10G040900Gm1035911023596087Tetratricopeptide repeat protein 4 homolog
Glyma.10G041000Gm1035973073601274Alcohol dehydrogenase 1
Glyma.10G041100Gm10360186736068143-oxoacyl-[acyl-carrier-protein] synthase
Glyma.10G041200Gm1036139433614897RmlC-like cupins superfamily protein
Glyma.10G041300Gm1036217673629177Protein kinase superfamily protein
Glyma.10G041400Gm1036544313661105PfkB-like carbohydrate kinase family protein
qSTG-SSB-10Glyma.10G148100Gm103833932238341729Uncharacterized protein DDB_G0271670-like
Glyma.10G148200Gm103835336338357916Uncharacterized protein LOC100777900
Glyma.10G148300Gm103837207038378539RecQ family ATP-dependent DNA helicase
Glyma.10G148400Gm103837920638380060Unknown protein
Glyma.10G148500Gm103838142138382250Protein of unknown function (DUF3511)
Glyma.10G148600Gm103838258838389222Werner Syndrome-like exonuclease-like
Glyma.10G148700Gm103841538138418722Calmodulin-binding protein
Glyma.10G148800Gm103842021738425350Importin subunit alpha-1b
Glyma.10G148900Gm103842737238430979DNA polymerase III, epsilon subunit-like protein
Glyma.10G149000Gm103843164738436740Syntaxin of plants 43
Glyma.10G149100Gm103844158038441963Unknown protein
Glyma.10G149200Gm103846489938467826Drought-induced 19
Glyma.10G149300Gm103846890138469373Uncharacterized protein LOC100797448
Glyma.10G149400Gm103846976438473037PHD and RING finger domain-containing protein 1
Glyma.10G149500Gm103849304038499888ATP-binding microtubule motor family protein
Glyma.10G149600Gm103851127838514578Protein phosphatase 2C family protein
Glyma.10G149700Gm103851649338521186Single-stranded DNA-binding protein
Glyma.10G149800Gm103852071538521086Uncharacterized protein LOC102667166
Disclaimer/Publisher’s Note: The statements, opinions and data contained in all publications are solely those of the individual author(s) and contributor(s) and not of MDPI and/or the editor(s). MDPI and/or the editor(s) disclaim responsibility for any injury to people or property resulting from any ideas, methods, instructions or products referred to in the content.