Article

Influence of a Built-In Ultra-Weak Fiber Bragg Grating Sensor on Its Interfacial Properties with Asphalt Mixture

1
Jinghu Branch, Hebei Expressway Group Limited, Cangzhou 061000, China
2
School of Traffic and Transportation, Shijiazhuang Tiedao University, Shijiazhuang 050043, China
*
Author to whom correspondence should be addressed.
Coatings 2026, 16(3), 361; https://doi.org/10.3390/coatings16030361
Submission received: 13 February 2026 / Revised: 9 March 2026 / Accepted: 11 March 2026 / Published: 13 March 2026
(This article belongs to the Section Environmental Aspects in Colloid and Interface Science)

Abstract

Ultra-weak fiber Bragg grating (UWFBG) sensors are increasingly applied in asphalt pavement monitoring; however, the quantitative criteria for their vertical placement based on deformation coordination remain insufficient. This study investigates the deformation coordination mechanism between UWFBG sensors and the asphalt mixture under different vertical embedding positions. Three mesoscale finite element beam models with sensors embedded at the top (T), middle (M), and bottom (B) positions were established to simulate the lateral strain field evolution, core lateral tensile strain response of the UWFBG sensor, and interfacial mechanical behavior under three-point bending loading. To quantitatively evaluate the deformation compatibility, a weighted deformation coordination index was constructed by integrating the lateral tensile strain change rate of the UWFBG core (representing strain response sensitivity), the interface damage degree, and the interface opening displacement. A weight sensitivity analysis was performed to ensure the consistency of the result ranking. The results demonstrate that the vertical embedding position of the UWFBG sensor not only affects its own lateral tensile strain response, but also alters the lateral strain redistribution within the asphalt mixture beam, the migration of the neutral surface, and the damage development at the UWFBG sensor–asphalt mixture interface. The UWFBG sensor embedded at the bottom (B) position induces the most pronounced tensile strain amplification and neutral surface migration in the surrounding asphalt mixture, whereas the sensors embedded at the middle (M) and top (T) positions exhibit faster degradation of the UWFBG sensor–asphalt mixture interface or limited strain amplification, resulting in lower deformation coordination levels. Overall, the bottom-embedded configuration exhibits the strongest strain amplification, with the highest peak lateral tensile strain of the UWFBG core. The deformation coordination index (Ic) of the bottom configuration at the later loading stage is approximately 0.42, which is higher than that of the middle (0.37) and top (0.31) configurations. The consistent ranking under different weight combinations confirms the robustness of the evaluation work and identifies the bottom-embedding configuration as the most favorable arrangement for strain monitoring.

1. Introduction

In the context of transportation modernization strategy, smart highways have emerged as an important development direction for new transportation infrastructure [1,2,3,4]. Real-time structural health monitoring of asphalt pavement is critical for ensuring pavement service life. Internal cracks within asphalt pavement layers represent a critical form of structural distress. They typically initiate from the bottom or middle of pavement layers and propagate upward under repeated traffic loading and environmental effects. Unlike surface cracks that can be detected through visual inspection, internal cracks remain hidden until they reach the pavement surface. Early detection of internal crack initiation and propagation through embedded sensing technology is necessary for preventing extensive deterioration [5]. Therefore, timely identification of such damage is essential for determining road-maintenance indicators.
Fiber optic sensing technologies have been demonstrated to be suitable for complex environments, offering strong durability, electromagnetic interference resistance, and low maintenance costs [6,7,8]. Among these technologies, distributed acoustic sensing enables real-time continuous measurement; however, its signal-to-noise ratio is relatively low [9,10]. Fiber Bragg grating (FBG) technology offers high accuracy but has a limited monitoring range [11,12]. Asphalt mixtures are typical viscoelastic composites with pronounced time- and temperature-dependent behavior [13]. The linear viscoelastic properties and dynamic modulus of asphalt mastics, which are strongly influenced by filler characteristics, play a key role in controlling the mechanical response and deformation behavior of asphalt mixtures [14,15]. These complexities underscore the need for reliable internal strain monitoring techniques to capture localized deformation and interfacial mechanical behavior.
Compared with distributed acoustic sensing and FBG technology, ultra-weak fiber Bragg grating (UWFBG) technology employs gratings with an ultra-low reflectivity below 0.1%. This enables time-division multiplexing of thousands of sensing points along a single optical fiber without wavelength collision. The ultra-low reflectivity reduces multiple reflection interference, ensuring good signal quality. These advantages of high spatial resolution, wide coverage, and low per-point cost make UWFBGs suitable for internal strain monitoring in smart highway networks [16,17,18]. Therefore, UWFBG technology represents a promising solution for the comprehensive structural health monitoring of asphalt pavements.
However, studies on the mechanical behavior of UWFBG sensors embedded in pavement structures under in-service conditions remain relatively limited. Current research [14,15,16] is mainly focused on applications of this sensor, such as in vehicle detection and vibration sensing, while insufficient attention has been paid to the deformation coordination and interfacial mechanical behavior between this sensor and the asphalt mixture. Therefore, it is particularly necessary to conduct a deeper investigation into the mechanical response mechanism of UWFBG sensors embedded in pavement structures. Given the limited research on the mechanical behavior of UWFBG sensors, this study draws upon investigations of embedded FBG sensors for methodological and theoretical support.
The influences of the vertical placement of FBG sensors on strain measurement performance have been examined in the literature [19,20,21,22]. For example, Li et al. [19] investigated the cooperative deformation behavior between the FBG sensor and asphalt mixture and pointed out that when a sensor is placed at structural locations with large strain gradients in a vertical direction, deformation incompatibility is prone to occur between the sensor and the asphalt mixture, thereby leading to significant discrepancies between the measured strain by this sensor and the strain of the host material. Hu et al. [20] analyzed the strain response characteristics of an FBG sensor embedded within asphalt pavements under different vertical placement positions and found that variations in vertical placement significantly affect the strain response amplitude and signal stability. Liu et al. [21] further reported that an improper vertical placement alters the interfacial stress distribution between the FBG sensor and asphalt mixture, thereby weakening the efficiency of effective strain information transfer. Braunfelds et al. [22] conducted a strain monitoring of in-service asphalt pavement structures using an embedded FBG sensor and found that FBG sensors embedded at different vertical depths exhibit significant differences in recorded strain responses; some of the differences could not be adequately explained by conventional continuum assumptions. The above studies reveal, from different perspectives, that abnormal strain responses induced by variations in vertical embedding positions essentially originate from changes in the cooperative deformation capability and the complexity of interfacial mechanical behavior at the sensor–asphalt mixture interface. Therefore, investigation into the interaction mechanisms at the sensor–asphalt mixture interface is necessary to clarify the influence of interfacial properties on strain measurement accuracy.
To explain the phenomenon of the strain response deviation and instability induced by the vertical placement of the sensor, related research [23,24,25] has increasingly focused on the mechanical behavior at the sensor–asphalt mixture interface. Han et al. [23] pointed out that the modulus mismatch between the embedded strain sensor and the asphalt mixture induces stress concentration in the sensor–asphalt mixture interfacial region, and that this effect varies significantly with vertical placement position, thereby affecting strain transfer accuracy. Furthermore, another study [24] by them showed that when local damage or debonding occurs at the interface, the stability and reliability of strain monitoring signals are significantly reduced. Meanwhile, they also found that the interfacial region is often the location where structural damage initiates preferentially, and the degradation of its mechanical properties plays an important role in governing the overall structural response [25]. To sum up, the vertical placement position of the sensor controls the stability and accuracy of strain transfer by altering the stress state at the sensor–asphalt mixture interface, which is also one of the reasons why the study focuses on deformation compatibility at the interface.
The mechanical issues at the embedded-sensor–asphalt mixture interface focus on elucidating the formation mechanisms of stress distribution, load transfer, and damage evolution within the interfacial region under the heterogeneous structural characteristics of the asphalt mixture. To investigate the influence of material heterogeneity on the interfacial mechanical behavior between the sensor and asphalt mixture, the mechanical interaction between embedded components and asphalt mixture has been analyzed by means of mesoscale finite element methods. Mo et al. [26] and Du et al. [27] demonstrated that explicitly describing the internal compositional differences of materials at the mesoscale enables a more accurate representation of local stress distribution characteristics and interfacial stress states. The results reported by Kim et al. [28] and Chen et al. [29] indicate that the interfacial region is often the preferential location for damage initiation, and the degradation of its mechanical properties has a significant influence on the overall structural response; therefore, an explicit characterization of interfacial mechanical behavior is critical for revealing the initiation and propagation of damage. Collectively, simultaneously characterizing the mechanical responses of the sensor, the sensor–asphalt mixture interface, and the surrounding asphalt mixture at the mesoscale provides an effective approach for analyzing the effects of sensor placement variations on the strain response characteristics and interfacial behavior.
At present, increasing attention has been paid to the relationship between strain response and interfacial stability. Numerical analyses conducted by Liu et al. [30] showed that embedded sensors located at layers with concentrated vertical strain are usually associated with a faster damage evolution process. Through cooperative deformation tests of embedded FBG sensors, Liao et al. [31] found that when sensors are vertically placed in high-strain regions, the strain response amplitude is enhanced, whereas the deformation compatibility between the sensor and asphalt mixture is significantly reduced. From a theoretical perspective, Dong et al. [32] pointed out that interfacial stress is more likely to concentrate in structural layers with large vertical strain gradients, thereby reducing the efficiency of strain transfer. Overall, the existing studies indicate that the vertical placement of a sensor is intrinsically linked to strain response enhancement, interfacial stability degradation, and the deterioration of cooperative deformation capability; however, systematic investigations into these issues remain insufficient. The aforementioned studies have systematically examined strain distribution, interfacial damage, and the sensor placement of embedded FBG sensors in asphalt mixtures, which are essentially governed by the interaction mechanisms between the sensor and the asphalt mixture. Considering the similarities in structural characteristics and sensing principles between UWFBG and conventional FBG sensors, these research approaches can be applied to investigate UWFBG sensor mechanical performance under vertical placement conditions.
To address these issues, this study aims to analyze the influence of a built-in UWFBG sensor on the interfacial properties between the sensor–asphalt mixture. Mesoscale finite element beam models of an asphalt mixture with an embedded UWFBG sensor were established. The relationships among UWFBG strain response sensitivity, interfacial damage, and deformation coordination were investigated. A deformation coordination index was established based on strain response, interfacial stiffness degradation, and contact opening, and recommendations were made for the vertical placement position of the UWFBG sensor.

2. Materials and Methods

2.1. Material

Based on the mesoscale finite element approach described above, an AC-13 asphalt mixture was selected as the research subject to investigate the effects of the embedding depth of an embedded UWFBG. The gradation of the AC-13 mixture is shown in Table 1. The asphalt mixture has an asphalt–aggregate ratio of 4.77%. In the model, aggregates larger than 2.36 mm were considered coarse aggregates, while aggregates with a size of 2.36 mm or smaller were classified as fine aggregates. Fine aggregates were mixed with asphalt binder to produce the asphalt mortar. Styrene-Butadiene-Styrene (SBS) (I-D)-modified asphalt, supplied by Shandong Huate Road Materials Co., Ltd. (Shandong, China), was used in this study. Its properties are shown in Table 2. The coarse aggregates were basalt obtained from Baoding Qingyuan Jiangyue Basalt Aggregate Plant (Baoding, China) and their technical indicators are shown in Table 3, while the fine aggregates were limestone supplied by Tangshan Qingfeng Aggregate Plant (Tangshan, China) and their indicators are shown in Table 4. The mineral filler was provided by Baoding Laishui Tongshun Building Materials Co., Ltd. (Baoding, China); its indicators are shown in Table 5.

2.2. Meso-Finite Element Modeling of Asphalt Mixture Beams Containing UWFBG with Different Embedding Positions

To investigate the influence of the vertical embedding position of UWFBG sensors on their strain response characteristics and deformation coordination with asphalt mixtures, this study conducted a three-point bending simulation to analyze the mechanical behavior of the UWFBG sensor–asphalt mixture system. The three-point bending configuration can effectively reproduce the flexural mechanical response of beam specimens and is consistent with the stress-state description of asphalt mixture beams specified in JTG 3410-2025 [33]. The support span of the model was set to 200 mm. Displacement-controlled loading was applied at the midspan with a loading rate of 50 mm/min to simulate a quasi-static loading process.
Although asphalt mixtures are inherently three-dimensional heterogeneous materials, a two-dimensional modeling approach was adopted in this study to focus on the cross-sectional mechanical interaction between the embedded UWFBG sensor and the surrounding asphalt mixture. The numerical model was implemented under a plane strain assumption, which is commonly used for beam bending analysis where the specimen width is much larger than the characteristic aggregate size. Under three-point bending loading, the dominant stress transfer and strain redistribution mechanisms occur primarily within the beam cross-section. Previous mesoscale studies have also adopted two-dimensional models to capture the essential stress redistribution characteristics while reducing computational cost. Considering that the primary mechanical response of the beam under three-point bending can be effectively characterized by the stress–strain transfer behavior within the cross-section, a two-dimensional finite element modeling approach was adopted. This two-dimensional model is capable of capturing the vertical stress–strain transfer characteristics while significantly reducing the degrees of freedom and computational cost, which is beneficial for detailed analysis of interfacial mechanical behavior and sensor strain response. In the two-dimensional model, the asphalt mixture beam was defined as a plane structure with a length of 350 mm and a thickness of 50 mm. The UWFBG sensor was represented using an equivalent modeling method and simplified as a rectangular cross-section with a width of 8 mm. The sensor was arranged along the vertical direction of the beam to reflect its mechanical behavior and deformation characteristics in the embedded state.
Based on the stress distribution characteristics within the beam cross-section under three-point bending, three representative vertical embedding positions were defined in the model. The position near the upper edge of the beam was defined as top embedding (T), where compressive stress dominates. The position near the neutral axis was defined as middle embedding (M), corresponding to the transition zone from compressive to tensile stress. The position near the lower edge of the beam was defined as bottom embedding (B), which is located in the maximum tensile stress region and exhibits a relatively high strain level.
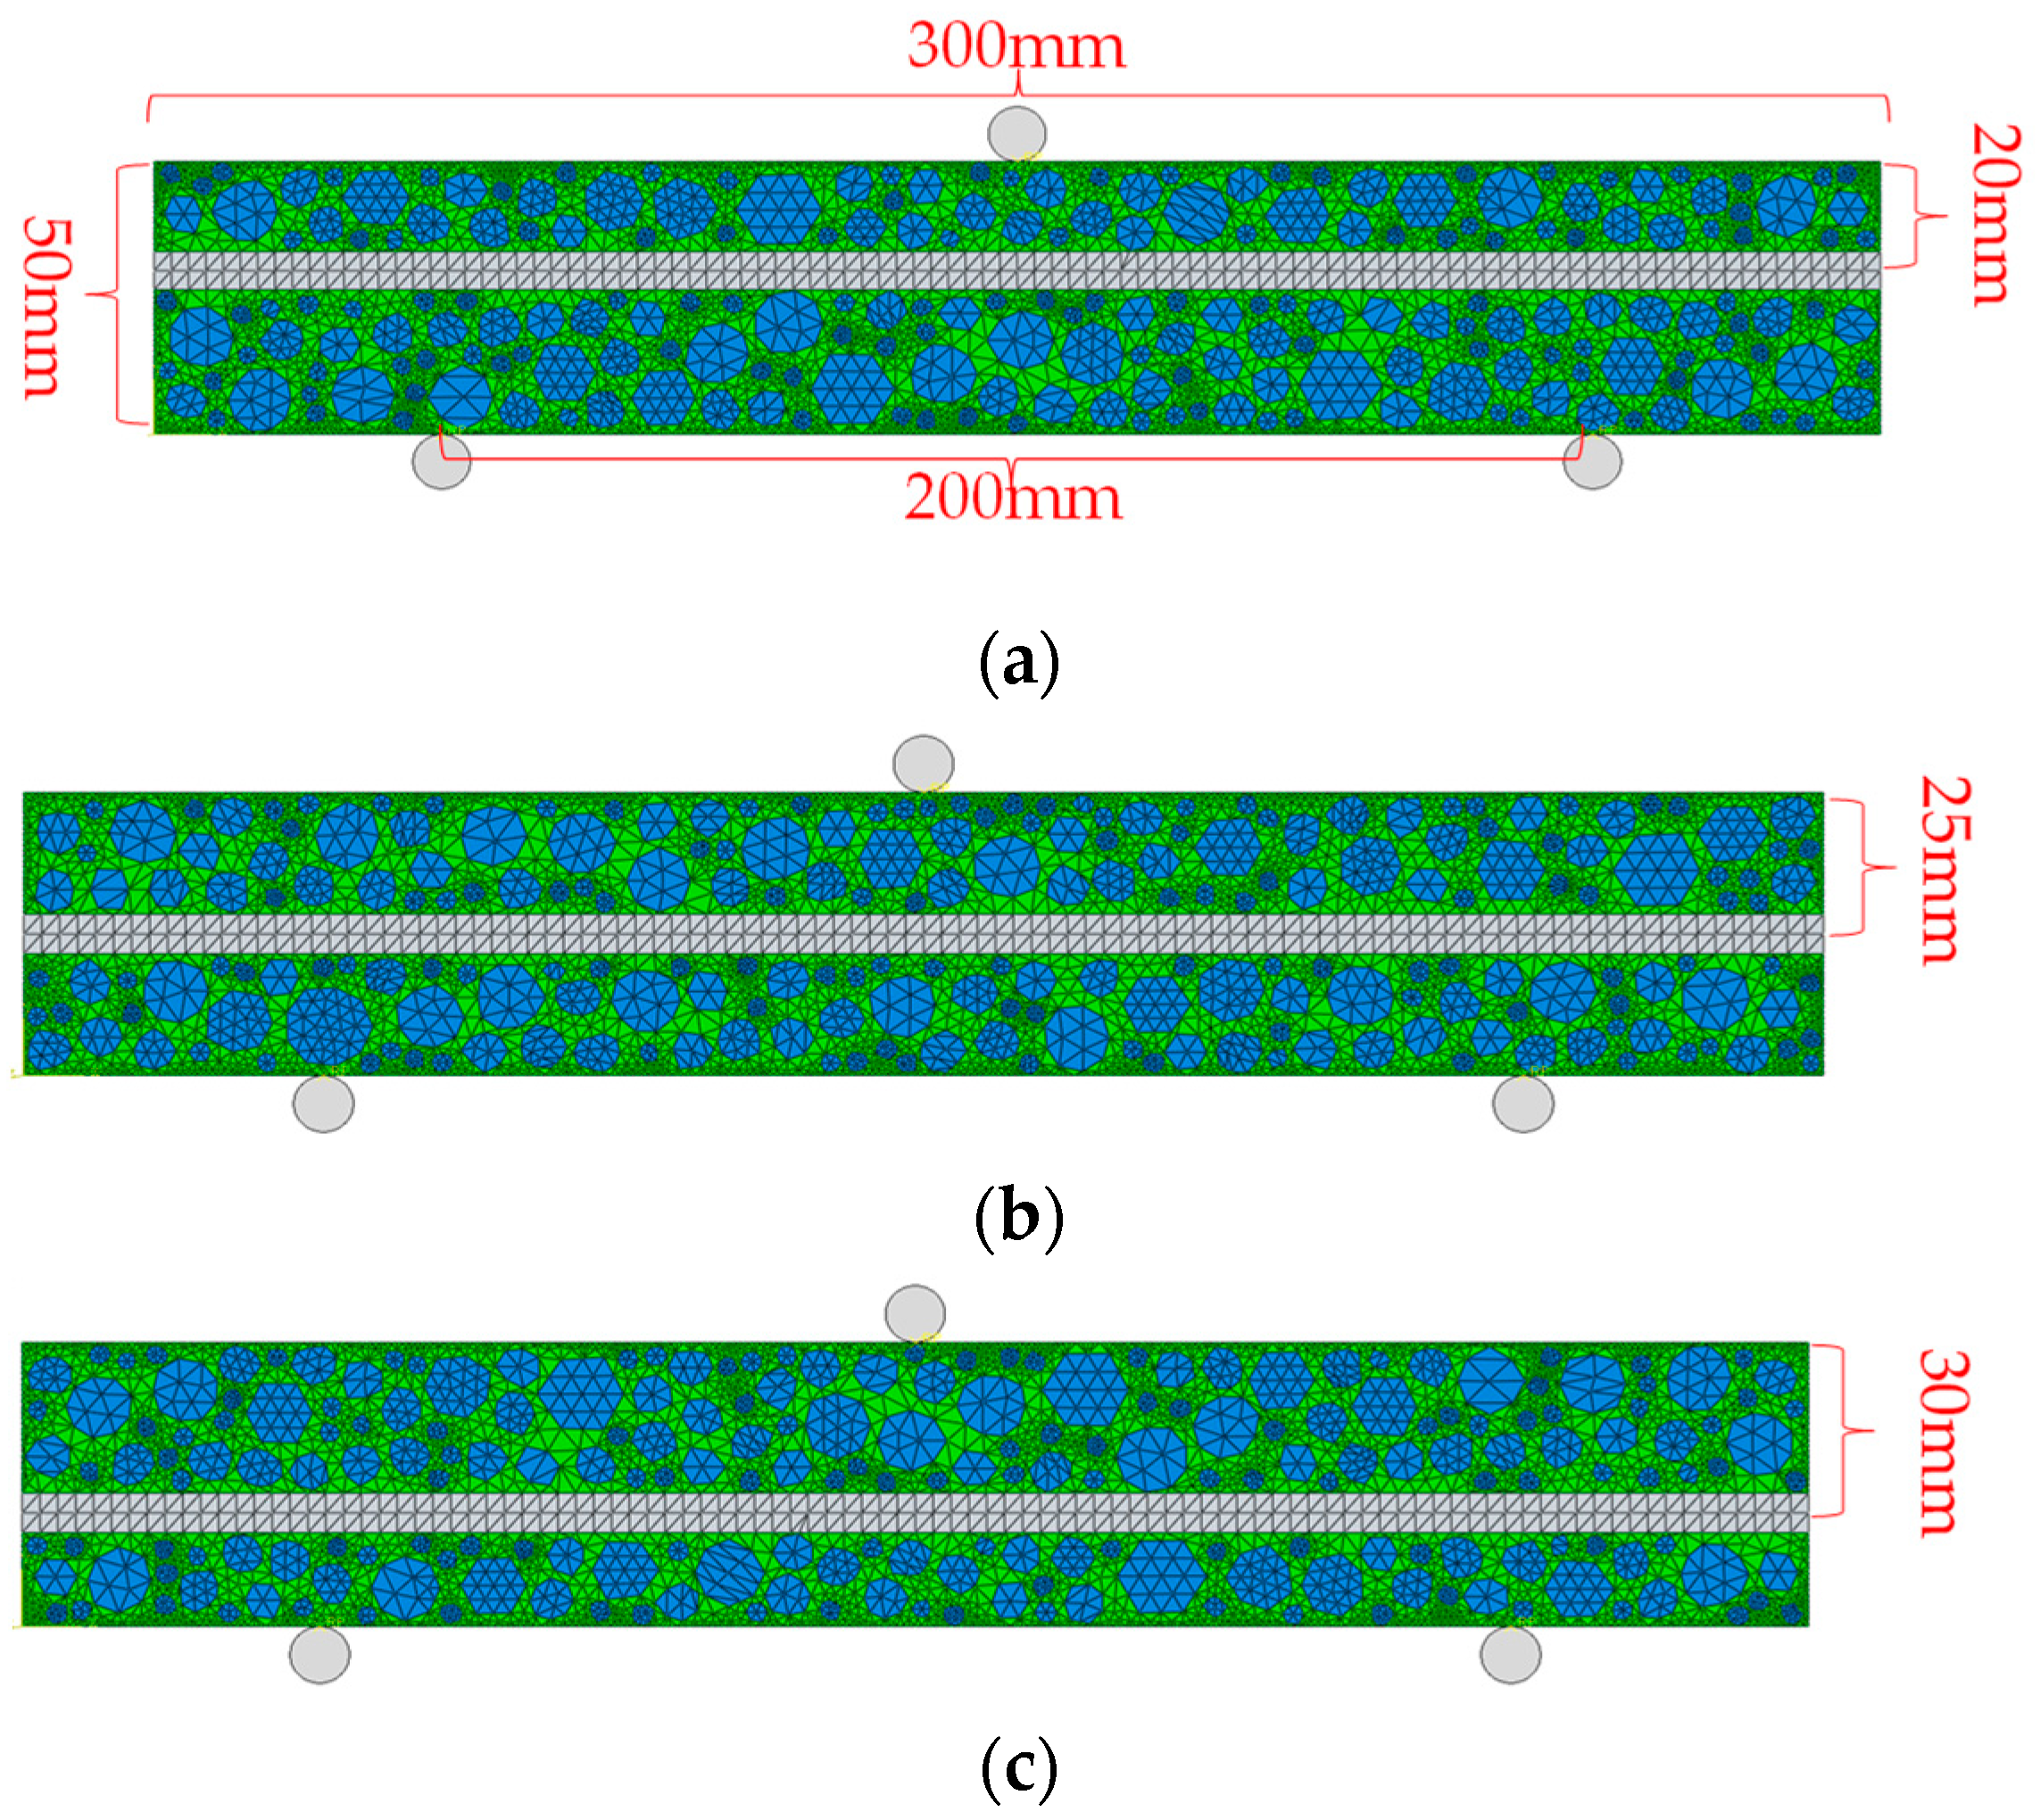
Based on the above embedding scheme, three two-dimensional finite element models of asphalt mixture beams with different vertical embedding positions were established. During mesh generation, local mesh refinement was applied to the UWFBG sensor and its surrounding regions to improve the accuracy of interfacial stress distribution and damage evolution calculations. Coarser meshes were adopted in regions away from the sensor to balance computational accuracy and efficiency. The three models differ only in the vertical embedding position of the UWFBG sensor, while all other geometric parameters, interfacial conditions, and loading conditions remain identical to ensure the comparability of numerical results under different embedding positions. The models are shown in Figure 1. It can be observed that the support span was set to 200 mm, and displacement-controlled loading was applied at the midspan. The two supports were modeled as roller supports. Contact interaction between the beam and the supports was defined using a surface-to-surface contact formulation with a friction coefficient to simulate the interaction between the specimen and the loading fixtures. In addition, geometric nonlinearity was activated in the numerical analysis to account for potential nonlinear deformation effects during the loading process.
The interface between the UWFBG sensor and the asphalt mixture was described using a cohesive zone model. This model characterizes the interfacial mechanical response under external loading by defining normal and tangential traction–separation relationships. It can simulate the entire interfacial process from initial bonding to damage initiation and progressive damage evolution, which may ultimately lead to interfacial cracking or debonding. By introducing parameters such as interfacial stiffness degradation, the influence of interfacial damage development on the strain transfer capability and deformation coordination between the sensor and asphalt mixture can be captured.
The material and interface parameters used in the meso-finite element model are presented in Table 6 and Table 7, including elastic moduli and Poisson’s ratios for bulk materials, as well as fracture energy and cohesive strength for interfaces. In this study, the asphalt mortar phase was modeled using a simplified linear elastic constitutive model. Although asphalt materials exhibit viscoelastic behavior, the loading duration considered in the present three-point bending simulation is relatively short. Therefore, the deformation response is mainly governed by instantaneous mechanical behavior and interfacial damage evolution. The simplified elastic assumption allows the strain transfer mechanism between the UWFBG sensor and the surrounding asphalt mixture to be more clearly analyzed. The cohesive zone model was adopted to simulate the interfacial mechanical behavior between different material phases in the mesoscale model. Previous studies [28,29,30] have reported cohesive parameters for different material interfaces within asphalt mixtures. Based on these reported values, the parameters used in the present model were selected from the literature and slightly adjusted to better represent the mechanical interaction between different phases in the mesoscale simulation. Based on the above modeling strategy, the strain response characteristics of UWFBG sensors and the interfacial mechanical behavior under different vertical embedding positions can be obtained, providing a reliable numerical basis for the subsequent analysis of deformation coordination mechanisms.

2.3. Laboratory Test

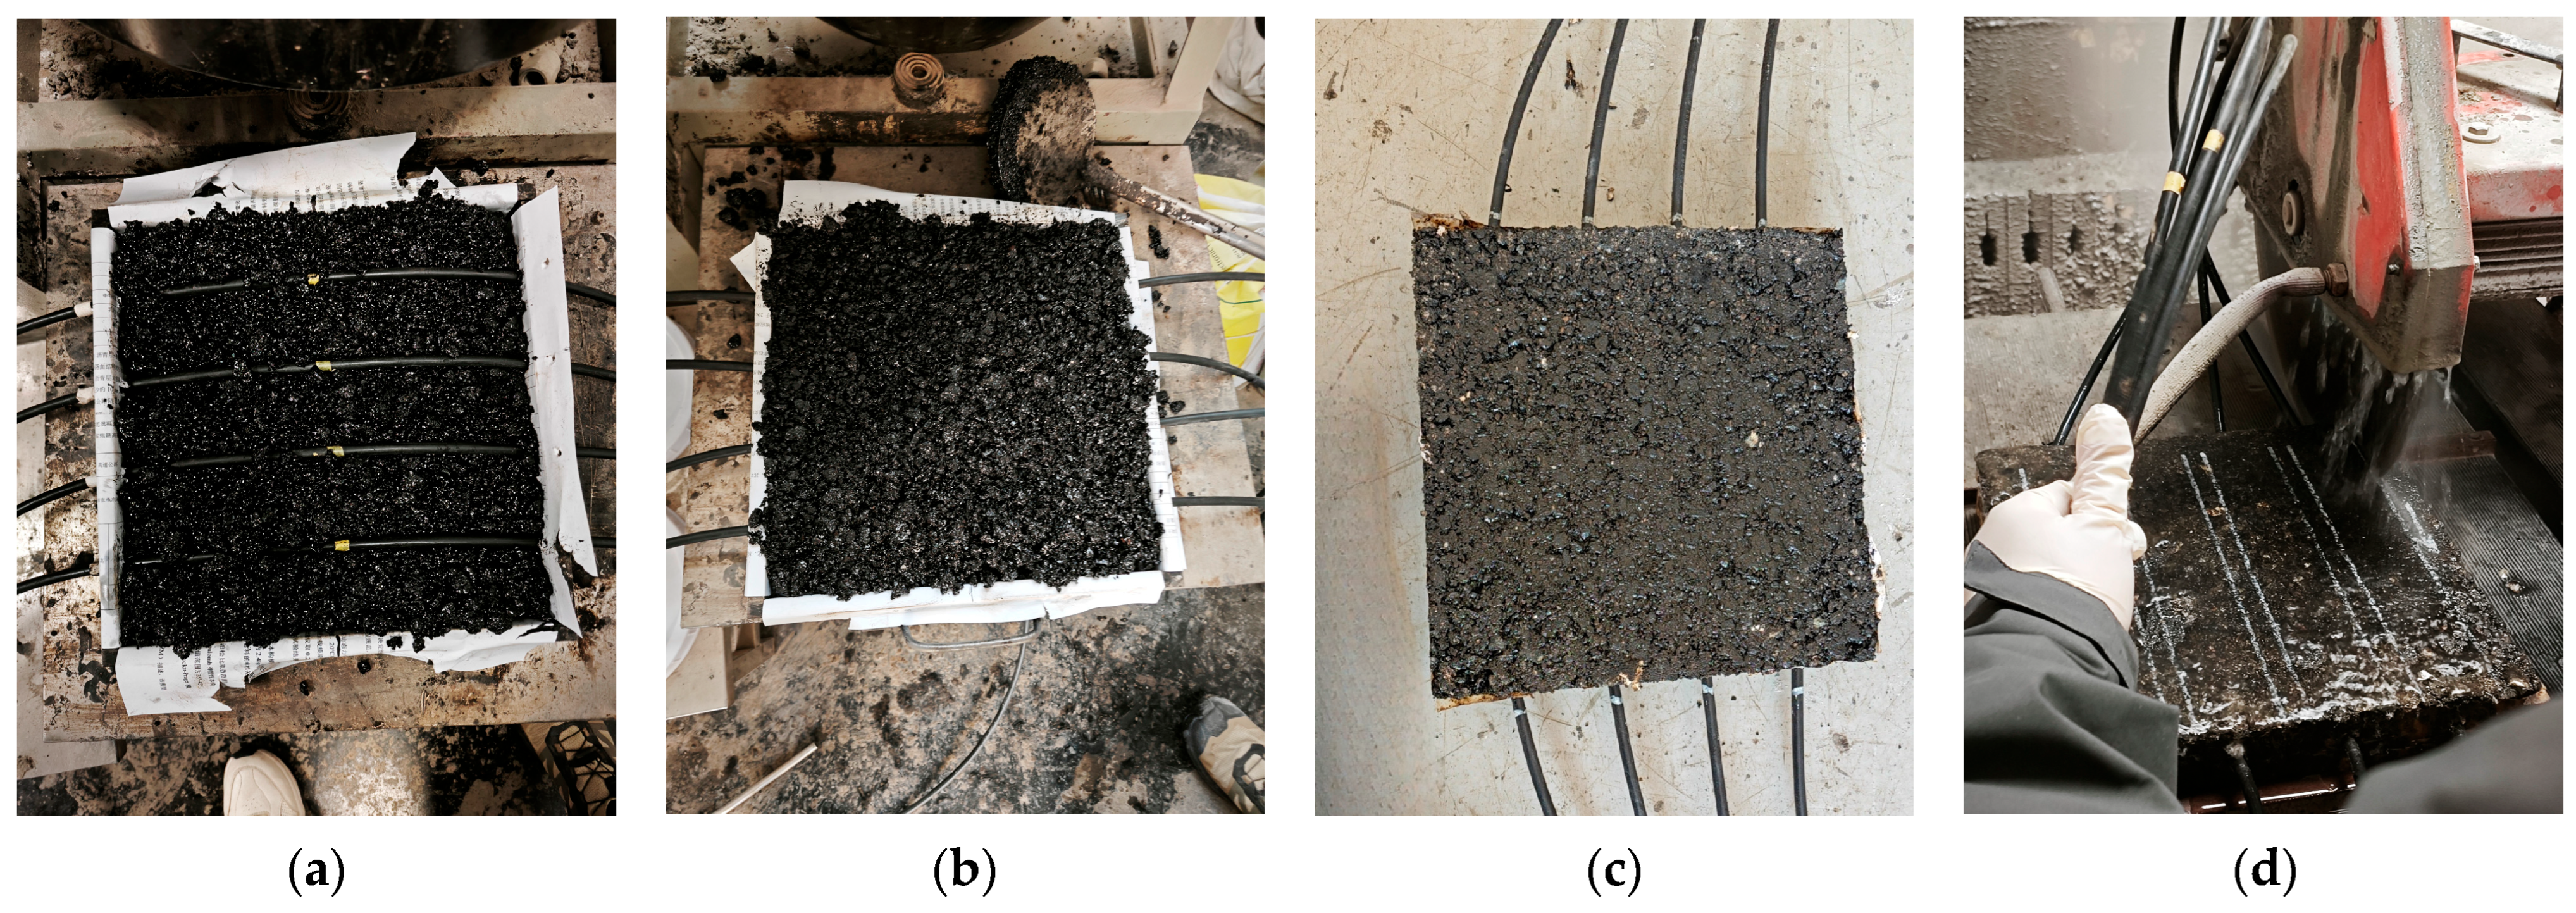
The laboratory three-point bending test was conducted on asphalt mixture beam specimens to verify the reliability of the B model. The experimental setup was designed to reproduce the boundary conditions and loading configuration used in the numerical simulation. The asphalt mixture beams were prepared using the same AC-13 gradation described in Section 2.1. According to JTG 3410-2025 [33], the specimen preparation was conducted, which is illustrated in Figure 2. To accommodate the embedding of the UWFBG sensor, a specialized rut plate mold (300 mm × 300 mm × 50 mm) with a 10 mm side opening was first fabricated. The distance from the center of the hole to the top surface of the specimen was 20 mm. Initially, 60% of the total asphalt mixture weight was uniformly placed into the mold. The UWFBG sensor was then embedded in the center of the mixture, with the fiber grating positioned 20 mm below the top surface of the specimen. Subsequently, the remaining asphalt mixture was added to fill the mold from the edges toward the center. The roller of the compactor was preheated to approximately 100 °C. The mold containing the mixture was placed on the platform of the roller for compaction. Afterwards, the mold with the compacted specimen was cooled at room temperature for at least 12 h before demolding. Finally, the specimen was cut to dimensions of 300 mm × 50 mm × 50 mm using a cutting machine.
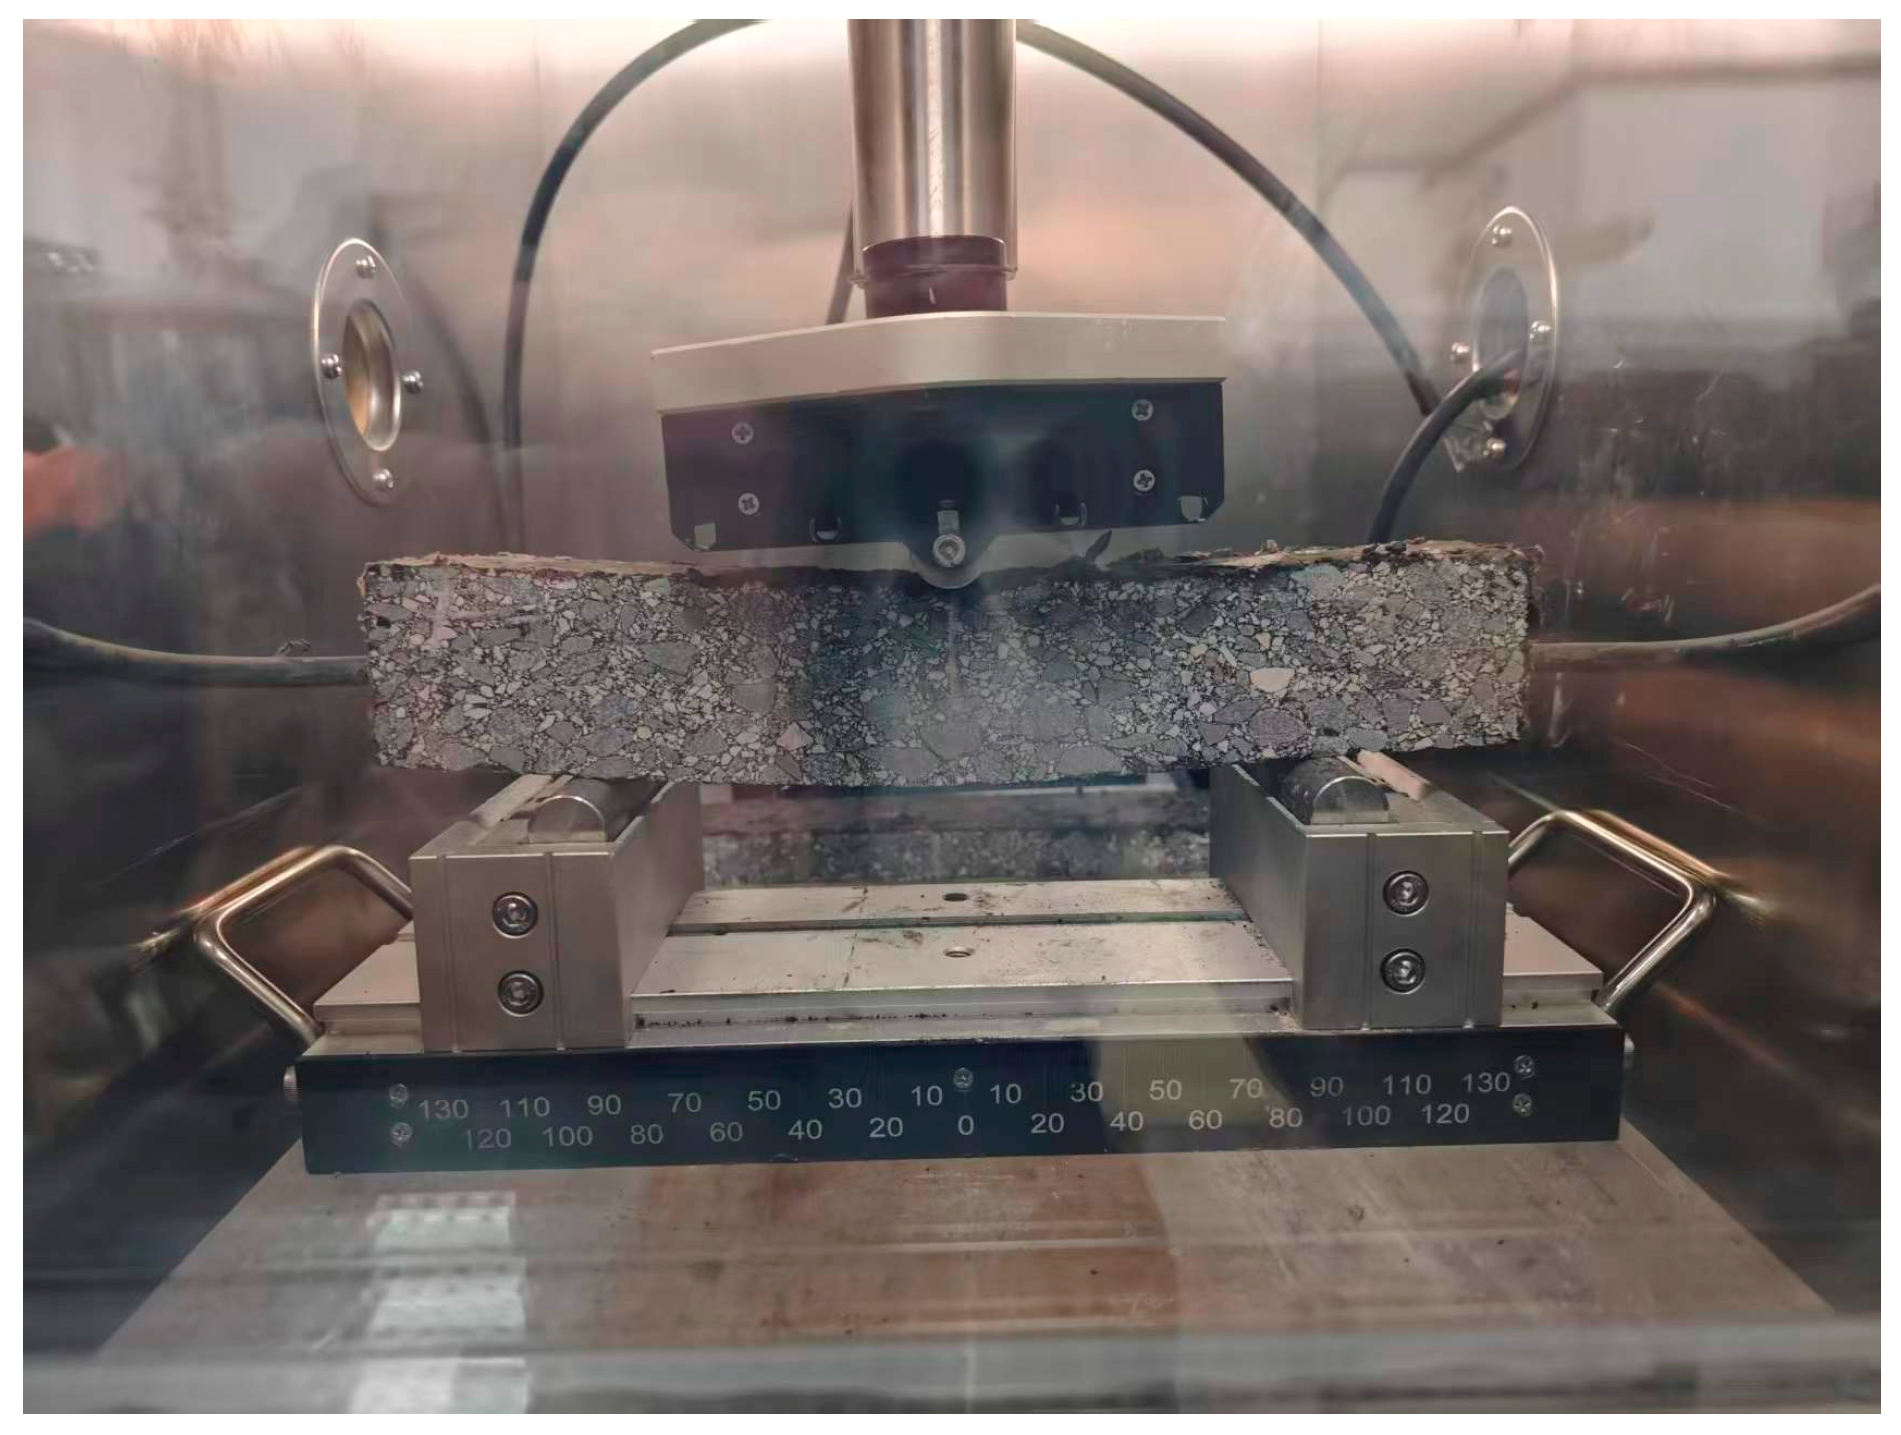
To ensure consistency between the simulation and experimental loading conditions, a three-point bending test was conducted using a Universal Testing Machine (UTM, Shanghai Nuolai Technology Development Co., Ltd., Shanghai, China). The support span of the beam specimen was set to 200 mm, and displacement-controlled loading was applied at the midspan with a loading rate of 50 mm/min. During the experiment, the applied load and the corresponding midspan displacement were continuously recorded to obtain the experimental load–displacement relationship of the asphalt mixture beam. The experimental procedure is illustrated in Figure 3. The experimental results provide a reference for assessing the rationality of the numerical model and indicate that the proposed mesoscale model can reasonably capture the overall deformation trend of the asphalt mixture beam under three-point bending loading.

2.4. Development of Monitoring Performance Index

To investigate the relationships among the strain response sensitivity, interfacial stability, and deformation coordination of UWFBG sensors, this study proposed three key rating indicators, namely the lateral tensile strain change rate of the UWFBG core, the interfacial damage degree, and the interfacial opening displacement. Based on these indicators, a deformation coordination index was established to provide a theoretical basis for optimizing the embedding depth of UWFBG sensors in asphalt pavement monitoring.
To characterize the deformation response of the asphalt mixture beams during loading and further reflect the monitoring accuracy of UWFBG sensors, the lateral tensile strain change rate of the UWFBG core was adopted as the monitoring accuracy indicator. The strain change rate can directly represent the dynamic response capability of the sensor output during the loading process. Compared with lateral tensile strain, it more effectively reflects monitoring sensitivity and response reliability. The calculation method is given in Equation (1).
ε ˙ i = ε i ε i 1 t i t i 1
where ε i is the lateral tensile strain of the UWFBG core at the i-th time step (με); t i is the loading time at the i-th time step (s); ε ˙ i is the lateral tensile strain change rate of the UWFBG core (με/s).
To describe the evolution of interfacial damage, the interfacial damage degree (D) was employed as an evaluation indicator. D was calculated based on the cohesive zone model and ranges from 0 to 1, representing the damage evolution from complete bonding to complete failure. When D = 0, the interface remains fully bonded. As D approaches 1, the interface enters a severe damage stage and tends to fail or has already completely failed. The calculation method is shown in Equation (2).
D = s f × s max s eff s max × s f s eff
where seff is the effective displacement at damage initiation of the computing unit (mm); smax is the maximum effective displacement of the computing unit in loading history (mm); sf is the effective displacement of the computing unit at complete failure (mm).
To characterize the interfacial separation or compression state in the normal direction, the interfacial opening displacement (So) was employed as an evaluation indicator. So quantifies the normal separation distance of the interface. Positive values indicate interfacial opening and separation, which may interrupt stress transfer and reduce lateral tensile strain transfer capability. Negative values indicate interfacial compression, which may cause local fiber buckling or stress concentration. The calculation method is shown in Equation (3):
S o = s slave s master g inital
where s slave is the normal displacement of the slave surface node (mm); s master is the normal displacement of the corresponding point on the master surface (mm); g inital is the initial gap (mm).
To evaluate the monitoring stability of UWFBG sensors under loading conditions, D and So were jointly regarded as monitoring stability indicators. Specifically, D reflects the degradation of interfacial bonding capacity due to damage evolution, while So reflects variations in the interfacial normal separation state induced by opening or compression. Together, they determine the continuity and stability of interfacial stress transfer, thereby affecting the reliability of sensor output and long-term monitoring performance.
To comprehensively evaluate the deformation coordination performance of UWFBG sensors under different embedding positions, a standardized and weighted comprehensive evaluation method was adopted to integrate the three key indicators, and a deformation coordination index (Ic) was constructed. To eliminate dimensional differences among indicators, an min–max normalization method was adopted. For any indicator X ε ˙ i , D , S o , the normalized value is defined as
X = X X min X max X min
where X denotes the actual value of these indicators, including the lateral tensile strain change rate of the UWFBG core, the interface damage degree, and the interface opening displacement; Xmax and Xmin denote the maximum and minimum values of these indicators, respectively; X* is the dimensionless normalized indicator.
After normalization, all indicators ranged from 0 to 1. To determine the relative importance of the evaluation indicators, an Analytic Hierarchy Process (AHP) was adopted to calculate the weight coefficients. AHP is widely used in multi-criteria decision analysis and determines indicator weights through pairwise comparison and consistency verification. In this study, deformation coordination between the UWFBG sensor and the surrounding asphalt mixture is evaluated using three indicators: the lateral tensile strain change rate of the UWFBG core, the interface damage degree, and the interface opening displacement. Based on engineering judgment and the mechanical significance of these indicators, pairwise comparisons were performed using the Saaty scale. The strain change rate of the UWFBG core was considered slightly more important than the other indicators because it directly reflects the strain response sensitivity of the embedded sensor. The interface damage degree was regarded as slightly more important than the interface opening displacement, as it characterizes the degradation of load transfer capacity at the sensor–asphalt interface. The pairwise comparison matrix used in the AHP analysis is shown in Table 8.
Through eigenvalue calculation and normalization of the judgment matrix, the weight coefficients of the three indicators were obtained. The lateral tensile strain change rate of the UWFBG core was assigned a weight of 0.42 ( w ε ˙ ), the interface damage degree was assigned a weight of 0.33 ( w D ), and the interface opening displacement was assigned a weight of 0.25 ( w S o ). The consistency ratio of the judgment matrix was calculated and found to be less than 0.1, indicating that the judgment matrix satisfies the consistency requirement of the AHP method. The weighted deformation coordination index Ic is expressed as
I c = w ε ˙ i ε ˙ i + w D 1 D + w S o 1 S o
where ε ˙ i , D , and S o are the normalized lateral tensile strain change rate of the UWFBG core, the normalized interface damage degree, and the normalized interface opening displacement, respectively. The deformation coordination index Ic ranges from 0 to 1, with larger values indicating better deformation compatibility between the fiber and the mixture.

2.5. Research Framework

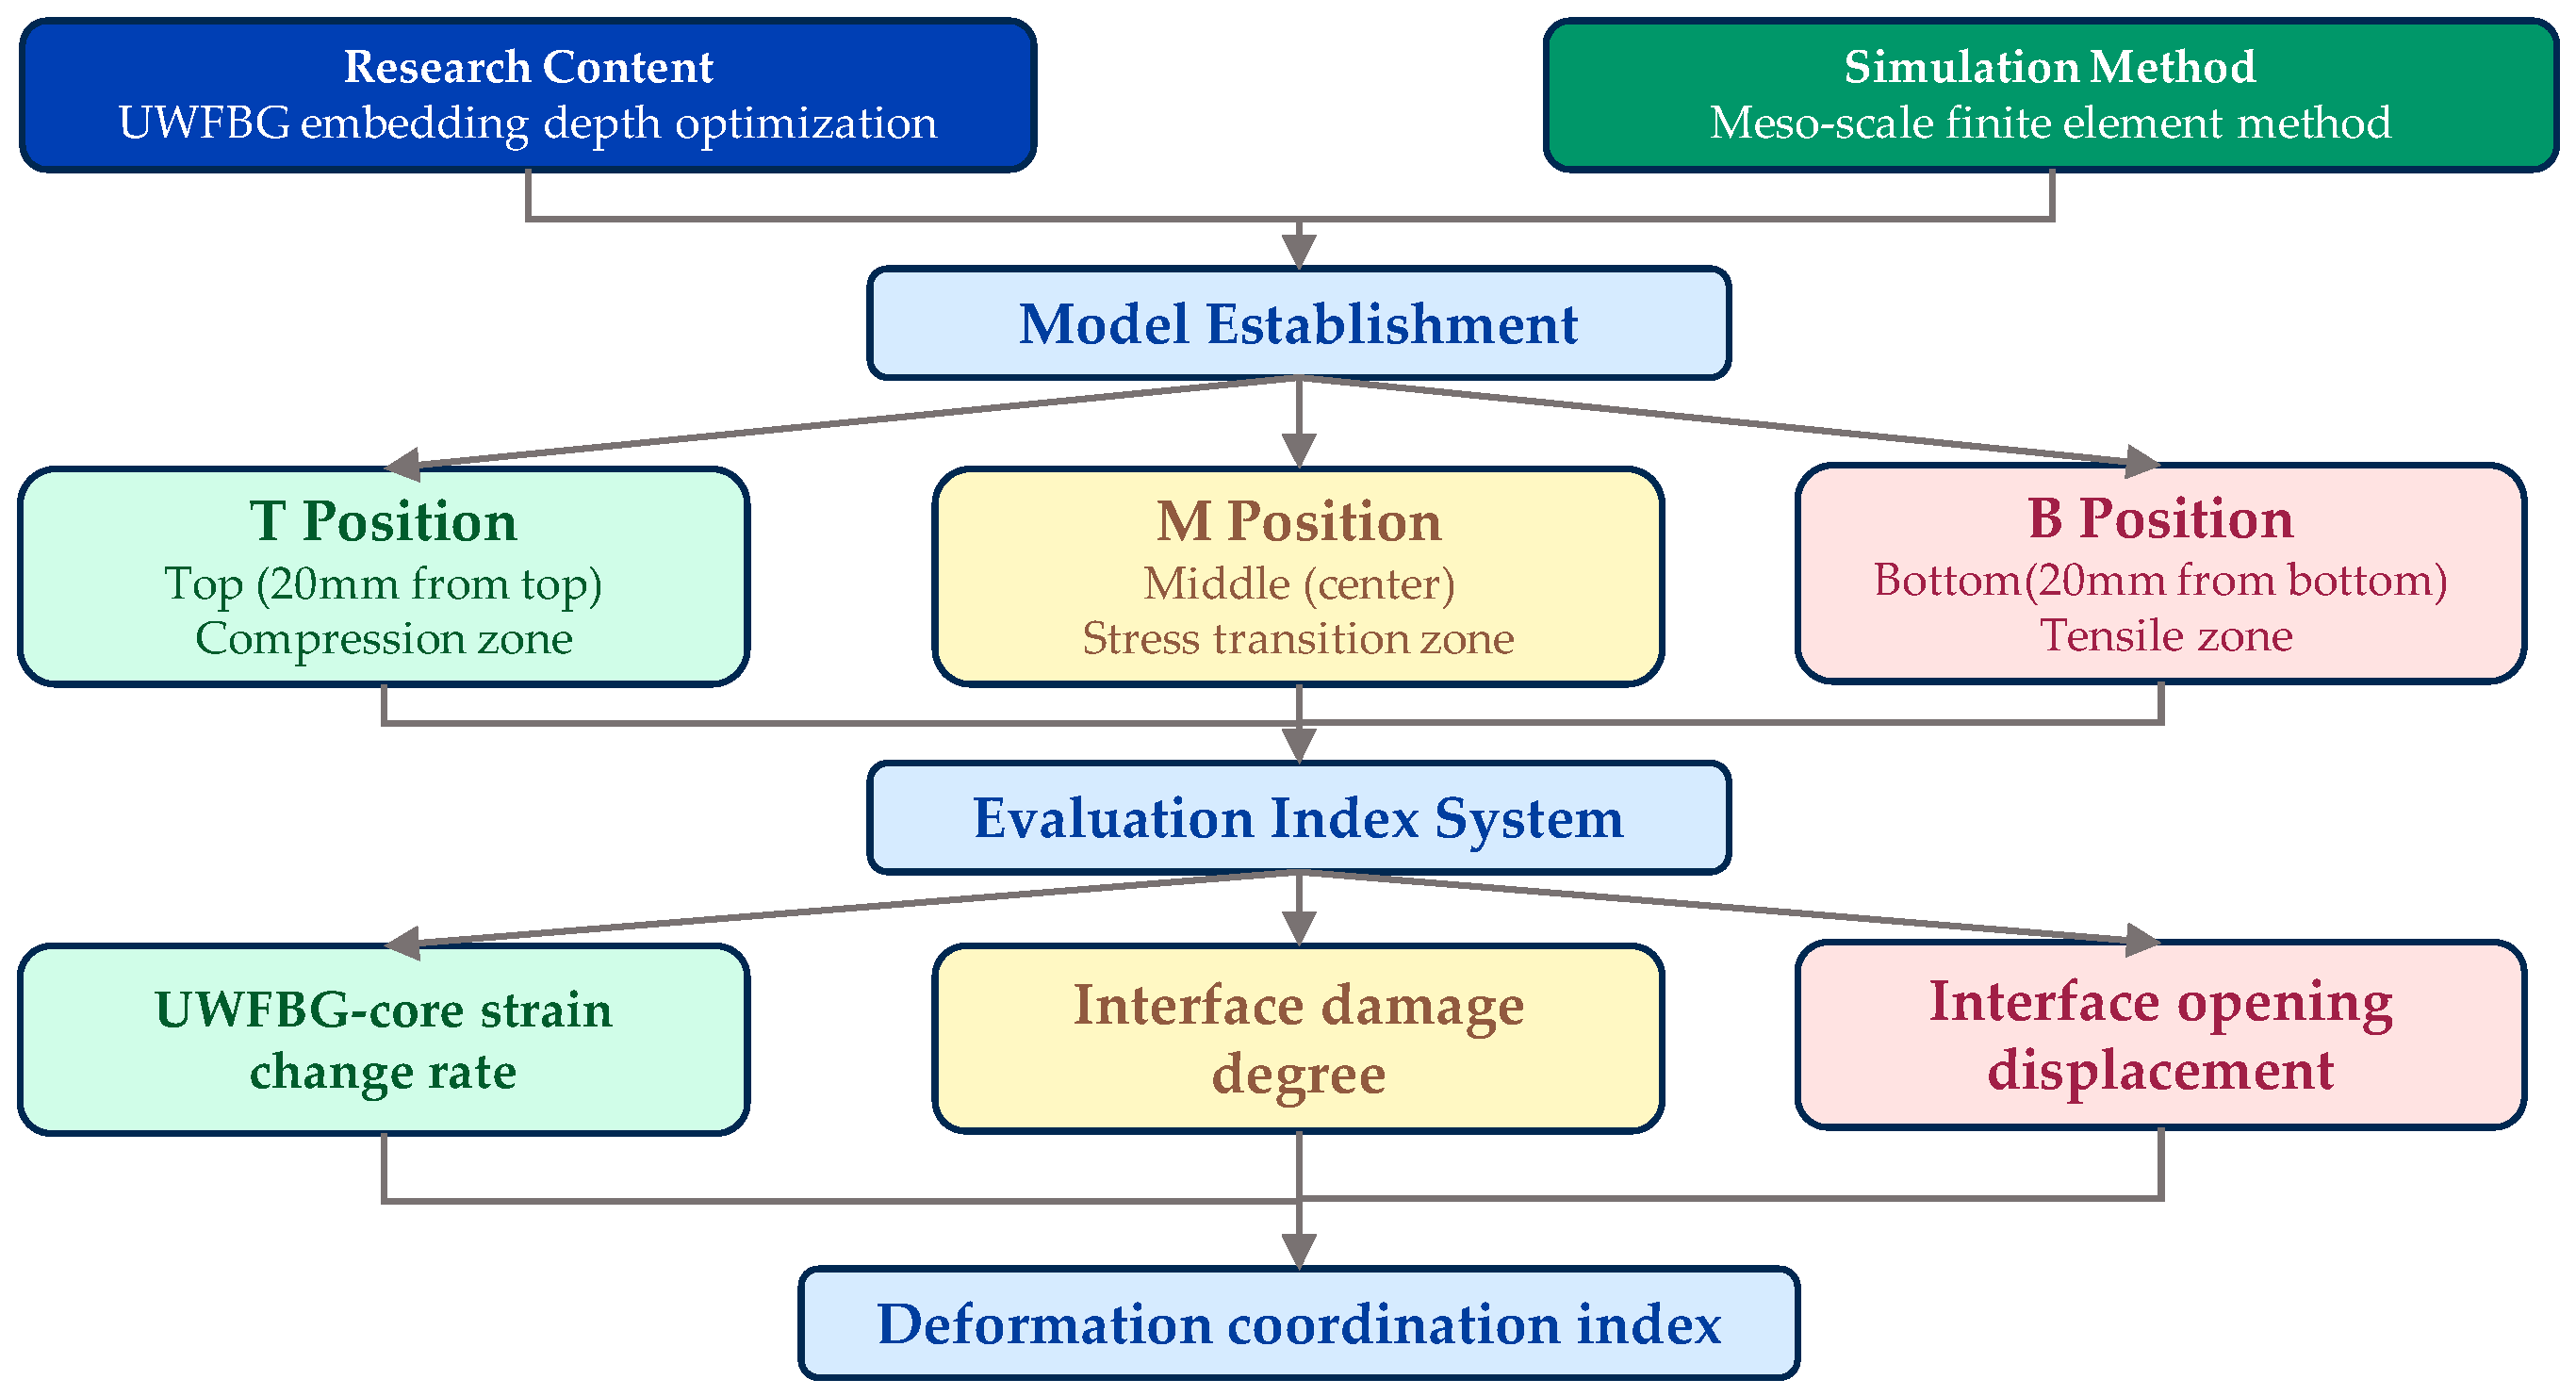
Based on the modeling approach described in Section 2.2 and the index construction method presented in Section 2.3, a numerical simulation and evaluation procedure was established to analyze the deformation coordination mechanism under different vertical embedding positions. To improve the clarity of the methodology, a flowchart illustrating the research procedure is presented in Figure 4, which summarizes the main steps of the study, including mesoscale finite element model construction, parameter extraction, evaluation index establishment, and deformation coordination index calculation.
This study aims to reveal the mechanical coordination mechanism between the asphalt mixture and the UWFBG sensors with different embedding positions. To do this, a numerical scheme that is capable of capturing nonlinear deformation and progressive interfacial degradation throughout the entire loading process is required. Moreover, in order to simulate the complete mechanical response of the UWFBG sensor–asphalt mixture system, a mesoscale finite element modeling approach was adopted, and an explicit dynamic solver with quasi-static loading control was employed. The total loading duration was set to 10 s, covering the elastic stage, the elastic–plastic transition stage, and the plastic failure stage. Representative time instants at 2 s, 5 s, and 8 s were selected according to the lateral tensile strain field evolution, ensuring that each time point corresponded to a distinct mechanical stage.
With the simulation strategy and stage division established, the next step (Model Establishment) in the framework is to construct comparable embedding configurations under strictly controlled conditions. To isolate the influence of vertical embedding position, three embedding configurations were analyzed: top (T), middle (M), and bottom (B). To ensure comparability, all models shared identical geometric dimensions, material parameters, interfacial properties, and loading conditions. The only variable was the vertical embedding position of the UWFBG sensor.
Once the embedding models were established under unified conditions, the framework proceeds to the “evaluation index system.” Since the objective is to evaluate deformation compatibility, it is necessary to extract parameters that simultaneously reflect sensor strain sensitivity and interfacial degradation behavior. To ensure consistency and minimize boundary-induced disturbances, a unified parameter extraction strategy was adopted. All interfacial response parameters (including interfacial lateral tensile strain, interface damage degree, and interface opening displacement) were extracted at the central point of the lower UWFBG sensor–asphalt contact interface. Meanwhile, to characterize the intrinsic strain response behavior of the sensor, the lateral tensile strain within the UWFBG core and its change rate were extracted along the sensor axis. At each representative stage (2 s, 5 s, and 8 s), three key indicators were obtained: (1) lateral tensile strain change rate within the UWFBG core; (2) interface damage degree; (3) interface opening displacement. Together, these indicators form the evaluation index system.
After establishing the evaluation index system, the final step in the framework is the construction of the “deformation coordination index.” Since the extracted indicators differ in magnitude and dimension, direct comparison is not feasible. Therefore, all indices were first normalized using the min–max method to eliminate dimensional discrepancies. Subsequently, weights were assigned based on the mechanical relevance of each indicator to deformation coordination. Through weighted integration, the deformation coordination index was constructed to quantitatively evaluate the compatibility between the UWFBG sensor and the asphalt mixture under different embedding positions. Through this procedure, the relationship between the lateral tensile strain response sensitivity, interfacial degradation, and overall deformation compatibility was quantified.


3. Results and Discussion

3.1. Lateral Tensile Strain Response Characteristics

3.1.1. Influence of UWFBG Vertical Position on Lateral Strain Redistribution and Evolution of Neutral Surface

To better understand the progression of the damage and strain distribution in asphalt mixture beams containing UWFBG sensors, a detailed analysis of damage was conducted at different loading stages. At the early stage (2 s), no significant damage is observed, and the lateral strain field in the midspan remains continuous. With the development of damage (5 s), strain redistribution becomes evident, and local damage initiates within the midspan region. As the loading proceeds further (8 s), damage intensifies, leading to a pronounced redistribution of lateral strain. Comparison among these three stages allows systematic characterization of the transition of tensile and compressive strain regions from a stable configuration to a significantly adjusted state. Therefore, three representative time instants (2 s, 5 s, and 8 s) were selected to capture the continuous evolution of lateral strain distribution and damage progression during loading.
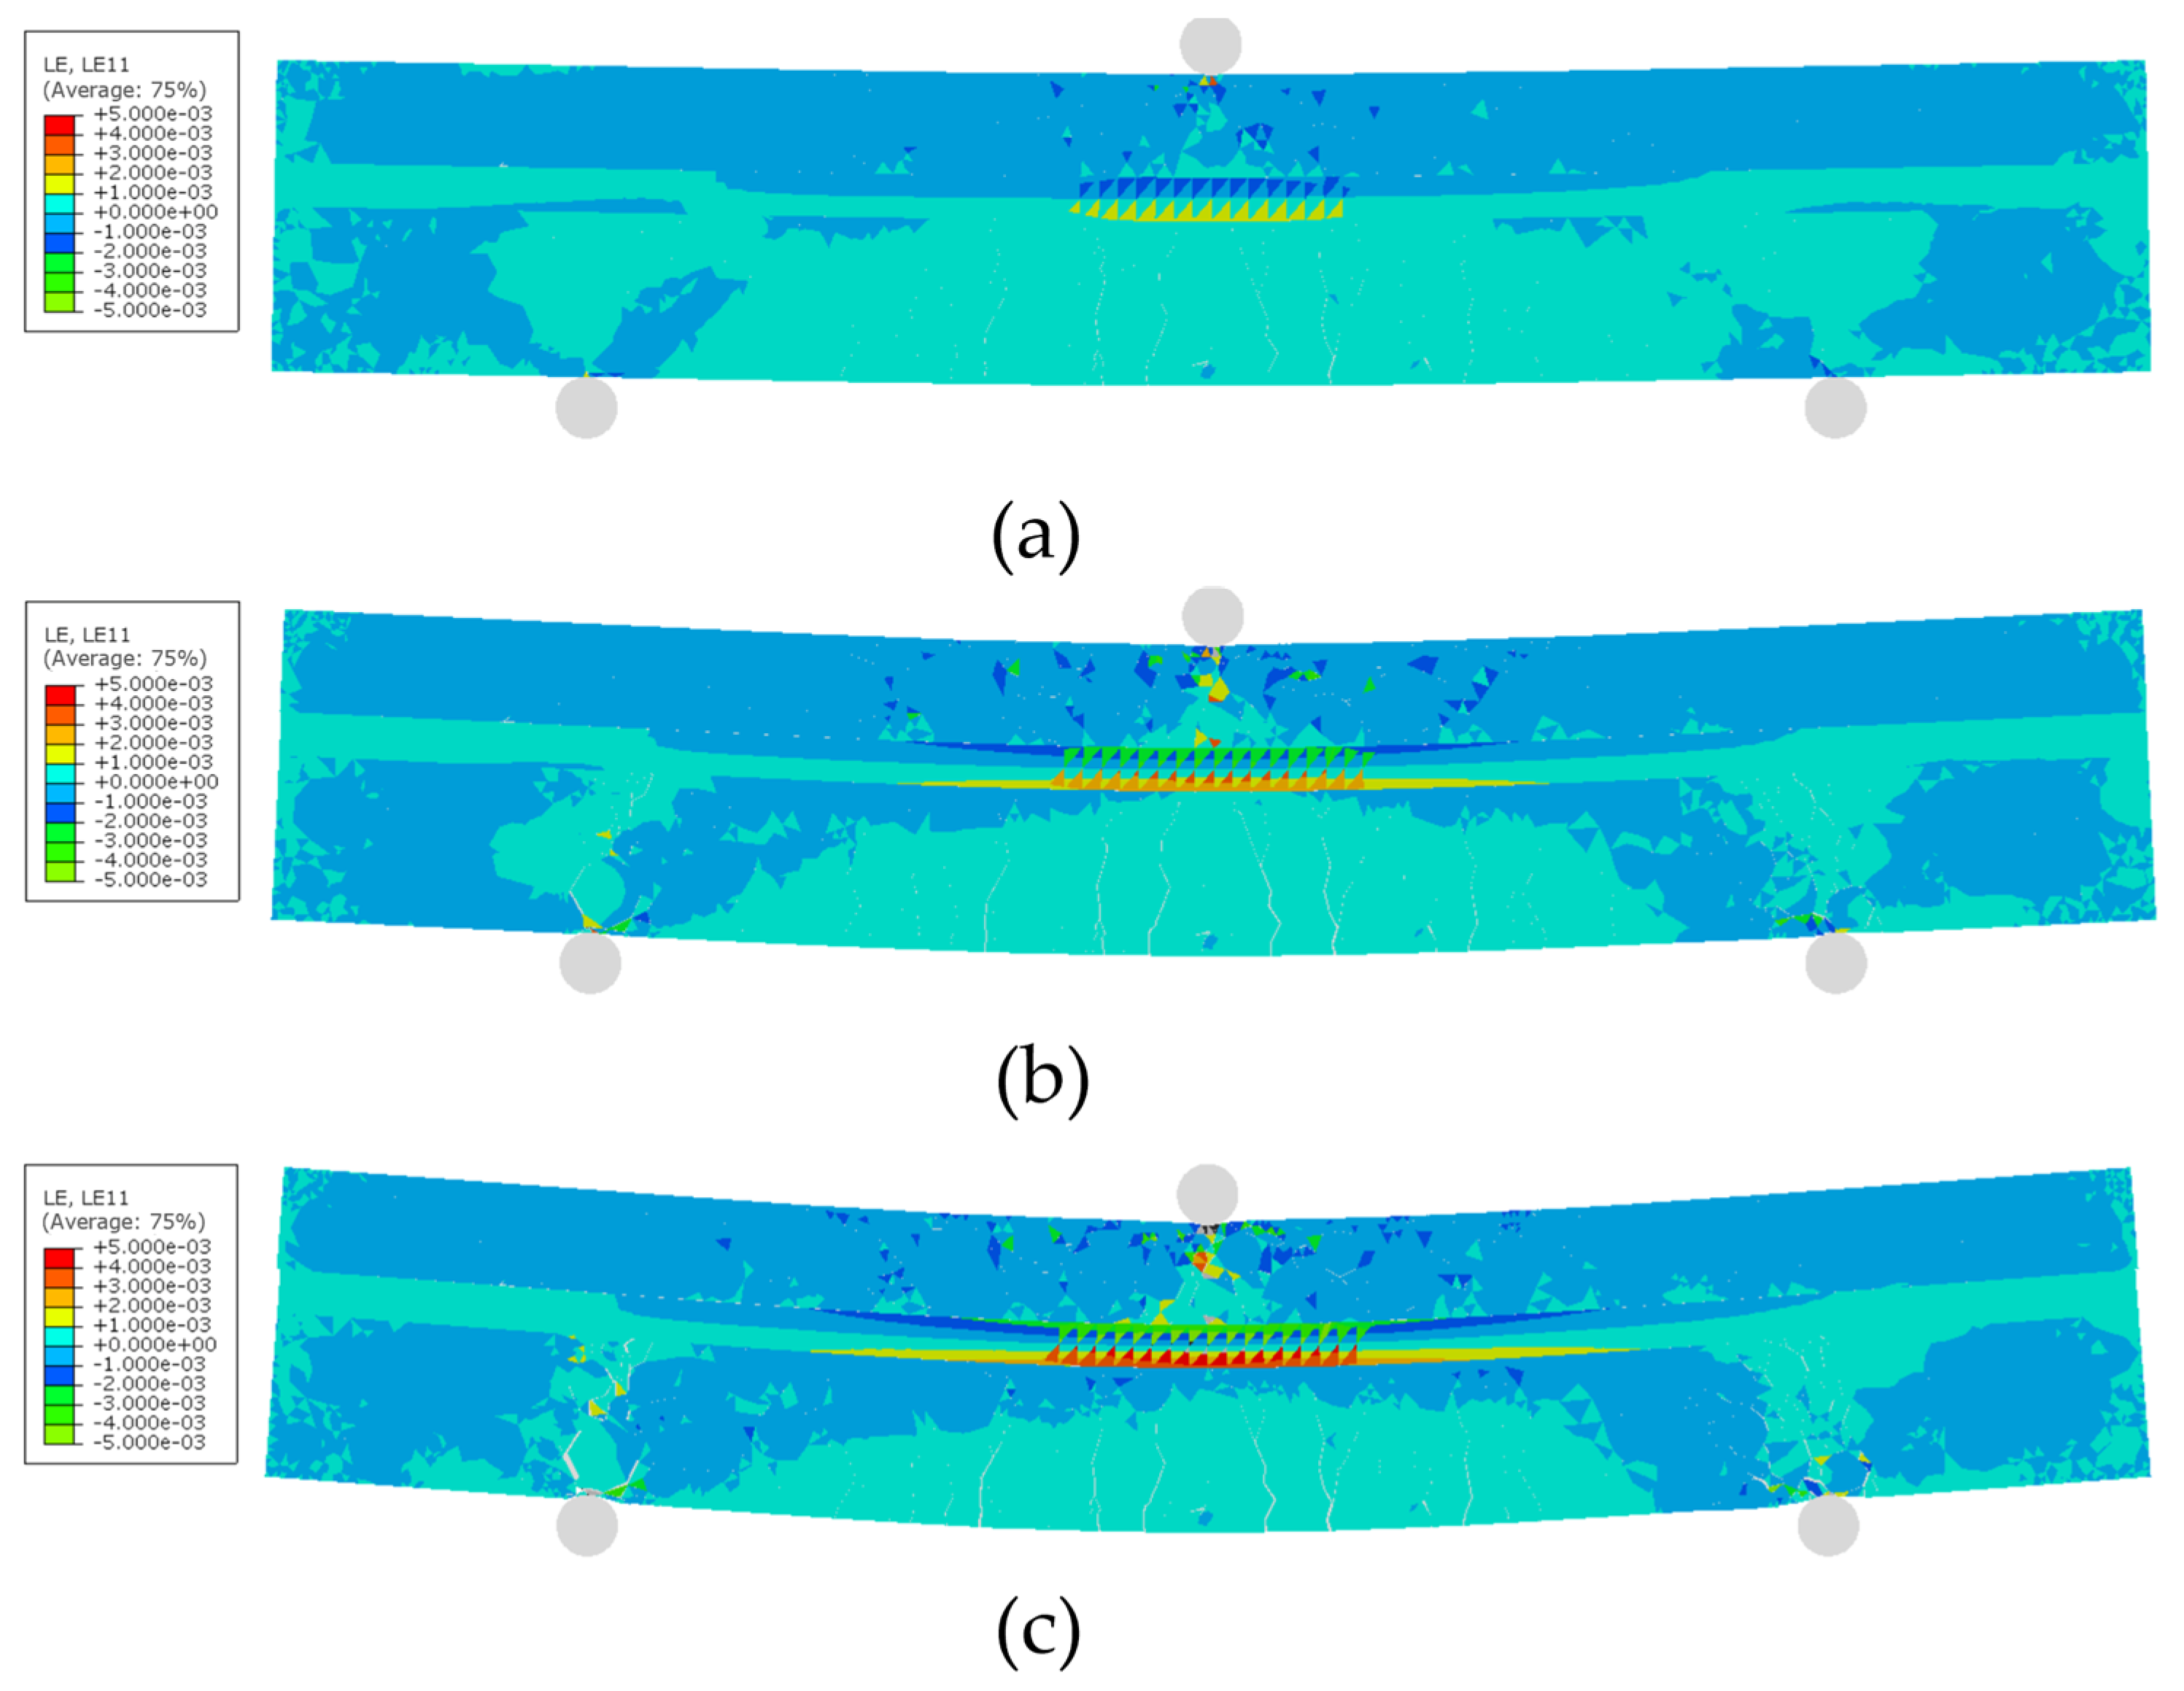
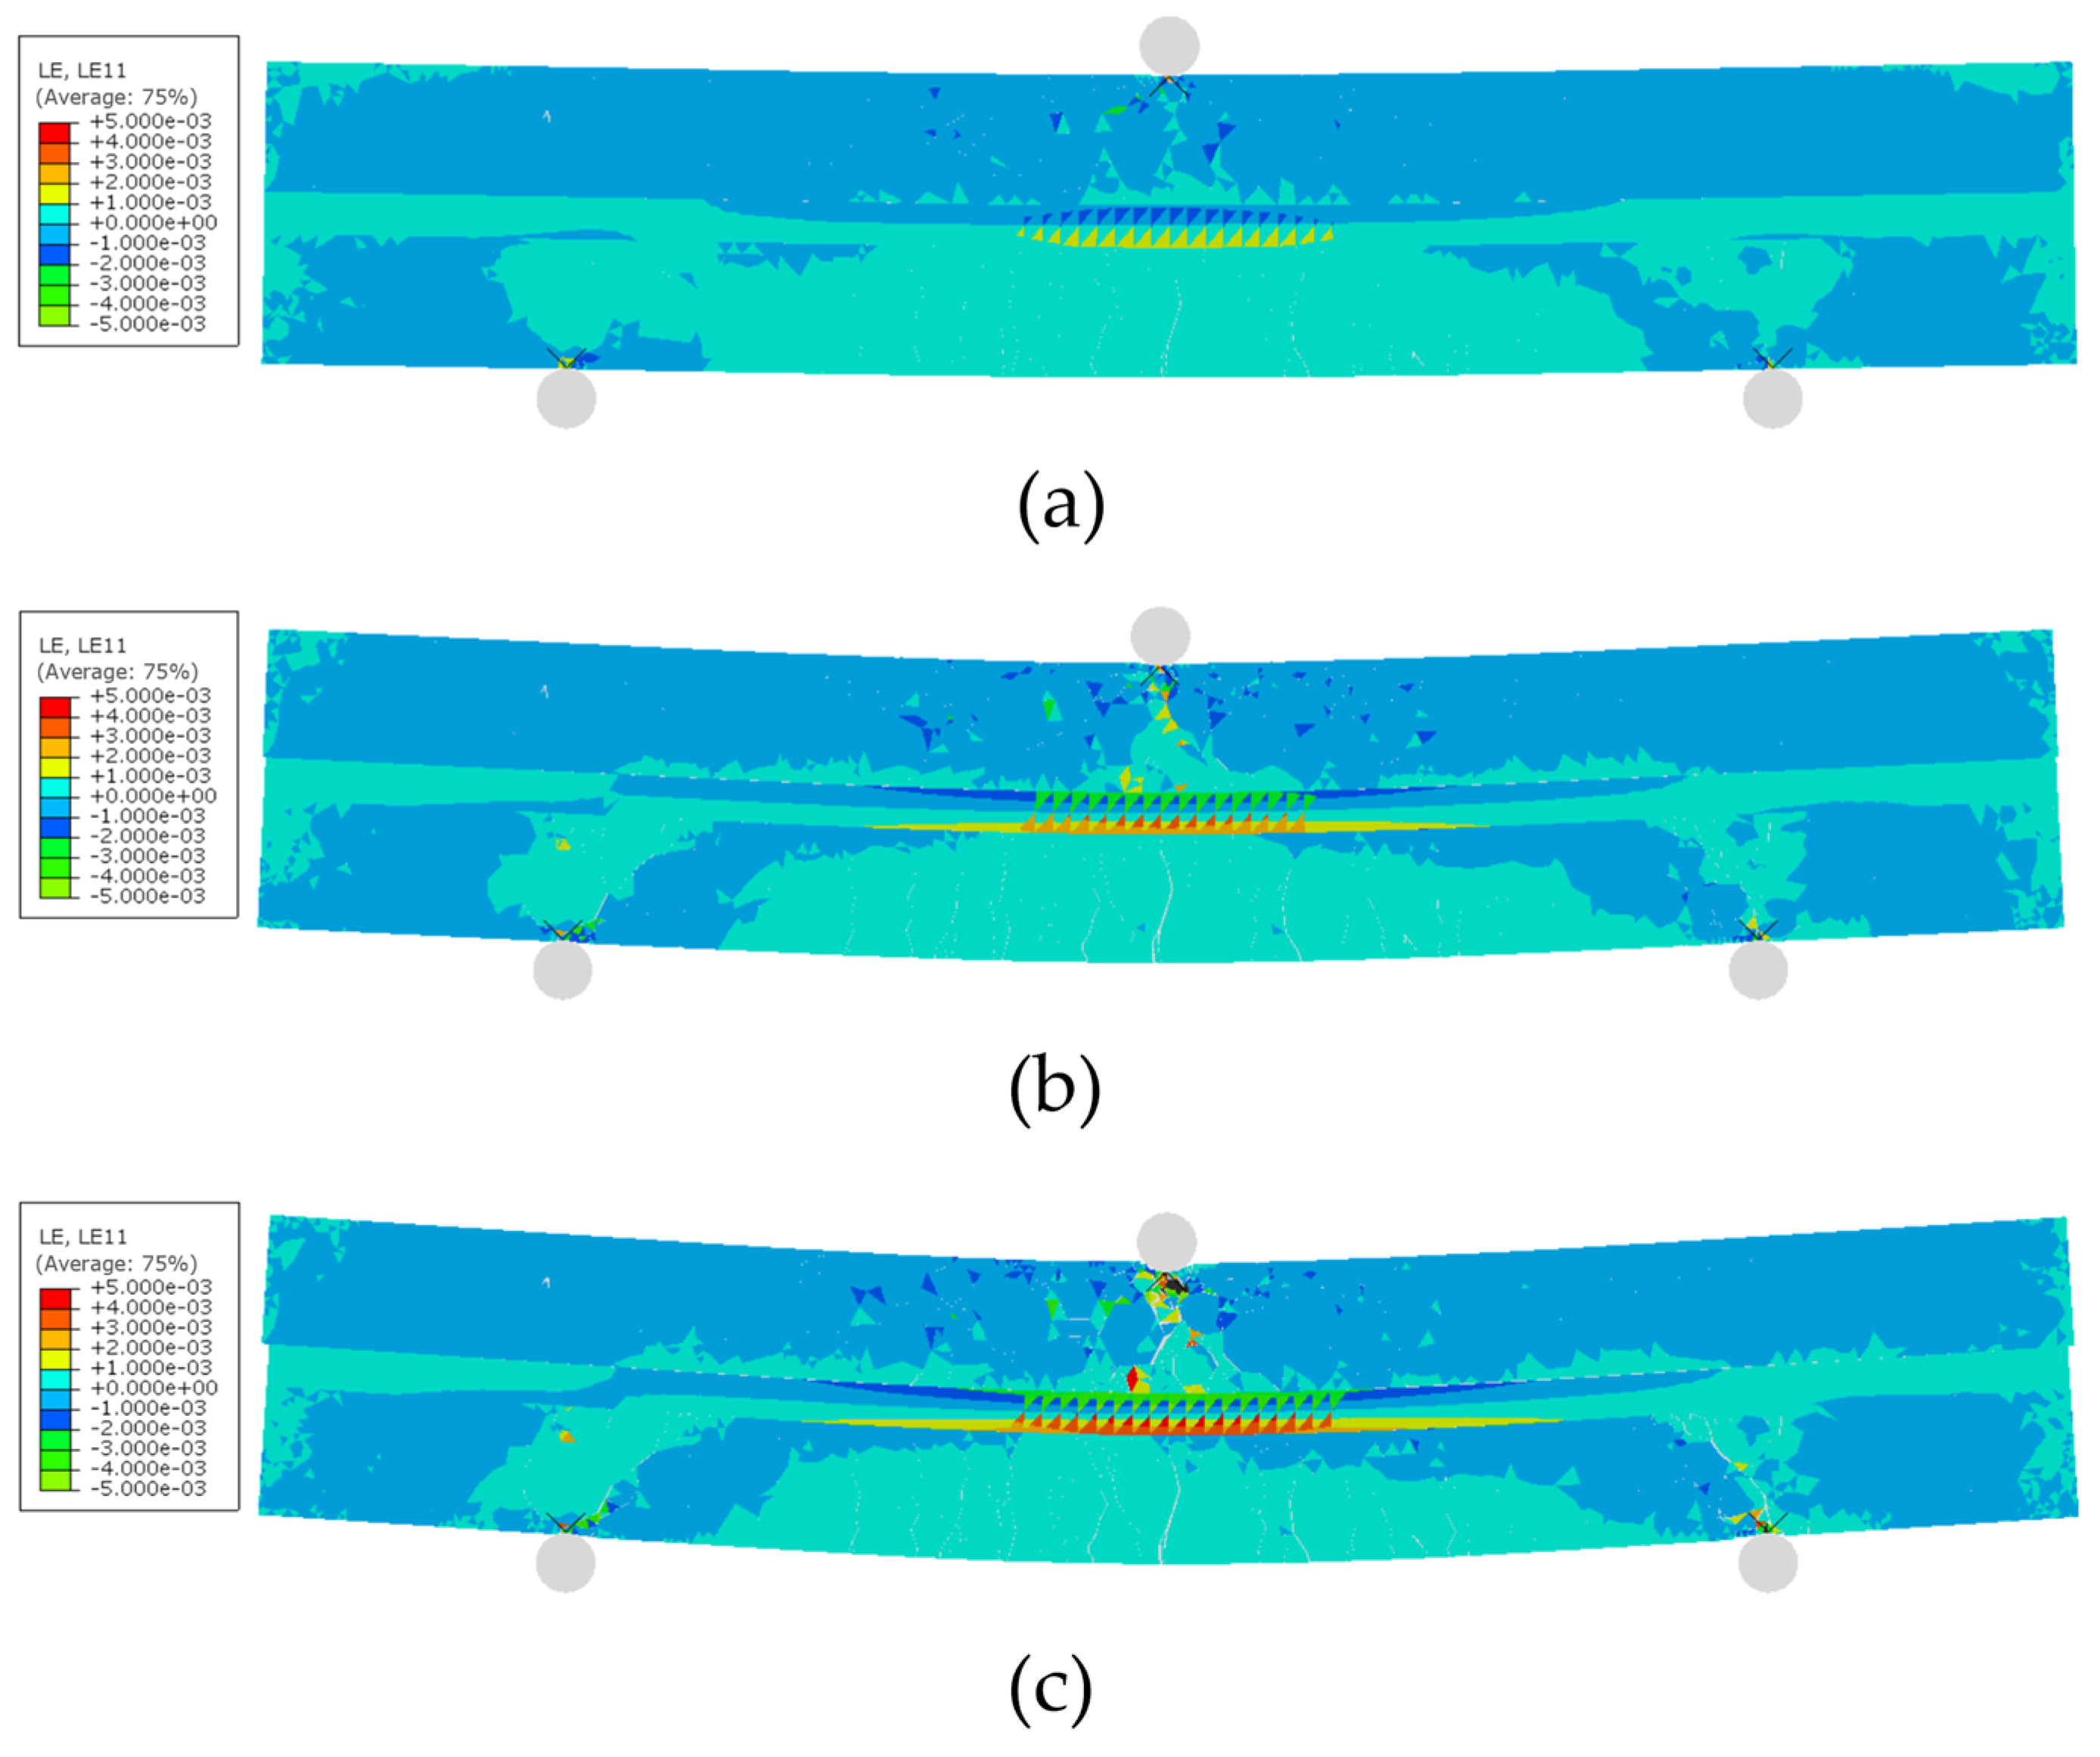
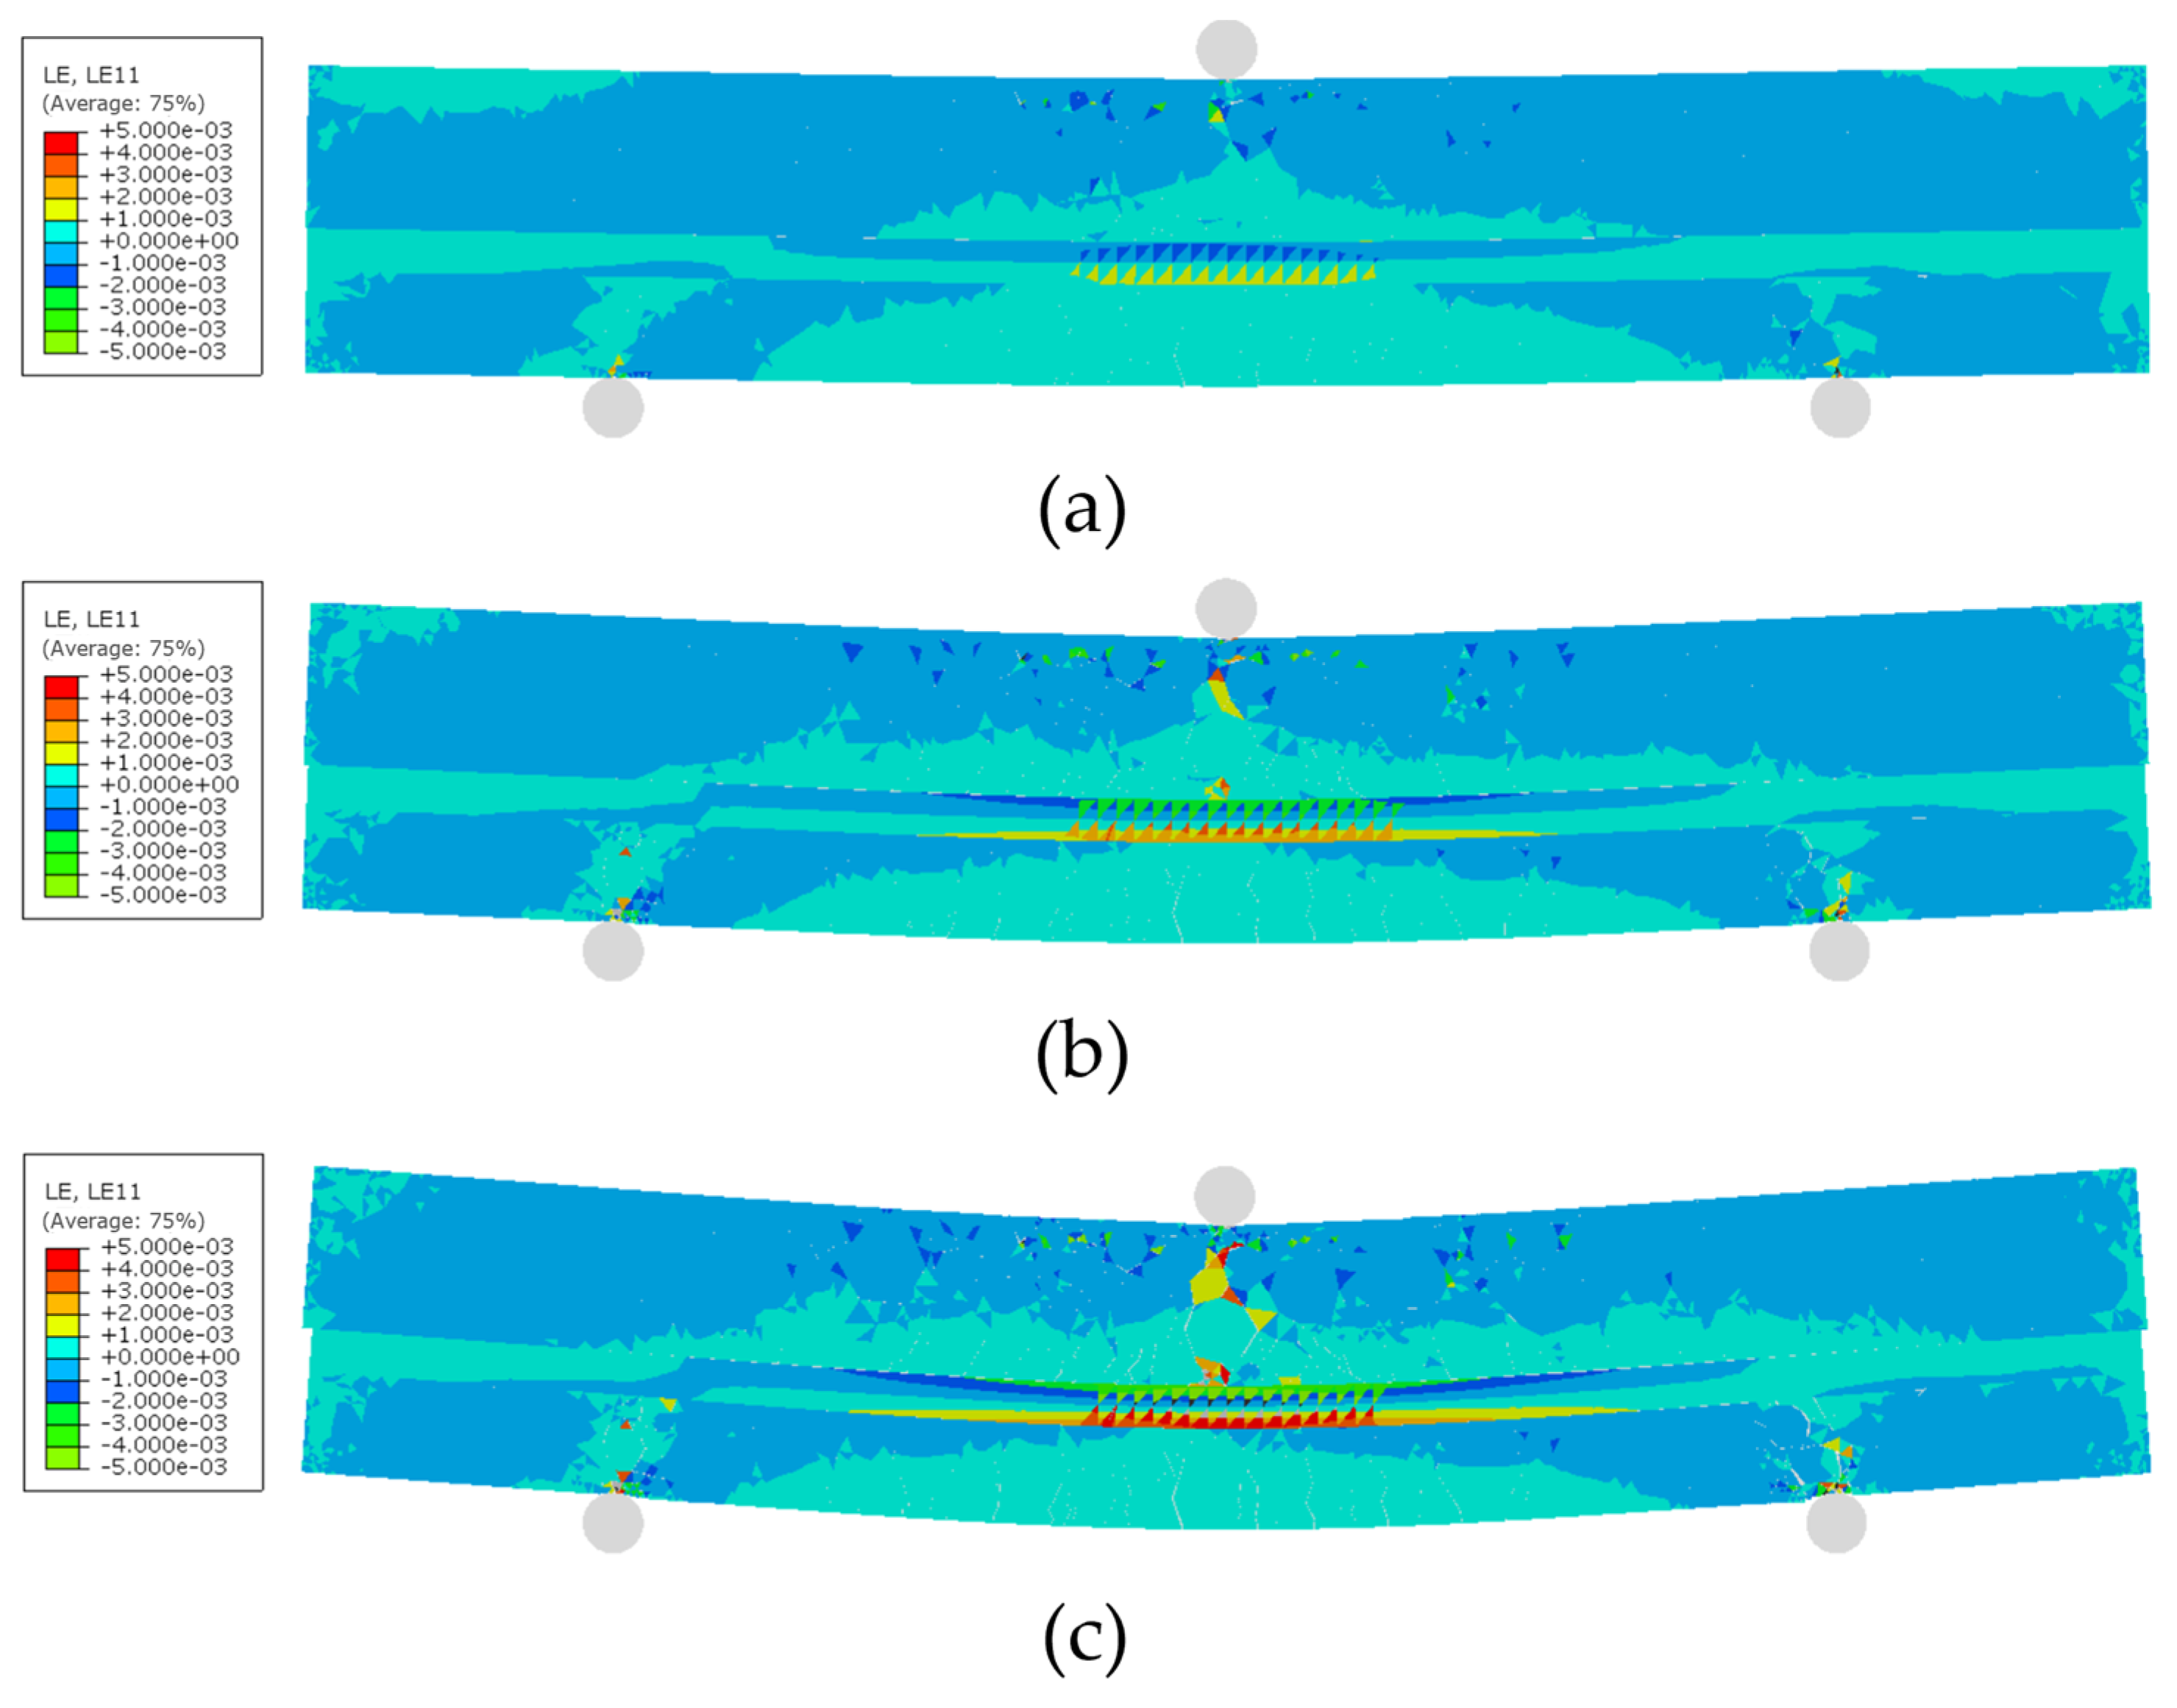
Lateral strain contour maps at loading times of 2 s, 5 s, and 8 s were obtained, as shown in Figure 5, Figure 6 and Figure 7. The contour results indicate that the junction between the maximum compressive strain region and the maximum tensile strain region within the analysis region generally coincides with the embedding position of the UWFBG. Specifically, the region above the UWFBG is dominated by compressive strain, while the region below it is dominated by tensile strain, exhibiting a typical bending response characteristic. The region between the two supports is defined as the primary analysis region, and strain outside this region is not considered in the present analysis.
Figure 5 presents the lateral strain contour distributions at representative time instants (2 s, 5 s, and 8 s) when the UWFBG is embedded at the T position. It can be observed that at 2 s, the tensile and compressive zones within the primary analysis region are clearly distinguished. At this stage, two neutral surfaces are observed. In this study, the neutral surface refers to the primary zero-lateral-strain contour extracted from the numerical strain field of the beam cross-section. The vertical coordinate of the midspan zero-strain point was extracted at different loading stages, and its normalized depth was used to track the migration of the primary neutral surface. One is located at the lower part of the UWFBG sensor, exhibiting a curved shape with a stable distribution of tensile and compressive regions; this is defined as the beam principal neutral surface. The other is located at the center of the UWFBG sensor and extends along it and is defined as the UWFBG neutral surface. This result is similar to the strain redistribution around embedded sensors reported by Liu et al. [8], while the present study further shows that the top embedding position mainly causes limited neutral surface migration during loading. When loading reaches 5 s, taking the UWFBG sensor position as the boundary, the strain distribution trend shows a clear divergence. The tensile strain above the UWFBG increases, while that below the UWFBG sensor decreases relatively. The beam principal neutral surface migrates downward as a whole, whereas the UWFBG neutral surface remains unchanged. A triangular closed central surface appears above the center of the UWFBG sensor. In heterogeneous materials such as asphalt mixtures, additional zero-strain contours may appear due to material heterogeneity and localized deformation, which are regarded as secondary neutral surfaces. At 8 s, the strain redistribution becomes more pronounced. With reference to the UWFBG sensor position, the tensile strain above it continues to increase, while the distribution of tensile strain below it further decreases. Meanwhile, the beam principal neutral surface continues to move downward, with a greater downward shift on the left side of the loading point than on the right side, which may be related to the beam’s meso-structure. In summary, under the T-position embedding condition, the junction of tensile and compressive strains consistently remains near the UWFBG sensor. As the loading level increases, the strain redistribution is primarily concentrated in the vicinity of the UWFBG sensor, while the dominant structural pattern of the overall lateral strain field between the two supports remains relatively unaffected.
To examine the effect of a UWFBG sensor located at the M position on the proportion of tensile and compressive strain regions and on the neutral surface structure, the results shown in Figure 6 are analyzed. At 2 s, within the primary analysis region, the tensile–compressive partition of transverse strain is generally consistent with that observed at position T, and two neutral surfaces are identified. When loading reaches 5 s, within the primary analysis region, taking the UWFBG sensor position as the boundary, the strain distribution trend shows a clear divergence: the tensile strain level above the UWFBG increases, while that below it relatively decreases. The beam principal neutral surface migrates downward as a whole, whereas the UWFBG neutral surface remains essentially unchanged. Meanwhile, a beam secondary neutral surface emerges above the UWFBG sensor and extends across the primary analysis region. By 8 s, within the primary analysis region, the tensile strain above the UWFBG sensor continues to increase, while the tensile–compressive strain distribution in the lower region beneath the UWFBG sensor remains largely stable. At this stage, the beam principal neutral surface remains nearly unchanged, whereas the beam secondary neutral surface continues to migrate upward. The migration of the primary neutral surface becomes more pronounced, and multiple secondary neutral surfaces appear. A similar phenomenon has been reported by Li et al. [19], whereas the present results further indicate that the middle embedding position promotes more complex neutral surface evolution. These findings demonstrate that the UWFBG sensor at the M position has a stronger promoting effect on lateral strain redistribution and neutral surface complexity compared with the T position.
To investigate the influence of a UWFBG sensor located at the B position on lateral strain redistribution and neutral surface evolution, the results shown in Figure 7 are analyzed. At 2 s, three neutral surfaces coexist within the primary analysis region. One is located above the UWFBG, forming a triangular closed shape with one side in contact with the upper edge of the UWFBG; this is defined as the beam secondary neutral surface. Another is located at the center of the UWFBG and extends along its axis, defined as the UWFBG neutral surface. The third is situated beneath the UWFBG; however, due to the presence of the UWFBG, it appears as a discontinuous curve and is defined as the beam principal neutral surface. When loading reaches 5 s, within the primary analysis region, the tensile strain region above the UWFBG expands significantly, whereas the tensile strain region below it decreases correspondingly, resulting in a pronounced zonal difference. The beam secondary neutral surface migrates upward and no longer remains in contact with the upper edge of the UWFBG. Meanwhile, the beam principal neutral surface migrates downward and gradually evolves into a continuous curve. By 8 s, within the primary analysis region, the tensile strain region above the UWFBG further enlarges, while the tensile strain region below it remains nearly unchanged, leading to a more uneven tensile strain distribution. This finding agrees with the observation by Dong et al. [32] that sensors located closer to the tensile zone exhibit stronger strain responses. At this stage, the beam secondary neutral surface continues to migrate upward, whereas the beam principal neutral surface remains essentially stable. The results indicate that the UWFBG sensor at the B position exerts the most significant promoting effect on tensile strain expansion and neutral surface complexity.
To clarify the role of UWFBG vertical embedding position in regulating tensile–compressive strain area proportions and neutral surface evolution, a comparative analysis is conducted for the T, M, and B positions at identical loading times (2 s, 5 s, and 8 s), as shown in Figure 5, Figure 6 and Figure 7. At 2 s, all configurations are characterized by a single primary neutral surface. As the embedding position shifts from T to B, the cross-sectional lateral strain distribution progressively evolves from a relatively balanced tensile–compressive state toward a tensile-dominated regime, characterized by continuous expansion of the tensile lateral strain region, contraction of the compressive region, and increasing neutral surface complexity. At 5 s, distinctions among positions begin to emerge, with the M and B locations exhibiting evident lateral tensile expansion and secondary neutral surface features. By 8 s, the disparity becomes more pronounced: the B position demonstrates the most dominant lateral tensile behavior and the highest degree of multi-neutral surface development, whereas the T position retains a comparatively simple strain morphology. Overall, increasing embedding depth markedly enhances lateral tensile dominance and neutral surface evolution within the cross-section. Moreover, the vertical location of the UWFBG regulates the redistribution of tensile and compressive strain regions by interacting with the tensile strain concentration zone, thereby controlling the migration and multiplication of neutral surfaces. The B position exhibits the most pronounced effect.

3.1.2. Strain Response Characteristics of the UWFBG Core Under Different Embedding Positions

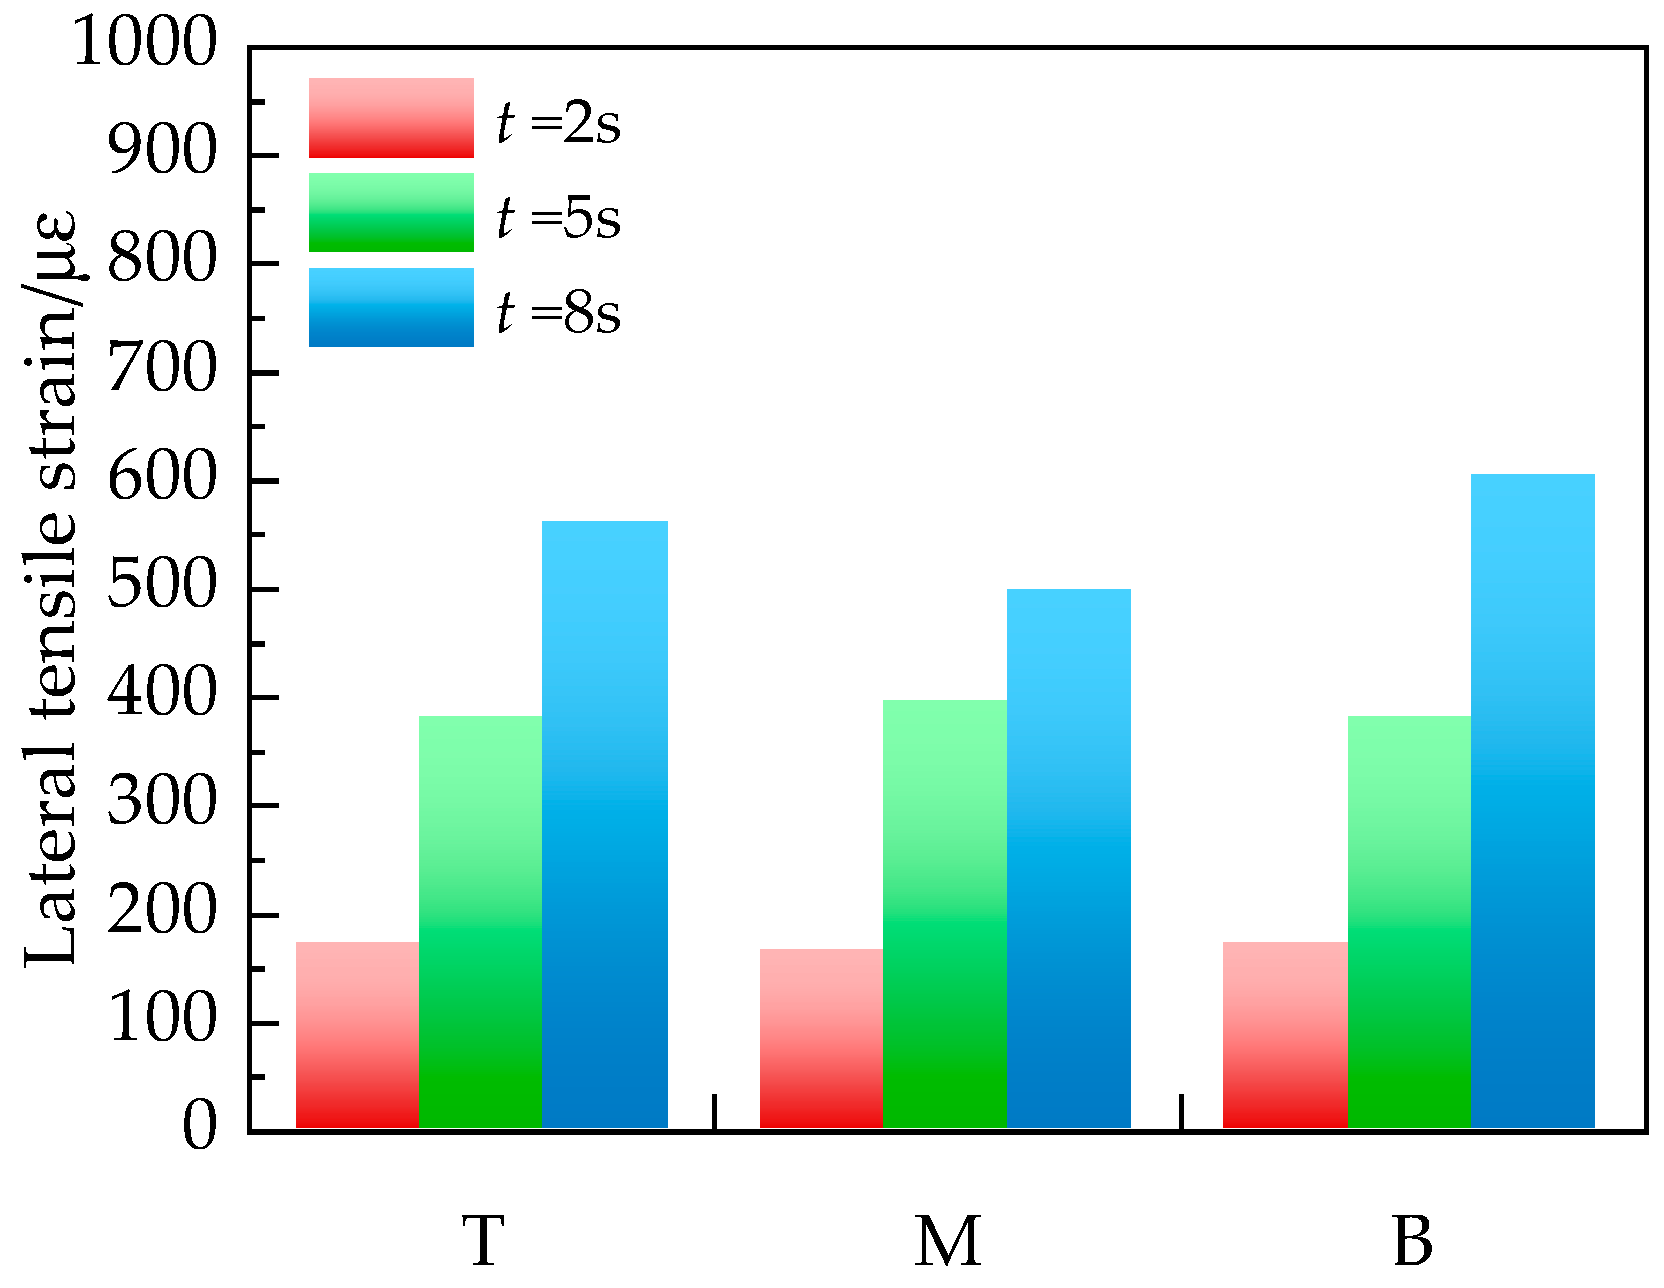
To analyze the differences in lateral tensile strain within the UWFBG core at typical loading times under different vertical embedding positions, the bar charts at 2 s, 5 s, and 8 s were examined, as shown in Figure 8. It can be observed that at 2 s, the lateral tensile strain values within the UWFBG core at different embedding positions are close to each other, and the overall differences are small. This indicates that during the initial loading stage, the strain distribution is still dominated by global bending behavior, and the influence of embedding depth on strain response remains limited. As loading progresses to 5 s, the bar heights begin to diverge, with the M position slightly higher than the T and B positions; however, the differences are still relatively small. By 8 s, the divergence becomes pronounced. The B position exhibits a significantly higher UWFBG core strain than the T and M positions, with the T position being the lowest and the M position at an intermediate level. This finding agrees with the observation by Liu et al. [21] that sensors located closer to the tensile zone exhibit stronger strain responses, while the present study further reveals the associated neutral surface migration and strain-field reorganization. This suggests that as damage develops, strain gradually concentrates in the tensile-dominated region, enabling the bottom-embedded UWFBG to obtain a greater strain response.
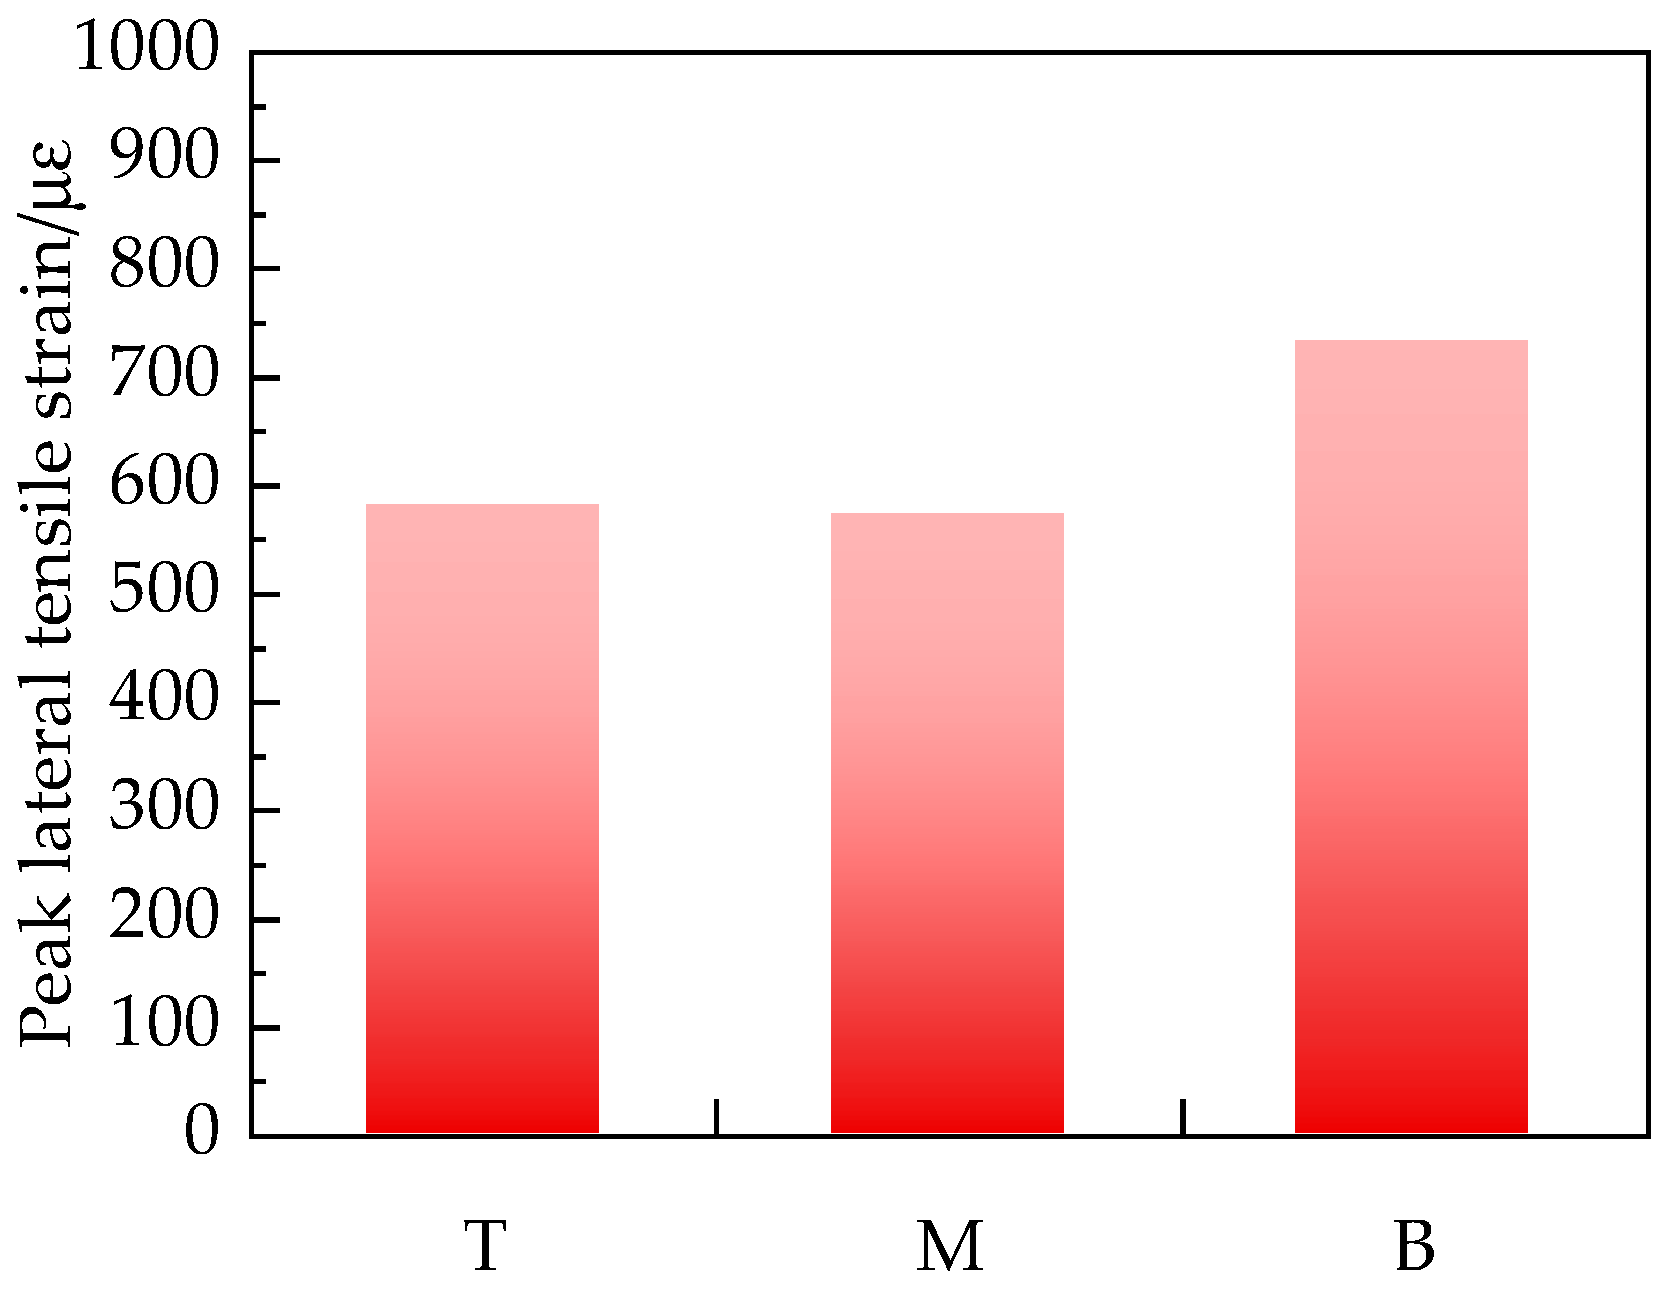
To compare the strain response levels at the ultimate state under different embedding positions, the peak lateral tensile strain within the UWFBG core was analyzed, as shown in Figure 9. The results reveal a clear increasing trend in peak strain, with the B position being the highest, followed by the M position, and the T position being the lowest. A similar deformation coordination trend was reported by Braunfelds et al. [22], while the present results further indicate that the influence of embedding depth on strain growth becomes most significant during the later loading stage. Compared with the stage-based results, the differences at the peak stage are more pronounced, indicating that as loading approaches the ultimate state, the response discrepancies among different embedding positions are further amplified. In addition, the increase in peak strain relative to the 8 s value is the greatest at the B position, suggesting that it maintains stronger strain growth capacity during the late loading stage. Overall, the vertical embedding position of UWFBG significantly affects both the magnitude and growth characteristics of its strain response, and the bottom-embedding configuration exhibits the most favorable strain capture capability during the later and ultimate loading stages.
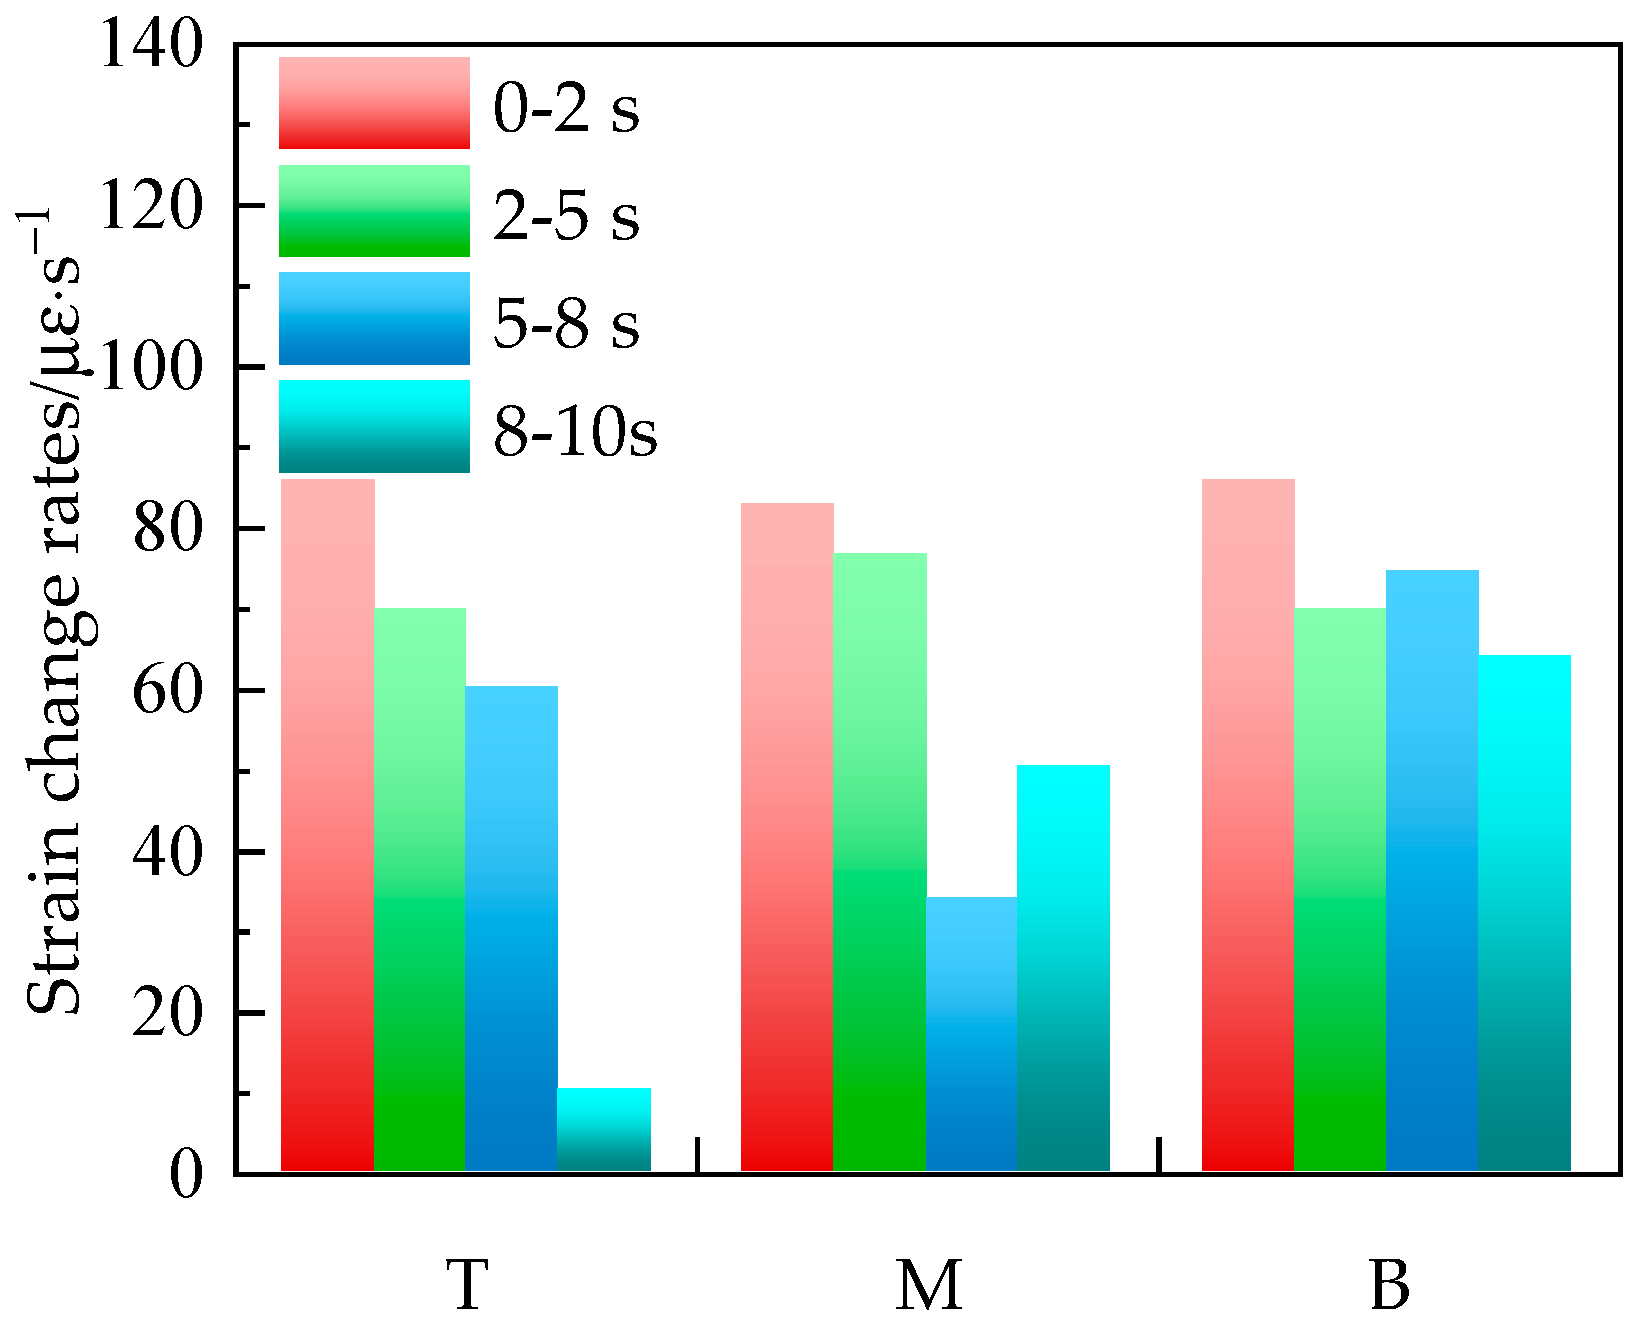
To further examine the lateral tensile strain growth characteristics within different loading intervals, the average strain change rates of the UWFBG cores during the 0–2 s, 2–5 s, and 5–8 s stages were analyzed, as shown in Figure 10. During the 0–2 s stage, the strain change rates at all positions are similar, indicating relatively uniform strain growth in the initial stage and limited influence of embedding position. In the 2–5 s stage, the M position shows a relatively higher strain change rate, reflecting a more concentrated strain growth during the intermediate stage, while the T and B positions exhibit no significant difference. In the 5–8 s stage, the B position demonstrates a markedly higher strain change rate than the T and M positions, indicating that bottom embedding provides stronger strain growth capacity during the later loading stage. Meanwhile, the strain change rate at the M position decreases compared to the previous stage, and the T position remains at a relatively low level. These results indicate that the influence of embedding depth on strain growth rate is mainly manifested in the later stage of loading.
Overall, the effect of embedding depth on the UWFBG strain response exhibits a stage-dependent characteristic: it is negligible at the early stage but becomes increasingly significant as damage evolves toward the ultimate state. The bottom-embedded configuration demonstrates superior strain amplification and evolution capacity in the later stage, indicating higher sensitivity and discrimination capability, whereas the middle and top positions remain comparatively limited.
3.1.3. Lateral Tensile Strain Response at the UWFBG Sensor–Asphalt Mixture Interface Under Different Embedding Positions

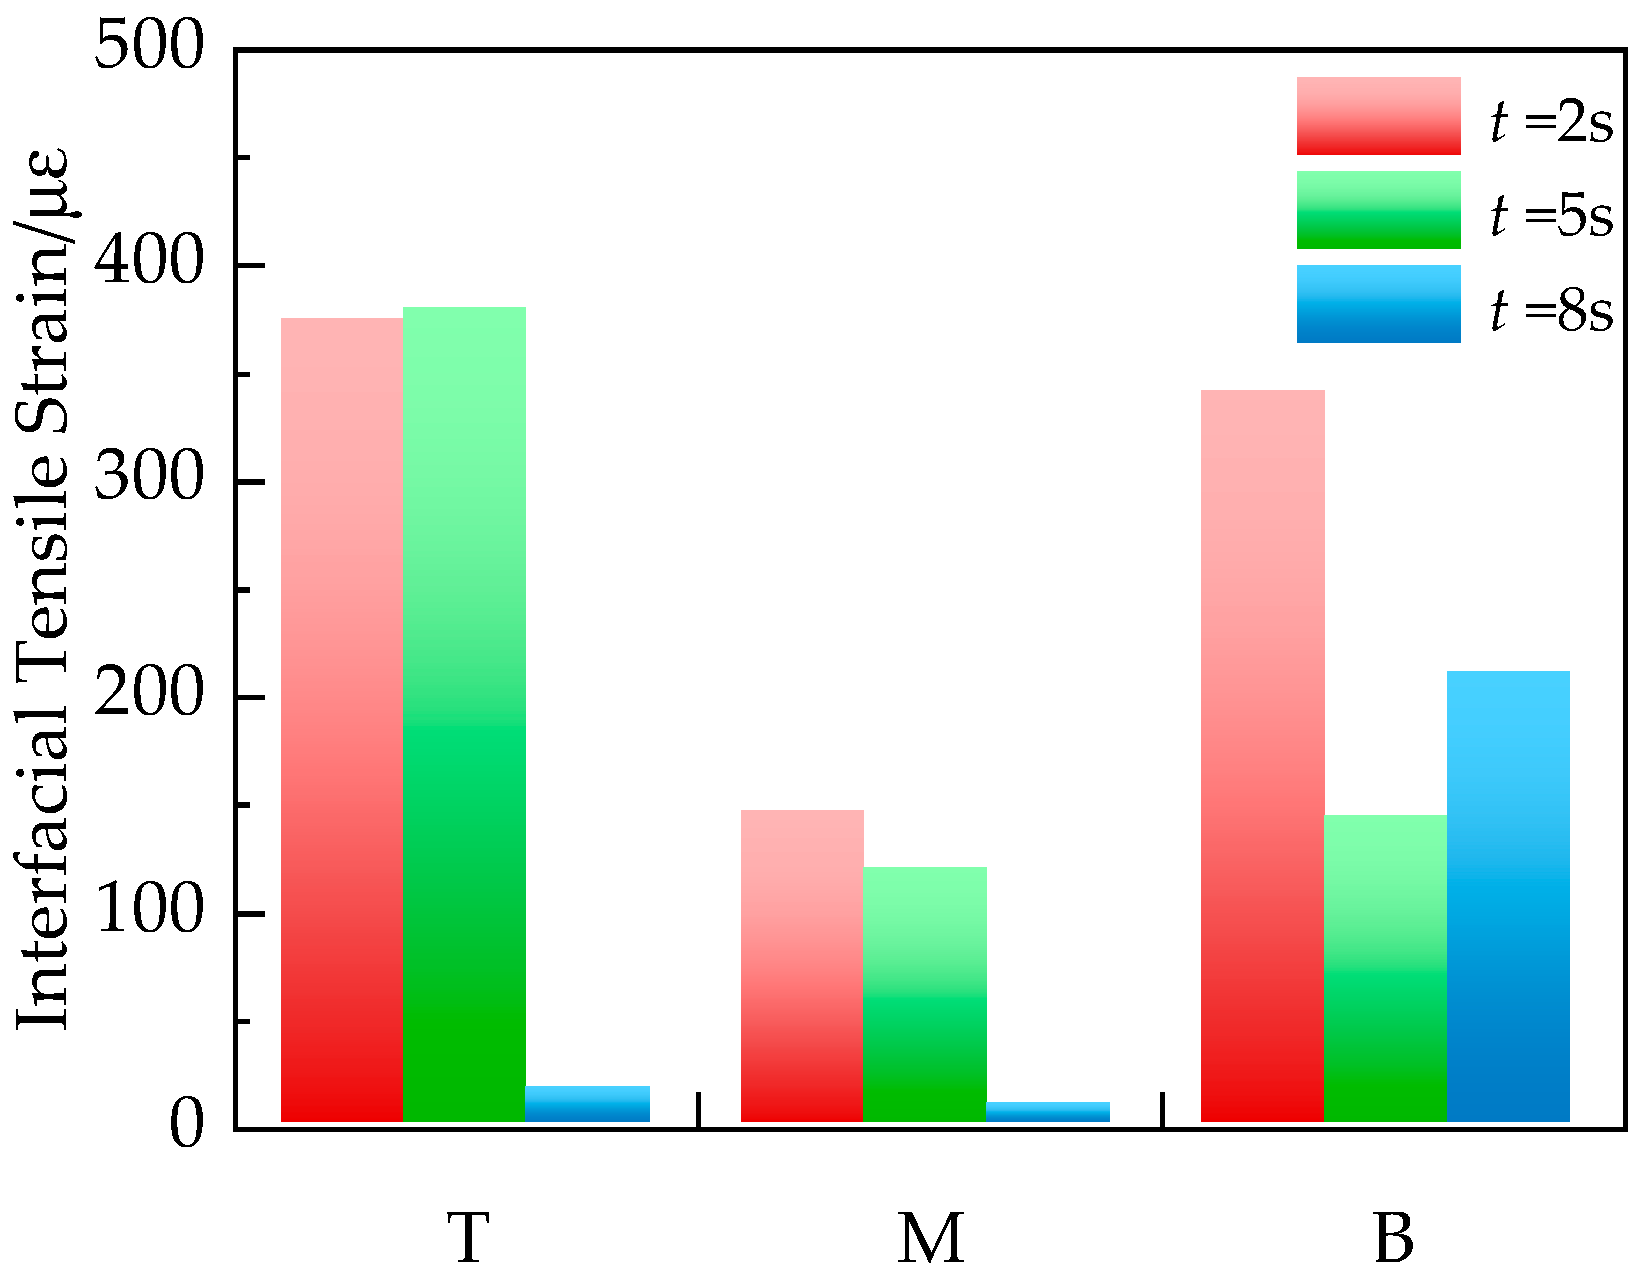
To analyze the deformation coordination characteristics under different vertical embedding positions, the central point of the lower UWFBG sensor–asphalt mixture contact interface was selected as an evaluation location. The interfacial strain at 2 s, 5 s, and 8 s was extracted and analyzed, as shown in Figure 11. This location lies within the tensile-dominated region under three-point bending and avoids stress concentration effects at the interface edges, thereby representing the stable strain transfer zone.
As observed directly from Figure 11, the interfacial lateral tensile strain at the central contact point exhibits clear stage-dependent differences among embedding positions. At 2 s, the interfacial strain values are comparable for all configurations, indicating that during the elastic stage the interface maintains good deformation compatibility and strain can be effectively transferred from the asphalt mixture to the UWFBG. As loading progresses to 5 s, the interfacial strain at the M and B positions decreases significantly, with the M position showing the lowest value, while the T position remains relatively high. This indicates that interfacial degradation begins to affect strain transfer efficiency in the middle and bottom regions during the elastic–plastic transition stage. At 8 s, the B position exhibits a markedly higher interfacial strain than the T and M positions, whereas the M position remains the lowest, demonstrating significant differences in strain retention capacity at the later stage.
Further interpretation can be made by examining the lateral strain field evolution shown in Figure 5, Figure 6 and Figure 7 (Section 3.1.1). These figures indicate that the tensile strain region progressively expands upward from the bottom as loading increases, accompanied by neutral surface migration. The tensile strain concentration is most pronounced in the B configuration. The interaction between embedded sensors and asphalt mixtures observed here is similar to that reported by Liu et al. [21], whereas this study further clarifies the coupling effect of strain-field redistribution and embedding depth on interfacial strain response. In addition, according to the lateral tensile strain within the UWFBG core and the lateral tensile strain change rate results shown in Figure 8, Figure 9 and Figure 10 (Section 3.1.2), the B position exhibits the highest core strain at 8 s, which corresponds well with the higher interfacial strain observed in Figure 11. This suggests that under bottom-embedding conditions, the interface maintains a relatively stable strain transfer path. In contrast, the M position shows a decreasing strain growth rate in Figure 10, consistent with the continuously reduced interfacial strain in Figure 11, indicating that shear-slip-dominated interfacial degradation weakens strain transfer efficiency. Therefore, the spatial variation in interfacial strain at the central contact point results from the combined effects of strain field redistribution and core strain amplification. The bottom-embedding configuration forms a stable strain amplification transfer path in the tensile zone, whereas the middle embedding position exhibits unstable transfer due to shear-slip-dominated interfacial behavior, providing a mechanical basis for subsequent interfacial damage analysis.

3.2. Interface Damage Evolution

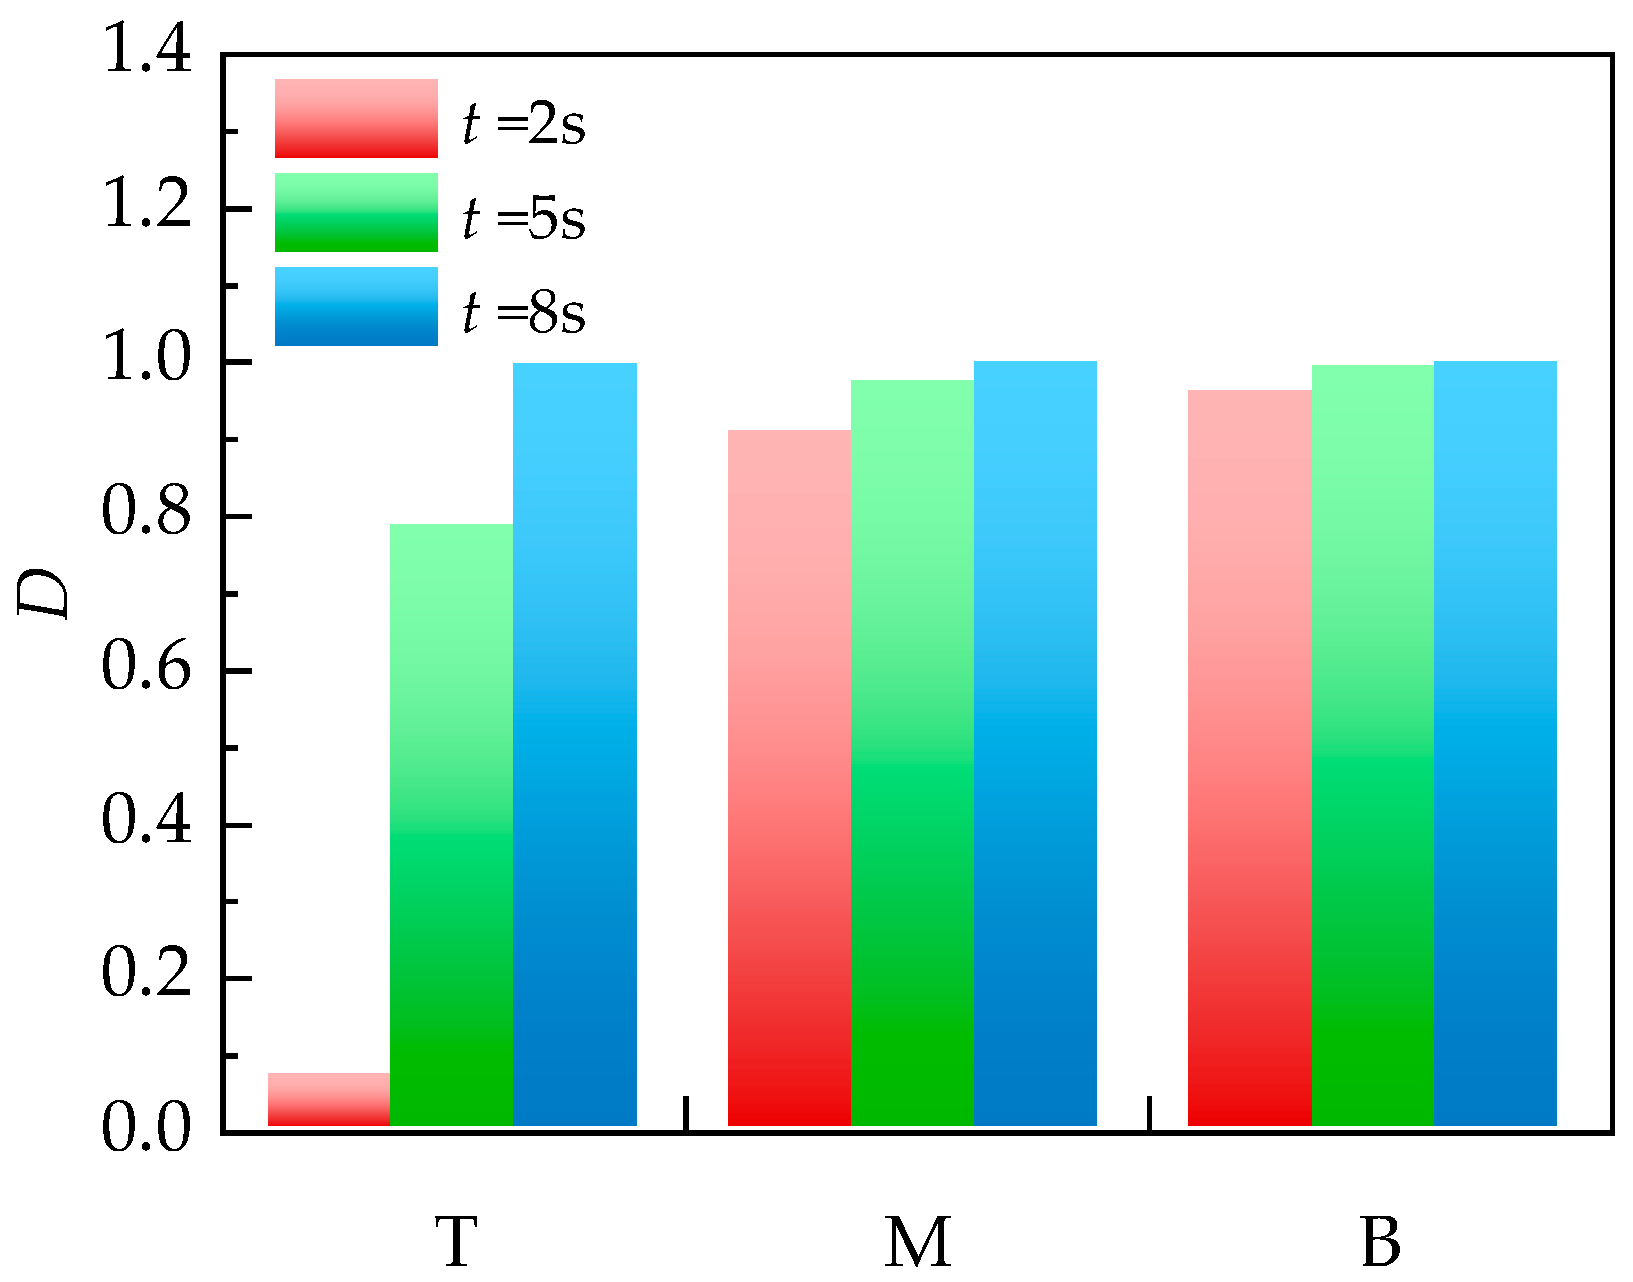
To analyze the interfacial damage evolution under different embedding positions, the interface damage degree at 2 s, 5 s, and 8 s was extracted, as shown in Figure 12. At 2 s, the damage degree at the T position remains close to zero, whereas the M and B positions already exhibit noticeable degradation, indicating earlier damage initiation in the middle and bottom regions. At 5 s, the damage degree for all configurations increases rapidly and approaches complete degradation, suggesting significant loss of interfacial strength. At 8 s, the damage degree at all positions approaches 1, indicating nearly complete interfacial failure. This evolution pattern is similar to the interfacial damage progression observed in embedded\sensor–asphalt systems reported in previous studies [34], where early damage initiation often occurs near stress concentration regions.
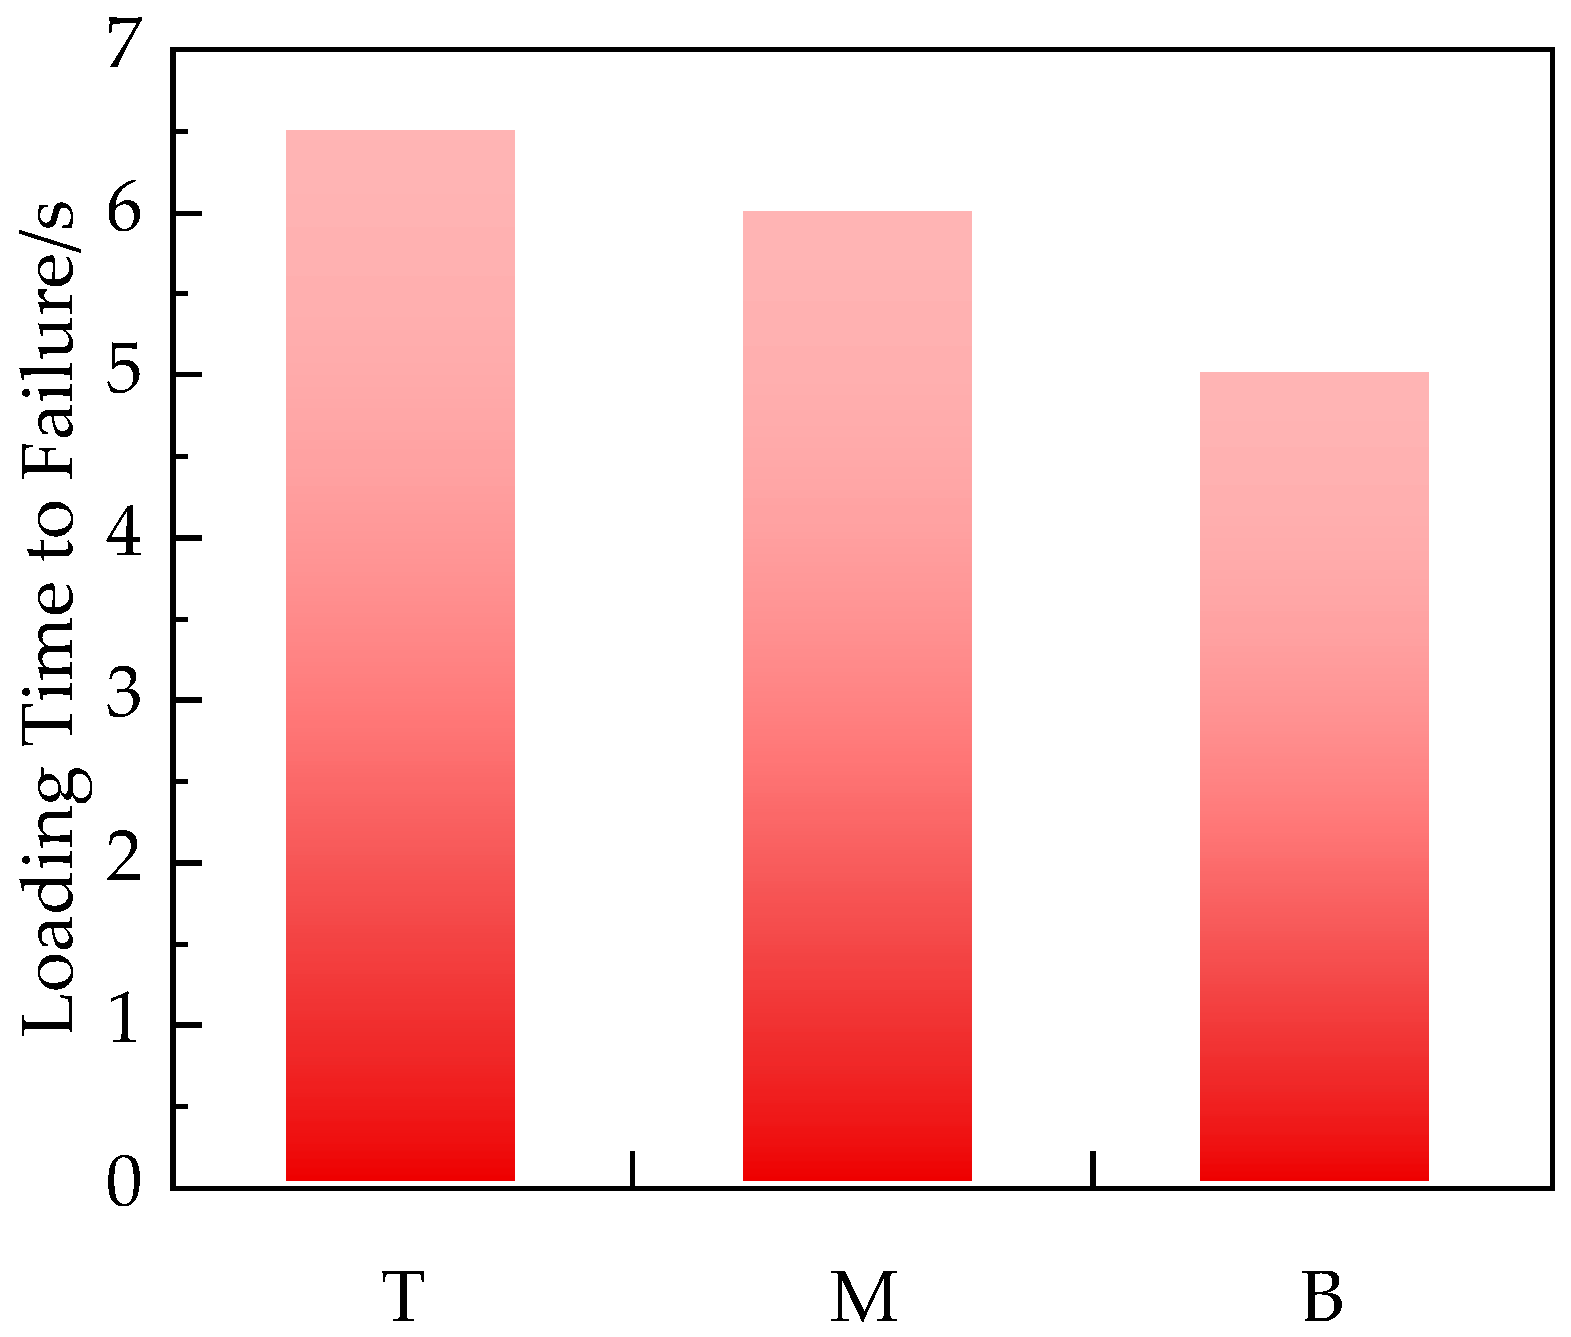
During the loading process, all interfaces ultimately reached complete failure; however, the time required to reach failure exhibited significant differences, as shown in Figure 13. It can be observed that the vertical embedding position has a pronounced effect on the failure time of the interface. Compared with the T position, the M and B positions reached complete failure earlier, indicating shorter times to failure, whereas the interface at the T position maintained its integrity for a longer duration under loading. Combining Figure 10 and Figure 11 indicates that the primary difference among embedding positions lies in damage initiation timing and degradation rate rather than in the final damage magnitude.
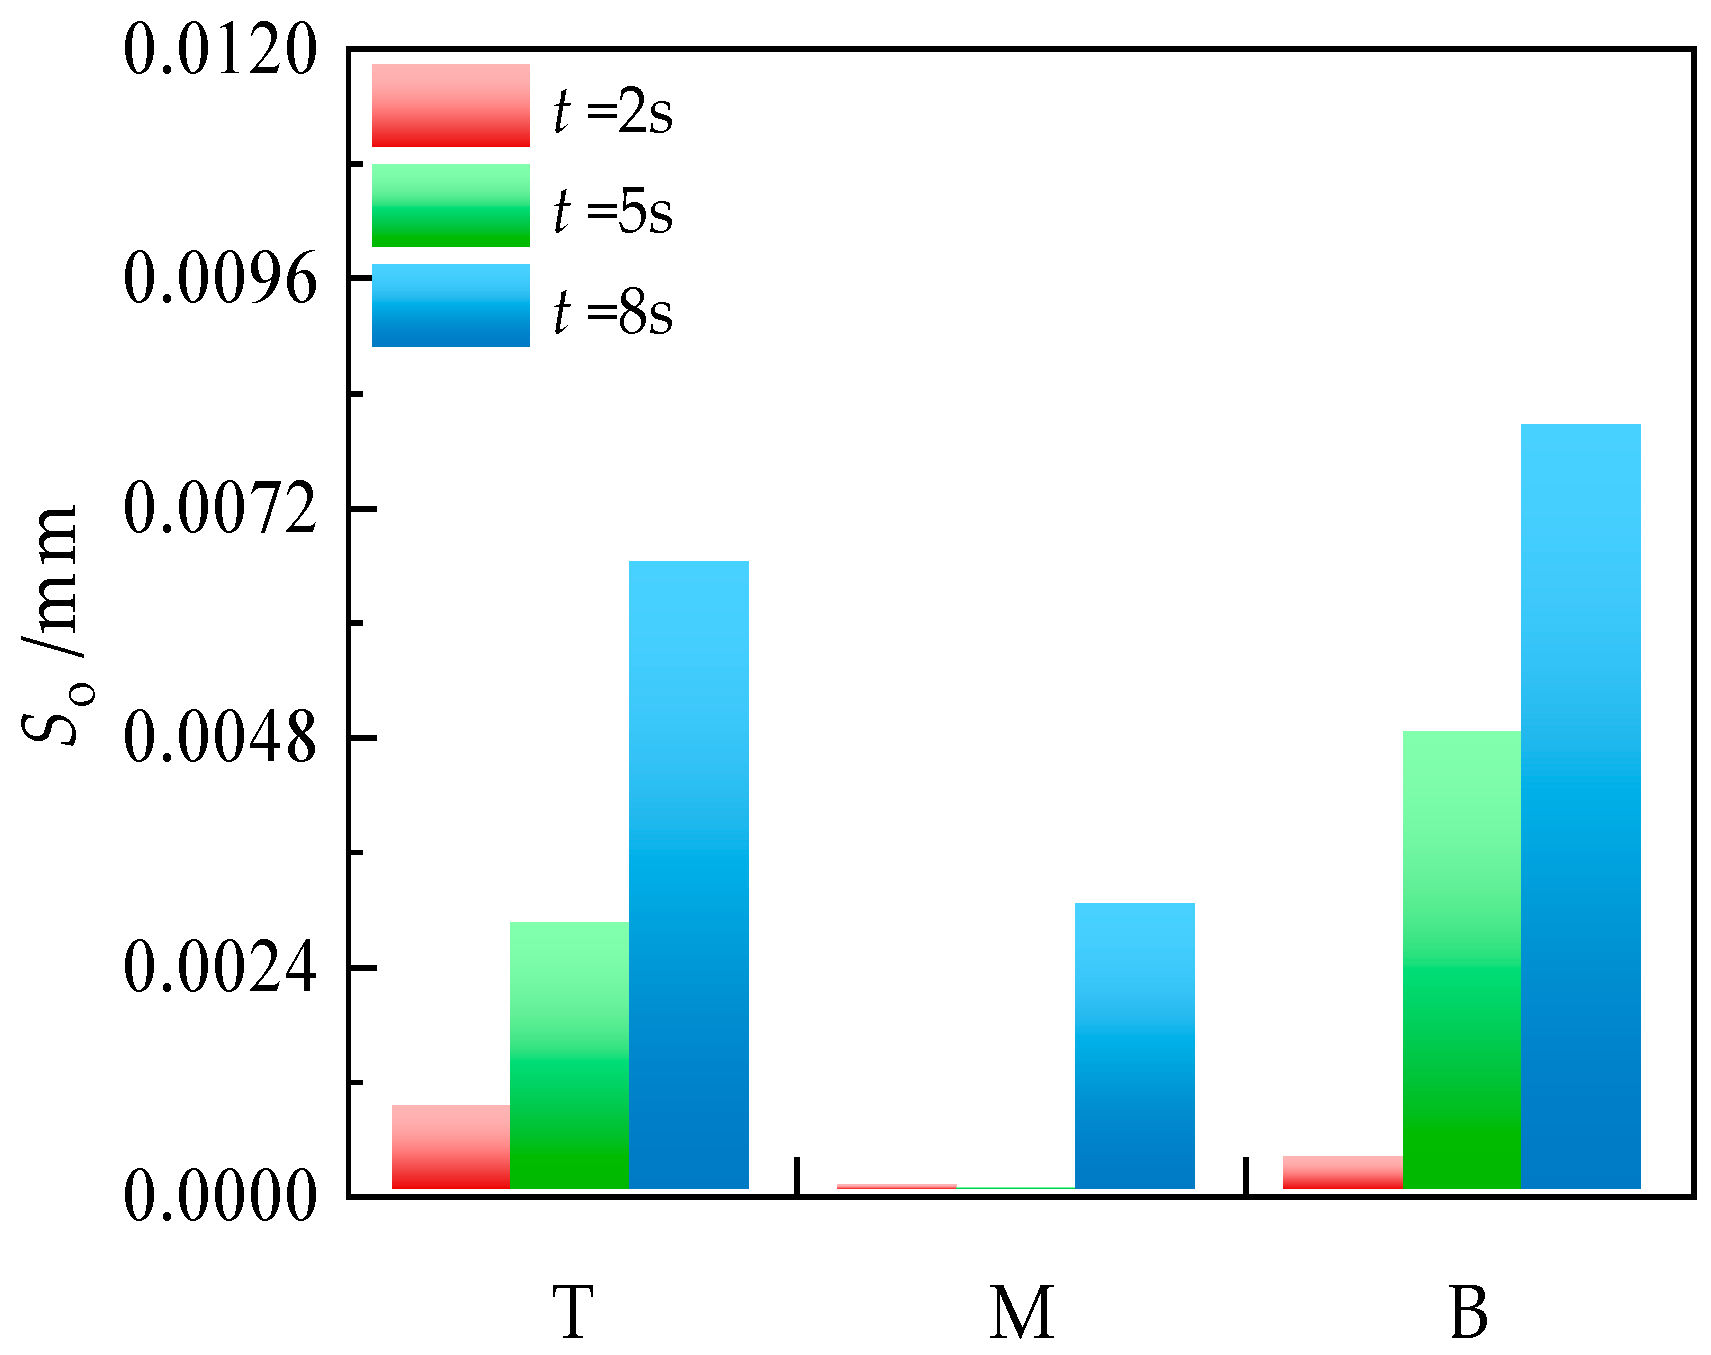
To investigate interfacial separation behavior, the interface opening displacement at 2 s, 5 s, and 8 s was analyzed, as shown in Figure 14. At 2 s, the opening displacement is small for all configurations, indicating minimal normal separation. At 5 s, the B configuration shows a significant increase in opening displacement, indicating tensile-dominated separation in the bottom region; the T configuration increases moderately, whereas the M configuration remains close to zero, suggesting shear-slip-dominated degradation. At 8 s, the B configuration continues to exhibit increasing opening displacement. This behavior is consistent with previous findings [34] showing that tensile-zone interfaces are more prone to opening separation during loading.
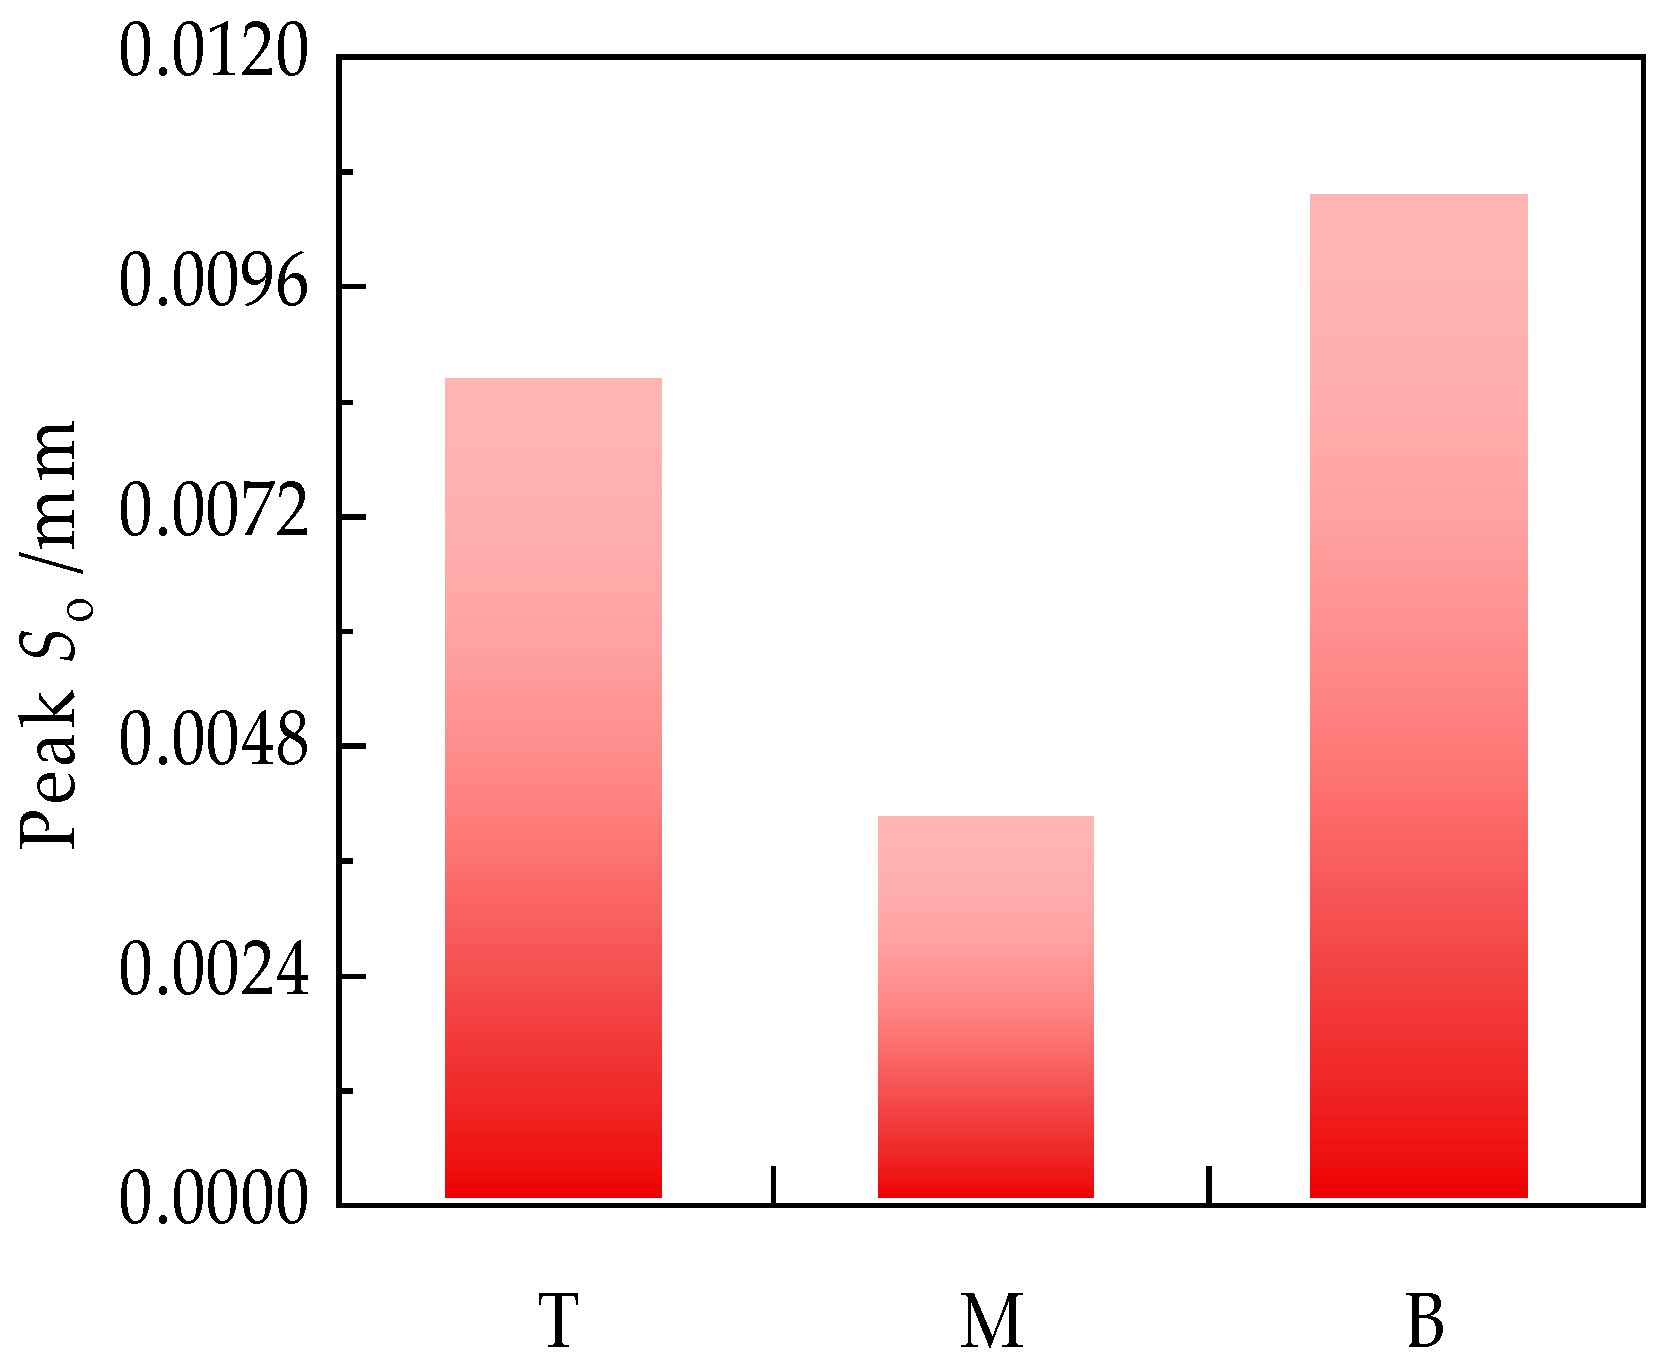
The peak-state opening displacement was further analyzed, as shown in Figure 15. The B configuration shows the largest opening, followed by the T configuration, while the M configuration remains the smallest. By combining Figure 14 and Figure 15, it can be determined that the B configuration is dominated by opening-type failure, the M configuration by shear-slip failure, and the T configuration by delayed opening failure.
Based on the combined analysis of Figure 12, Figure 13, Figure 14 and Figure 15, clear spatial differences exist in interfacial damage evolution and separation mechanisms among embedding positions. Although both M and B configurations exhibit early damage initiation, the B configuration develops a stable opening-dominated failure path, whereas the M configuration exhibits shear-slip-dominated behavior that weakens strain transfer stability. The T configuration shows delayed damage initiation but accelerated opening at later stages. Therefore, differences in interfacial failure mechanisms are the key mechanical factor governing the variation in deformation coordination performance among embedding positions.

3.3. Weighted Deformation Coordination Index Evaluation

Figure 16 illustrates the evolution of the deformation coordination index Ic for the top (T), middle (M), and bottom (B) arrangements at 2 s, 5 s, and 8 s. The index is calculated based on the normalized strain change rate, interface damage degree, and interface opening displacement, with interface damage degree and interface opening displacement treated as negative indicators. A higher value of Ic indicates better deformation compatibility between the fiber and the mixture. The index is calculated according to Equation (4). The weights used in the deformation coordination index were determined using the AHP, as described in Section 2.3.
As illustrated in Figure 16, the T model exhibits the highest deformation coordination index at the early stage (2 s), indicating that the interface at the top position remains largely intact and the deformation of the fiber and mixture is highly synchronized. At the mid stage (5 s), the M model shows a relatively higher coordination degree, suggesting that despite rapid interface degradation, deformation compatibility can be temporarily maintained, which is consistent with a shear- or slip-dominated debonding mechanism. At the late stage (8 s), a clear divergence in deformation coordination behavior is observed among the three vertical arrangements. The B model exhibits the highest deformation coordination index, whereas the M model shows the lowest value. Although significant normal opening develops at the bottom position, its deformation evolution remains relatively stable, resulting in better overall compatibility. In contrast, severe degradation combined with poor coordination leads to a pronounced reduction in deformation compatibility at the middle position. This indicates that the bottom-embedding configuration provides better long-term deformation compatibility and a more stable strain transfer mechanism between the UWFBG sensor and the asphalt mixture.
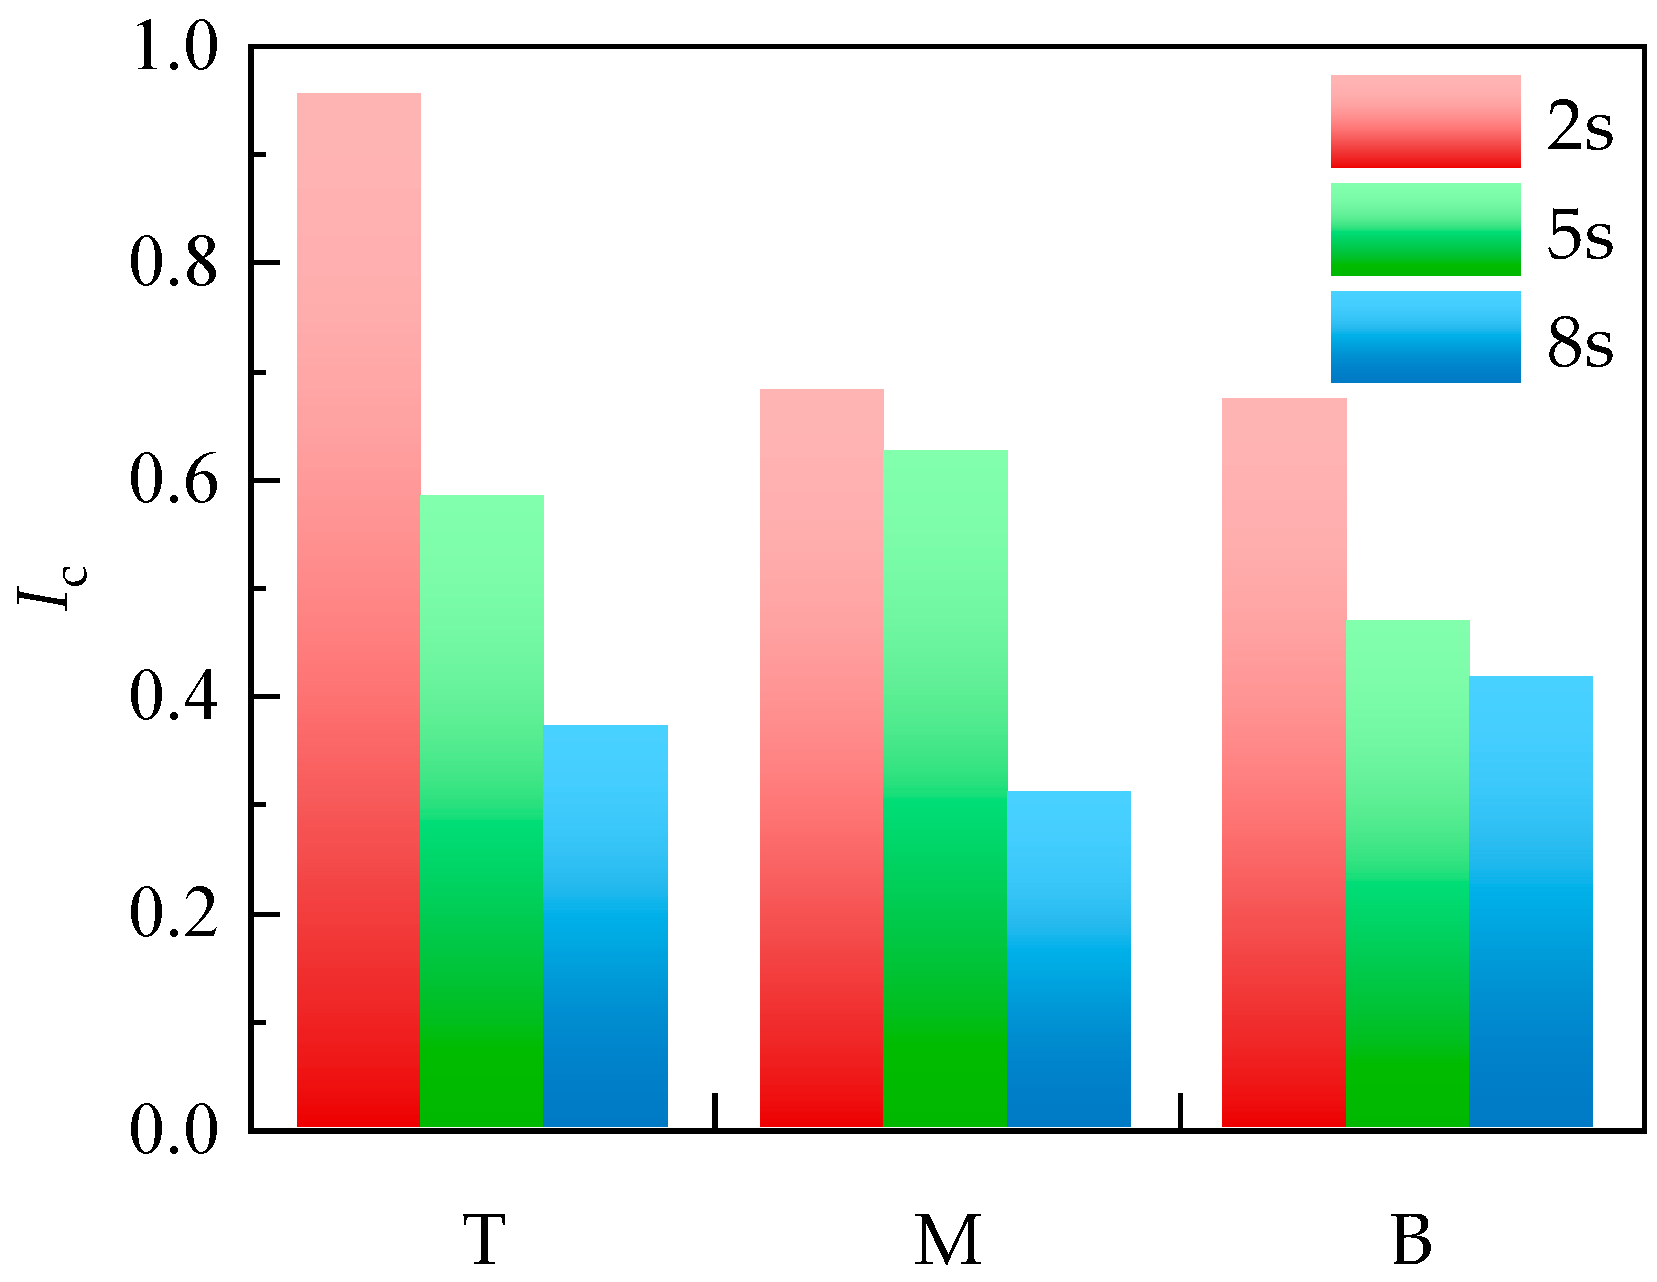
Overall, although the top arrangement shows an early-stage advantage and the middle arrangement exhibits temporary coordination at the mid stage, the bottom arrangement demonstrates the most stable and robust deformation coordination throughout the loading process. Therefore, from the perspective of deformation compatibility, the bottom arrangement is identified as the most favorable vertical configuration.

3.4. Weight Sensitivity Analysis

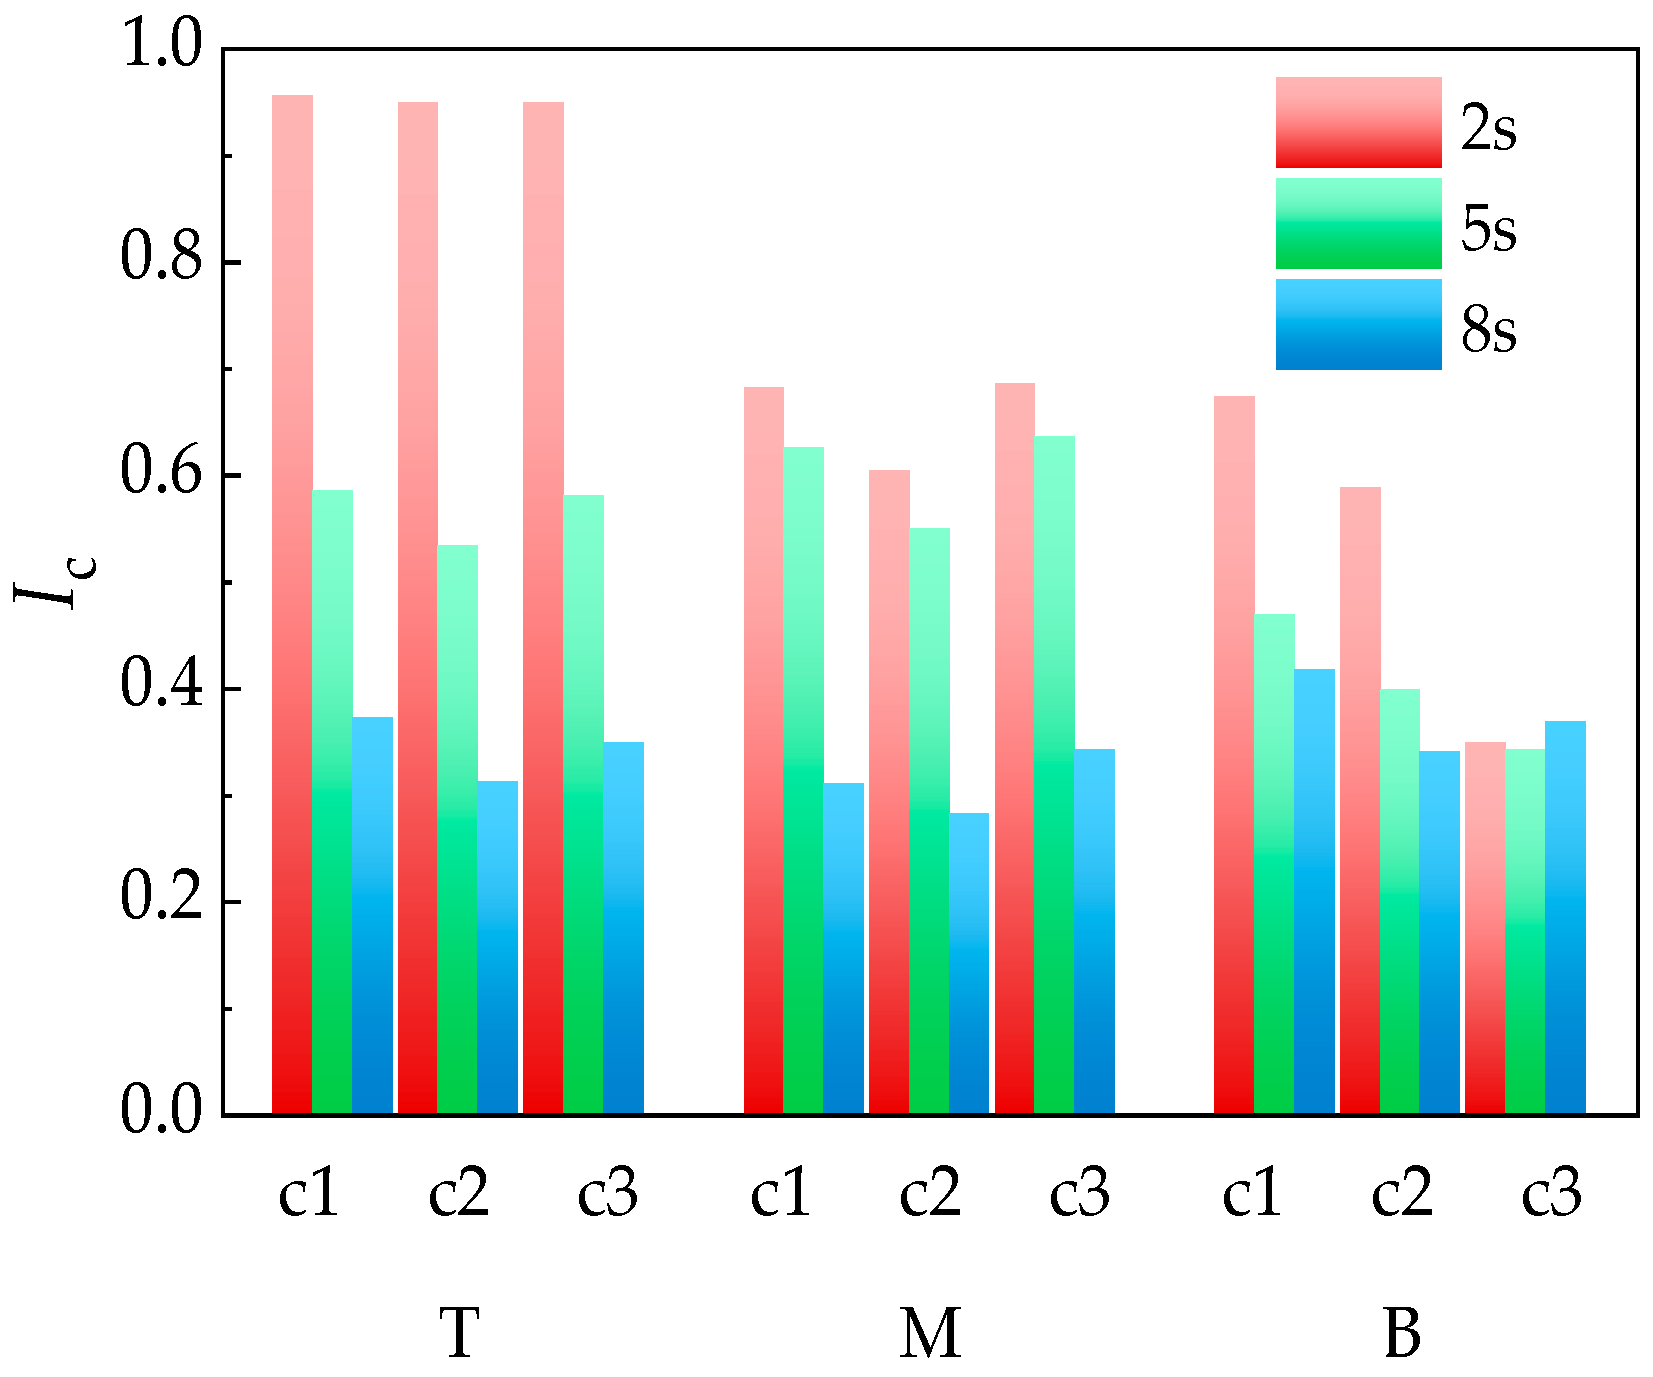
To evaluate the sensitivity of the deformation coordination index to weight assignment, a weight sensitivity analysis was conducted by varying the weight coefficients while keeping the normalization procedure and the original indicator data unchanged. Three representative weight combinations were considered: case 1 (c1), case 2 (c2), and case 3 (c3). For c1, the weight set is (0.42, 0.33, 0.25), corresponding to the normalized strain change rate, the interface damage degree, and the interface opening displacement, respectively. The weight sets for c2 and c3 are (0.33, 0.42, 0.25) and (0.34, 0.33, 0.33), respectively. The deformation coordination index was recalculated under each weight combination, and the variations in index values and ranking of the three embedding configurations were compared to assess the robustness of the evaluation results, as shown in Figure 17.
To evaluate the sensitivity of the deformation coordination index to weight assignment, three representative weight combinations were considered and the index values were recalculated at 2 s, 5 s, and 8 s. The results show that although the absolute values of the deformation coordination index vary slightly under different weight combinations, the ranking of the three embedding configurations at each loading stage remains unchanged. Specifically, the top configuration consistently exhibits the highest deformation coordination index at 2 s, indicating the best deformation compatibility at the early loading stage. At 5 s, the middle configuration shows the highest coordination level under all three weight cases. At 8 s, the bottom configuration consistently achieves the highest deformation coordination index, demonstrating superior deformation compatibility at the later loading stage. These results indicate that the stage-dependent evolution pattern of the deformation coordination index is not sensitive to moderate variations in weight assignment. In particular, the conclusion that the bottom-embedding configuration is the most favorable arrangement at the later loading stage remains robust under all tested weight combinations.

4. Conclusions

In this study, a mesoscale finite element model was developed to investigate the mechanical behavior of embedded UWFBG sensors in asphalt mixtures under different vertical embedding positions. Based on the analysis of lateral tensile strain field evolution, the lateral tensile strain within the UWFBG core response, and the interfacial damage characteristics, the deformation coordination performance was evaluated. The following conclusions can be drawn:
(1)
The embedded UWFBG sensor alters the local lateral tensile strain distribution within the asphalt mixture. The bottom-embedding configuration results in more pronounced tensile zone expansion and strain concentration at the later loading stage, leading to enhanced strain amplification.
(2)
The lateral tensile strain within the UWFBG core reflects the deformation compatibility between the sensor and the surrounding asphalt mixture. The bottom configuration shows higher strain magnitude and sustained strain growth at the later stage. The middle configuration exhibits reduced strain growth due to interfacial degradation, while the top configuration maintains a relatively low overall strain response.
(3)
The evolution of interfacial strain is consistent with the lateral tensile strain within the UWFBG core response, indicating that interfacial behavior directly controls strain transfer efficiency. Although interfacial damage initiates earlier at the bottom position, its opening-dominated failure mode maintains a relatively stable strain transfer path. In contrast, the middle position exhibits more pronounced interfacial slip behavior, which leads to reduced strain transfer continuity. The top position shows delayed damage initiation but accelerated opening at the later stage.
(4)
The weighted deformation coordination index shows clear stage dependence. The bottom-embedding configuration achieves the highest coordination index at the late stage and ranks first in the overall evaluation. The sensitivity analysis of weight coefficients further indicates that the relative ranking of the three embedding configurations remains unchanged under different weight combinations, demonstrating the robustness of the proposed deformation coordination evaluation method.
(5)
From an engineering perspective, the findings provide a theoretical basis for optimizing the installation depth of optical fiber sensors in asphalt pavement monitoring systems. Placing UWFBG sensors near the tensile zone of pavement layers can significantly improve strain monitoring sensitivity and stability. These findings support the development of reliable structural health monitoring for smart highways and provide guidance for practical sensor deployment in pavement engineering.
Overall, the vertical embedding position of the UWFBG sensor significantly influences the deformation coordination between the sensor and asphalt mixture. Among the three configurations, the bottom embedding position exhibits the highest deformation coordination level, making it the most favorable arrangement for strain monitoring. It should be noted that the interpretation of interfacial damage behavior in this study is mainly based on the evolution of interface opening displacement and cohesive damage variables obtained from the numerical results. This approach provides useful insight into the deformation coordination mechanism between the UWFBG sensor and the surrounding asphalt mixture. In future work, the analysis will be further extended by incorporating viscoelastic constitutive models to account for the time-dependent and temperature-sensitive mechanical behavior of asphalt materials. In addition, more refined three-dimensional finite element models will be developed to better represent the spatial stress transfer and strain distribution around the embedded sensor. Furthermore, a more rigorous mixed-mode fracture analysis considering the evolution of normal and shear tractions as well as mode-mixity parameters at the interface will be conducted to provide a deeper understanding of the interfacial damage mechanisms and strain transfer behavior.

Author Contributions

Conceptualization, X.W. and Y.J.; methodology, Y.L. (Yuxuan Li) and Z.Z.; software, Z.Z.; validation, X.W., X.L. and Y.L. (Yang Liu); formal analysis, Y.L. (Yuxuan Li); investigation, Y.L. (Yuxuan Li), Z.Z. and F.G.; resources, Y.J.; data curation, Z.Z. and F.G.; writing—original draft preparation, Y.L. (Yuxuan Li) and Y.J.; writing—review and editing, Y.L. (Yuxuan Li) and Y.J.; visualization, Z.Z. and F.G.; supervision, Y.J.; project administration, X.W., X.L. and Y.J.; funding acquisition, Y.J. All authors have read and agreed to the published version of the manuscript.

Funding

This research was funded by the Technology Project of Hebei Expressway Group Limited (111007-09-2024-0093). The authors gratefully acknowledge their financial support.

Institutional Review Board Statement

Not applicable.

Informed Consent Statement

Not applicable.

Data Availability Statement

The data presented in this study are not publicly available due to privacy and confidentiality restrictions imposed by the collaborating organizations. Requests for access to the data may be directed to the corresponding author, subject to approval by Jinghu Branch, Hebei Expressway Group Limited.

Acknowledgments

The authors would like to acknowledge Jinghu Branch, Hebei Expressway Group Limited for providing technical support and field data for this study. The authors are also grateful to the Hebei Key Laboratory of Traffic Safety and Control (Shijiazhuang Tiedao University) for providing the research facilities and experimental materials.

Conflicts of Interest

Authors Xuelian Wang, Xiuying Luo, Yang Liu, and Fengran Gao were employed by the company Jinghu Branch, Hebei Expressway Group Limited. The remaining authors declare that the research was conducted in the absence of any commercial or financial relationships that could be construed as a potential conflict of interest.

Abbreviations

The following abbreviations are used in this manuscript:
UWFBGUltra-weak Fiber Bragg Grating
FBGFiber Bragg Grating
AHPAnalytic Hierarchy Process
UTMUniversal Testing Machine
SBSStyrene-Butadiene-Styrene

References

  1. Liu, H.; Li, Y.X.; Jia, Y.S.; Li, J.Z.; Zhang, J.P.; Wang, B.; Liu, W. Research on the influence of built-in strain sensor on the mechanical response of asphalt mixture. Highway 2025, 7, 22–29. [Google Scholar]
  2. Ding, X.; Huang, F.; Rath, P.; Ye, Z.; Buttlar, W.G.; Ma, T. Comparative fracture resistance assessment of rubber-modified asphalt mortar based on meso- and macro-mechanical analysis. Int. J. Pavement Eng. 2023, 24, 2265032. [Google Scholar] [CrossRef] [Scilit]
  3. Liu, C.; Du, Y.; Ge, Y.; Wu, D.; Zhao, C.; Li, Y. New generation of smart highway: Framework and insights. J. Adv. Transp. 2021, 2021, 9445070. [Google Scholar] [CrossRef] [Scilit]
  4. Ye, F.; Xiao, B.; Ding, X.; Ma, T.; Xu, G.; Wang, D. Material parameter inversion based on the piezoelectric wave propagation method and its application in pavement deflection prediction. Constr. Build. Mater. 2025, 490, 142443. [Google Scholar] [CrossRef] [Scilit]
  5. Ye, Z.; Wei, Y.; Yang, S.; Li, P.; Yang, F.; Yang, B.; Wang, L. IoT-enhanced smart road infrastructure systems for comprehensive real-time monitoring. Internet Things Cyber-Phys. Syst. 2024, 4, 235–249. [Google Scholar] [CrossRef] [Scilit]
  6. Taheri, S. A review on five key sensors for monitoring of concrete structures. Constr. Build. Mater. 2019, 204, 492–509. [Google Scholar] [CrossRef] [Scilit]
  7. Wu, X.; Hao, Y.; Wu, Z.; Bi, J.; Wu, H.; Huang, L. Early warning of AC salt fog flashover on composite insulators using fiber Bragg grating sensing and visible arc images. Micromachines 2025, 16, 1171. [Google Scholar] [CrossRef] [Scilit]
  8. Liu, Z.; Gu, X.; Wu, C.; Ren, H.; Zhou, Z.; Tang, S. Studies on the validity of strain sensors for pavement monitoring: A case study for a fiber Bragg grating sensor and resistive sensor. Constr. Build. Mater. 2022, 321, 126085. [Google Scholar] [CrossRef] [Scilit]
  9. Yassin, M.H.; Farhat, M.H.; Soleimanpour, R.; Nahas, M. Fiber Bragg grating (FBG)-based sensors: A review of technology and recent applications in structural health monitoring of civil engineering structures. Discover Civ. Eng. 2024, 1, 151. [Google Scholar] [CrossRef] [Scilit]
  10. Li, J.; Shen, B.; Wang, J. A combined positioning method used for identification of concrete cracks. Micromachines 2021, 12, 1479. [Google Scholar] [CrossRef] [Scilit]
  11. Lindsey, N.J.; Martin, E.R.; Dreger, D.S.; Freifeld, B.; Cole, S.; James, S.R.; Biondi, B.L.; Ajo-Franklin, J.B. Fiber-optic network observations of earthquake wavefields. Geophys. Res. Lett. 2017, 44, 11–792. [Google Scholar] [CrossRef] [Scilit]
  12. Ma, K.-P.; Wu, C.-W.; Hsieh, T.-S.; Hsieh, M.-Y.; Chiang, C.-C. Application of robust, packaged long-period fiber grating for strain measurement. Micromachines 2016, 7, 129. [Google Scholar] [CrossRef] [Scilit] [PubMed]
  13. Gu, L.; Zhang, W.; Ma, T.; Qiu, X.; Xu, J. Numerical simulation of viscoelastic behavior of asphalt mixture using fractional constitutive model. J. Eng. Mech. 2021, 147, 04021027. [Google Scholar] [CrossRef] [Scilit]
  14. Jia, Y.; Li, Y.; Wu, Z.; Si, C.; Zhang, J.; Wang, S.; Gao, Y.; Li, Z.; Wei, Z. Evaluation of filler particle size effect of dynamic modulus for asphalt mastic with a new combined micromechanics approach. Constr. Build. Mater. 2025, 477, 141335. [Google Scholar] [CrossRef] [Scilit]
  15. Jia, Y.; Cui, Q.; Zhang, H.; Zhang, Y.; Zhang, J.; Si, C.; Zhou, Z.; Wu, Z.; Guo, B. Feasibility of applying flue gas desulfurization ash as a filler in asphalt mixtures: High-temperature performance and cost–benefit aspect. Constr. Build. Mater. 2025, 495, 143583. [Google Scholar] [CrossRef] [Scilit]
  16. Jiang, J.; Yue, L.; Li, S.; Liu, F.; Pan, J.; Gan, W. Application of ultra-weak fiber Bragg grating sensing array to road vehicle detection. Measurement 2025, 241, 115647. [Google Scholar] [CrossRef] [Scilit]
  17. Gao, W.; Liu, J.; Guo, H.; Jiang, X.; Sun, S.; Yu, H. Multi-wavelength ultra-weak fiber Bragg grating arrays for long-distance quasi-distributed sensing. Photonic Sens. 2022, 12, 185–195. [Google Scholar] [CrossRef] [Scilit]
  18. Wen, S.; Luo, Z.; Chen, X.; Ran, C.; He, Y. Vehicle detection and monitoring using ultra-weak fiber Bragg grating distributed acoustic sensing. Opt. Eng. 2025, 64, 038101. [Google Scholar] [CrossRef] [Scilit]
  19. Li, W.; Huang, Y.; Liu, Z.; Liu, L. Study on influencing factors of synergistic deformation between built-in strain sensor and asphalt mixture. Case Stud. Constr. Mater. 2023, 18, e01993. [Google Scholar] [CrossRef] [Scilit]
  20. Hu, H.; He, G.; Huang, M.; Han, D.; Zhu, H.; Zhao, Y. Measurement performance improvement of buried strain sensors for asphalt pavement using mesoscale finite element simulation. Sensors 2025, 25, 3754. [Google Scholar] [CrossRef] [Scilit]
  21. Liu, Z.H.; Xia, H.W.; Liu, L. Research on the interaction effect of embedded sensor and asphalt mixture. J. Changsha Univ. Sci. Technol. (Nat. Sci.) 2021, 18, 1–6. [Google Scholar] [CrossRef]
  22. Braunfelds, J.; Senkans, U.; Skels, P.; Janeliukstis, R.; Porins, J.; Spolitis, S.; Bobrovs, V. Road pavement structural health monitoring by embedded fiber-bragg-grating-based optical sensors. Sensors 2022, 22, 4581. [Google Scholar] [CrossRef] [Scilit]
  23. Han, D.; Liu, G.; Xi, Y.; Zhao, Y. Theoretical analysis on the measurement accuracy of embedded strain sensor in asphalt pavement dynamic response monitoring based on fem. Struct. Control Health Monit. 2022, 29, e3140. [Google Scholar] [CrossRef] [Scilit]
  24. Han, D.; Liu, G.; Xi, Y.; Xia, X.; Zhao, Y. Real-time monitoring of strain and modulus of asphalt pavement using built-in strain sensor cluster. Constr. Build. Mater. 2023, 384, 131413. [Google Scholar] [CrossRef] [Scilit]
  25. Han, D.; Liu, G.; Xi, Y.; Xia, X.; Zhao, Y. Simulation of low-temperature brittle fracture of asphalt mixtures based on phase-field cohesive zone model. Theor. Appl. Fract. Mech. 2023, 125, 103878. [Google Scholar] [CrossRef] [Scilit]
  26. Mo, L.T.; Huurman, M.; Wu, S.P.; Molenaar, A.A.A. 2D and 3D meso-scale finite element models for ravelling analysis of porous asphalt concrete. Finite Elem. Anal. Des. 2008, 44, 186–196. [Google Scholar] [CrossRef] [Scilit]
  27. Du, C.; Liu, P.; Liu, Q.; Leischner, S.; Sun, Y.; Chen, J.; Oeser, M. Development of locally homogeneous finite element model for simulating the mesoscale structure of asphalt mixture. Comput. Struct. 2021, 248, 106517. [Google Scholar] [CrossRef] [Scilit]
  28. Kim, H.; Wagoner, M.P.; Buttlar, W.G. Simulation of fracture behavior in asphalt concrete using a heterogeneous cohesive zone discrete element model. J. Mater. Civ. Eng. 2008, 20, 552–563. [Google Scholar] [CrossRef] [Scilit]
  29. Chen, J.; Ouyang, X.; Sun, X. Numerical investigation of asphalt concrete fracture based on heterogeneous structure and cohesive zone model. Appl. Sci. 2022, 12, 11150. [Google Scholar] [CrossRef] [Scilit]
  30. Liu, P.; Chen, J.; Lu, G.; Wang, D.; Oeser, M.; Leischner, S. Numerical simulation of crack propagation in flexible asphalt pavements based on cohesive zone model developed from asphalt mixtures. Materials 2019, 12, 1278. [Google Scholar] [CrossRef] [Scilit]
  31. Liao, M.; Liang, S.; Luo, R.; Xiao, Y. The cooperative deformation test of an embedded FBG sensor and strain correction curve verification. Constr. Build. Mater. 2022, 342, 128029. [Google Scholar] [CrossRef] [Scilit]
  32. Dong, Z.; Ma, X.; Gong, X.; Oeser, M. Theoretical evaluation of the measurement accuracy of fiber Bragg grating strain sensors within randomly filled asphalt mixtures based on finite element simulation. Struct. Control Health Monit. 2018, 25, e2057. [Google Scholar] [CrossRef] [Scilit]
  33. JTG 3410-2025; Standard Test Methods of Bitumen and Bituminous Mixtures for Highway Engineering. Ministry of Transport of the People’s Republic of China: Beijing, China, 2025.
  34. Liu, C.; Kong, L.; Wei, Y. Synergistic design of mechanical properties between implantable sensor and concrete based on three-dimensional refined numerical model. Constr. Build. Mater. 2024, 426, 136126. [Google Scholar] [CrossRef] [Scilit]
Figure 1. Meso-finite element models with three different UWFBG sensor embedding depths: (a) T: the UWFBG sensor is located 20 mm from the top of the beam; (b) M: the UWFBG sensor is located at the center of the beam; (c) B: the UWFBG sensor is located 20 mm from the bottom of the beam.
Coatings 16 00361 g001
Figure 2. Preparation process of test specimen: (a) arrange sensors; (b) pre-compact asphalt mixture; (c) demold rut plate sample; (d) cut the rut plate specimen.
Coatings 16 00361 g002
Figure 3. Experimental setup of the three-point bending test using the UTM.
Coatings 16 00361 g003
Figure 4. Flowchart of the research framework.
Coatings 16 00361 g004
Figure 5. Lateral strain contour plots of specimens containing UWFBG sensors located at the T position at typical time instances: (a) 2 s; (b) 5 s; (c) 8 s.
Coatings 16 00361 g005
Figure 6. Lateral strain contour plots of specimens containing UWFBG sensor located at the M position at typical time instances: (a) 2 s; (b) 5 s; (c) 8 s.
Coatings 16 00361 g006
Figure 7. Lateral strain contour plots of specimens containing UWFBG sensors located at the B position at typical time instances: (a) 2 s; (b) 5 s; (c) 8 s.
Coatings 16 00361 g007
Figure 8. Lateral tensile strain within the UWFBG core at typical times for asphalt mixtures with different vertical embedding positions of the UWFBG sensor.
Coatings 16 00361 g008
Figure 9. The peak lateral tensile strain within the UWFBG core for asphalt mixtures with different vertical embedding positions of UWFBG.
Coatings 16 00361 g009
Figure 10. Comparison of strain change rates of the UWFBG cores at different vertical embedding positions during various loading stages.
Coatings 16 00361 g010
Figure 11. Comparison of interfacial strain at different vertical embedding positions at key loading times (2 s, 5 s, and 8 s).
Coatings 16 00361 g011
Figure 12. Comparison of interface damage degree at key time points for different vertical embedding positions.
Coatings 16 00361 g012
Figure 13. Comparison of interfacial time to failure under loading for different vertical embedding positions.
Coatings 16 00361 g013
Figure 14. Comparison of interface opening displacement at key time points for different vertical embedding positions.
Coatings 16 00361 g014
Figure 15. Comparison of interface opening displacement at peak for different vertical embedding positions.
Coatings 16 00361 g015
Figure 16. Deformation compatibility degree change with time at different vertical embedding positions.
Coatings 16 00361 g016
Figure 17. Sensitivity of deformation coordination index to weight variations.
Coatings 16 00361 g017
Table 1. Gradation of the AC-13 asphalt mixture used and its volume conversion.
Sieve Size (mm)Mass Percentage (%)Volume Percentage (%)
16–13.24.13.56
13.2–9.520.517.87
9.5–4.7525.920.95
4.75–2.3610.810.23
2.36–03431.91
Table 2. Basic properties for the SBS-modified asphalt used.
PropertiesTest ResultsTechnical RequirementsTest Methods
Penetration @25 °C (0.1 mm)5540–60T0604
Softening point (C)81≥60T0606
Ductility @5 °C (cm)29≥20T0605
Brookfield viscosity @135 °C (Pa·s)2.45≤3T0625
Density (g/cm3)1.030-T0603
Table 3. Technical indicators of coarse aggregate.
Performance MetricsTechnical SpecificationsTest Result
10 mm–15 mm5 mm–10 mm
Apparent relative density≥2.603.0082.942
Relative density of gross volumeMeasured2.9872.894
Table 4. Technical indicators of fine aggregate.
Performance MetricsTechnical SpecificationsTest Result
Apparent relative density≥2.502.787
Relative density of gross volumeMeasured2.698
Table 5. Technical indicators of filler.
Performance MetricsTechnical SpecificationsTest Result
Apparent density/(g/cm3)≥2.502.762
Apparent relative densityTechnical specifications2.767
Table 6. Mechanical parameters of bulk materials used in the model.
Material TypeElastic Modulus (GPa)Poisson’s Ratio
Coarse aggregate56.80.15
UWFBG25.90.38
Mortar18.40.25
Table 7. Fracture and mechanical properties of material interfaces.
Interface TypeFracture Energy (mJ/mm2)Cohesive Strength (MPa)
Mortar–Mortar326.914.33
Mortar–Coarse aggregate80.822.87
Mortar–UWFBG sensor50.122.51
Table 8. Pairwise comparison matrix used in the AHP analysis.
Indicator ε ˙ i DSo
ε ˙ i 122
D1/212
So1/21/21
Disclaimer/Publisher’s Note: The statements, opinions and data contained in all publications are solely those of the individual author(s) and contributor(s) and not of MDPI and/or the editor(s). MDPI and/or the editor(s) disclaim responsibility for any injury to people or property resulting from any ideas, methods, instructions or products referred to in the content.