Article

Mechanical Properties, Corrosion Resistance and Bioactivity of Oxide Layers Formed by Isothermal Oxidation of Ti-6Al-7Nb Alloy

Institute of Materials Engineering, Faculty of Science and Technology, University of Silesia in Katowice, 75 Pułku Piechoty 1A, 41-500 Chorzów, Poland
*
Author to whom correspondence should be addressed.
Coatings 2021, 11(5), 505; https://doi.org/10.3390/coatings11050505
Submission received: 31 March 2021 / Revised: 19 April 2021 / Accepted: 22 April 2021 / Published: 25 April 2021

Abstract

:
Titanium and its alloys are among the most promising biomaterials for medical applications. In this work, the isothermal oxidation of Ti-6Al-7Nb biomedical alloy towards improving its mechanical properties, corrosion resistance, and bioactivity has been developed. The oxide layers were formed at 600, 700, and 800 °C for 72 h. Scanning electron microscopy (SEM), energy dispersive spectroscopy (EDS), 3D profilometry, and microindentation test, were used to characterize microstructure, surface geometrical structure, and the hardness of the diphase (α + β) Ti-6Al-7Nb alloy after oxidation, respectively. In vitro corrosion resistance tests were carried out in a saline solution at 37 °C using the open-circuit potential method and potentiodynamic measurements. Electronic properties in the air were studied using the Scanning Kelvin Probe (SKP) technique. The bioactivity test was conducted by soaking the alkali- and heat-treated samples in simulated body fluid for 7 days. The presence of apatite was confirmed using SEM/EDS and Fourier Transform Infrared Spectroscopy (FTIR) studies. The thickness of oxide layers formed increased with the temperature growth from 0.25 to 5.48 µm. It was found that with increasing isothermal oxidation temperature, the surface roughness, hardness, corrosion resistance, and contact potential difference increased. The Ti-6Al-7Nb alloy after oxidation revealed the HAp-forming ability in a biological environment.

1. Introduction

Titanium and its alloys are widely used biomaterials for medical applications due to the favorable ratio of strength to specific gravity, good corrosion resistance, and high biocompatibility [1,2,3,4,5,6,7,8,9]. Among metallic materials, titanium and its alloys have the best biocompatibility, closely related to their corrosion resistance. High corrosion resistance is associated with the high affinity of titanium and its alloys for oxygen and the formation of a stable, self-passive oxide layer (2 to 10 nm thick) on the metal surface [10]. The natural oxide layer also plays a crucial role in biocompatibility and limits alloying ions’ penetration into the body. The corrosion resistance of titanium and its alloys is closely related to the spontaneously formed oxide layer’s quality, which consists mainly of TiO2 oxide [11]. This layer’s internal part is non-stoichiometric oxides, while the outer part is amorphous TiO2 [12].
The chemical composition is an important factor influencing the corrosion resistance of titanium alloys. Elements such as molybdenum, tantalum, and niobium improve titanium-based materials’ corrosion resistance [13]. Besides, single-phase titanium alloys exhibit stronger corrosion resistance. Higher content of aluminum (more than 6%) in titanium alloys may cause precipitation in the structure of the α2 phase particles, which occur as microanodes relative to the matrix [14]. Such a system leads to changes in electrochemical properties in many corrosive environments. At the same time, the cracking mechanism changes from plastic to brittle. This phenomenon occurs mainly through the formation and blocking of dislocations in slip planes [15].
Titanium and its alloys are one of the most modern and perspective implant materials. Their use is constantly increasing, which results from the positive results obtained in the treatment of injuries and the natural degeneration of joints. In medical applications, they are particularly valued for the best of all metallic materials, biocompatibility. The excellent biocompatibility of titanium and its numerous alloys results mainly from a natural passive layer present on the surface, significantly impacting bone tissue reaction [16,17]. Due to their safety and the possibility of long-term use, these materials are used in various medical fields in the form of joint endoprostheses, elements of an artificial heart, surgical devices, elements of medical devices, and prosthetic implants [3,18]. They are also widely used in dental prosthetics [1,4]. The implants have a modified rough surface, thanks to which the bone connects even more closely with the implant.
After the implantation procedure, local inflammation of the tissues surrounding the implant occurs. The applied surface modifications aim to reduce the adverse effects of bacteria that could lead to loss of the implant. The bacteria that significantly affect the destabilization of the implants are S. aureus and S. epidermidis. The use of oxide films on the surface of titanium alloys reduces by 50% the ability of bacteria to adhere to biomaterials [19,20]. Moreover, it was also shown that histatin-derived peptides immobilization by tresyl chloride-activation enhance cellular responses and promote cellular activities around the dental implants [21].
Until recently, the commercially pure titanium (Cp Ti) and Ti-6Al-4V diphase alloy dominated the market of long-term implants. However, it turned out that the use of alloys containing vanadium poses a risk to the patient’s health due to their harmful properties, including allergy, inflammation, Alzheimer’s disease, and others. Careful observation of long-term implants’ behavior containing toxic vanadium in the human body causes a gradual departure from the Ti-6Al-4V alloy in favor of vanadium-free titanium alloys containing more biocompatible elements, such as Mo, Nb, Zr, or Ta, better tolerated in the tissue environment. In this most promising group of titanium alloys, the Ti-6Al-7Nb alloy is of particular interest, which can be an alternative to Ti-6Al-4V by replacing V with Nb. The oxide layer present in vanadium alloys, particularly Ti-6Al-4V, shows weaker mechanical properties; the oxide layer can be abraded at very low shear stresses. Vanadium ions activate the macrophage response and provoke the release of cytokines or inflammatory factors, consequently leading to loosening or loss of implants. Additionally, the vanadium ions lead to the discoloration of the tissue around the implant. Since 1985, the use of alloys with vanadium was limited in favour of Ti-6Al-7Nb alloys [22]. The use of the alloy addition in the form of Nb influences the stabilization of the β-phase and the reduction of Young’s modulus. According to literature reports [23,24], Ti-6Al-7Nb alloy shows the ability to self-passivation, high bioactivity, and resistance to corrosion in a biological environment. The oxide layer and its electrochemical properties play a vital role in the long-term implant application of Ti-6Al-7Nb alloy.
The small amounts of each metal ion are essential for the proper functioning of the body. However, after exceeding the limit value, they have a toxic effect on the body. Metal ions accumulate in the tissues surrounding the implant and then enter the entire body through the bloodstream. Al ions have a neurotoxic effect on human tissues. Oxide layers on the surface of titanium alloys inhibit the secretion of harmful ions into the body. Ti and Nb belong to the group of vital elements that undergo self-passivation. Limiting the release of deleterious ions into the body is mainly determined by the properties of the passive oxide layer, such as its thickness. As the thickness of the self-passive oxide layers increases, the stoichiometry of the layer changes, and at the same time, the diffusion of ions is limited [25].
The high affinity of titanium and its alloys for oxygen can be used to improve corrosion resistance in the biological environment, biocompatibility, bioactivity, surface topography, and mechanical and tribological properties. Of the methods used for this purpose, special attention should be paid to the isothermal oxidation method, which is a simple and economical way to modify the surface of titanium and its alloys [26,27,28,29,30,31]. This technique uses the phenomenon of oxygen diffusion at elevated temperatures and thus allows curing of the surface layer by forming a relatively thick TiO2 film over the oxygen diffusion zone. The surface of titanium and its alloys modified in this way is characterized by favorable properties and corrosion resistance, resulting from the formation of a highly crystalline oxide layer in the rutile crystallographic form [7]. The production of oxide layers by isothermal oxidation enables a significant improvement in the mechanical properties (hardness) of the Ti-6Al-7Nb alloy. As it results from the previous studies presented in [32], the surface hardness of the Ti-6Al-7Nb alloy can be increased even several times and is strictly dependent on the temperature and time parameters of the oxidation process. The most important parameter influencing the increase in hardness of the obtained oxide layers is the oxidation temperature. With the temperature increase, the thickness and hardness of the oxide layers increases, which has a measurable effect on the functional properties of the Ti-6Al-7Nb alloy. Increased hardness of the surface layer obtained in the isothermal oxidation process significantly improves the low tribological properties of the Ti-6Al-7Nb alloy [33].
Analysis of the literature showed that niobium has a significant impact on the oxidation resistance of Ti-Al alloys, which determines the different nature of oxide layer growth compared to the classic Ti-6Al-4V alloy [34,35,36,37]. The main areas of application of the Ti-6Al-7Nb biomedical alloy are endoprostheses (hip, knee, shoulder, hip-balls osteosyntheses), bone screws, bone plates, marrow-nails, spinal systems, and oral implants [38]. The literature data clearly indicate that the Ti-6Al-7Nb alloy was very rarely subjected to isothermal oxidation, and the results of scientific studies require significant supplementation, especially in the properties of the Ti-6Al-7Nb alloy after isothermal oxidation [39]. Therefore, this paper’s research results mainly focus on the characteristics of the mechanical properties, bioactivity, and corrosive behavior of oxide layers obtained on the Ti-6Al-7Nb biomedical alloy in the process of isothermal oxidation carried out at temperatures 600, 700, and 800 °C in an atmosphere of air. To our best knowledge, the effect of the isothermal oxidation parameters of the Ti-6Al-7Nb alloy on surface geometrical structure, microhardness, in vitro corrosion resistance in a saline solution, and bioactivity is discussed for the first time.

2. Materials and Methods

2.1. Material Preparation

The material under study was the biomedical Ti-6Al-7Nb alloy in the form of a 12 mm rod (Perryman Company, Houston, PA, USA). The rod was cut into 2 mm thick discs, and the surface intended for oxidation was ground on 600, 1200, and 2000 grit abrasive papers with water as a coolant. Finally, the specimens were degreased in acetone.
The isothermal process of the Ti-6Al-7Nb alloy was carried out in a resistance chamber furnace FCF 22 HM (Czylok Company, Jastrzębie Zdrój, Poland) in an air atmosphere. Samples were oxidized at 600, 700, and 800 °C for 72 h. Details on the selection of temperature-time parameters, oxidation kinetics, and phase composition of the oxide layers obtained on the Ti-6Al-7Nb alloy were presented in our previous work [39]. After 72 h, the samples were removed from the furnace and air-cooled to ambient temperature.

2.2. Study of the Surface Geometrical Structure

3D isometric images of the Ti-6Al-7Nb alloy surface after oxidation at 600, 700, and 800 °C for 72 h were obtained using the TALYSURF 3D profilographometer (Taylor-Hobson, Leicester, UK). The tests were carried out with the contact method using a profilographometer head equipped with a diamond tip in the shape of a pyramid. During the examinations, selected fragments of the oxidized surface of the Ti-6Al-7Nb alloy with dimensions of 2 mm × 2 mm were scanned. To more accurately visualize the surface’s geometric structure after oxidation, the work presents 3D isometric images with a color change map for areas with dimensions of 1 mm × 1 mm. Table 1 shows a summary of the measured parameters.

2.3. Microindentation Studies

Hardness was determined using a Micron-Gamma device equipped with a self-leveling table (The Faculty of Aviation and Space Systems: The National Technical University of Ukraine “Igor Sikorsky Kyiv Polytechnic Institute”, Kiev, Ukraine). Tests were carried out in accordance with the ISO 14577 requirements [40]. A Berkovich indenter was used in the research. The tests were carried out under the conditions of various indenter loads: 0.1, 0.25, and 1 N. The loading and unloading time was 30 s, while the endurance time under the maximum load was 10 s. HIT hardness was determined by the Oliver-Pharr method [41]. The measurement results are the average of 10 impressions for each sample under study.

2.4. Corrosion Resistance Measurements

The in vitro corrosion tests were conducted under thermostated conditions at 37(1) °C in a 0.9% NaCl solution (saline). To adjust the pH of 7.4(1), a 4% sodium hydroxide solution and a 1% lactic acid solution, were used according to ISO 10271 [42]. All reagents of analytical purity (Avantor Performance Materials Poland, Gliwice, Poland) and ultrapure water of 18.2 MΩ cm resistivity at 25 °C (Milli-Q Advantage A10 Water Purification System, Millipore SAS, Molsheim, France), were used. Before starting measurements, the saline solution was deaerated by bubbling Ar (99.999% purity) for 30 min. Throughout the study, the argon stream was held above the surface of the solution.
A three-electrode electrochemical cell with a volume of 250 cm3 was used. The tested sample was a working electrode (WE) placed parallel face-to-face to the platinum foil, which served as a counter electrode (CE). The reference electrode (RE) was a saturated calomel electrode (SCE) in the Luggin capillary. The WE geometric surface area of 1.1 cm2 was exposed to electrochemical measurements. More details about the preparation of the WEs were presented in earlier works [43,44]. All electrochemical measurements were recorded using the Autolab/PGSTAT30 potentiostat (Metrohm Autolab B.V., Utrecht, The Netherlands).
The open-circuit potential (EOC) was recorded for 2 h of exposure of the investigated electrodes in the saline solution. The EOC was considered as approximate value of the corrosion potential (Ecor). After the EOC stabilized, the polarization curves were recorded in a potential range of ±100 mV relative to the EOC in which the Tafel equation was fulfilled using the electrode polarization rate v = 1 mV·s−1. The obtained j = f(E) curves were subjected to the Savitzky-Golay smoothing algorithm using the General Purpose Electrochemical System (GPES) software [45]. The smoothed log|j| = f(E) curves were the basis for determining the tested electrodes’ corrosion resistance parameters.
The anodic polarization curves were recorded in the range from a potential 150 mV lower than the stabilized EOC value to 9 V with a polarization rate of 1 mV·s−1.

2.5. Bioactivity Examination Conditions

The bioactivity examination was carried out on oxide layers formed by isothermal oxidation of Ti-6Al-7Nb alloy. Five samples were tested in each series. Each sample was flooded with 5 mL of 5 M NaOH solution and soaked at 60 °C for 24 h. Then, the samples were washed using ultrapure water and dried for 12 h in an oven at 40 °C. The samples were heated to 600 °C at a heating rate of 5 °C·min−1, maintained at this temperature for 1 h, and then cooled with the oven to ambient temperature [46]. The ability of alkali- and heat-treated samples to form apatite in a simulated body fluid (SBF) was investigated according to the procedure proposed by Kokubo and Takadama [47]. Samples were soaked in 30 mL of an acellular SBF at 36.6(1) °C for 7 days.
The ion concentrations of SBF were similar to those in human blood plasma (mM): Na+—142.0, K+—5.0, Mg2+—1.5, Ca2+—2.5, Cl—147.8, HCO 3 —4.2, HPO 4 2 —1.0, and SO 4 2 —0.5. The SBF was prepared by dissolution of recognized analytical grade reagents (Avantor Performance Materials Poland S.A., Gliwice, Poland) in ultrapure water in the following order: NaCl, NaHCO3, KCl, K2HPO4 × 3H2O, MgCl2 × 6H2O, CaCl2, and Na2SO4. To adjust the pH 7.4(1) of the SBF, tris-hydroxymethyl aminomethane (CH2OH)3CNH2 and 1 M HCl was used. The bioactivity test was conducted in plastic containers with a smooth surface without any scratches to avoid apatite (Ap) nucleation induced at the surface or the edge of scratches. After soaking, the samples were carefully removed from the SBF, rinsed gently in ultrapure water, and dried at 40 °C in the oven for 24 h.

2.6. Material Characterization Methods

Surface morphology and cross-section observations of the Ti-6Al-7Nb alloy before and after the isothermal oxidation process were performed on a JEOL JSM 6480 scanning electron microscope (SEM, Peabody, MA, USA). The local chemical composition of tested materials was determined using an energy dispersive spectroscopy (EDS) attachment.
The contact potential difference (CPD) maps were recorded for the Ti-6Al-7Nb alloy at the initial state and after isothermal oxidation using scanning electrochemical workstation PAR M370 (Princeton Applied Research, Oak Ridge, TN, USA) equipped with a tungsten Kelvin Probe (KP, ø500 μm). The distance between the KP and the sample under study was c.a. 90 μm. The scanning area was 4 mm × 4 mm.
The formation of Ap on the alkali- and the heat-treated surface of the Ti-6Al-7Nb alloy after isothermal oxidation was examined using SEM/EDS study. Infrared Spectroscopy (IR) absorption spectra were recorded by Attenuated Total Reflection—Fourier Transform Infrared Spectroscopy (ATR-FTIR) in the wavenumber range 4000–450 cm−1. The ATR-FTIR tests were carried out using the Shimadzu IR Prestige-21 FTIR spectrophotometer (Kyoto, Japan) equipped with an ATR attachment with a diamond n = 2.4 with a beam penetration depth of 1000 cm−1.

2.7. Statistical Analysis

One-way ANOVA test (ANOVA stands for Analysis of Variance) and Tukey post-hoc test were used to determine if there was a statistically significant difference between the mean thickness of oxide layer (dependent variable) obtained by thermal oxidation of the Ti-6Al-7Nb alloy at temperatures 600, 700, and 800 °C (independent variable). In the ANOVA test, the F statistic was calculated. If the F value was higher than a certain critical value Fcrit, then the difference between the mean thickness of oxide layers could be statistically significant. The degrees of freedom for the independent variable and the degrees of freedom for the model residuals (model error) were 2 and 57, respectively. The significance level was assumed as equal to 0.05, and hence Fcrit(2, 57) = 3.16. Statistical analysis was performed using the OriginPro 2020b program (OriginLab, Northampton, MA, USA).

3. Results and Discussion

3.1. SEM Study of Microstructure and Thickness of Oxide Layers

The microstructure study of the Ti-6Al-7Nb alloy in its initial state investigated by SEM and EDS was presented in our previous work [39]. It was confirmed that the Ti-6Al-7Nb is a diphase titanium alloy (α + β). The exemplary SEM images of the surface morphology and corresponding cross-section of the Ti-6Al-7Nb alloy after isothermal oxidation at 600, 700, and 800 °C for 72 h obtained at 2000× magnification are presented in Figure 1.
After isothermal oxidation of the Ti-6Al-7Nb alloy at 600 °C for 72 h, mapping the alloy’s surface topography before oxidation is observed, suggesting a small thickness of the oxide layer formed. Additionally, embryos of oxide particles are observed on the oxidized alloy surface (Figure 1a). One can see that after isothermal oxidation of the Ti-6Al-7Nb alloy at 700 °C, the compact oxide layer formed was characterized by the presence of fine, concentrated oxide particles (Figure 1c). The oxide layer’s microstructure image obtained after isothermal oxidation of the Ti-6Al-7Nb alloy at 800 °C is shown in Figure 1e. It is characterized by much larger oxide particles, with a more developed surface in comparison with the oxide layers formed at 600 and 700 °C. According to the authors of [35,48], large oxide grains occurring in the oxide layer formed at 800 °C arise as a result of nucleation and joining together small oxide grains.
Figure 1b,d,f also shows the exemplary SEM images of the oxide layers in cross-section obtained after oxidation. Observations of SEM images for oxide layers on the cross-section, produced on the Ti-6Al-7Nb alloy surface, showed that the thermal oxidation carried out at 700 (Figure 1d) and 800 °C (Figure 1f) allowed to obtain good quality layers, characterized by continuous construction and good adhesion to the substrate. It was found that the obtained oxide layers were characterized by varied thickness depending on thermal oxidation parameters.
The lowest mean oxide layer thickness of 0.25 µm was obtained after oxidation of the Ti-6Al-7Nb alloy at 600 °C (Figure 2). The low thickness of the scale obtained in this temperature variant was confirmed by SEM images of the morphology of oxide layers. The mapping of surface topography before oxidation is observed.
After oxidation at 700 °C, the mean thickness of oxide layer increased to over 1 μm. The highest mean thickness of the oxide layer, 5.48 µm, was obtained after oxidation at 800 °C. It is related to the highest intensity of the oxidation process in this temperature. Dalili et al. [36] found that the use of too high temperatures and too long oxidation time affects the oxide layer’s cracking and flaking. This phenomenon was observed in work [37] after oxidation of the Ti-6Al-4V alloy at 800 °C. Based on the microscopic image analysis obtained in this study, no such phenomenon was found even after oxidation at 800 °C (Figure 1). The results also showed that the oxide layer’s mean thickness obtained at 800 °C was 22 times greater in comparison with the oxidation temperature of 600 °C (Figure 2). One-way ANOVA test showed a statistically significant difference in the mean thickness of oxide layer for at least one oxidation temperature (F = 3138.5 > Fcrit = 3.16). Additional Tukey post-hoc test revealed significant pairwise differences between the mean thickness of oxide layer obtained at temperatures 600, 700, and 800 °C. A significant correlation between the thickness of the oxide layer on the Ti-6Al-7Nb alloy and the stability of the bonding was observed [26].

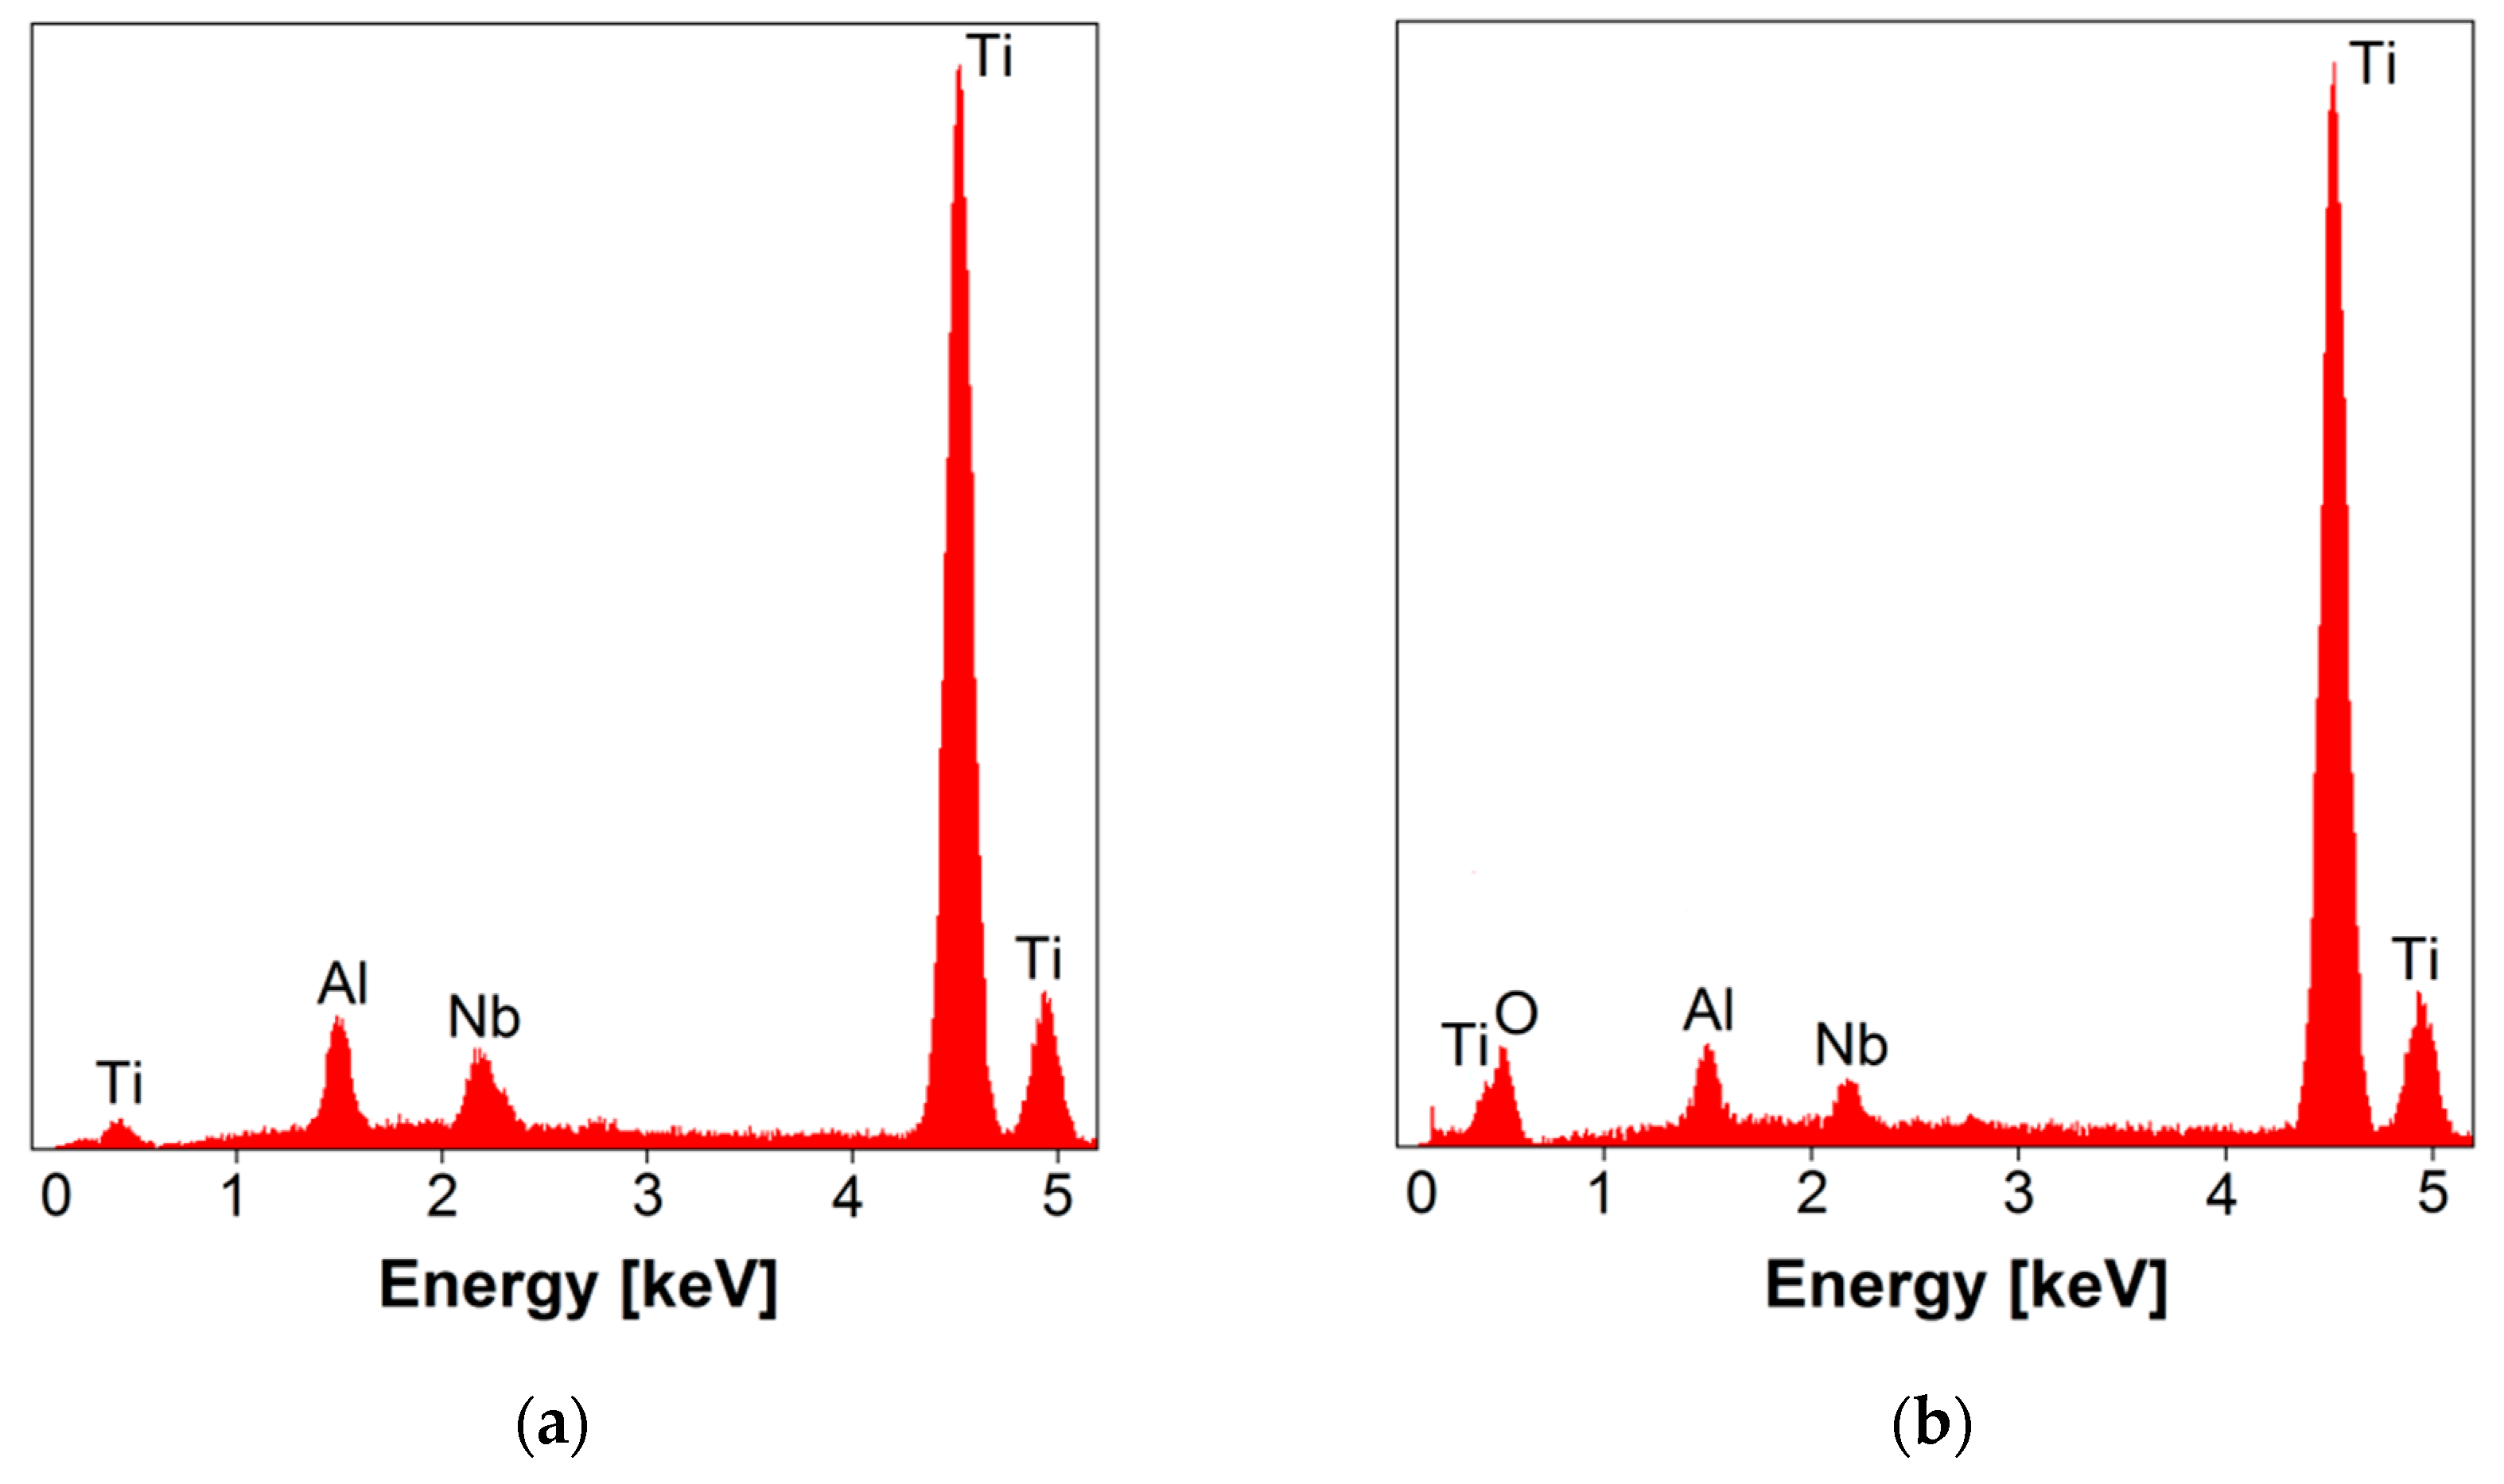
3.2. EDS Study of Chemical Composition

The material used as the substrate for isothermal oxidation was the commercial alloy Ti-6Al-7Nb (wt.%). Such chemical composition ensures appropriate properties for applications in medical implants, ensuring higher biocompatibility and corrosion resistance than titanium and its alloys containing vanadium [49]. The control analysis of the examined alloy’s chemical composition was performed by the EDS method, which allowed for quantitative and qualitative analysis of the chemical composition in micro-areas. The EDS spectra were recorded for different micro-areas of a single scan area 10 μm × 10 μm on a homogeneous alloy surface.
The EDS spectrum collected in the selected micro-area on the surface of the Ti-6Al-7Nb alloy revealed the peaks originating from the substrate, i.e., Ti, Al, and Nb, both for the alloy at its initial state (Figure 3a) and after isothermal oxidation at 800 °C (Figure 3b).
The surface content of elements determined based on the identified peaks for the alloy at its initial state was 87.046(969) wt.% for Ti, 5.572(228) wt.% for Al, and 7.382(380) wt.% for Nb. The analysis of the results obtained did not reveal any discrepancies about the requirements specified for the Ti-6Al-7Nb alloy in the ISO 5832-11 standard [50]. An additional oxygen-derived peak in the EDS spectrum for the alloy oxidized at 800 °C testified to the presence of an oxide layer on the tested material surface (Figure 3b). In the EDS spectra obtained for the Ti-6Al-7Nb alloy oxidized at 600 and 700 °C, an oxygen peak was also observed, however, with lower intensity compared to 800 °C.

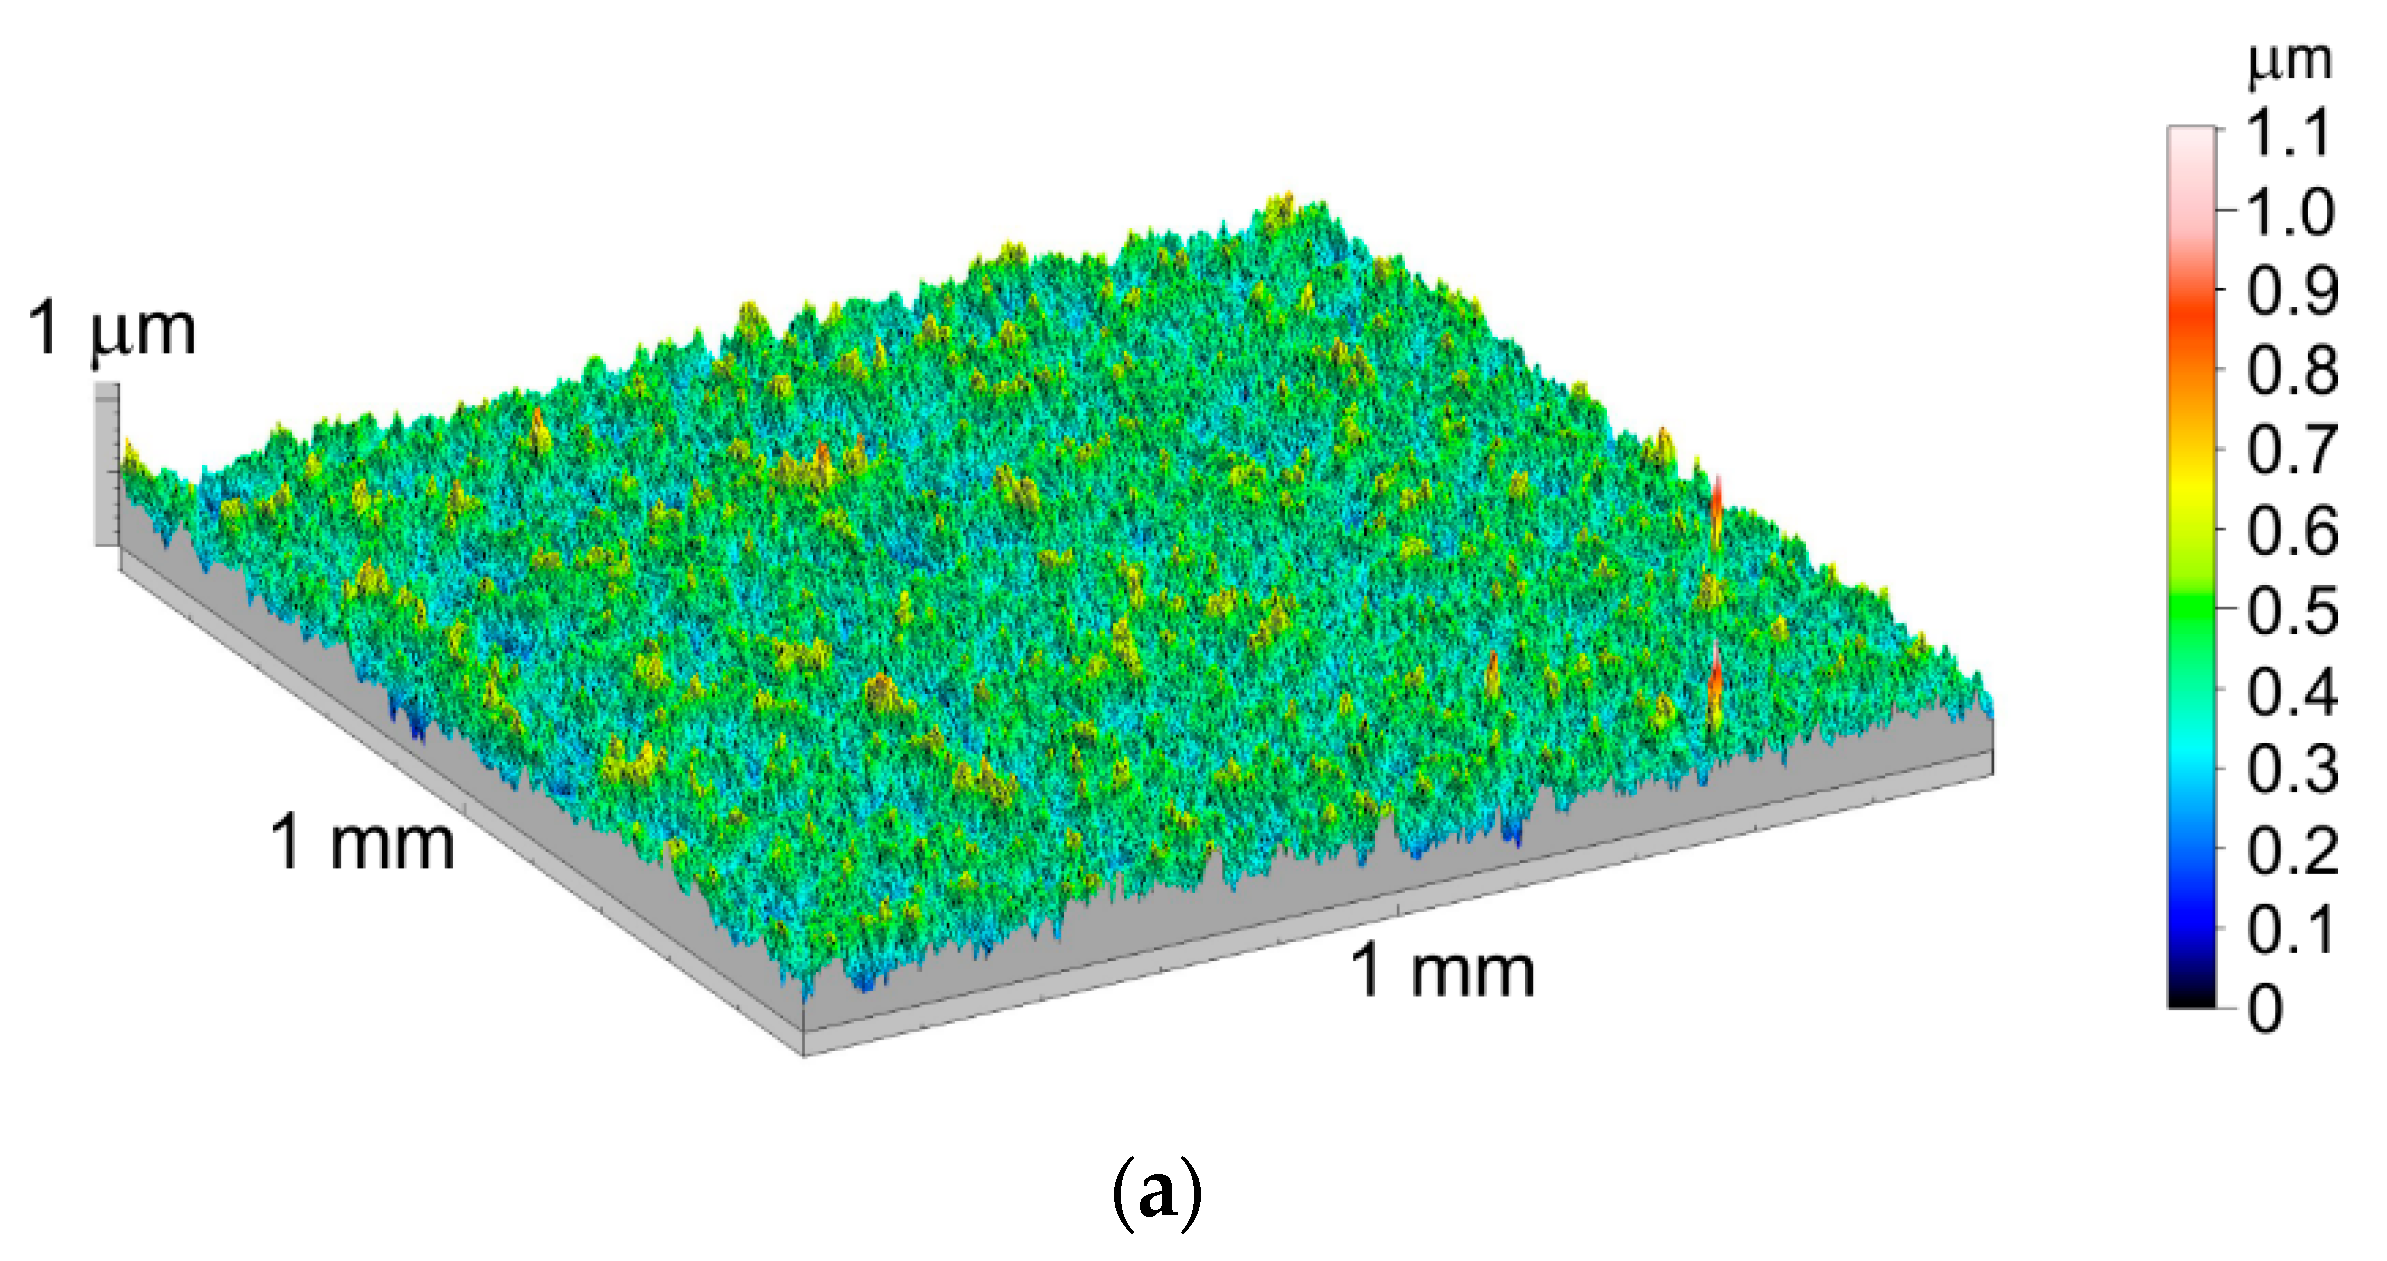
3.3. Geometric Structure of the Ti-6Al-7Nb Alloy Surface after Thermal Oxidation

Figure 4 shows the Ti-6Al-7Nb alloy surface’s geometric structure in a 3D system after oxidation at 600, 700, and 800 °C for 72 h. Figure 5 presents a summary of the obtained results of surface amplitude parameters measurements.
On the basis of the obtained measurement results, it was stated that the increase in the oxidation temperature was a factor increasing the surface roughness of the Ti-6Al-7Nb alloy, as is seen in the 3D isometric images presented in Figure 4. This phenomenon was confirmed by an increase in the value of the Sa parameter along with an increase in the oxidation temperature. The research showed that increasing the oxidation temperature from 600 to 800 °C increased the Sa parameter value by approximately 55%. It could be related to the formation of larger clusters of oxide grains on the surface with an increase in the oxidation temperature [51]. A similar tendency was observed for the parameters: Sq, St, and Ssk (see Table 1). The values of the remaining parameters, such as Sp, Sv and Sz, showed no dependence on the oxidation temperature.

3.4. Microindentation Tests of Oxide Layers Obtained on the Ti-6Al-7Nb Alloy Surface

Figure 6 shows the results of hardness measurements of the oxide layers obtained on the Ti-6Al-7Nb alloy surface at 600, 700, and 800 °C for 72 h.
The tests showed that the oxide layers’ hardness increased as the oxidation temperature increased, regardless of the applied load. However, the highest hardness for each temperature variant was found at the lowest indenter load (0.1 N), which ensured the measurement only in the thickness range of the produced oxide layers (penetration depth of the indenter below 1 µm). After oxidation at 600 and 700 °C, the oxide layers’ hardness was approximately 13,260 and 13,630 MPa, respectively. On the other hand, the highest hardness was characteristic of the oxide layer formed after oxidation at 800 °C (approximately 14,030 MPa). The research showed that the increase in the load on the indenter caused its penetration to a greater depth, as a result of which a lower hardness was obtained due to the increasing influence of the substrate on the measurement result. This phenomenon was particularly noticeable in the oxide layer’s case obtained at 600 °C, characterized by the smallest thickness. In this case, with an indenter load of 1 N, a decrease in hardness by as much as approximately 50% was found. The significant decrease in hardness was closely related to the indenter’s penetration depth, which significantly exceeded the range of the oxide layer thickness. The hardness of the oxide layer together with the substrate was measured simultaneously. On the other hand, the smallest impact of the increase in the indenter load on the obtained measurement result was observed in the case of oxide layers produced at the temperature of 800 °C (due to the highest thickness of the oxide layers). Moreover, it was found in the research that with the increase of the oxidation temperature, there is a slightly larger dispersion of the hardness measurement results, as evidenced by the increasing measurement error. It could be due to the increase in the oxide particles’ size and the surface roughness after oxidation [52].

3.5. Open-Circuit Potential Measurements
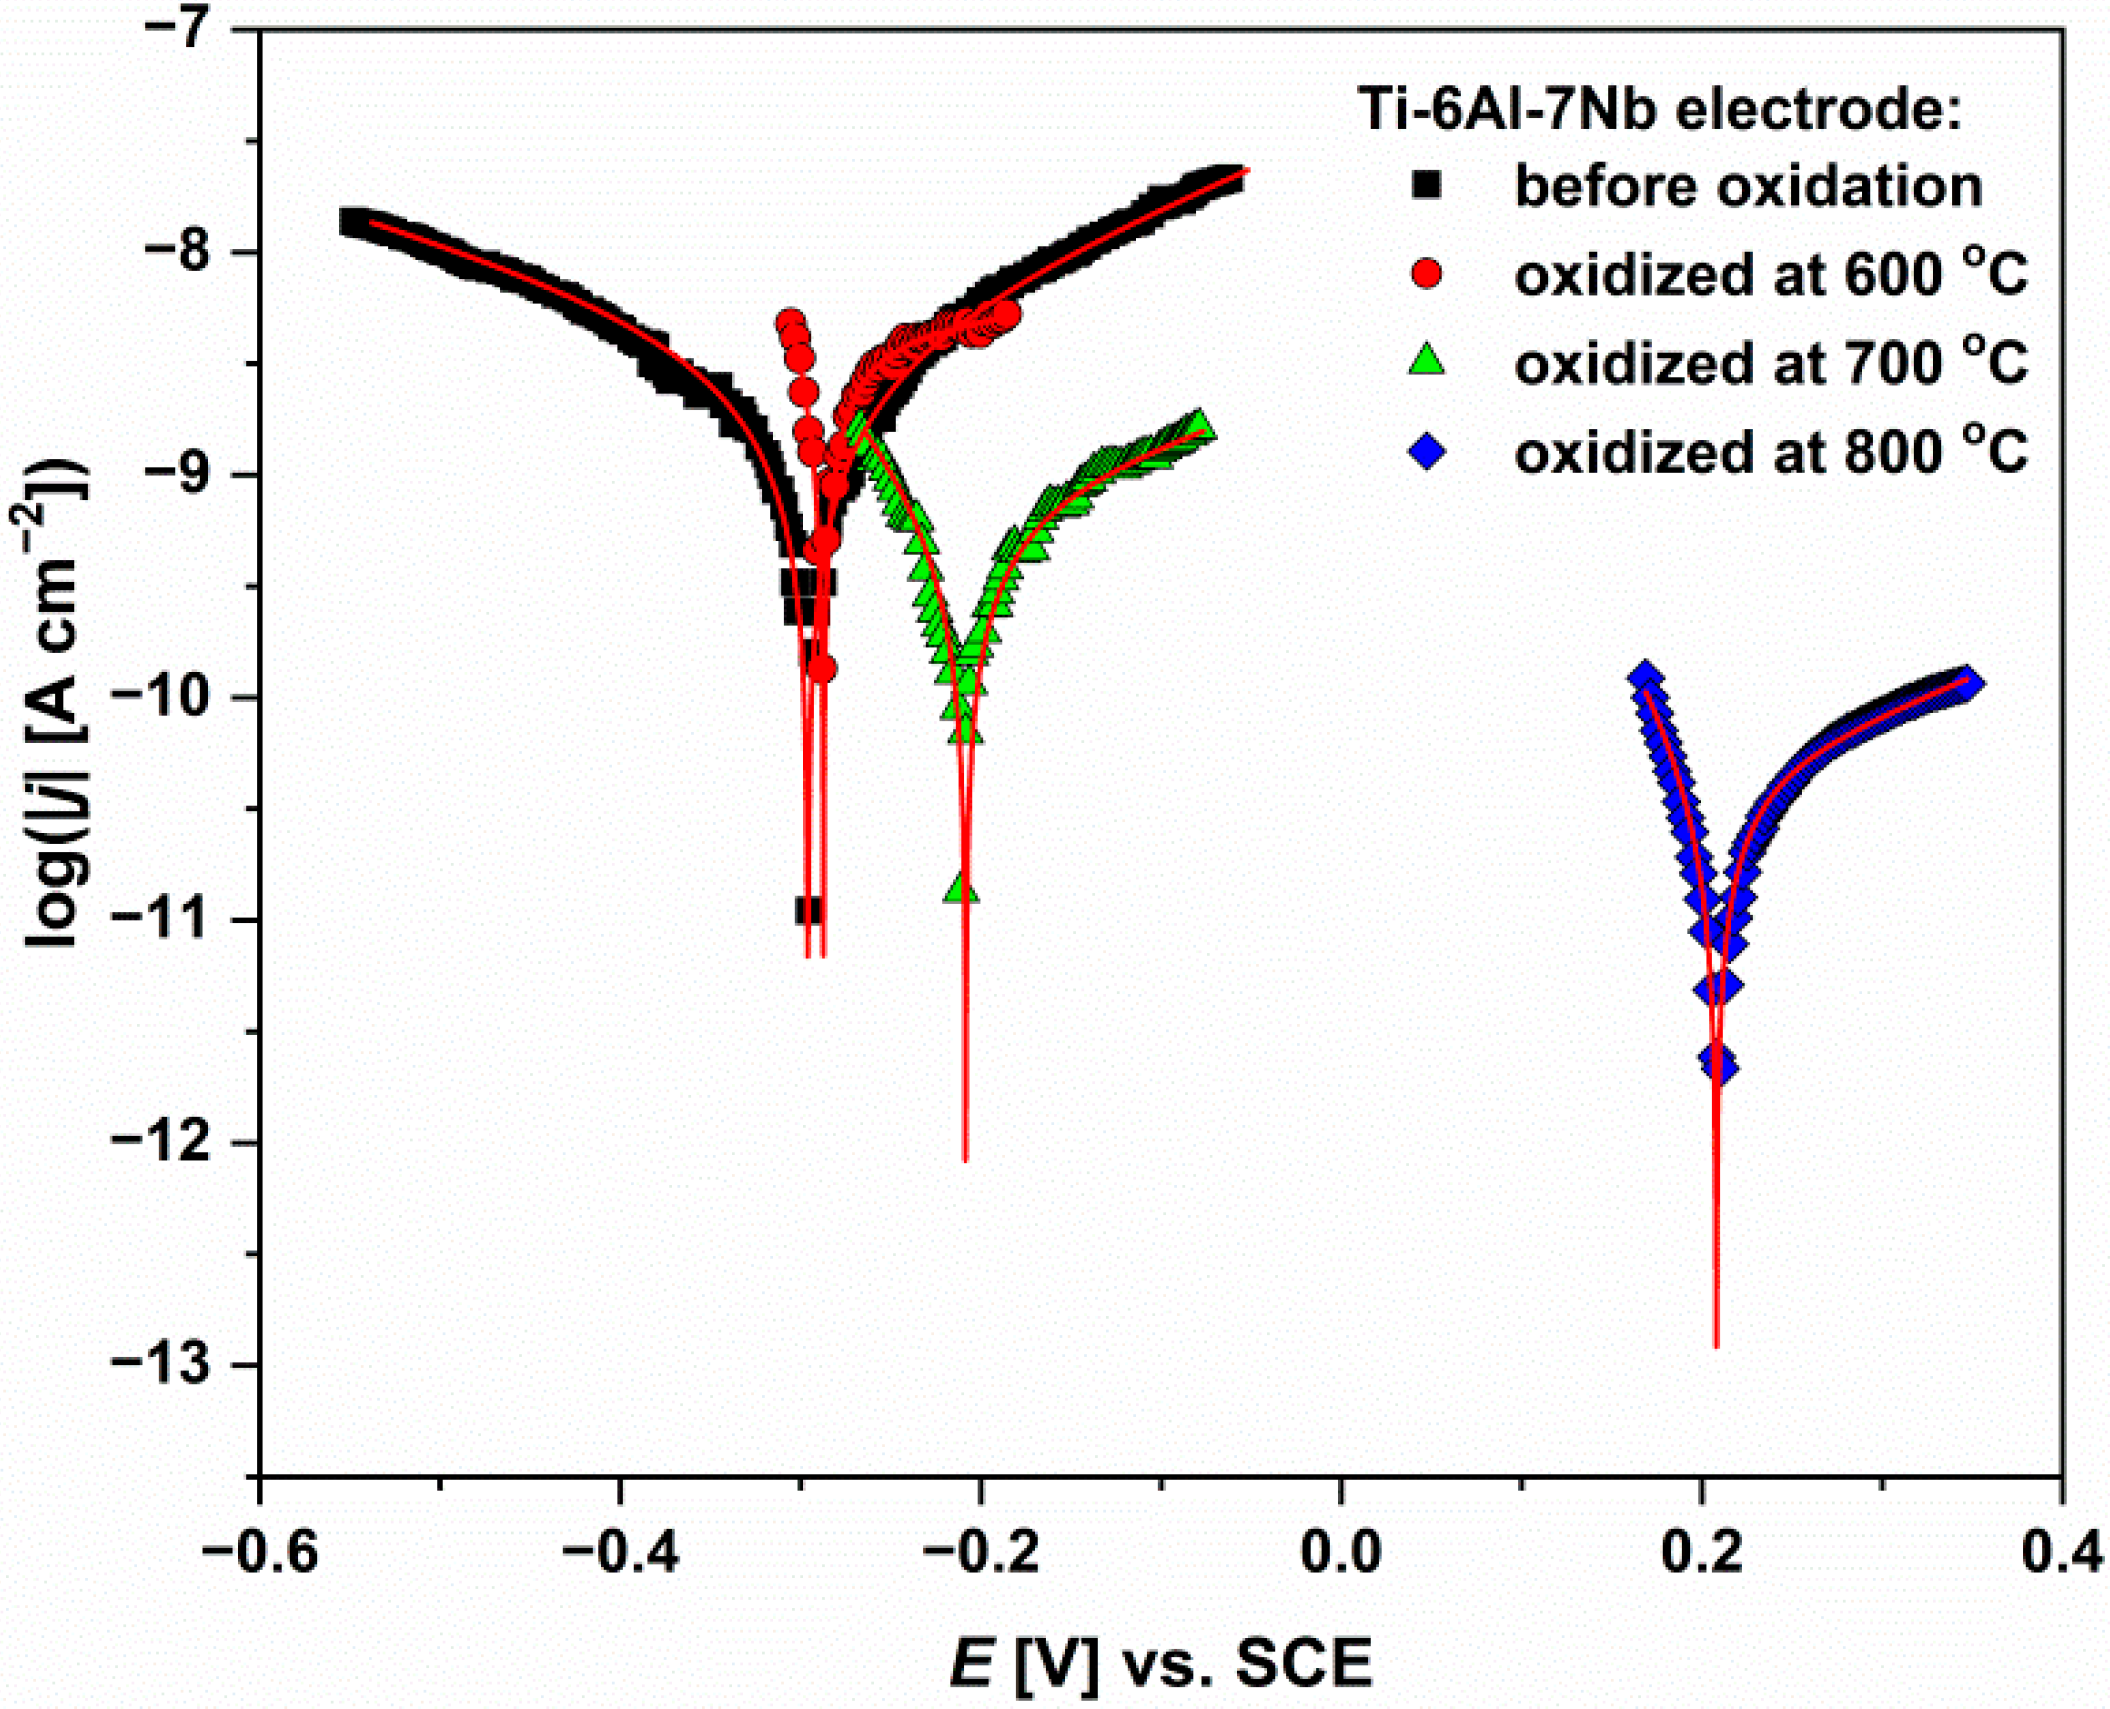
Open-circuit potential is a widely used parameter determining a conductive material’s tendency to corrosion or its corrosion resistance in an aggressive environment. A characteristic feature of this method is measuring the potential difference between the WE and the RE without applying current to the external system. The result of the open-circuit potential monitoring for 2 h as a plot of the EOC versus time (t) is shown in Figure 7. The average values of the EOC with corresponding standard deviation (SD) for the Ti-6Al-7Nb alloy before and after isothermal oxidation obtained in saline solution at 37 °C are presented in Table 2.
The EOC is an increasing function of isothermal oxidation temperature. The ionic-electron equilibrium at the electrode|electrolyte interface was attained in the range of the EOC values from −336(17) mV for the Ti-6Al-7Nb electrode at the initial state to 275(14) mV for the Ti-6Al-7Nb electrode after isothermal oxidation at 800 °C. The observed change of the EOC reflects a change in a corrosion system, which is caused by the change in one or both anodic and cathodic reactions as the corrosion potential is a mixed potential. This implies that the oxide layers grown over Ti-6Al-7Nb alloy during isothermal oxidation have better barrier properties and are thermodynamically more stable compared to the oxide layer formed under self-passivation conditions. The highest EOC is observed for the electrode after oxidation at 800 °C, which has the greatest thickness of the oxide layer (Figure 2).

3.6. Tafel Curves

Another method used to assess the materials tested the corrosive behavior was the analysis of polarization curves recorded near the corrosion potential (Tafel curves). Potentiodynamic measurement of such characteristics was based on changing the electrode potential (E) over time in a narrow range of potentials relative to the stabilized EOC value and recording the value of current density (j) as a function of potential j = f(E). Figure 8 presents the logarithm’s dependence on the current density module on the potential for the Ti-6Al-7Nb electrode before and after isothermal oxidation in saline solution at 37 °C. There are distinct cathodic/anodic transitions and the linear regions near the Ecor on the polarization curves of log |j| = f(E) curves for both cathodic and anodic branches. Experimental data presented were fitted by a numerical method using the Butler-Volmer (B-V) equation in the form below [53]:
j = j cor { exp [ 2.303 ( E E cor ) b a ] exp [ 2.303 ( E E cor ) b c ] } ,
where j is current density of the electrode in A·cm−2, E is potential of the electrode in V, jcor is corrosion current density in A·cm−2, Ecor is corrosion potential in V, ba, and bc is anodic and cathodic Tafel slope in V·dec−1, respectively. The B-V equation describes the kinetics of electrode reactions and is considered central in electrode kinetics’ phenomenology. It takes into account both the cathodic and anodic reactions co-occurring on the electrode. Equation (1) is applicable when the electrode reaction is controlled by exchanging charge on the electrode and not by mass transfer.
As a result of the B-V fitting, the values of Ecor, jcor, ba, and bc were determined. The R2 values were in the range 0.995–0.999, indicating a very good quality of the fitting. The obtained parameters were the basis for determining the remaining corrosion resistance parameters of the tested electrodes, such as Stern-Geary constant (B), polarization resistance (Rp), corrosion rate (CR) at the Ecor, which were calculated according to ASTM G102—89(2015)e1 [54].
The Stern-Geary constant was calculated from known Tafel slopes where both cathodic and anodic reactions were under activation control according to the following equation:
B = b a × b c 2.303 ( b a + b c ) .
The polarization resistance was calculated from the corrosion current density and the Stern-Geary constant as follows:
j cor = B R p .
Faraday’s Law was used to calculate the electrochemical corrosion rate in terms of penetration rate (CR) based on the following equation:
C R = K 1 j cor ρ E W ,
where CR is in mm yr−1, jcor in mA·cm−2, K1 = 3.27 × 10⁻³ in mm g·μA−1 cm−1·yr−1, ρ is the alloy density in g·cm−3, and the equivalent weight (EW) is considered dimensionless. It was assumed that no selective dissolution of any of the alloy components took place. The Ti-6Al-7Nb alloy density of 4.52(1) g·cm−3 was determined based on sample mass and volume.
The following formula defines the EW occurring in Equation (4):
E W = 1 n i f i M i ,
where ni—the valence of the ith element of the alloy, fi—the mass fraction of the ith element in the alloy, and Mi—the atomic weight of the ith element in the alloy [54]. For calculating the EW of the alloy, only those alloying elements whose percentage content in the alloy was higher than 1% were taken into account. Considering the composition of the alloy tested, the calculation of the EW of the Ti-6Al-7Nb alloy included three metals: Ti (87.0%), Al (5.6%), and Nb (7.4%). The valence of each element taken into account in the calculations was determined based on the Pourbaix diagrams [55]. The metals included in the EW calculations were assumed to be in the following thermodynamically stable forms: Ti4+, Al3+, and Nb5+. The EW value calculated according to the above assumptions was 12.06 (Table 3).
The values of all corrosion resistance parameters determined together with SD for the Ti-6Al-7Nb alloy electrodes at the initial and oxidized state in physiological saline solution at 37 °C are summarized in Table 4.
Corrosion potential can be considered a parameter that allows for an initial assessment of the examined alloy’s corrosion resistance and predicts when its destructive processes will start in a given corrosive environment. The average Ecor value determined for the Ti-6Al-7Nb electrode at the initial state in saline solution at 37 °C is −296.0(5) mV (Table 4). For comparison, the Ecor of −339 mV was determined for the Ti-6Al-7Nb alloy with a ground surface exposed in Ringer’s solution [56]. In phosphate-buffered saline solution, the Ecor for the polished Ti-6Al-7Nb electrode was reported to be −480 mV [49]. The differences in the Ecor result from the change in the chemical composition of the corrosive environment and the method of electrode surface preparation. The use of isothermal oxidation of the Ti-6Al-7Nb alloy influenced the shift of the average Ecor value towards the anode potentials, which indicates an increase in corrosion resistance of the examined alloy caused by the protective barrier properties of the formed oxygen layers (Table 4). The highest Ecor equal to 207.9(5) mV was obtained for the tested alloy with the oxide layer obtained at 800 °C, which was 25 times thicker compared to the oxide layer formed at 600 °C (Figure 2).
The average jcor value for the Ti-6Al-7Nb electrode at the initial state determined in saline solution at 37 °C is 3.6(2) nA·cm−2 (Table 4). The decrease in the jcor with increasing isothermal oxidation temperature indicates a slower dissolution rate of the oxide layer. The oxide layer formed at 800 °C showed the best quality in compactness, impermeability, or continuity. It is the most thermodynamically stable in the surrounding medium. The jcor is directly proportional to the dissolution rate. However, it cannot be used as a kinetic parameter for the comparative assessment of the tested electrodes’ corrosion resistance.
Table 4 also shows the Stern-Geary constants calculated according to Equation (2) from the obtained Tafel slope values ba and bc. The B is directly proportional to the corrosion rate’s value and represents the correction factor constant determined by the mechanism/kinetics of the corrosion process. The following reactions for the substrate (6) and the oxide layer (7) explain the electrochemical behavior of the Ti-6Al-7Nb alloy before and after isothermal oxidation under corrosion conditions in saline solution at 37 °C:
2 M e + 2 n H + 2 M e n + + n H 2 ,
M e O m + 2 m H + M e 2 m + + m H 2 O ,
where Me = Ti, Al, Nb.
Dissolution of the substrate in the process of electrochemical corrosion described by reaction (6) differs from the dissolution of oxide films, including oxides of individual metallic components of the alloy by reaction (7). Oxide layers formed on the surface of the Ti-6Al-7Nb alloy due to isothermal oxidation reduce the effective contact between the saline solution and the substrate. The oxidized alloy’s average corrosion rates are therefore approximately equal to the corrosion rates of the oxide films formed and depend on their thickness and density. According to reaction (6), the depolarization of hydrogen is a cathodic process for corrosion of the substrate, which leads to the evolution of hydrogen gas. The process of corrosion of oxidized electrodes includes reactions (6) and (7), where mainly reaction (7) takes place. The H2O formation associated with the corrosion process of oxidized electrodes described in reaction (7) further affects saline solution’s dilution, which undoubtedly reduces the corrosion rate of oxide layers. This mechanism of the anode process is consistent with the obtained experimental data.
The average value of polarization resistance for the Ti-6Al-7Nb alloy at its initial state in saline solution is Rp = 2.0 × 10⁷ Ω·cm2 (Table 4). Lower Rp was reported in the literature for the sandblasted and polished Ti-6Al-7Nb alloy in phosphate-buffered saline [49] and ground Ti-6Al-7Nb alloy in Ringer’s solution [56]. The Rp for the alloy after oxidation is higher and indicates an increase in the tested material’s corrosion resistance with the increase in the isothermal oxidation temperature (Table 4). The Rp of 2.2 × 10⁹ Ω·cm2 for the tested alloy after isothermal oxidation at 800 °C is about 110 times higher than the polarization resistance characteristic of the alloy before oxidation.
Table 4 also shows the calculated values of CR at the Ecor for the Ti-6Al-7Nb alloy before and after isothermal oxidation. The average CR of the non-oxidized Ti-6Al-7Nb alloy occurring in saline solution according to reaction (6) is 3.14 × 10⁻⁵ mm·yr−1. This CR value is lower than the corrosion rate of ca. 9.8 × 10⁻⁵ mm·yr−1 determined for the polished Ti-6Al-7Nb alloy in phosphate-buffered saline [49]. The CR of the Ti-6Al-7Nb alloy after oxidation decreases with increasing temperature of oxidation (Table 4). It is related to the dissolution of the oxide layer according to reaction (7). The smallest CR is in the electrode’s case after oxidation at 800 °C, for which the penetration rate is only 3.58 × 10⁻⁷ mm·yr−1. It means that TiO2, Al2O3, and Nb2O5 oxides, which are part of the oxide layer formed at the highest temperature, tend to reduce the electrochemical corrosion rate to the greatest extent.

3.7. Anodic Polarization Curves

The effect of isothermal oxidation on the Ti-6Al-7Nb alloy’s susceptibility to pitting corrosion in saline solution was determined based on anodic polarization curves (Figure 9). In electrochemical biomaterial testing, the anode potential limit to 4 V is sufficient since the real potential differences in the human body’s biological environment do not exceed 2.5 V [49]. In this study, anodic polarization in a broader range of potentials reaching up to 9 V was used to reveal specific differences in the tested electrodes’ electrochemical behaviour, particularly to determine the potential-current conditions in which pitting corrosion will occur. In Figure 9, one can observe a shift of the Ecor for the Ti-6Al-7Nb alloy after isothermal oxidation towards anodic potentials relative to the Ecor for the alloy at the initial state. It indicates an increase in the tested alloy’s corrosion resistance, caused by the protective properties of the oxide layers formed. The highest corrosion resistance shows the alloy tested with an oxide layer formed at 800 °C. Below the Ecor, the tested electrodes are corrosion resistant. Above this potential, the oxidation process begins. It is the active range and Tafel’s dependency is fulfilled in it.
In Figure 9 there is no clearly marked area of active electrode dissolution due to the fact that the corrosion potentials are in the passive region of potentiodynamic characteristics. The corrosion resistance of the tested electrodes depends mainly on the structure and thickness of the oxide layer. When the potential reaches the value of the passive layer breakdown potential (Ebp), the current density increases. The values of Ebp and the breakdown current density of the passive layer (jbp) are shown in Table 5.
All Ebp values exceed 4 V (Table 5). The significantly higher Ebp is observed for the electrodes after oxidation. A probable reason for the increased resistance to pitting corrosion of the examined alloy after isothermal oxidation is the presence of an alloying additive in the form of Nb, which stabilizes the passive layer and prevents its penetration, significantly slowing pitting initiation [57]. The literature reports that the Nb cations show the ability to improve the passivation properties of oxide layers on titanium and its alloys by lowering the concentration of anion vacancies generated by the presence of lower titanium oxidation states [58,59]. It is worth emphasizing that the Ebp of the self-passive TiO2 layer formed on titanium and its alloys commonly used in implantology is only ca. 0.5–2.4 V [60,61,62], which indicates the possibility of long-term use of the Ti-6Al-7Nb alloy in medicine. Pitting corrosion occurs at the time of a local violation of the passive layer continuity. The pitting process occurs in particularly reactive places on the passivated surface, above the dislocation mouths, grain boundaries, inclusions, foreign phase precipitations, etc. In the abovementioned places on the surface, adsorption of aggressive anions ions in saline solution is preferred according to the Okamoto model as described in our previous work [61].

3.8. Scanning Kelvin Probe Measurements

The effect of isothermal oxidation on the electronic properties of the Ti-6Al-7Nb alloy in the air was studied using the Scanning Kelvin Probe (SKP) technique. The recorded contact potential difference maps for the Ti-6Al-7Nb electrodes before and after isothermal oxidation are shown in Figure 10a–d. Corresponding histograms for each CPD map are presented in Figure 11.
Quantitative characterization of the surface properties of the material under study was carried out by approximation of the histograms of the CPD values using Gaussian function described by the following equation:
g ( C P D ) = 1 σ 2 π e 1 2 ( C P D C P D av σ ) 2 ,
where CPDav is the average value of contact potential difference and σ is its SD. The detailed procedure for preparing histograms was described in earlier works [63,64]. The values of CPDav and σ are listed in Table 6.
The Ti-6Al-7Nb alloy at the initial state is characterized by the smallest value of CPDav and the highest σ among all the investigated alloys (Figure 10a). The isothermal oxidation at 600 °C causes a slight increase in CPDav value by ca. 30 mVKP and decrease in σ value by ca. 5 mVKP (Figure 10b).
The Ti-6Al-7Nb alloy at the initial state is characterized by the smallest value of CPDav and the highest σ among all the investigated alloys (Figure 10a). The isothermal oxidation at 600 °C causes a slight increase in CPDav value by ca. 30 mVKP and decrease in σ value by ca. 5 mVKP (Figure 10b). Further increase in temperature to 700 °C (Figure 10c) and 800 °C (Figure 10d) increases the CPDav and decreases σ values significantly (Table 6).
It was also found that the spread of the CPD distribution around the average (represented by σ, Table 6) is the highest for the Ti-6Al-7Nb alloy at the initial state and decreases with increasing temperature (Figure 11). The obtained results show that the increase in the oxidation temperature leads to a decrease in the oxide layer’s discontinuities. It was stated that the surface of the oxide layer formed at 800 °C is characterized by the most uniform distribution of contact potential difference among all the investigated oxides. Moreover, one can state that changes in the electronic properties (represented by CPDav) and corrosion rate (represented by CR) of oxide layers as a function of oxidation temperature are similar.

3.9. Bioactivity Study

Figure 12 presents exemplary SEM images of the surface morphology of the alkali- and heat-treated Ti-6Al-7Nb alloy isothermally oxidized after soaking in the SBF at 36.6 °C for 24 h. All tested materials formed apatite on their surface but to a different degree. On the surface of the specimen oxidized at 600 °C, numerous spherical particles forming agglomerates over a large surface area were observed (Figure 12a). The apatite-forming ability of this sample was the highest among all the materials tested. An increase in oxidation temperature up to 700 °C decreased the ability to form apatite on the surface of the Ti-6Al-7Nb alloy (Figure 12b). The precipitate was fairly evenly distributed over the surface of this sample. Still, a significant decrease in the number and size of the crystals formed was visible compared to the alloy oxidized at 600 °C. For the sample oxidized at 800 °C, the apatite-forming ability was very low after 24 h of soaking in the SBF (Figure 12c). The mechanism of apatite growth on the unoxidized Ti-6Al-7Nb alloy with a porous anatase gel layer was reported by Sasikumar and Rajendran [23].
Analysis of the local chemical composition of all samples after the bioactivity test showed the presence of peaks originated from alloying elements as Ti, Al, and Nb, as shown in an exemplary EDS spectrum in the micro-region of the Ti-6Al-7Nb alloy oxidized at 600 °C after one day of soaking in the SBF (Figure 13). Additionally, Na-derived peaks were identified as a result of the surface treatment carried out. Detected peaks of Ca and P were of different intensity, directly proportional to the amount of formed apatite on each sample surface. Based on the EDS analysis, it was found that the Ca:P ratio for all the specimens after soaking in the SBF was 1.0. The EDS results confirmed the nucleation and first evolution of apatite already after 24 h of soaking in the SBF.
To identify the compound precipitated on the surface of the samples after soaking in the SBF for one day and seven days, a comparative ATR-FTIR spectra analysis was performed for the tested materials before soaking in the SBF (without alkali- treatment) and after the bioactivity test (with alkali- treatment) (Figure 14). On each ATR-FTIR spectrum, absorption peaks in the range 3600–3800 cm−1 (H2O) are observed from the residual air [65]. The adsorption peaks in the range 1500–1600 cm−1 come from the Al-O bond and are related to the thin layer of oxides formed on the titanium alloys’ surface. The intense peak located in the range 650–1050 cm−1 is caused by the formation of an oxide layer on the alloy surface [66]. The peaks visible at 1009–1248 cm−1 are attributed to the Ti-OH bond’s stretching [66]. For the samples oxidized at 700 and 800 °C, after immersion in the SBF in the peak range 1420–1460 cm−1, carbonate ion bonds are identified [23]. The presence of phosphate bonds is ascertained from the peak at 1034–1038 cm−1 [23]. The peak at 600 cm−1 indicates the formation of hydroxyapatite (HAp) on the surface of the alkali- and heat-treated materials, which proves the bioactivity of the tested surfaces [65]. Its intensity increases strongly with extending the soaking time to seven days. The obtained results indicate that the identified compound is similar to bone mineral [46]. Natural apatite is one of the biological varieties of calcium phosphate. Hydroxyapatite occurs in hard tissues such as bone, dentin, and enamel [67]. Natural apatites are biologically adaptable. Hydroxyapatite precipitates from body fluids, affecting bone mineralization. The HAp structure includes PO 4 3 ions, which influence bone tissues’ enzymatic activity and constitute a scaffold for organic substances [68]. Naturally produced apatite on the surface of the SBF material can bind to bone through the layer of apatite formed on its surface in the living body.
The obtained results confirmed that a single-stage alkali treatment is sufficient to increase the bioactivity of Ti-6Al-7Nb. A two-stage chemical treatment was also used in literature [23]. The first stage was etching with a mixture of HCl and H2SO4 acids. The second stage consisted of an alkali treatment using a concentrated NaOH solution and heat treatment, allowing obtaining a porous anatase gel layer. It has been found that after soaking the treated Ti-6Al-7Nb alloy in SBF with a chemical composition similar to that of human plasma for seven days, an increase in corrosion resistance in the same type of SBF was observed due to the apatite growth on the alloy surface. However, the authors reported that acid etching could cause hydrogen absorption into the titanium and its alloys during the first step of chemical treatment and β-phase grains dissolution. In vitro studies showed that after soaking in SBF for four weeks, the bioactivity of alkali- and heat-treated Ti-6Al-7Nb alloy was higher than the untreated alloy, which was confirmed by the presence of a dense and uniform bonelike apatite layer on the surface-treated alloy [24]. In vivo studies in which the implants of untreated and surface-treated Ti-6Al-7Nb alloy were inserted into the medial side of each tibia of rats for four weeks revealed significantly higher direct bone contact with the implant surface in the case of alkali- and heat-treated implants. The surface-treated Ti-6Al-7Nb alloy showed enhanced biocompatibility with faster Ap-forming ability and higher corrosion resistance than the Ti-5Al-2Nb-1Ta alloy subjected to chemical treatment [23]. Biomaterials, particularly with shells of natural apatites produced in the laboratory or by immersion in SBF solution, can promote cell adhesion and the growth of osteoblast-like cells. The viability of cells on such materials increases with an increase in the thickness of the natural apatite layer on biomaterials’ surface [69,70,71].

4. Conclusions

  • Based on the obtained results it can be stated that the isothermal oxidation can be proposed to surface modification of the diphase (α + β) Ti-6Al-7Nb biomedical alloy to enhance its mechanical properties, in vitro corrosion resistance and bioactivity in the biological environment.
  • SEM/EDS study of the microstructure and local chemical composition of the investigated alloy at the initial state and after isothermal oxidation revealed that with the increase in oxidation temperature from 600 to 800 °C, the mean thickness of the oxide layers well-adhered to the substrate, increased from 0.25 to 5.48 μm, respectively.
  • The increase in the oxidation temperature is a factor increasing the surface roughness of the Ti-6Al-7Nb alloy. The hardness of the obtained oxide layers increases with the oxidation temperature growth, regardless of the applied load, in the range 0.1–1 N.
  • Corrosion resistance parameters were determined for the obtained materials in the saline solution at 37 °C using the open-circuit potential method and potentiodynamic measurements. The mechanism of the anode process of the Ti-6Al-7Nb alloy before and after isothermal oxidation can be explained by dissolution of the substrate with higher rate in comparison with the dissolution rate of the formed oxide layers including oxides of individual metallic components of the alloy.
  • It was found that isothermal oxidation carried out under the proposed conditions increased the contact potential difference, and significantly improved the corrosion resistance of the Ti-6Al-7Nb alloy and reduced its susceptibility to pitting corrosion. The oxide layer grown over Ti-6Al-7Nb alloy at 800 °C for 72 h was characterized by the highest barrier properties to inhibit corrosion process.
  • It was ascertained that the alkali- and heat-treated Ti-6Al-7Nb alloy after isothermal oxidation revealed the HAp-forming ability already after one day of soaking in the SBF in the simulated body fluid.

Author Contributions

Conceptualization, K.A. and B.Ł.; methodology, B.Ł., J.K. and P.O.; investigation, K.A., B.Ł., J.K., P.O., A.S., A.B. and S.K.; formal analysis, K.A., B.Ł., P.O., J.K. and A.B.; writing—original draft preparation, K.A., B.Ł., J.K. and P.O.; writing—review and editing, A.S. and A.B; visualization, K.A., B.Ł., J.K., P.O., A.S. and S.K.; funding acquisition, K.A. All authors have read and agreed to the published version of the manuscript.

Funding

This research received no external funding.

Institutional Review Board Statement

Not applicable.

Informed Consent Statement

Not applicable.

Data Availability Statement

The data presented in this study are available on request from the corresponding author.

Conflicts of Interest

The authors declare no conflict of interest.

References

  1. Nicholson, J.W. Titanium alloys for dental implants: A review. Prosthesis 2020, 2, 100–116. [Google Scholar] [CrossRef]
  2. Gilbert, J.L. 1.2 Electrochemical Behavior of Metals in the Biological Milieu. In Comprehensive Biomaterials II, 2nd ed.; Ducheyne, P., Healy, K., Hutmacher, D.W., Grainger, D.W., Kirkpatrick, C.J., Eds.; Elsevier: Amsterdam, The Netherlands, 2017; Volume 1, pp. 19–49. ISBN 9780081006924. [Google Scholar] [CrossRef]
  3. Verma, R.P. Titanium based biomaterial for bone implants: A mini review. Mater. Today Proc. 2020. [Google Scholar] [CrossRef]
  4. Kapoor, N.; Nagpal, A.; Verma, R. Surface Treatment of Titanium Implant and Dental Implant Design: Titanium as Biomaterial and Method Used for Surface Treatment to Increase Bone and Soft Tissue Integration; LAP LAMBERT Academic Publishing: Port Louis, Mauritius, 2020; ISBN 978-620-2-55638-5. [Google Scholar]
  5. Tsai, M.-T.; Chen, Y.-W.; Chao, C.Y.; Jang, J.S.C.; Tsai, C.-C.; Su, Y.-L.; Kuo, C.-N. Heat-treatment effects on mechanical properties and microstructure evolution of Ti-6Al-4V alloy fabricated by laser powder bed fusion. J. Alloys Comp. 2020, 816, 152615. [Google Scholar] [CrossRef]
  6. Luo, Y.; Chen, W.; Tian, M.; Teng, S. Thermal oxidation of Ti6Al4V alloy and its biotribological properties under serum lubrication. Tribol. Inter. 2015, 89, 67–71. [Google Scholar] [CrossRef]
  7. Siva Rama Krishna, D.; Brama, Y.L.; Sun, Y. Thick rutile layer on titanium for tribological applications. Tribol. Inter. 2007, 40, 329–334. [Google Scholar] [CrossRef]
  8. Javadi, A.; Solouk, A.; Nazarpak, M.H.; Bagheri, F. Surface engineering of titanium-based implants using electrospraying and dip coating methods. Mater. Sci. Eng. C 2019, 99, 620–630. [Google Scholar] [CrossRef]
  9. Kang, J.-I.; Son, M.-K.; Choe, H.-C.; Brantley, W.A. Bone-like apatite formation on manganese-hydroxyapatite coating formed on Ti-6Al-4V alloy by plasma electrolytic oxidation. Thin Solid Films 2016, 620, 126–131. [Google Scholar] [CrossRef]
  10. Cimenoglu, H.; Meydanoglu, O.; Baydogan, M.; Bermek, H.; Huner, P.; Kayali, S. Characterization of thermally oxidized Ti6Al7Nb alloy for biological applications. Met. Mater. Int. 2011, 17, 765–770. [Google Scholar] [CrossRef]
  11. Güleryüz, H.; Cimenoğlu, H. Effect of thermal oxidation on corrosion and corrosion–wear behaviour of a Ti-6Al-4V alloy. Biomaterials 2004, 25, 3325–3333. [Google Scholar] [CrossRef]
  12. Wen, M.; Wen, C.; Hodgson, P.; Li, Y. Improvement of the biomedical properties of titanium using SMAT and thermal oxidation. Colloids Surf. B 2014, 116, 658–665. [Google Scholar] [CrossRef]
  13. Marsumi, Y.; Pramono, A.W. Influence of niobium or molybdenum in titanium alloy for permanent implant application. Advan. Mater. Res. 2014, 900, 53–63. [Google Scholar] [CrossRef]
  14. Pambudi, M.J.; Basuki, E.A.; Prajitno, D.H. Improving hot corrosion resistance of two phases intermetallic alloy α2-Ti3Al/γ-TiAl with enamel coating. AIP Conf. Proc. 2017, 1805, 070003. [Google Scholar] [CrossRef] [Green Version]
  15. Gao, P.F.; Lei, Z.N.; Wang, X.X.; Zhan, M. Deformation in fatigue crack tip plastic zone and its role in crack propagation of titanium alloy with tri-modal microstructure. Mater. Sci. Eng. A 2019, 739, 198–202. [Google Scholar] [CrossRef]
  16. Chen, Z.X.; Wang, W.X.; Takao, Y.; Matsubara, T.; Ren, L.M. Microstructure and shear fracture characteristics of porous anodic TiO2 layer before and after hot water treatment. App. Surf. Sci. 2011, 257, 7254–7262. [Google Scholar] [CrossRef]
  17. Sankara Narayan, T.S.N.; Kim, J.; Park, H.W. Fabrication and synthesis of uniform TiO2 nanoporous and nanotubular structures on dual-phase Ti-6Al-4V alloy using electron-beam irradiation. Mater. Chem. Phys. 2020, 242, 122549. [Google Scholar] [CrossRef]
  18. Zheng, J.; Chen, L.; Chen, D.; Shao, C.; Yi, M.; Zhang, B. Effects of pore size and porosity of surface-modified porous titanium implants on bone tissue ingrowth. Trans. Nonferr. Met. Soc. China 2019, 29, 2534–2545. [Google Scholar] [CrossRef]
  19. Tallarico, M.; Ceruso, F.M.; Muzzi, L.; Meloni, S.M.; Kim, Y.J.; Gargari, M.; Martinolli, M. Effect of simultaneous immediate implant placement and guided bone reconstruction with ultra-fine titanium mesh membranes on radiographic and clinical parameters after 18 months of loading. Materials 2019, 12, 1710. [Google Scholar] [CrossRef] [PubMed] [Green Version]
  20. Inchingolo, F.; Tatullo, M.; Abenavoli, F.M.; Marrelli, M.; Inchingolo, A.D.; Palladino, A.; Inchingolo, A.M.; Dipalma, G. Oral piercing and oral diseases: A short time retrospective study. Int. J. Med. Sci. 2011, 8, 649–652. [Google Scholar] [CrossRef] [Green Version]
  21. Siwakul, P.; Sirinnaphakorn, L.; Suwanprateep, J.; Hayakawa, T.; Pugdee, K. Cellular responses of histatin-derived peptides immobilized titanium surface using a tresyl chloride-activated method. Dent. Mater. J. 2021. [Google Scholar] [CrossRef]
  22. Challa, V.S.A.; Mali, S.; Misra, R.D.K. Reduced toxicity and superior cellular response of preosteoblasts to Ti-6Al-7Nb alloy and comparison with Ti-6Al-4V. J. Biomed. Mater. Res. A 2013, 101A, 2083–2089. [Google Scholar] [CrossRef]
  23. Sasikumar, Y.; Rajendran, N. Effect of acid treatment on the surface modification of Ti-6Al-7Nb and Ti-5Al-2Nb-1Ta and its electrochemical investigations in simulated body fluid. J. Bio Tribo Corros. 2017, 3, 41. [Google Scholar] [CrossRef]
  24. Tamilselvi, S.; Raghavendran, H.B.; Srinivasan, P.; Rajendran, N. In vitro and in vivo studies of alkali- and heat-treated Ti-6Al-7Nb and Ti-5Al-2Nb-1Ta alloys for orthopedic implants. J. Biomed. Mater. Res. A 2009, 90A, 380–386. [Google Scholar] [CrossRef] [PubMed]
  25. Hu, N.; Xie, L.; Liao, Q.; Gao, A.; Zheng, Y.; Pan, H.; Tong, L.; Yang, D.; Gao, N.; Starink, M.J.; et al. A more defective substrate leads to a less defective passive layer: Enhancing the mechanical strength, corrosion resistance and anti-inflammatory response of the low-modulus Ti-45Nb alloy by grain refinement. Acta Biomater. 2021. [Google Scholar] [CrossRef] [PubMed]
  26. Aniołek, K.; Kupka, M. Mechanical, tribological and adhesive properties of oxide layers obtained on the surface of the Ti–6Al–7Nb alloy in the thermal oxidation process. Wear 2019, 43–433, 202929. [Google Scholar] [CrossRef]
  27. Zhang, Y.; Ma, G.-R.; Zhang, X.-C.; Li, S.; Tu, S.-T. Thermal oxidation of Ti-6Al–4V alloy and pure titanium under external bending strain: Experiment and modelling. Corr. Sci. 2017, 122, 61–73. [Google Scholar] [CrossRef]
  28. Li, L.; Yu, K.; Zhang, K.; Liu, Y. Study of Ti–6Al–4V alloy spectral emissivity characteristics during thermal oxidation process. Inter. J. Heat Mass Transf. 2016, 101, 699–706. [Google Scholar] [CrossRef]
  29. Ravi Shankar, A.; Karthiselva, N.S.; Kamachi Mudali, U. Thermal oxidation of titanium to improve corrosion resistance in boiling nitric acid medium. Surf. Coat. Technol. 2013, 235, 45–53. [Google Scholar] [CrossRef]
  30. Aniołek, K. The influence of thermal oxidation parameters on the growth of oxide layers on titanium. Vacuum 2017, 144, 94–100. [Google Scholar] [CrossRef]
  31. Cao, L.; Wan, Y.; Yang, S.; Pu, J. The tribocorrosion and corrosion properties of thermally oxidized Ti6Al4V alloy in 0.9 wt.% NaCl physiological saline. Coatings 2018, 8, 285. [Google Scholar] [CrossRef] [Green Version]
  32. Aniołek, K. Structure and properties of titanium and the Ti-6Al-7Nb alloy after isothermal oxidation. Surf. Eng. 2020, 36, 847–858. [Google Scholar] [CrossRef]
  33. Aniołek, K.; Barylski, A.; Kupka, M.; Tylka, J. The influence of thermal oxidation parameters on structural, friction, and wear characteristics of oxide layers produced on the surface of Ti-6Al-7Nb alloy. J. Tribol. 2019, 141, 031605-1–031605-9. [Google Scholar] [CrossRef]
  34. Hussain, S.N.; Abdullah, A.S.; Hassan, M.A.; Daud, R.; Arafat, A.; Ahmad, M.F. Review on wear and corrosion behavior of thermal oxidation on titanium-based alloy for biomedical application. J. Adv. Res. Fluid Mech. Ther. Sci. 2019, 58, 153–160. [Google Scholar]
  35. Kumar, S.; Sankara Narayanan, T.S.N.; Ganesh Sundara Raman, S.; Seshadri, S.K. Thermal oxidation of Ti6Al4V alloy: Microstructural and electrochemical characterization. Mater. Chem. Phys. 2010, 119, 337–346. [Google Scholar] [CrossRef]
  36. Dalili, N.; Edrisy, A.; Farokhzadeh, K.; Li, J.; Lo, J.; Riahi, A.R. Improving the wear resistance of Ti-6Al-4V/TiC composites through thermal oxidation (TO). Wear 2010, 269, 590–601. [Google Scholar] [CrossRef]
  37. Wang, S.; Liao, Z.; Liu, Y.; Liu, W. Influence of thermal oxidation temperature on the microstructural and tribological behavior of Ti6Al4V alloy. Surf. Coat. Technol. 2014, 240, 470–477. [Google Scholar] [CrossRef]
  38. Fellah, M.; Labaïz, M.; Assala, O.; Dekhil, L.; Taleb, A.; Rezag, H.; Iost, A. Tribological behavior of Ti-6Al-4V and Ti-6Al-7Nb alloys for total hip prosthesis. Adv. Tribol. 2014, 2014, 1–13. [Google Scholar] [CrossRef] [Green Version]
  39. Aniołek, K.; Kupka, M.; Łuczuk, M.; Barylski, A. Isothermal oxidation of Ti-6Al-7Nb alloy. Vacuum 2015, 114, 114–118. [Google Scholar] [CrossRef]
  40. ISO 14577-4. Metallic Materials—Instrumented Indentation Test for Hardness and Materials Parameters—Part 4: Test Method for Metallic and Non-Metallic Coatings; ISO: Geneva, Switzerland, 2016. [Google Scholar]
  41. Oliver, W.C.; Pharr, G.M. An improved technique for determining hardness and elastic modulus using load and displacement sensing indentation experiments. J. Mater. Res. 1992, 7, 1564–1583. [Google Scholar] [CrossRef]
  42. ISO 10271. Dentistry—Corrosion Test Methods for Metallic Materials; ISO: Geneva, Switzerland, 2011. [Google Scholar]
  43. Freitag, M.; Łosiewicz, B.; Goryczka, T.; Lelątko, J. Application of EIS to study the corrosion resistance of passivated NiTi shape memory alloy in simulated body fluid. Sol. State Phenom. 2012, 183, 57–64. [Google Scholar] [CrossRef]
  44. Stróż, A.; Łosiewicz, B.; Zubko, M.; Chmiela, B.; Balin, K.; Dercz, G.; Gawlikowski, M.; Goryczka, T. Production, structure and biocompatible properties of oxide nanotubes on Ti13Nb13Zr alloy for medical applications. Mater. Charact. 2017, 132, 363–372. [Google Scholar] [CrossRef]
  45. AUTOLAB. Electrochemical Instruments, Description of the Instrument; Eco Chemie, B.V., Ed.; Kanaalweg: Utrecht, The Netherlands, 1998. [Google Scholar]
  46. Pattanayak, D.K.; Yamaguchi, S.; Matsushita, T.; Kokubo, T. Nanostructured positively charged bioactive TiO2 layer formed on Ti metal by NaOH, acid and heat treatments. J. Mater. Sci. Mater. Med. 2011, 22, 1803–1812. [Google Scholar] [CrossRef]
  47. Kokubo, T.; Takadama, H. How useful is SBF in predicting in vivo bone bioactivity? Biomaterials 2006, 27, 2907–2915. [Google Scholar] [CrossRef] [PubMed]
  48. Kumar, S.; Sankara Narayanan, T.S.N.; Ganesh Sundara Raman, S.; Seshadri, S.K. Thermal oxidation of CP Ti—An electrochemical and structural characterization. Mater. Charact. 2010, 61, 589–597. [Google Scholar] [CrossRef]
  49. Burnat, B.; Walkowiak-Przybyło, M.; Błaszczyk, T.; Klimek, L. Corrosion behaviour of polished and sandblasted titanium alloys in PBS solution. Acta Bioeng. Biomech. 2013, 15, 87–95. [Google Scholar] [CrossRef] [PubMed]
  50. ISO 5832-11. Implants for Surgery—Metallic Materials—Part 11: Wrought Titanium 6-Aluminium 7-Niobium Alloy; ISO: Geneva, Switzerland, 2014. [Google Scholar]
  51. Wang, S.; Liao, Z.; Liu, Y.; Liu, W. Influence of thermal oxidation duration on the microstructure and fretting wear behavior of Ti6Al4V alloy. Mater. Chem. Phys. 2015, 159, 139–151. [Google Scholar] [CrossRef]
  52. Jamesh, M.; Kumar, S.; Sankara Narayanan, T.S.N. Effect of thermal oxidation on corrosion resistance of commercially pure titanium in acid medium. J. Mater. Eng. Perform. 2012, 21, 900–906. [Google Scholar] [CrossRef]
  53. Bard, A.J.; Faulkner, L.R. Electrochemical Methods. Fundamentals and Applications, 2nd ed.; John Wiley & Sons Inc.: New York, NY, USA, 2001. [Google Scholar]
  54. ASTM G102—89(2015)e1. Standard Practice for Calculation of Corrosion Rates and Related Information from Electrochemical Measurements; National Association of Corrosion Engineers: Houston, TX, USA, 2015; Volume 03.02. [Google Scholar]
  55. Pourbaix, M. Atlas of Electrochemical Equilibria in Aqueous Solutions, 2nd English ed.; NACE International, National Association of Corrosion Engineers: Houston, TX, USA, 1974. [Google Scholar]
  56. Paszenda, Z.; Walke, W.; Jadacka, S. Electrochemical investigations of Ti6Al4V and Ti6Al7Nb alloys used on implants in bone surgery. J. Achiev. Mater. Manuf. Eng. 2010, 38, 24–32. [Google Scholar]
  57. Kobayashi, E.; Wang, T.J.; Doi, H.; Yoneyama, T.; Hamanaka, H. Mechanical properties and corrosion resistance of Ti±6Al±7Nb alloy dental castings. J. Mater. Sci. Mater. Med. 1998, 9, 567–574. [Google Scholar] [CrossRef]
  58. Yu, S.Y.; Scully, J.R. Corrosion and passivity of Ti-13% Nb-13% Zr in comparison to other biomedical implant alloys. Corrosion 1997, 53, 965976. [Google Scholar] [CrossRef]
  59. Metikoš-Huković, M.; Kwokal, A.; Piljac, J. The influence of niobium and vanadium on passivity of titanium-based implants in physiological solution. Biomaterials 2003, 24, 3765–3775. [Google Scholar] [CrossRef]
  60. Osak, P.; Goryczka, T.; Łosiewicz, B. Effect of polarization scan rate on the pitting potential of the self-passivated NiTi shape memory alloy in a simulated body fluid. Solid State Phenom. 2015, 227, 443–446. [Google Scholar] [CrossRef]
  61. Osak, P.; Łosiewicz, B. EIS study on interfacial properties of passivated Nitinol orthodontic wire in saliva modified with Eludril® mouthwash. Prot. Met. Phys. Chem. Surf. 2018, 54, 680–688. [Google Scholar] [CrossRef]
  62. Handzlik, P.; Fitzner, K. Corrosion resistance of Ti and Ti-Pd alloy in phosphate buffered saline solutions with and without H2O2 addition. Trans. Nonferrous Met. Soc. China 2013, 23, 866–875. [Google Scholar] [CrossRef]
  63. Kubisztal, J.; Losiewicz, B.; Dybal, P.; Kozik, V.; Bak, A. Temperature-related corrosion resistance of AISI 1010 carbon steel in sulfolane. Materials 2020, 13, 2563. [Google Scholar] [CrossRef] [PubMed]
  64. Bak, A.; Losiewicz, B.; Kozik, V.; Kubisztal, J.; Dybal, P.; Swietlicka, A.; Barbusinski, K.; Kus, S.; Howaniec, N.; Jampilek, J. Real-time corrosion monitoring of AISI 1010 carbon steel with metal surface mapping in sulfolane. Materials 2019, 12, 3276. [Google Scholar] [CrossRef] [PubMed] [Green Version]
  65. Salarian, M.; Solati-Hashjin, M.; Shafiei, S.S.; Goudarzi, A.; Salarian, R.; Nemati, A. Surfactant assisted synthesis and characterization of hydroxyapatite nanorods under hydrothermal condition. Mater. Sci. Pol. 2009, 27, 961–971. [Google Scholar]
  66. Patel, S.B.; Hamlekhan, A.; Royhman, D.; Butt, A.; Yuan, J.; Shokuhfar, T.; Sukotjo, C.; Mathew, M.T.; Jursich, G.; Takoudis, C.G. Enhancing surface characteristics of Ti–6Al–4V for bio-implants using integrated anodization and thermal oxidation. J. Mater. Chem. B 2014, 2, 3597–3608. [Google Scholar] [CrossRef] [PubMed]
  67. Pasteris, J.D.; Wopenka, B.; Valsami-Jones, E. Bone and Tooth Mineralization: Why Apatite? Elements 2008, 4, 97–104. [Google Scholar] [CrossRef]
  68. Combes, C.; Cazalbou, S.; Rey, C. Apatite Biominerals. Minerals 2016, 6, 34. [Google Scholar] [CrossRef] [Green Version]
  69. Sahin, Y.M.; Orman, Z.; Yucel, S. In Vitro Studies of α-TCP and β-TCP Produced from Clinocardium Ciliatum Seashells. J. Aust. Ceram. Soc. 2020, 56, 477–488. [Google Scholar] [CrossRef]
  70. Ceruso, F.M.; Ieria, I.; Martelli, M.; Lumbau, A.I.; Xhanari, E.; Gargari, M. New generation of fixture–abutment connection combining soft tissue design and vertical screw-retained restoration: 1-Year clinical, aesthetics and radiographic preliminary evaluation. Dent. J. 2021, 9, 35. [Google Scholar] [CrossRef] [PubMed]
  71. Marrelli, M.; Codispoti, B.; Shelton, R.M.; Scheven, B.A.; Cooper, P.R.; Tatullo, M.; Paduano, F. Dental pulp stem cell mechanoresponsiveness: Effects of mechanical stimuli on dental pulp stem cell behavior. Front. Physiol. 2018, 9, 1685. [Google Scholar] [CrossRef] [PubMed]
Figure 1. SEM image of the surface morphology and corresponding cross-section of the Ti-6Al-7Nb alloy after isothermal oxidation at: 600 °C, (a) surface morphology, (b) cross-section; 700 °C, (c) surface morphology, (d) cross-section; 800 °C (e) surface morphology, (f) cross-section.
Coatings 11 00505 g001aCoatings 11 00505 g001b
Figure 2. The mean thickness of oxide layers on the Ti-6Al-7Nb alloy depending on the temperature of isothermal oxidation; letters placed above each column indicate that the mean thickness of oxide layers is statistically different from one another.
Coatings 11 00505 g002
Figure 3. Energy dispersive spectrum in the Ti-6Al-7Nb alloy surface’s micro-region: (a) before isothermal oxidation; (b) after isothermal oxidation at 800 °C.
Coatings 11 00505 g003
Figure 4. Geometric structure of the Ti-6Al-7Nb alloy surface after oxidation for 72 h at: (a) 600 °C; (b) 700 °C; (c) 800 °C.
Coatings 11 00505 g004aCoatings 11 00505 g004b
Figure 5. Amplitude parameters of the Ti-6Al-7Nb alloy surface after oxidation at 600, 700, and 800 °C.
Coatings 11 00505 g005
Figure 6. The hardness of oxide layers on the Ti-6Al-7Nb alloy surface in dependence of the oxidation temperature and the indenter load.
Coatings 11 00505 g006
Figure 7. Open-circuit potential for the Ti-6Al-7Nb electrode before (─) and after isothermal oxidation at 600 °C (), 700 °C () and 800 °C () recorded in saline solution at 37 °C.
Coatings 11 00505 g007
Figure 8. Tafel curves for the Ti-6Al-7Nb electrode before and after isothermal oxidation at 600, 700, and 800 °C recorded in saline solution at 37 °C showing experimental (symbols) and fitted data () using the Butler-Volmer equation (B-V fit).
Coatings 11 00505 g008
Figure 9. Anodic polarization curves for the Ti-6Al-7Nb electrode at the initial state and after isothermal oxidation at 600, 700, and 800 °C in saline solution at 37 °C.
Coatings 11 00505 g009
Figure 10. The contact potential difference maps determined for the Ti-6Al-7Nb alloy surface: (a) before oxidation; (b) after oxidation at 600 °C; (c) after oxidation at 700 °C; (d) after oxidation at 800 °C. VKP is the voltage measured versus the Kelvin probe.
Coatings 11 00505 g010aCoatings 11 00505 g010b
Figure 11. The contact potential difference histograms determined for the Ti-6Al-7Nb alloy surface before and after isothermal oxidation at 600, 700, and 800 °C.
Coatings 11 00505 g011
Figure 12. SEM images of the surface morphology of the alkali- and heat-treated Ti-6Al-7Nb alloy after soaking in the SBF at 36.6 °C for 24 h: (a) after oxidation at 600 °C; (b) after oxidation at 700 °C; (c) after oxidation at 800 °C.
Coatings 11 00505 g012
Figure 13. Energy dispersive spectrum in the micro-region of the alkali- and heat-treated Ti-6Al-7Nb alloy oxidized at 600 °C after one day of soaking in the SBF at 36.6 °C.
Coatings 11 00505 g013
Figure 14. ATR-FTIR spectra of the alkali-treated Ti-6Al-7Nb alloy after soaking in SBF at 36.6 °C for 24 h: (a) Oxidized at 600 °C; (b) Oxidized at 700 °C; (c) Oxidized at 800 °C.
Coatings 11 00505 g014
Table 1. Surface roughness amplitude parameters measured in tests.
SymbolName of ParameterUnit
SaArithmetic mean heightµm
SqRoot mean square heightµm
SpMaximum peak heightµm
SvMaximum pit heightµm
StTotal heightµm
SskSkewness
SzMaximum heightµm
Table 2. The average value of the EOC with corresponding standard deviation determined for Ti-6Al-7Nb electrode before and after isothermal oxidation in saline solution at 37 °C (see Figure 7).
ParameterBefore Isothermal
Oxidation
After Oxidation
at 600 °C
After Oxidation
at 700 °C
After Oxidation
at 800 °C
EOC [mV]−336−220−173275
SD [mV]1710914
Table 3. Calculation of equivalent weight (EW) for the Ti-6Al-7Nb alloy in saline solution at 37 °C according to ASTM G102—89(2015)e1 [54].
ElementfiniMi [g·mol−1]EW
Ti0.870447.8712.06
Al0.056326.98
Nb0.074592.91
Table 4. The corrosion resistance parameters for the Ti-6Al-7Nb alloy before and after isothermal oxidation determined in a saline solution at 37 °C based on analysis of the polarization curves shown in Figure 8 and according to ASTM G102—89(2015)e1 [54].
Ti-6Al-7Nb
Electrode
Ecor
[mV]
jcor
[nA·cm−2]
ba
[mV]
bc
[mV]
B
[mV]
Rp
[Ω·cm2]
CR at Ecor
[mm·yr−1]
At the initial state−296.0(5)3.6(2)292(8)403(17)73.52.0 × 1073.14 × 10−5
Oxidized at 600 °C−287.3(3)3.5(2)623(50)50(3)120.43.4 × 1073.05 × 10−5
Oxidized at 700 °C−208.4(6)0.67(5)343(29)117(7)37.95.7 × 1075.85 × 10−6
Oxidized at 800 °C207.9(5)0.041(2)291(12)75(3)91.02.2 × 1093.58 × 10−7
Table 5. Key potential-current parameters for the Ti-6Al-7Nb alloy before and after isothermal oxidation, determined based on the potentiodynamic measurements presented in Figure 9.
ParameterBefore Isothermal
Oxidation
After Oxidation
at 600 °C
After Oxidation
at 700 °C
After Oxidation
at 800 °C
Ebp [V]4.090(13)8.098(11)7.453(10)7.930(14)
jbp [A·cm−2]3.1(4) × 10−64.6(5) × 10−52.4(7) × 10−57.3(3) × 10−8
Table 6. Statistical parameters for the contact potential difference maps of the Ti-6Al-7Nb alloy surface before and after isothermal oxidation at 600, 700, and 800 °C, where CPDav—the average value of CPD, σ—the standard deviation of the CPDav, and VKP—the voltage measured versus the Kelvin probe.
ParameterBefore Isothermal
Oxidation
After Oxidation
at 600 °C
After Oxidation
at 700 °C
After Oxidation
at 800 °C
CPDav [mVKP]−773.9(7)−743.5(7)−574.4(3)−203.5(1)
σ [mVKP]29.9(9)24.9(9)14.3(5)9.8(2)
Publisher’s Note: MDPI stays neutral with regard to jurisdictional claims in published maps and institutional affiliations.

