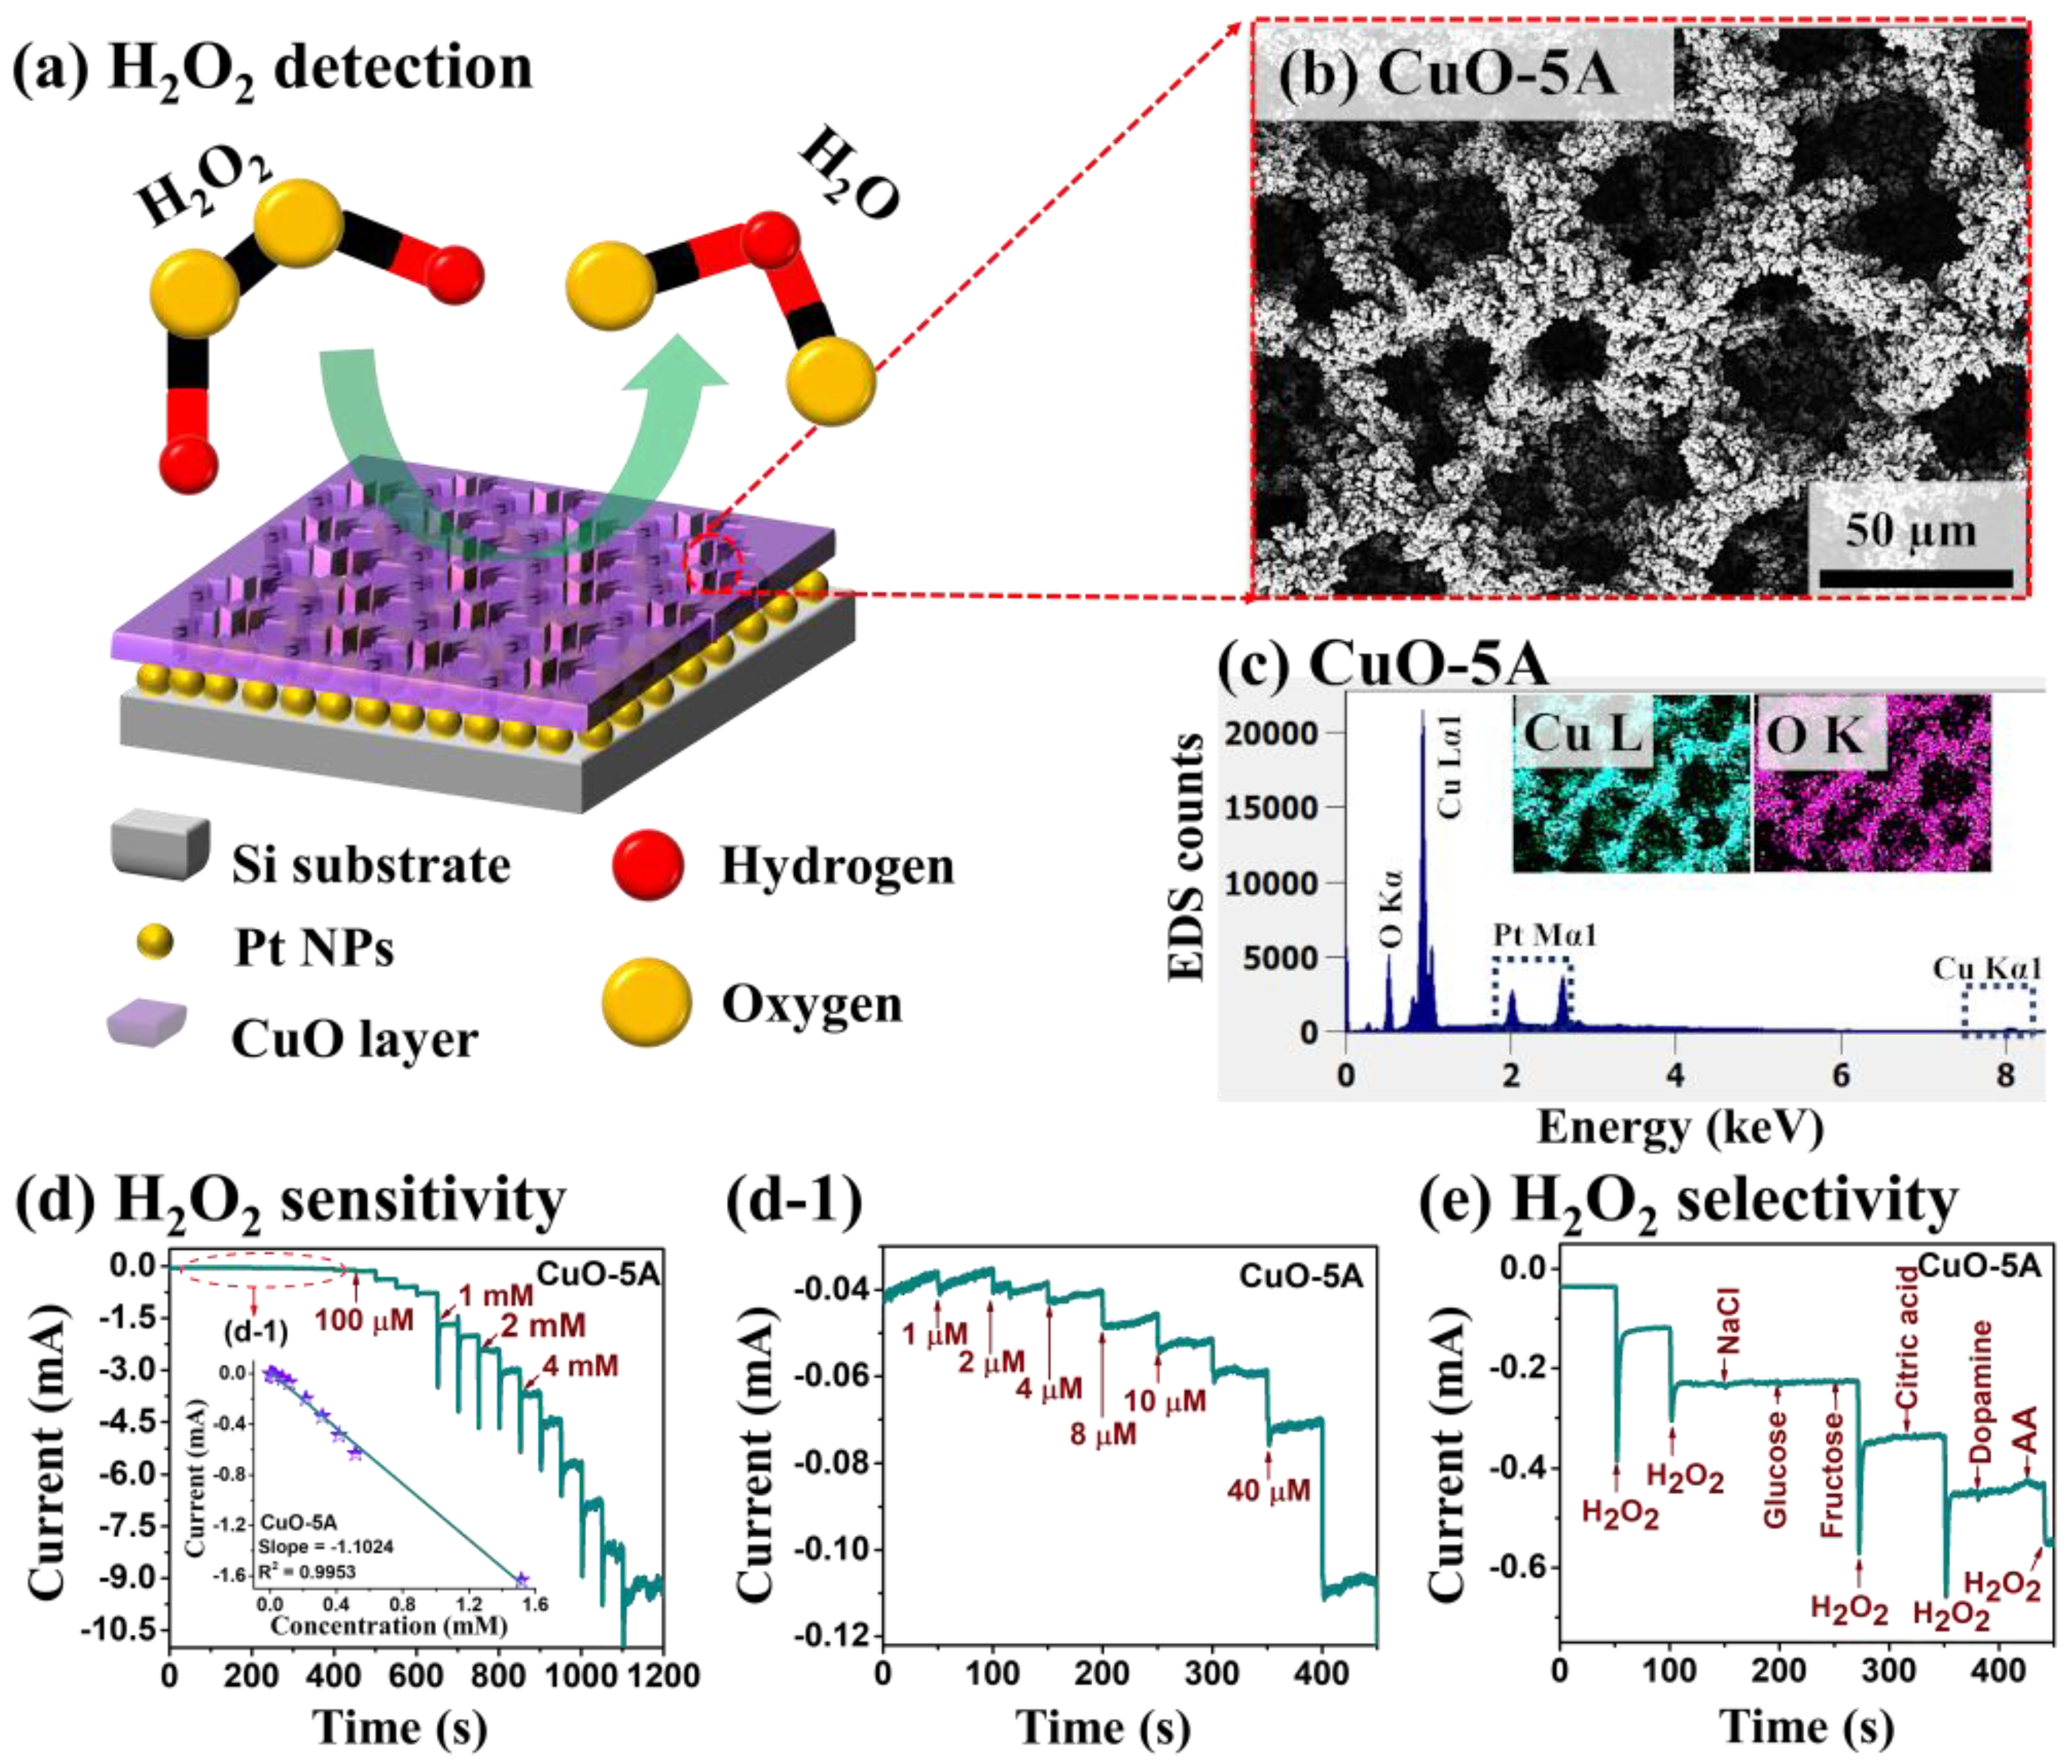
Hydrogen Peroxide Detection by Super-Porous Hybrid CuO/Pt NP Platform: Improved Sensitivity and Selectivity


Abstract
1. Introduction
2. Materials and Methods
2.1. Materials
2.2. Fabrication of Pt Nanoparticles (NPs)
2.3. Fabrication of CuO Nanostructures
2.4. Physical Characterizations
2.5. Electrochemical Measurement
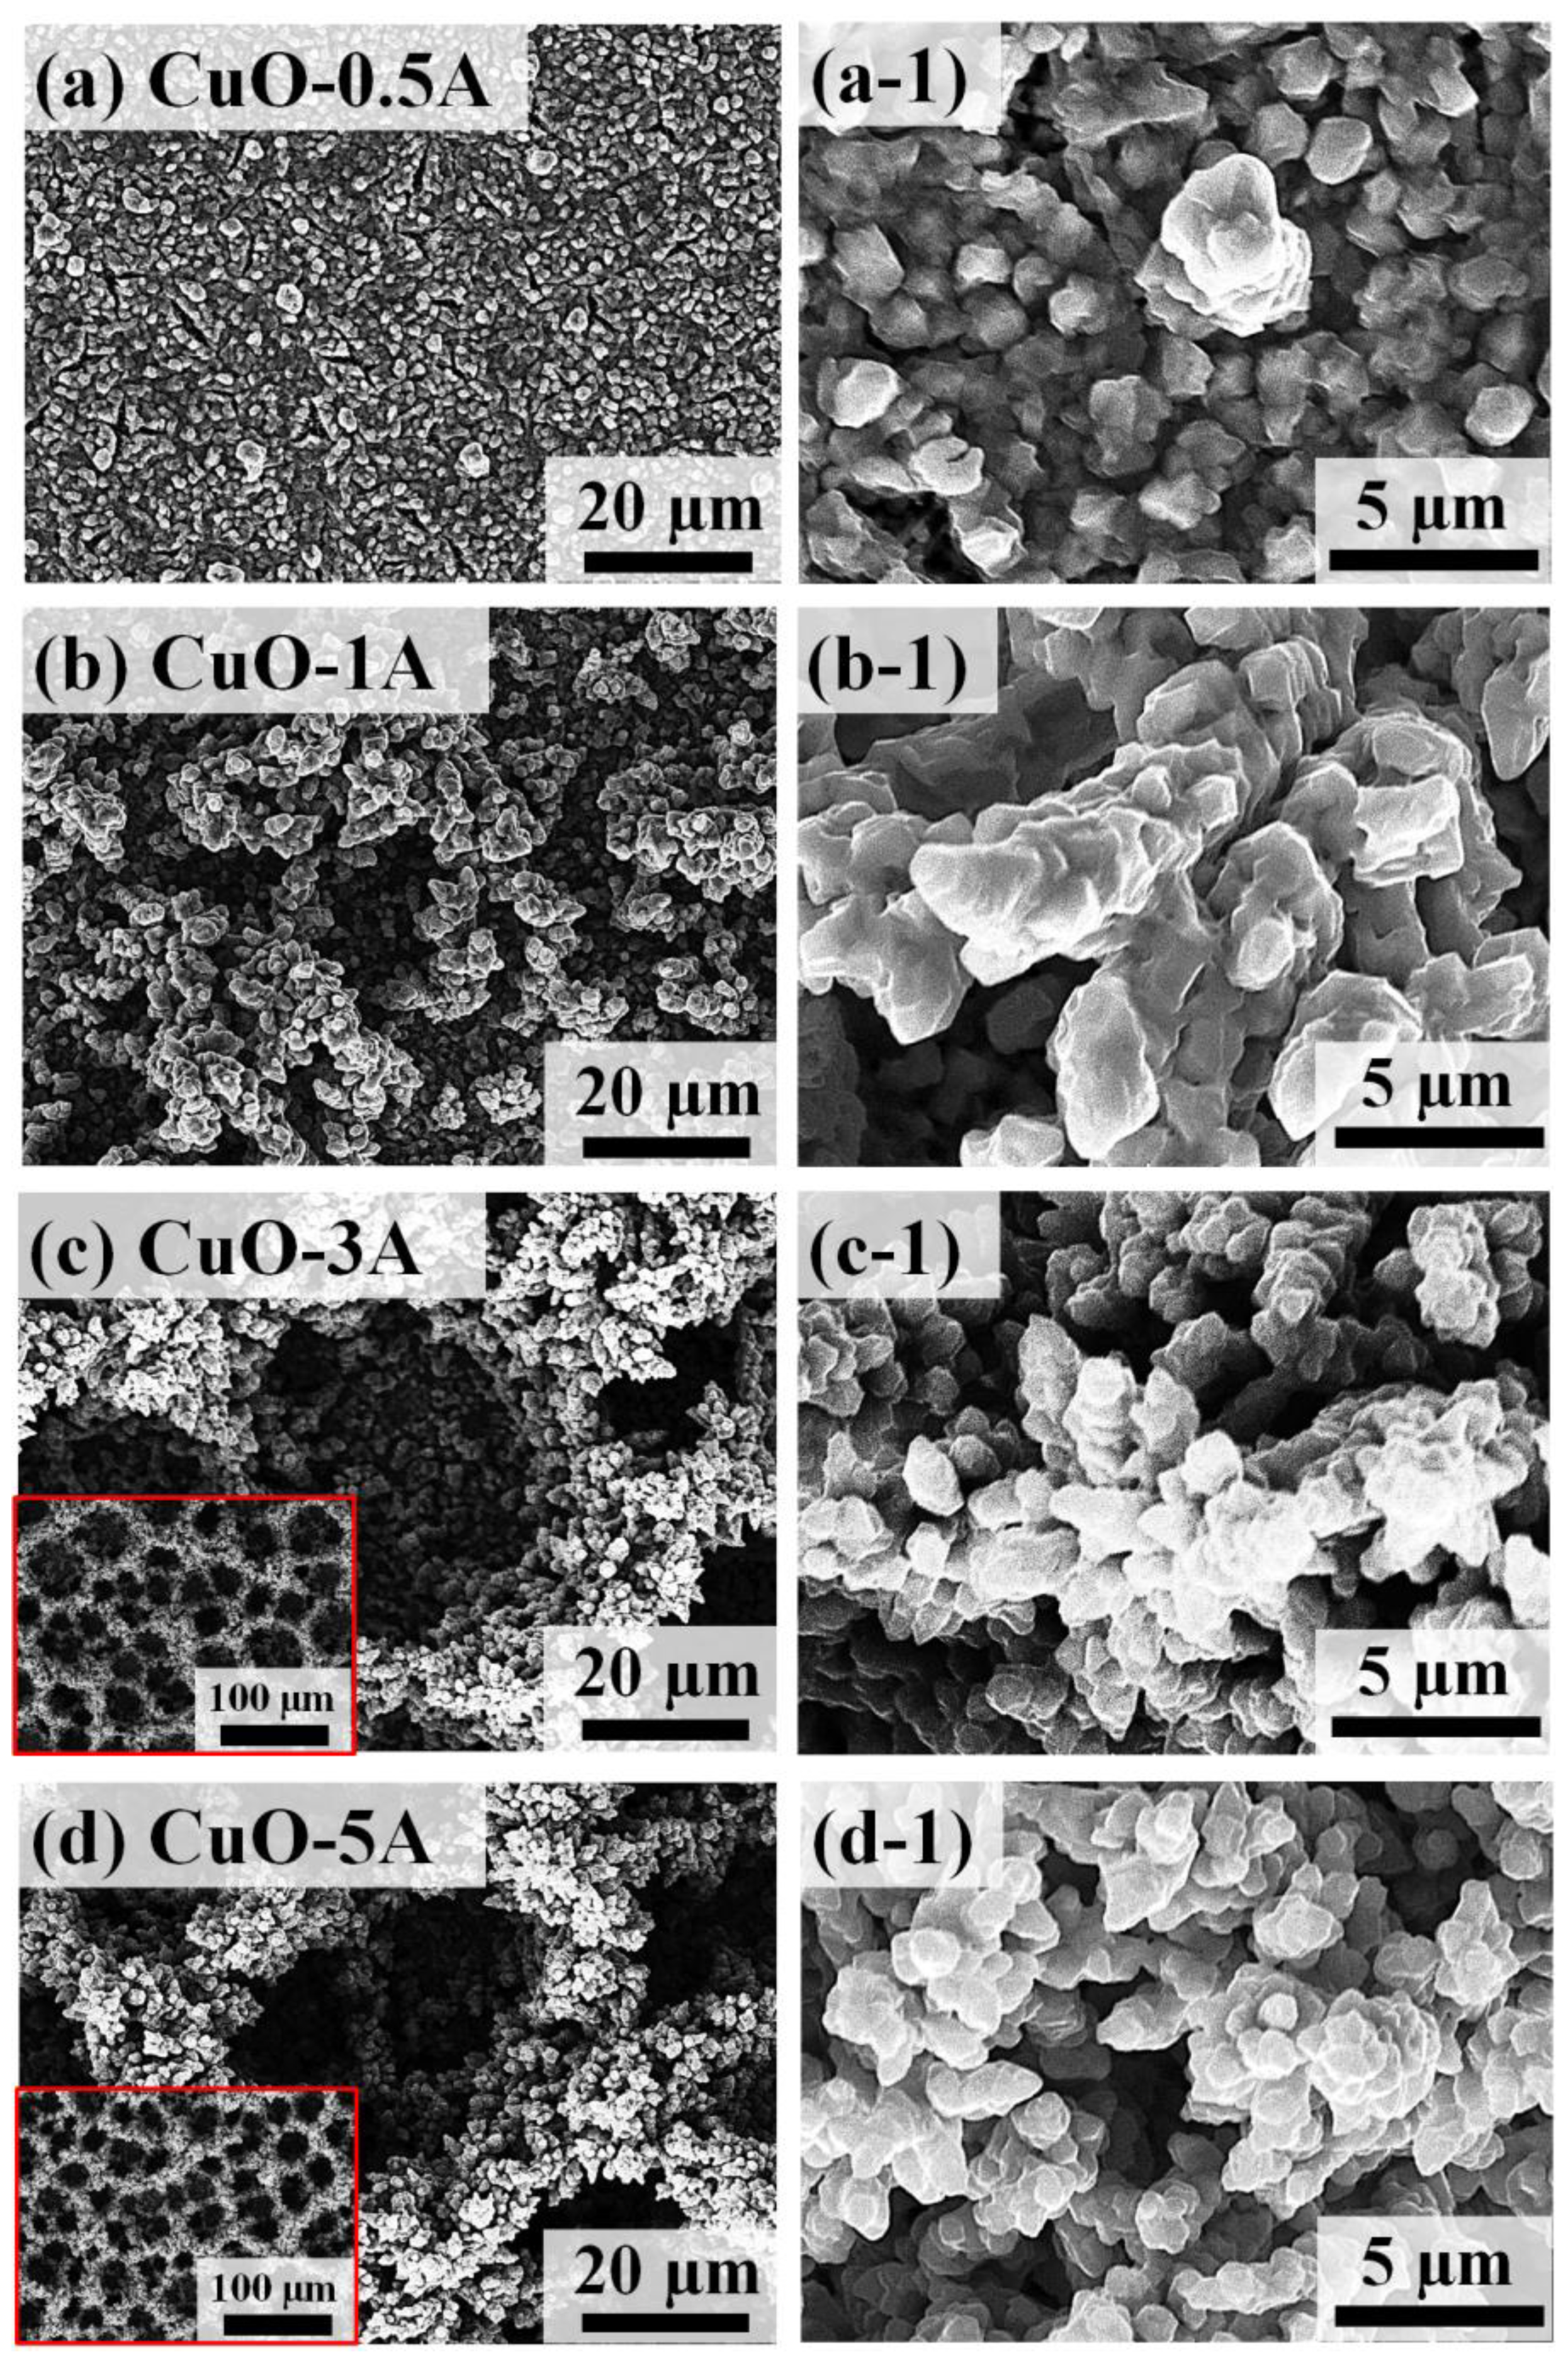
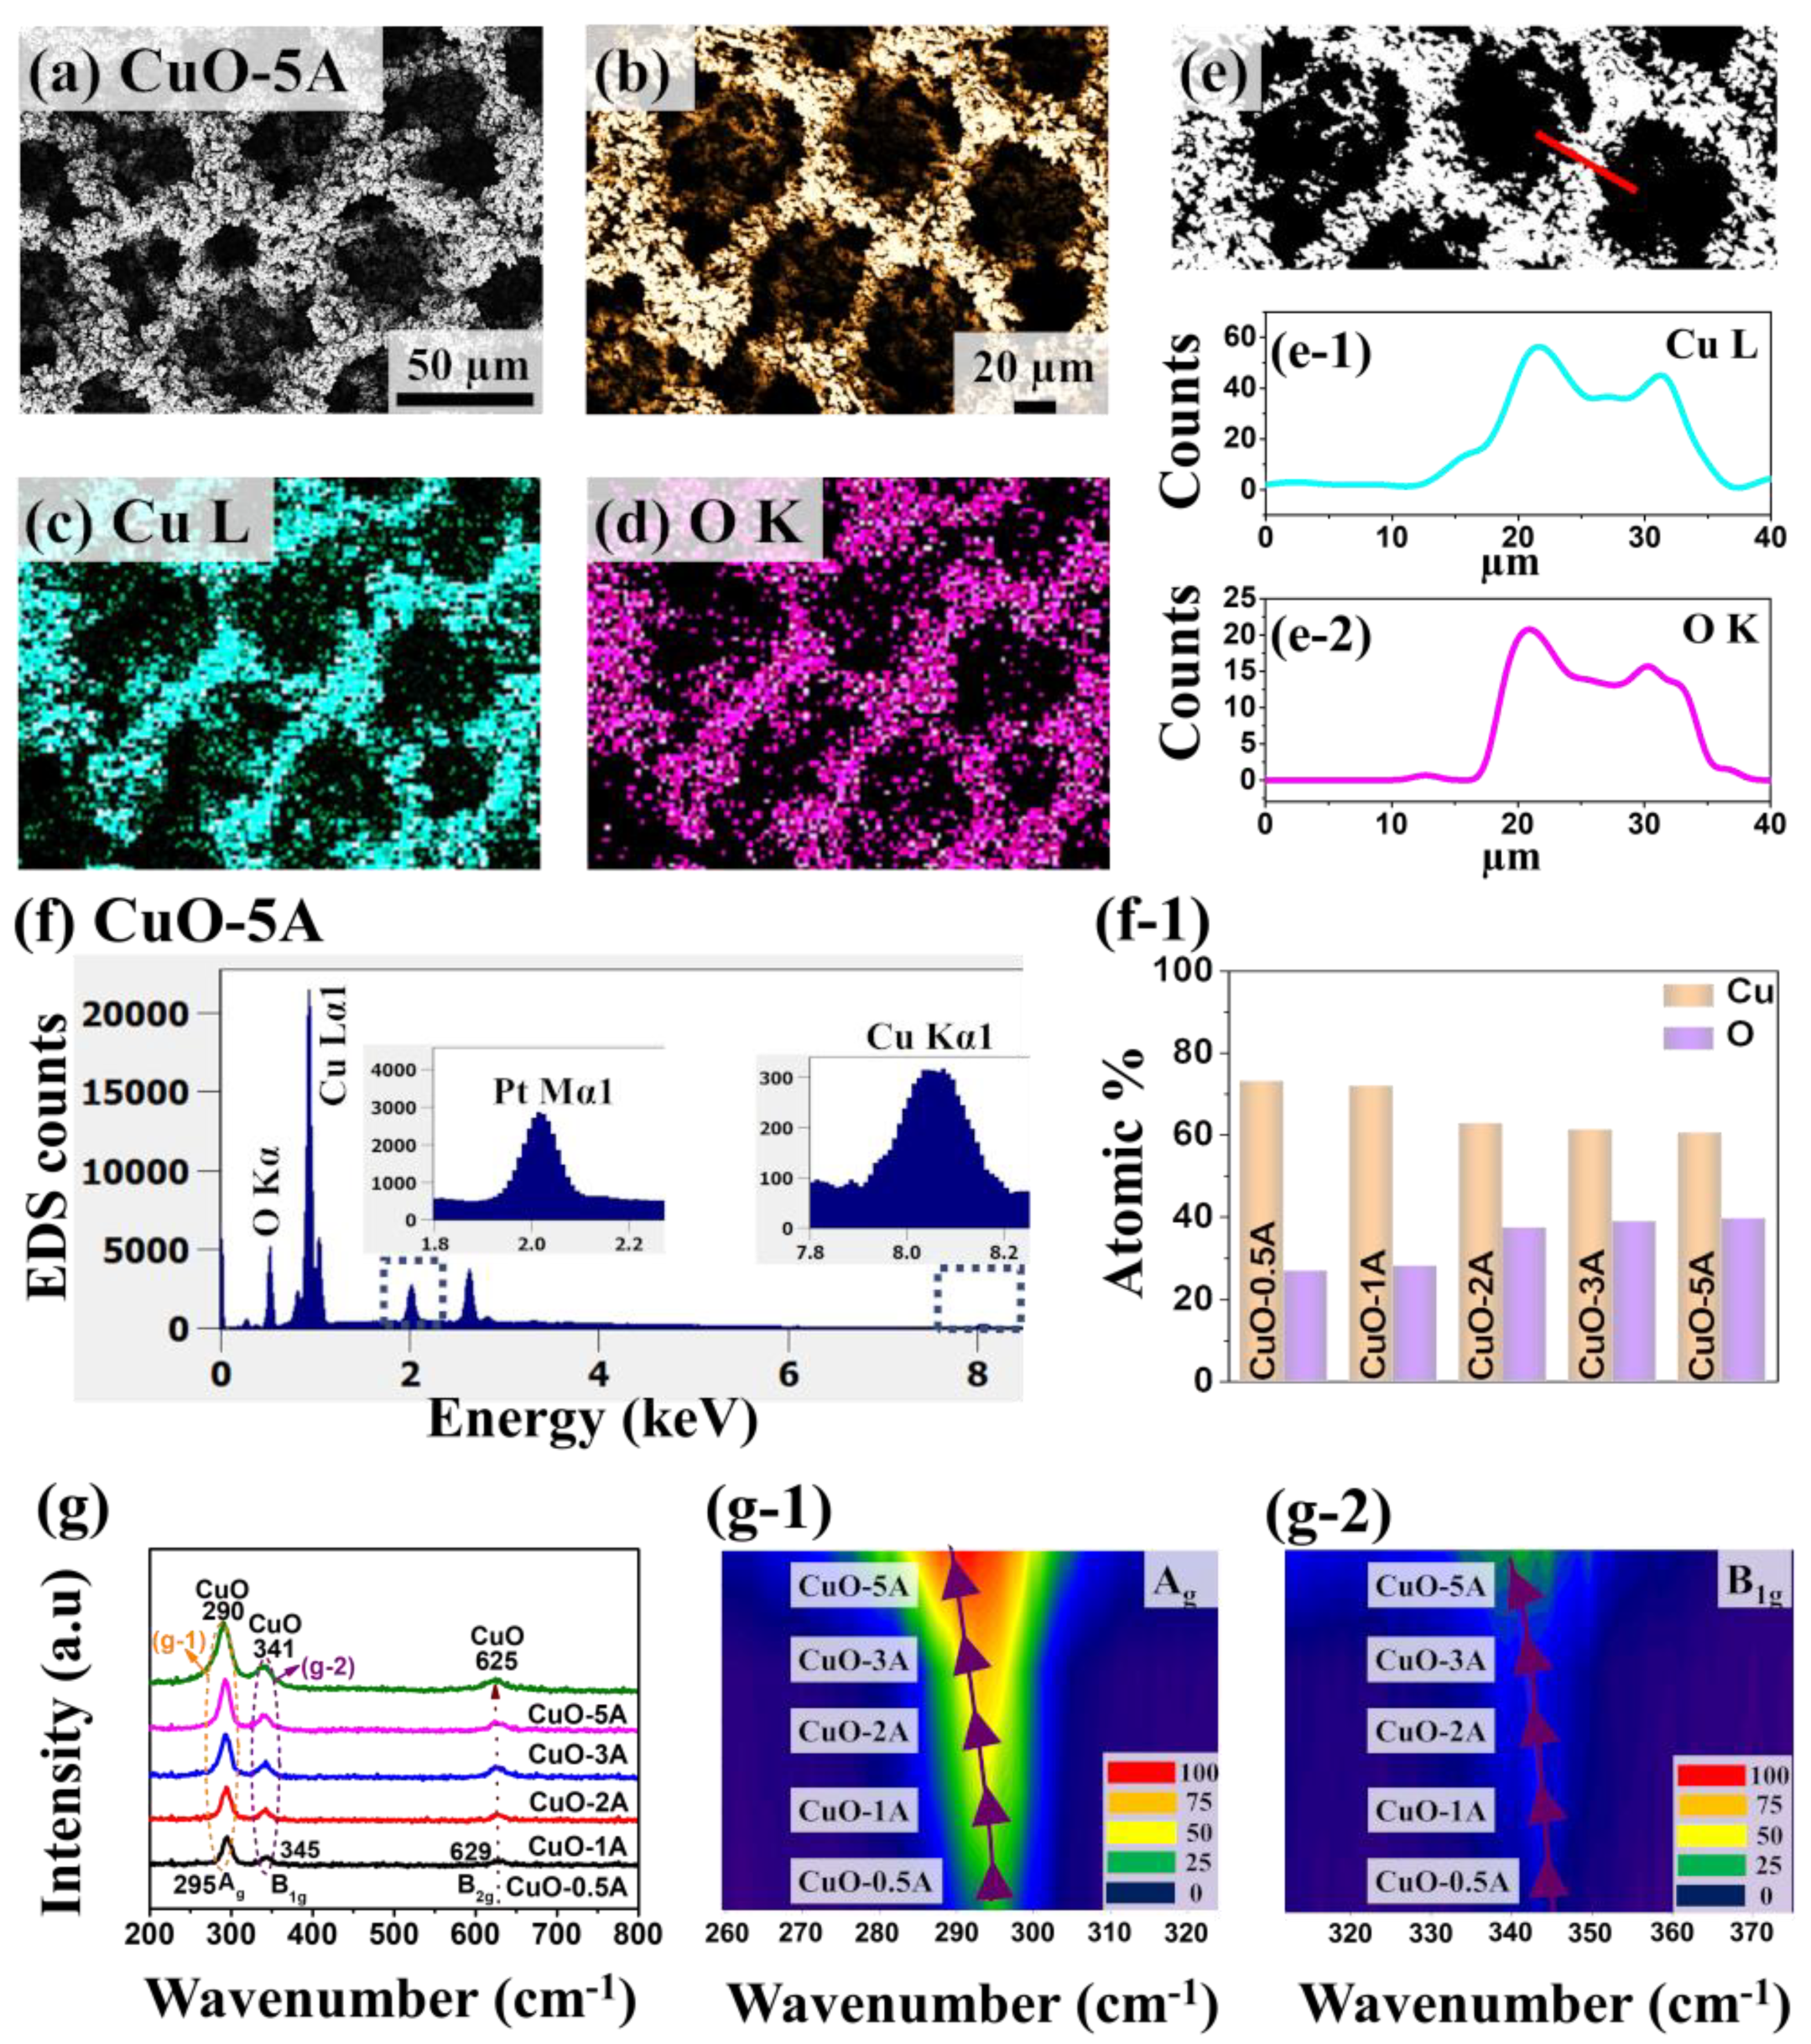
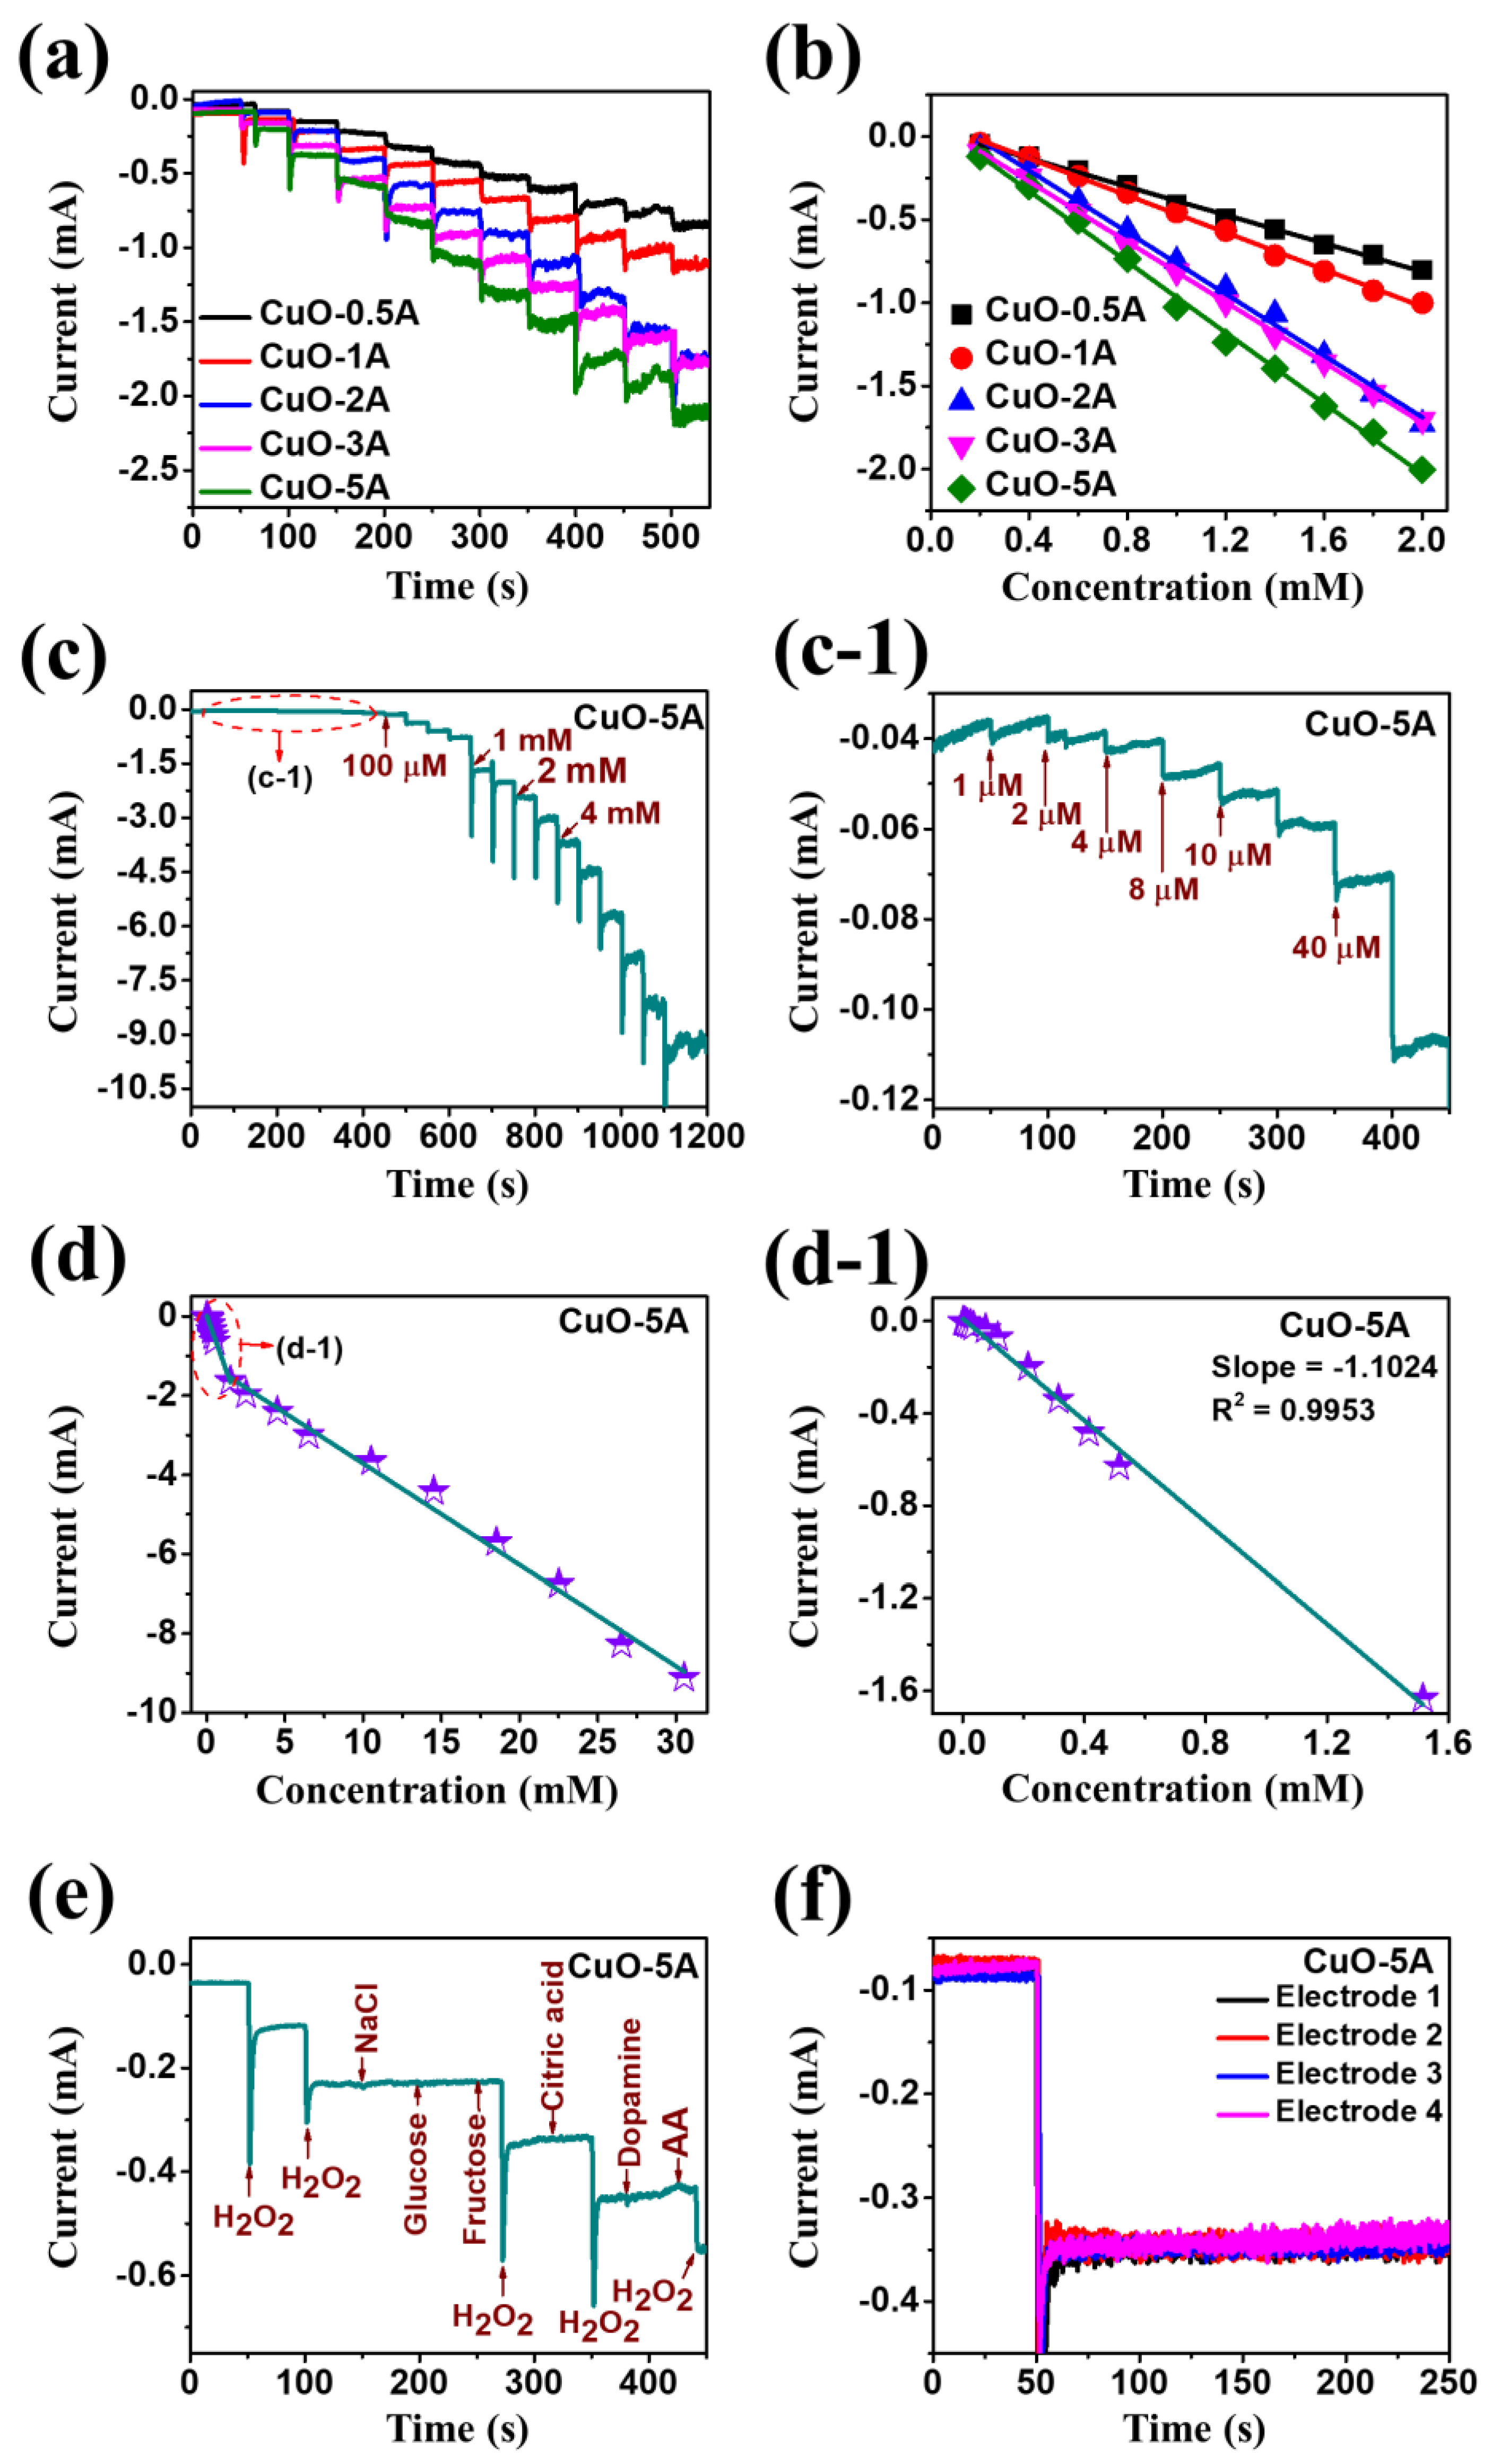
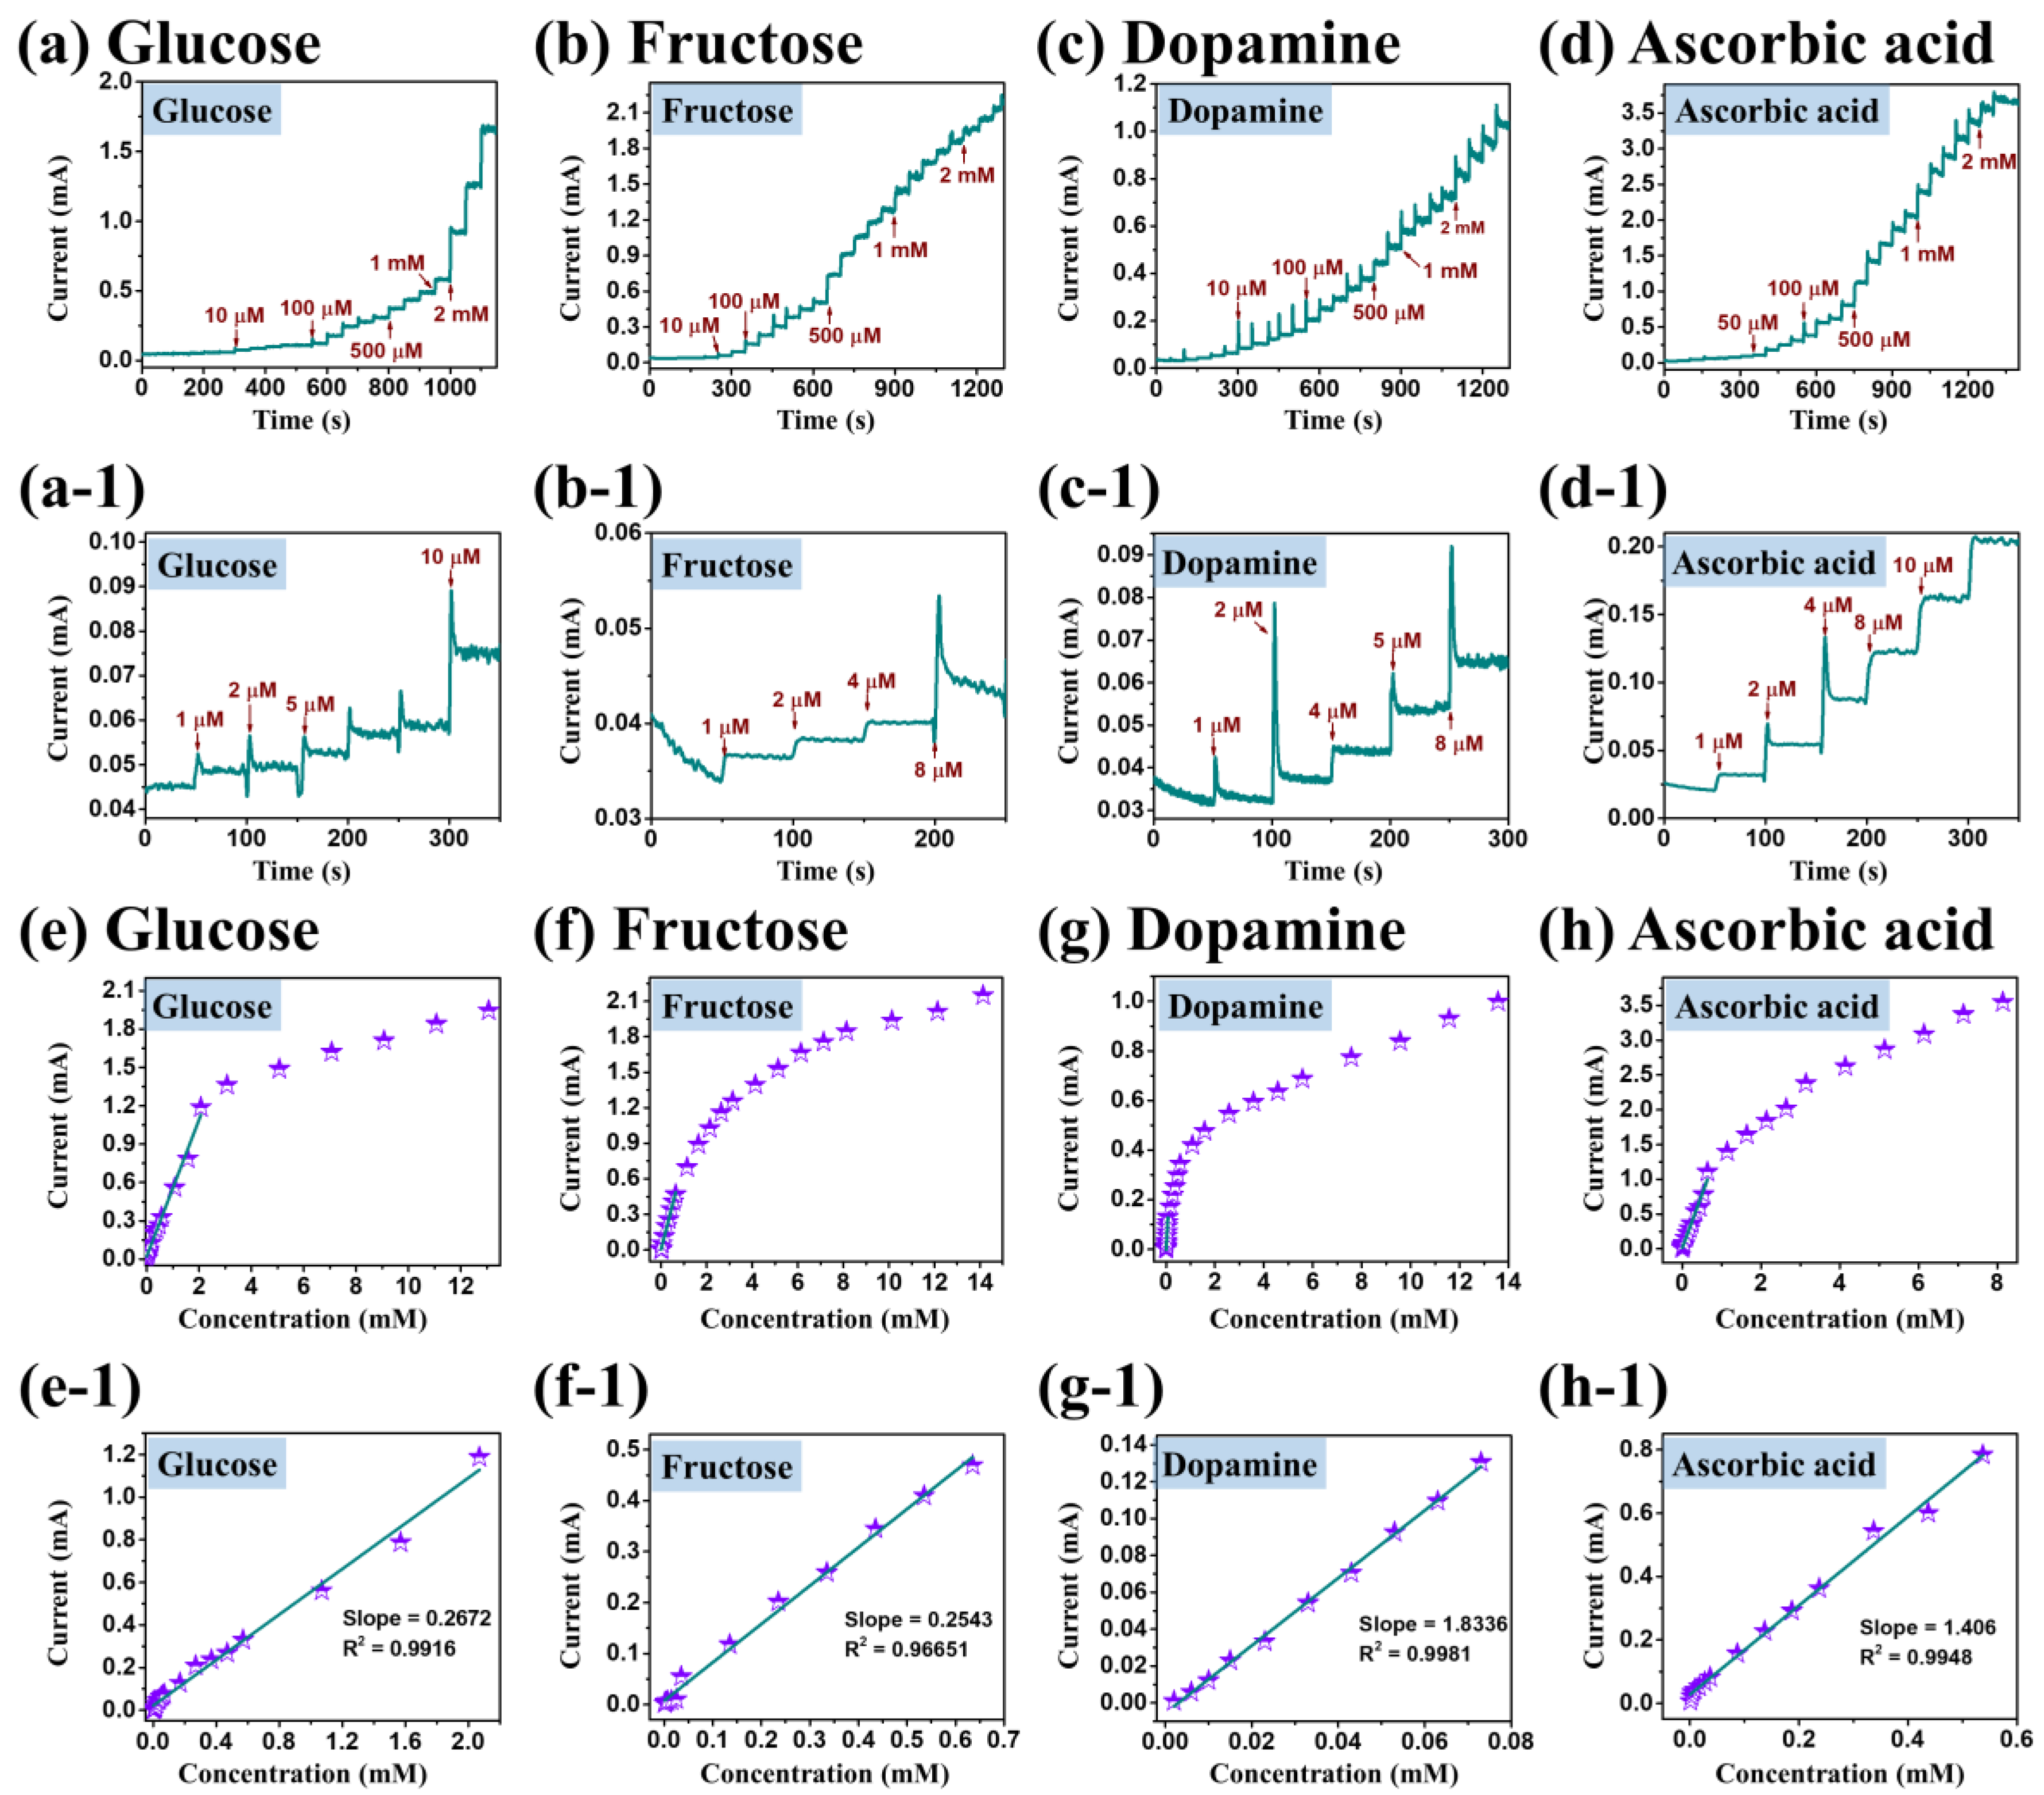
3. Results and Discussion
4. Conclusions
Supplementary Materials
Author Contributions
Funding
Conflicts of Interest
References
- Hsu, Y.-K.; Chen, Y.-C.; Lin, Y.-G. Spontaneous formation of CuO nanosheets on Cu foil for H2O2 detection. Appl. Surf. Sci. 2015, 354, 85–89. [Google Scholar] [CrossRef]
- Jia, W.; Guo, M.; Zheng, Z.; Yu, T.; Rodriguez, E.G.; Wang, Y.; Lei, Y. Electrocatalytic oxidation and reduction of H2O2 on vertically aligned Co3O4 nanowalls electrode: Toward H2O2 detection. J. Electroanal. Chem. 2009, 625, 27–32. [Google Scholar] [CrossRef]
- Masud, M.K.; Kim, J.; Billah, M.M.; Wood, K.; Shiddiky, M.J.A.; Nguyen, N.T.; Parsapur, R.K.; Kaneti, Y.V.; Alshehri, A.A.; Alghamidi, Y.G.; et al. Nanoarchitectured peroxidase-mimetic nanozymes: Mesoporous nanocrystalline α-or γ-iron oxide? J. Mater. Chem. B 2019, 7, 5412–5422. [Google Scholar] [CrossRef] [PubMed]
- Song, C.; Ding, W.; Zhao, W.; Liu, H.; Wang, J.; Yao, Y.; Yao, C. High peroxidase-like activity realized by facile synthesis of FeS2 nanoparticles for sensitive colorimetric detection of H2O2 and glutathione. Biosens. Bioelectron. 2020, 151, 111983. [Google Scholar] [CrossRef]
- Choi, Y.J.; Takahashi, K.; Misawa, N.; Hizawa, T.; Iwata, T.; Sawada, K. Multi-wavelength fluorescence detection of submicromolar concentrations using a filter-free fluorescence sensor. Sens. Actuators B Chem. 2018, 256, 38–47. [Google Scholar] [CrossRef]
- Nie, F.; Ga, L.; Ai, J.; Wang, Y. Trimetallic PdCuAu nanoparticles for temperature sensing and fluorescence detection of H2O2 and glucose. Front. Chem. 2020, 8, 244. [Google Scholar] [CrossRef] [PubMed]
- Babamiri, B.; Bahari, D.; Salimi, A. Highly sensitive bioaffinity electrochemiluminescence sensors: Recent advances and future directions. Biosens. Bioelectron. 2019, 142, 111530. [Google Scholar] [CrossRef]
- Tian, K.; Li, D.; Tang, T.; Nie, F.; Zhou, Y.; Du, J.; Zheng, J. A novel electrochemiluminescence resonance energy transfer system of luminol-graphene quantum dot composite and its application in H2O2 detection. Talanta 2018, 185, 446–452. [Google Scholar] [CrossRef]
- Yang, H.; Wang, Z.; Li, C.; Xu, C. Nanoporous PdCu alloy as an excellent electrochemical sensor for H2O2 and glucose detection. J. Colloid Interface Sci. 2017, 491, 321–328. [Google Scholar] [CrossRef]
- Wang, L.; Qi, H.; Chen, L.; Sun, Y.; Li, Z. Self-assembled Ag-Cu2O nanocomposite films at air-liquid interfaces for surface-enhanced raman scattering and electrochemical detection of H2O2. Nanomaterials 2018, 8, 332. [Google Scholar] [CrossRef]
- Lu, W.; Sun, Y.; Dai, H.; Ni, P.; Jiang, S.; Wang, Y.; Li, Z.; Li, Z. Direct growth of pod-like Cu2O nanowire arrays on copper foam: Highly sensitive and efficient nonenzymatic glucose and H2O2 biosensor. Sens. Actuators B Chem. 2016, 231, 860–866. [Google Scholar] [CrossRef]
- Zhao, J.; Yan, Y.; Zhu, L.; Li, X.; Li, G. An amperometric biosensor for the detection of hydrogen peroxide released from human breast cancer cells. Biosens. Bioelectron. 2013, 41, 815–819. [Google Scholar] [CrossRef] [PubMed]
- Xu, S.; Zhang, X.; Wan, T.; Zhang, C. A third-generation hydrogen peroxide biosensor based on horseradish peroxidase cross-linked to multi-wall carbon nanotubes. Microchim. Acta 2011, 172, 199–205. [Google Scholar] [CrossRef]
- Wilson, N.M.; Flaherty, D.W. Mechanism for the Direct Synthesis of H2O2 on Pd Clusters: Heterolytic Reaction Pathways at the Liquid-Solid Interface. J. Am. Chem. Soc. 2016, 138, 574–586. [Google Scholar] [CrossRef]
- Huang, X.; Zhu, Y.; Yang, W.; Jiang, A.; Jin, X.; Zhang, Y.; Yan, L.; Zhang, G.; Liu, Z. A self-supported CuO/Cu nanowire electrode as highly efficient sensor for COD measurement. Molecules 2019, 24, 3132. [Google Scholar] [CrossRef]
- Huang, Y.; Ferhan, A.R.; Dandapat, A.; Yoon, C.S.; Song, J.E.; Cho, E.C.; Kim, D.H. A strategy for the formation of gold-palladium supra-nanoparticles from gold nanoparticles of various shapes and their application to high-performance H2O2 sensing. J. Phys. Chem. C 2015, 119, 26164–26170. [Google Scholar] [CrossRef]
- Chen, S.; Yuan, R.; Chai, Y.; Hu, F. Electrochemical sensing of hydrogen peroxide using metal nanoparticles: A review. Microchim. Acta 2013, 180, 15–32. [Google Scholar] [CrossRef]
- Liu, W.B.; Chai, G.C.; Zhang, J.; Wang, M.G.; Dai, Y.X.; Yang, Q. Preparation of Cu2O nanocubes with different sizes and rough surfaces by a seed-mediated self-assembly process and their application as a non-enzymatic glucose sensor. New J. Chem. 2020, 44, 15662–15670. [Google Scholar] [CrossRef]
- Huang, J.; Zhu, Y.; Zhong, H.; Yang, X.; Li, C. Dispersed CuO nanoparticles on a silicon nanowire for improved performance of nonenzymatic H2O2 detection. ACS Appl. Mater. Interfaces 2014, 6, 7055–7062. [Google Scholar] [CrossRef]
- Wang, M.; Ma, J.; Guan, X.; Peng, W.; Fan, X.; Zhang, G.; Zhang, F.; Li, Y. A novel H2O2 electrochemical sensor based on NiCo2S4 functionalized reduced graphene oxide. J. Alloys Compd. 2019, 784, 827–833. [Google Scholar] [CrossRef]
- Ma, M.; Zhang, Y.; Gu, N. Peroxidase-like catalytic activity of cubic Pt nanocrystals. Colloids Surf. A Physicochem. Eng. Asp. 2011, 373, 6–10. [Google Scholar] [CrossRef]
- Li, Y.; Jia, W.Z.; Song, Y.Y.; Xia, X.H. Superhydrophobicity of 3D porous copper films prepared using the hydrogen bubble dynamic template. Chem. Mater. 2007, 19, 5758–5764. [Google Scholar] [CrossRef]
- Choudhary, S.; Sarma, J.V.N.; Pande, S.; Ababou-Girard, S.; Turban, P.; Lepine, B.; Gangopadhyay, S. Oxidation mechanism of thin Cu films: A gateway towards the formation of single oxide phase. AIP Adv. 2018, 8. [Google Scholar] [CrossRef]
- Sahoo, R.K.; Das, A.; Samantaray, K.; Singh, S.K.; Mane, R.S.; Shin, H.C.; Yun, J.M.; Kim, K.H. Electrochemical glucose sensing characteristics of two-dimensional faceted and non-faceted CuO nanoribbons. Cryst. Eng. Comm. 2019, 21, 1607–1616. [Google Scholar] [CrossRef]
- Deng, Y.; Handoko, A.D.; Du, Y.; Xi, S.; Yeo, B.S. In situ raman spectroscopy of copper and copper oxide surfaces during electrochemical oxygen evolution reaction: Identification of CuIII oxides as catalytically active species. ACS Catal. 2016, 6, 2473–2481. [Google Scholar] [CrossRef]
- Walid, A.; Hocine, G.; Beniaiche, A. Effect of deposition time on the properties of zinc oxide thin films produced via electrochemical method. Appl. Surf. Sci. 2016, 01001, 1–6. [Google Scholar]
- Xu, J.F.; Ji, W.; Shen, Z.X.; Li, W.S.; Tang, S.H.; Ye, X.R.; Jia, D.Z.; Xin, X.Q. Raman spectra of CuO nanocrystals. J. Raman Spectrosc. 1999, 30, 413–415. [Google Scholar] [CrossRef]
- Yu, T.; Zhao, X.; Shen, Z.X.; Wu, Y.H.; Su, W.H. Investigation of individual CuO nanorods by polarized micro-Raman scattering. J. Cryst. Growth 2004, 268, 590–595. [Google Scholar] [CrossRef]
- Ni, Y.; Sun, Z.; Zeng, Z.; Liu, F.; Qin, J. Hydrothermal fabrication of hierarchical CuO nanoflowers for dual-function amperometric sensing of hydrogen peroxide and glucose. New J. Chem. 2019, 43, 18629–18636. [Google Scholar] [CrossRef]
- Chen, L.; Wang, Y.; Hasebe, Y.; Yang, X.; Zhang, D.; Zhang, Z.; Hu, Z. Copper(II) ion-doped polyimide composite for nonenzymatic electrochemical hydrogen peroxide sensing. Int. J. Electrochem. Sci. 2019, 14, 4891–4902. [Google Scholar] [CrossRef]
- Wang, Q.; Yang, Y.; Gao, F.; Ni, J.; Zhang, Y.; Lin, Z. Graphene oxide directed one-step synthesis of flowerlike graphene@HKUST-1 for enzyme-free detection of hydrogen peroxide in biological samples. ACS Appl. Mater. Interfaces 2016, 8, 32477–32487. [Google Scholar] [CrossRef] [PubMed]
- Zhang, W.; Fan, G.; Yi, H.; Jia, G.; Li, Z.; Yuan, C.; Bai, Y.; Fu, D. Interfacial engineering of hierarchical transition metal oxide heterostructures for highly sensitive sensing of hydrogen peroxide. Small 2018, 14, 1703713. [Google Scholar] [CrossRef] [PubMed]
- Chen, H.; Fan, G.; Zhao, J.; Qiu, M.; Sun, P. A portable micro glucose sensor based on copper based nanocomposite structure. New J. Chem. 2019, 43, 7806. [Google Scholar] [CrossRef]
- Bai, Z.; Dong, W.; Ren, Y.; Zhang, C.; Chen, Q. Preparation of nano Au and Pt alloy microspheres decorated with reduced graphene oxide for nonenzymatic hydrogen peroxide sensing. Langmuir 2018, 34, 2235–2244. [Google Scholar] [CrossRef]
- Huang, Z.; Zhang, A.; Zhang, Q.; Pan, S.; Cui, D. Electrochemical biosensor based on dewdrop-like platinum nanoparticles-decorated silver nanoflowers nanocomposites for H2O2 and glucose detection. J. Electrochem. Soc. 2019, 166, B1138–B1145. [Google Scholar] [CrossRef]
- Lange, G.A.; Eugénio, S.; Duarte, R.G.; Silva, T.M.; Carmezim, M.J.; Montemor, M.F. Characterisation and electrochemical behaviour of electrodeposited Cu-Fe foams applied as pseudocapacitor electrodes. J. Electroanal. Chem. 2015, 737, 85–92. [Google Scholar] [CrossRef]
- Tran, T.H.; Nguyen, V.T. Phase transition of Cu2O to CuO nanocrystals by selective laser heating. Mater. Sci. Semicond. Process. 2016, 46, 6–9. [Google Scholar] [CrossRef]
- Fang, J.; Xuan, Y. Investigation of optical absorption and photothermal conversion characteristics of binary CuO/ZnO nanofluids. RSC Adv. 2017, 7, 56023–56033. [Google Scholar] [CrossRef]
- Luo, B.; Li, X.; Yang, J.; Li, X.; Xue, L.; Li, X.; Gu, J.; Wang, M.; Jiang, L. Non-enzymatic electrochemical sensors for the detection of hydrogen peroxide based on Cu2O/Cu nanocomposites. Anal. Methods 2014, 6, 1114–1120. [Google Scholar] [CrossRef]
- Chakraborty, P.; Dhar, S.; Debnath, K.; Mondal, S.P. Glucose and hydrogen peroxide dual-mode electrochemical sensing using hydrothermally grown CuO nanorods. J. Electroanal. Chem. 2019, 833, 213–220. [Google Scholar] [CrossRef]
- Chirizzi, D.; Guascito, M.R.; Filippo, E.; Malitesta, C.; Tepore, A. A novel nonenzymatic amperometric hydrogen peroxide sensor based on CuO@Cu2O nanowires embedded into poly(vinyl alcohol). Talanta 2016, 147, 124–131. [Google Scholar] [CrossRef]
- Zhao, C.; Wu, X.; Li, P.; Zhao, C.; Qian, X. Hydrothermal deposition of CuO/rGO/Cu2O nanocomposite on copper foil for sensitive nonenzymatic voltammetric determination of glucose and hydrogen peroxide. Microchim. Acta 2017, 184, 2341–2348. [Google Scholar] [CrossRef]
- Daemi, S.; Ghasemi, S.; Akbar Ashkarran, A. Electrospun CuO-ZnO nanohybrid: Tuning the nanostructure for improved amperometric detection of hydrogen peroxide as a non-enzymatic sensor. J. Colloid Interface Sci. 2019, 550, 180–189. [Google Scholar] [CrossRef]
- Long, L.; Liu, X.; Chen, L.; Li, D.; Jia, J. A hollow CuOx/NiOy nanocomposite for amperometric and non-enzymatic sensing of glucose and hydrogen peroxide. Microchim. Acta 2019, 186, 5–10. [Google Scholar] [CrossRef] [PubMed]
- Yuan, R.; Li, H.; Yin, X.; Zhang, L.; Lu, J. Stable controlled growth of 3D CuO/Cu nanoflowers by surfactant-free method for non-enzymatic hydrogen peroxide detection. J. Mater. Sci. Technol. 2018, 34, 1692–1698. [Google Scholar] [CrossRef]
- Gowthaman, N.S.K.; Arul, P.; Lim, H.N.; John, S.A. Negative potential-induced growth of surfactant-free CuO nanostructures on an Al-C substrate: A dual in-line sensor for biomarkers of diabetes and oxidative stress. ACS Sustain. Chem. Eng. 2020, 8, 2640–2651. [Google Scholar] [CrossRef]
- Zhou, X.; Xu, L.; Lv, J.; Yang, S.; Zhu, S.; Chen, X.; Sun, X.; Dong, B.; Bai, X.; Lu, G.; et al. Au anchored three-dimensional macroporous NiO@CuO inverse opals for in-situ sensing of hydrogen peroxide secretion from living cells. Sens. Actuators B Chem. 2019, 297, 126729. [Google Scholar] [CrossRef]
- Yang, Y.J.; Li, W.; Chen, X. Highly enhanced electrocatalytic oxidation of glucose on Cu(OH)2/CuO nanotube arrays modified copper electrode. J. Solid State Electrochem. 2012, 16, 2877–2881. [Google Scholar] [CrossRef]


| Electrode Material | Limit of Detection | Linear Range | Electrolyte Solution | Sensitivity [µA mM−1 cm−2] | Reference |
|---|---|---|---|---|---|
| CuO-5A | 140 nM | 1 µm–1.5 mM | 0.1 M PBS | 2205 | Present Work |
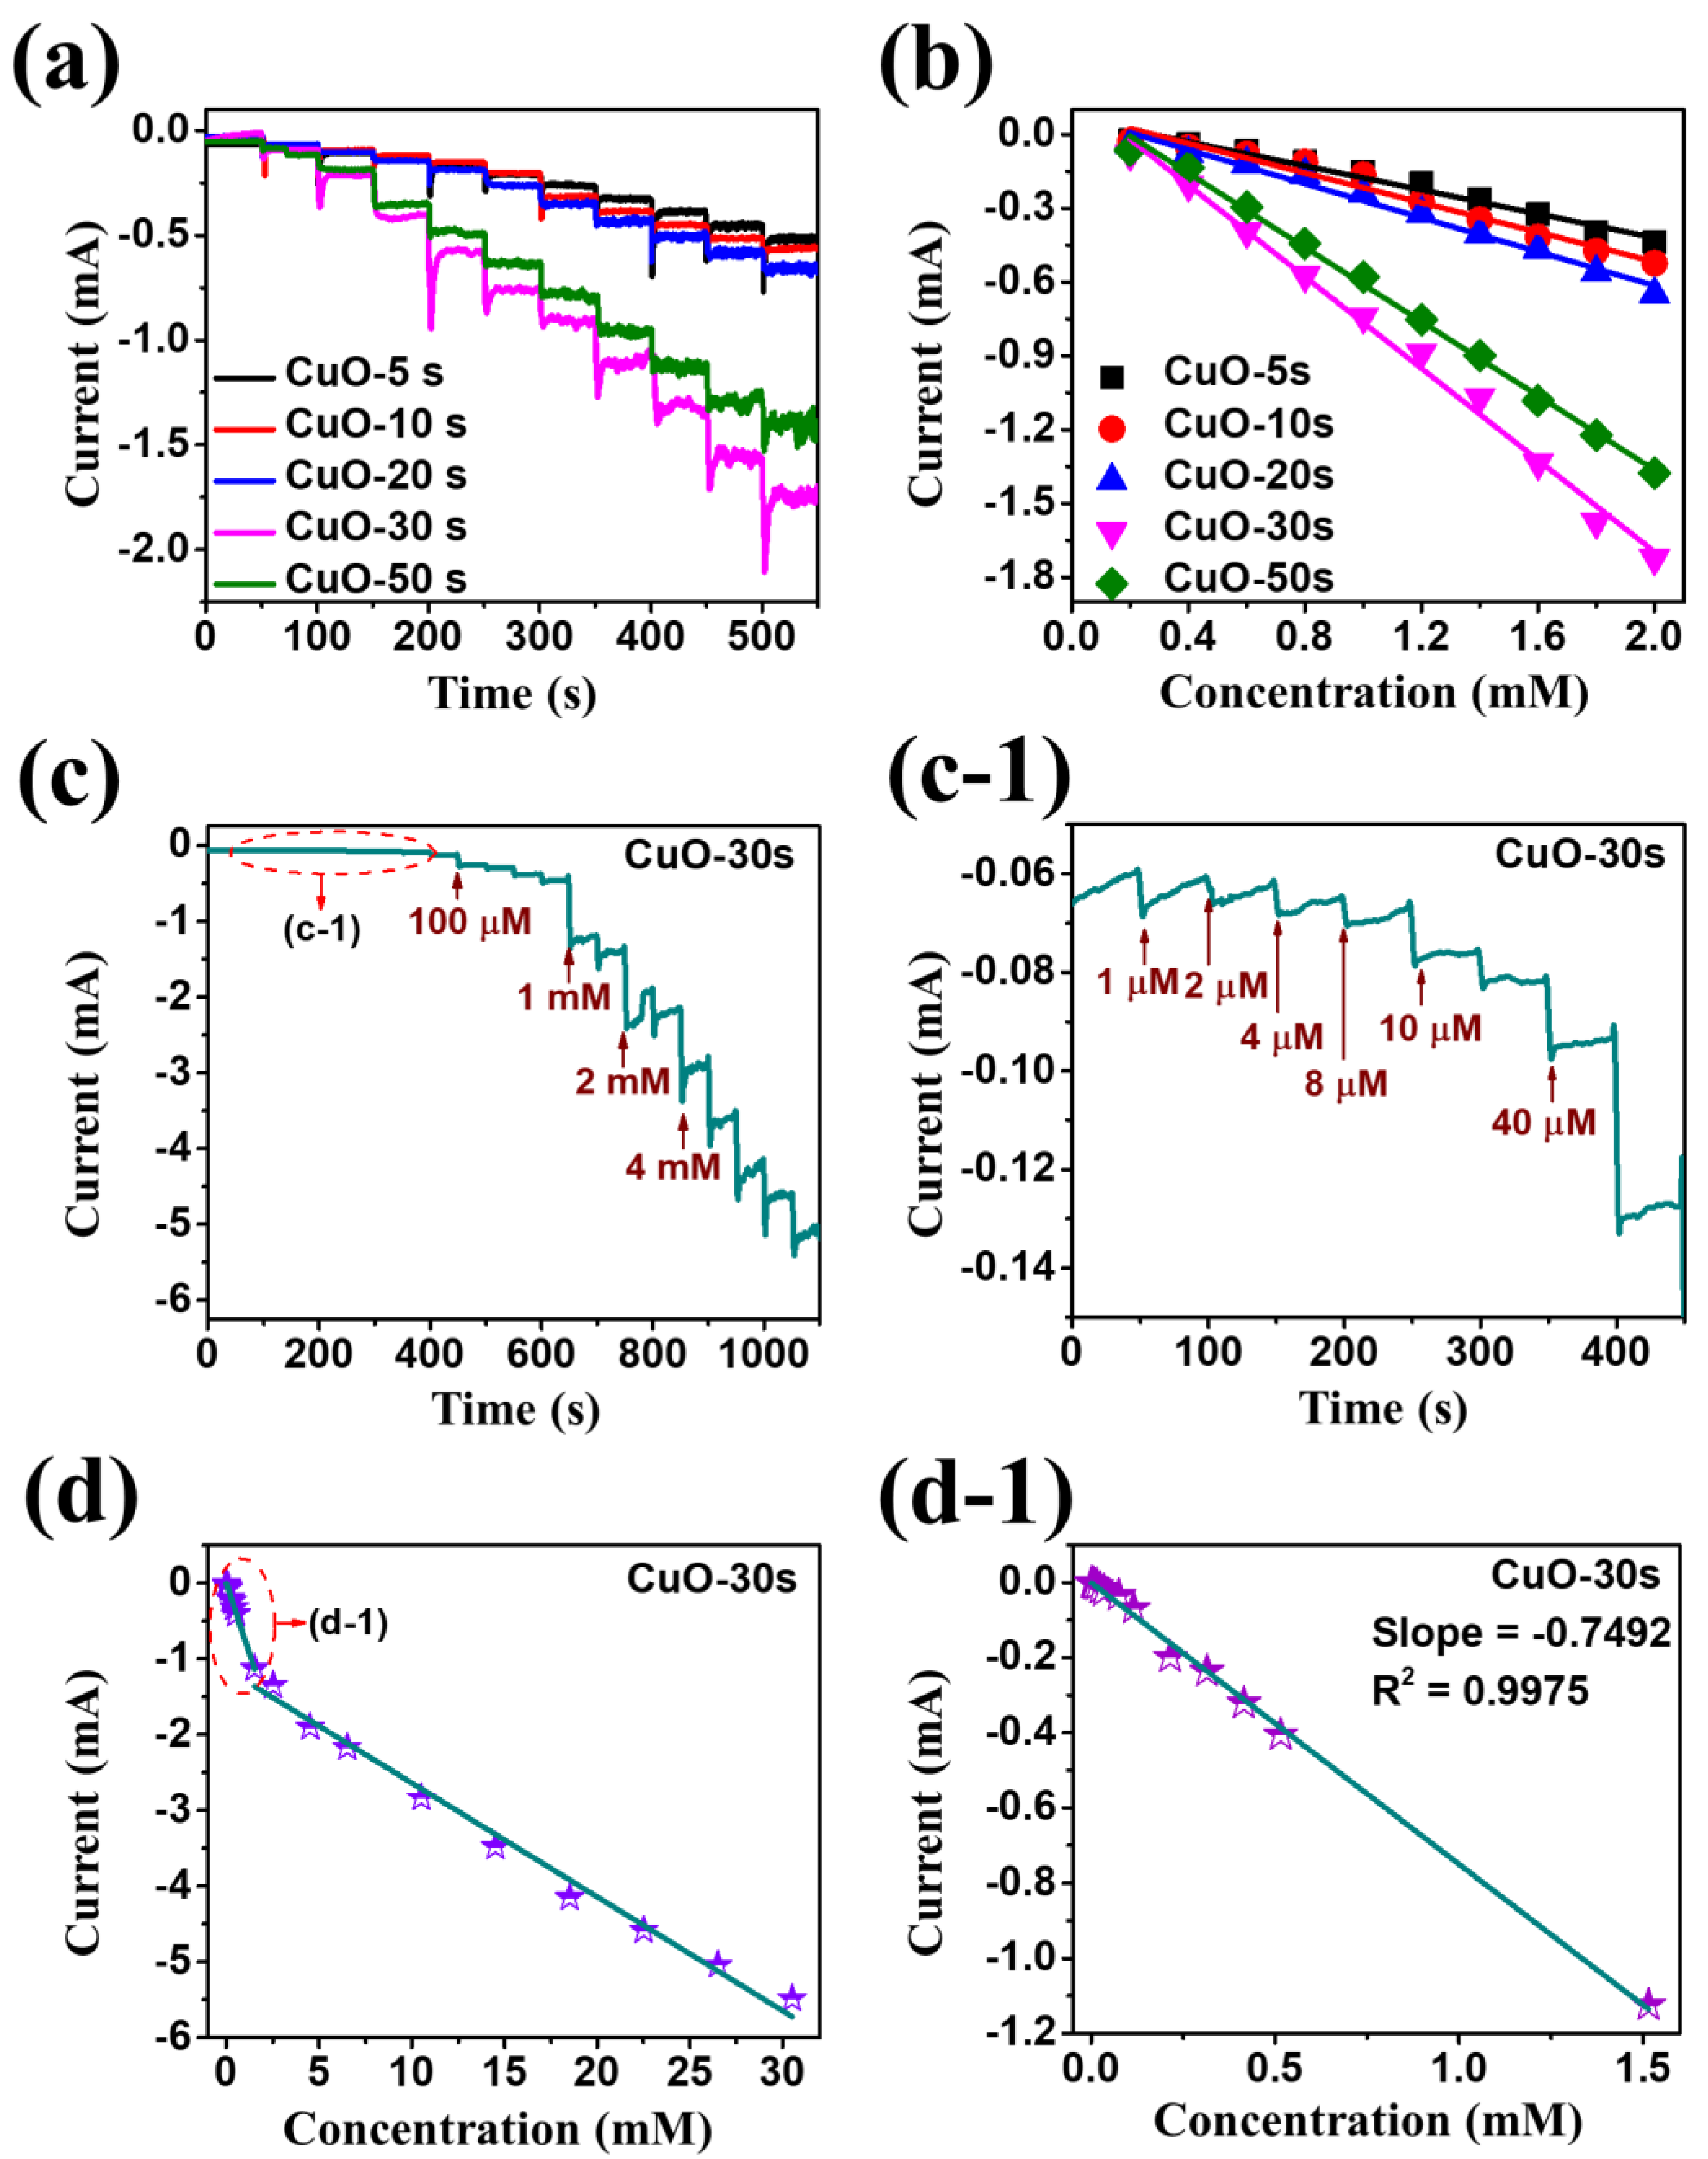
| CuO-30 s | 325 nM | 1 µm–1.5 mM | 0.1 M PBS | 1498 | |
| NP-PdCu | 1.9 µM | 0.1–30 mM | PBS + 1 mM H2O2 | 1.6 | [9] |
| Cu2O PLNWs/Cu foam | 1.05 µM | 5–1770 µM | 0.1 M NaOH | 1.4773 | [11] |
| CuO-NP | 1.6 µM | 0.01–13.18 mM | 0.1 M PBS | 22.27 | [19] |
| CuO nanorods | - | 0.25–18.75 mM | 0.1 M NaOH | 84.89 | [40] |
| CuO nanosheet | 10 µM | 10–20,000 µM | 1 M NaOH | 25.5 | [18] |
| CuO@Cu2O-NWs/PVA/GC | 0.35 µM | 1 µM–3 mM | 0.1 M NaOH | 39.5 | [41] |
| CuO/rGO/Cu2O | 0.05 µM | 0.5 µM–9.7 mM | 0.1 M NaOH | 366.2 | [42] |
| ZnO3-CuO7/CPE | 2.4 µM | 0.003–0.53 mM | 0.1 M KCl | 1.11 | [43] |
| CuOx/NiOy | 90 nM | 0.03 µM–9.0 mM | 0.10 M NaOH | 271.1 | [44] |
| 3D CuO/Cu | 2 µM | 2 µM–19.4 mM | 0.1 M NaOH | 103 | [45] |
| CuO nanostructures | 43 nM | 250 nm–2 mM | 0.1 M PB | 2015.7 | [46] |
| 3 DOI Au/NiO@CuO | 3.7 nM | 20 nM–20 µM | 0.1 M PBS | 650.2 | [47] |
Publisher’s Note: MDPI stays neutral with regard to jurisdictional claims in published maps and institutional affiliations. |
© 2020 by the authors. Licensee MDPI, Basel, Switzerland. This article is an open access article distributed under the terms and conditions of the Creative Commons Attribution (CC BY) license (http://creativecommons.org/licenses/by/4.0/).
Share and Cite
Kulkarni, R.; Kunwar, S.; Mandavkar, R.; Jeong, J.-H.; Lee, J. Hydrogen Peroxide Detection by Super-Porous Hybrid CuO/Pt NP Platform: Improved Sensitivity and Selectivity. Nanomaterials 2020, 10, 2034. https://doi.org/10.3390/nano10102034
Kulkarni R, Kunwar S, Mandavkar R, Jeong J-H, Lee J. Hydrogen Peroxide Detection by Super-Porous Hybrid CuO/Pt NP Platform: Improved Sensitivity and Selectivity. Nanomaterials. 2020; 10(10):2034. https://doi.org/10.3390/nano10102034
Chicago/Turabian StyleKulkarni, Rakesh, Sundar Kunwar, Rutuja Mandavkar, Jae-Hun Jeong, and Jihoon Lee. 2020. "Hydrogen Peroxide Detection by Super-Porous Hybrid CuO/Pt NP Platform: Improved Sensitivity and Selectivity" Nanomaterials 10, no. 10: 2034. https://doi.org/10.3390/nano10102034
APA StyleKulkarni, R., Kunwar, S., Mandavkar, R., Jeong, J.-H., & Lee, J. (2020). Hydrogen Peroxide Detection by Super-Porous Hybrid CuO/Pt NP Platform: Improved Sensitivity and Selectivity. Nanomaterials, 10(10), 2034. https://doi.org/10.3390/nano10102034