Article

A Crossover Study on VR and Traditional Instruction in Engineering Education

by
Petru-Iulian Grigore
1,*,
Corneliu Octavian Turcu
1,
Andrei Zaharia
2 and
Valentin Nedeff
2
1
Faculty of Electrical Engineering and Computer Science, “Ștefan cel Mare” University of Suceava, 720229 Suceava, Romania
2
Faculty of Engineering, “Vasile Alecsandri” University of Bacău, 600115 Bacău, Romania
*
Author to whom correspondence should be addressed.
Information 2026, 17(4), 382; https://doi.org/10.3390/info17040382
Submission received: 22 January 2026 / Revised: 8 April 2026 / Accepted: 16 April 2026 / Published: 18 April 2026
(This article belongs to the Section Information Applications)

Abstract

Virtual reality (VR) is increasingly used as an interactive instructional medium in engineering education, yet evidence on practical implementation and student-reported experience remains limited. This study examined students’ perceived experience and usability across VR and traditional instruction within a crossover design in a UV-C water disinfection lesson. Using a mixed 2 × 2 crossover design, 52 undergraduate engineering students completed both a VR lesson (Meta Quest 3; Unreal Engine 5.4) and a content-aligned traditional session delivered with slides and a physical UV disinfection stand. After each session, participants reported perceived flow (short Flow Index) and engagement (adapted User Engagement Scale); the System Usability Scale (SUS) was completed after the VR session only. A brief knowledge quiz and open-ended feedback were also collected and used descriptively. Students reported higher perceived flow and engagement in the VR condition than in the traditional condition, and VR usability was generally rated acceptable-to-excellent, with higher SUS scores observed in the VR-first sequence than in the traditional-first sequence. Qualitative feedback emphasized clarity and interactivity, and most participants expressed a preference for a blended approach. Overall, the results support the practical feasibility and positive user acceptance of the VR lesson in this instructional context. The findings also suggest that perceived usability may be associated with instructional sequence, although this pattern should be interpreted cautiously within the perception-based scope of the study.

1. Introduction

Virtual Reality (VR) technology is frequently described in the literature as a platform with substantial potential to enhance educational practice by enabling immersive, interactive, and context-rich learning environments across multiple disciplines [1,2]. Some authors situate these VR-based educational applications within the broader notion of V-Learning [3], framing it as an emerging design space rather than an established instructional paradigm.

1.1. Virtual Reality in Engineering Education

Virtual reality is increasingly discussed in engineering and science education as a flexible instructional format that can extend access to experiences that are difficult to reproduce in conventional teaching settings. Across the literature, one of the most frequently cited advantages concerns the possibility of simulating environments or procedures that would otherwise be hazardous, geographically inaccessible, or prohibitively expensive to stage physically. Reported examples include construction-related emergency scenarios, military or surgical procedures, remote geological sites, radiation-affected environments, and even extraterrestrial surface structures [1,4,5,6,7,8]. In this sense, VR is commonly presented as offering learners a perceived sense of safety, exploratory freedom, and controlled exposure to technically demanding situations.
A second recurring theme is the perceived efficiency of VR and Virtual Laboratory (VL) environments as instructional resources. Compared with traditional laboratory arrangements, these systems are often described as more flexible in relation to time, location, and physical infrastructure, which may be especially relevant when access to campus facilities is limited or when instructional continuity must be maintained under constrained conditions [1,7,9]. This practical dimension has contributed to the positioning of VR not only as a technological innovation but also as a potentially feasible option for supporting implementation in contexts where equipment, space, or scheduling constraints affect laboratory-based teaching.
The literature also frequently emphasizes VR’s capacity to support the visualization of complex, abstract, or spatially demanding content. Immersive and interactive representations have been used to present topics such as crystal lattice structures, thermodynamic processes, molecular configurations, fluid-related phenomena, and engineering graphics tasks that rely on three-dimensional reasoning [10,11,12,13,14,15]. These applications are typically discussed in terms of perceived conceptual accessibility, with participants reporting that stereoscopic and manipulable environments make difficult content easier to inspect and interpret.
Another consistent pattern concerns engagement and motivational value. Many studies report that students describe VR activities as enjoyable, immersive, and attention-sustaining, with participants often expressing greater satisfaction and willingness to engage actively during instruction [6,16,17,18]. Similar claims appear in studies that frame VR as supportive of student-centered and exploratory learning, where learners can interact with virtual objects, procedures, or environments in ways that are less easily achieved through conventional explanation alone [19,20]. Related work also associates VR with perceived improvements in comprehension, memorability, experiential practice, confidence, and, in some cases, empathy or teamwork-related awareness, particularly when learners are immersed in applied or human-centered scenarios [2,17,19,20,21,22,23].
Within engineering education more specifically, VR and VL environments are increasingly positioned as responses to contemporary curricular and technological demands, including the need for digital competence, flexible access to technical training, and alignment with Industry 4.0 and Industry 5.0 agendas [7,24,25]. Applications have been reported across civil and construction engineering, manufacturing and production, electrical and electronics engineering, and engineering graphics and design, where VR is used for process visualization, safety training, operational preparation, equipment familiarization, system simulation, and iterative design exploration [2,5,7,8,17,19,26,27,28,29,30,31]. Taken together, this body of work suggests that VR is widely perceived as a promising and adaptable instructional medium in engineering contexts.

1.2. Limitations of the Existing Literature and Unresolved Issues

Although VR is often discussed positively in engineering education, its value in practice still depends on whether specific instructional implementations can be delivered smoothly, accepted by students, and experienced as usable and engaging in realistic classroom settings [5,32]. In many cases, this implementation-level evidence remains limited, especially for topic-specific lessons designed around applied engineering processes. For this reason, the present study does not attempt to test instructional superiority, but instead examines the practical feasibility and student-reported experience of a VR lesson relative to a content-aligned traditional session.
One recurrent issue concerns the limited maturity and uneven availability of VR content across engineering domains. Several studies note that specialized VR applications and Virtual Laboratories (VLs) are still relatively scarce, while existing hardware–software ecosystems often remain at an early stage of development [5,16,33]. This affects not only the stability and scalability of VR implementations but also their transferability across institutions and disciplines. In practice, the educational promise of VR often depends on whether suitable content has been developed for a particular topic, which remains a significant constraint in many engineering contexts.
A related challenge involves cost, infrastructure, and technical usability. VR implementation is often described as resource-intensive, requiring dedicated equipment, sustained financial support, and technical conditions that are not always available in routine educational settings [1,8,16]. High-fidelity simulations may also require levels of hardware performance that many students do not possess, which forces educators to balance realism, accessibility, and system responsiveness [7]. In addition, studies report usability-related problems such as difficult operation, slow response, or insufficient alignment with the kinds of manipulation expected in engineering tasks [30]. Similar concerns extend to newer networked or metaverse-oriented environments, where technical refinement is still needed before such systems can be regarded as robust instructional solutions [34].
The literature also remains limited at the level of pedagogy and evaluation. Many studies are exploratory, based on small-scale implementations, and lack longer-term follow-up, which makes it difficult to determine how stable perceived benefits may be over time [20]. Some authors explicitly call for research that examines longer-term perceived retention or conceptual continuity, including follow-up periods of several months [17]. At the same time, methodological heterogeneity remains substantial: studies vary widely in design, measures, comparison conditions, and outcome framing, which limits cumulative interpretation and points to the absence of broadly shared standards for evaluating VR-based learning activities [17].
Another unresolved issue is whether highly engaging virtual experiences may substitute too easily for forms of practice that depend on direct physical interaction. In areas such as Industrial Design and related hands-on domains, some authors caution that VR may not fully reproduce material awareness, tactile feedback, or manual dexterity developed through physical tasks [30,35]. These concerns do not argue against the use of VR, but they do reinforce the need to distinguish between perceived engagement and demonstrated practical competence when interpreting results from immersive learning environments.
Finally, implementation challenges are not limited to students or technology alone, as faculty readiness also remains an important gap. Existing work highlights the limited availability of structured training for instructors in both the pedagogical and technical use of VR tools [32]. There is also still limited evidence on how differences in digital fluency, professional background, or generational experience may shape faculty perceptions of VR’s relevance and usability in engineering education [32]. Taken together, these unresolved issues suggest that the current literature supports a cautious interpretation of VR as a promising but still unevenly implemented educational approach.

1.3. Rationale, Context, and Aim of the Present Study

The literature reviewed above establishes that VR is increasingly regarded as a promising instructional medium in engineering education, yet its practical implementation in specific lesson contexts and how students actually experience it when it is introduced remains unevenly documented. Existing work tends to report perceived benefits at the level of user experience, but the conditions under which VR can be implemented acceptably, and how students respond to it in matched instructional settings, have received comparatively less systematic attention [7,17,32]. Such a focus is particularly relevant in engineering topics that involve process-based reasoning, spatial interpretation, and the visualization of system dynamics, where immersive environments may offer practical advantages while still requiring careful evaluation [11,31].
The present study addresses this need in the context of undergraduate engineering instruction on ultraviolet (UV) water disinfection, a topic that combines technical process understanding with applied environmental engineering content. This lesson context was selected because it is conceptually suited to visual and interactive representation, while also reflecting the type of specialized instructional material for which VR may offer added practical value [11,36]. At the same time, rather than treating VR as a validated substitute for traditional teaching, the study approaches its use as an exploratory implementation whose educational relevance should first be understood through feasibility and student-reported experience.
In this study, feasibility is defined narrowly as the practical implementation and acceptability of the instructional protocol in the present context. More specifically, feasibility refers to whether the VR-supported lesson and crossover procedure could be administered smoothly in the classroom setting, whether participants were able to complete the activities and instruments as intended, and whether the overall protocol was tolerable and acceptable for students. By contrast, instrument reliability and patterns of missing data are treated as methodological support for interpreting the study, not as a separate form of feasibility.
Accordingly, the study is positioned as a feasibility- and perception-focused investigation using a two-period mixed 2 × 2 crossover design, with instructional sequence treated as a between-subject factor and condition as a within-subject factor. This design allows each participant to experience both instructional formats and supports an exploratory comparison of how the VR lesson is received relative to a conventional session. Within this framework, the study documents patterns of perceived flow, engagement, usability, and user acceptance in a matched instructional context [17,20]. The crossover structure also makes it possible to examine whether order of exposure is associated with differences in reported experience.
The main contribution of this study, therefore, lies in characterizing the practical implementation and perceived educational experience of a VR lesson integrated into an engineering course. More specifically, the study examines students’ self-reported flow and engagement across VR and traditional conditions (VR-first vs. Trad-first), evaluates the perceived usability and acceptability of the VR system, explores how pre-existing technology-related dispositions relate to reported experience, and analyses qualitative feedback concerning perceived strengths, difficulties, and preferred future uses of VR. In this sense, the study provides preliminary evidence about the feasibility and user-perceived value of VR in this instructional setting and offers a foundation for future research across broader implementation contexts and more differentiated evaluation designs [17,31,32].

Research Questions

To operationalize this feasibility- and perception-focused investigation, the study addressed the following research questions:
  • RQ1. How do perceived flow and engagement differ between the VR and Traditional conditions, both in between-condition comparisons and within-subject contrasts in this crossover setting?
  • RQ2. How is the VR system’s perceived usability distributed, and to what extent is perceived usability associated with instructional sequence (VR-first vs. Trad-first)?
  • RQ3. What descriptive performance patterns emerge on the short knowledge test across sequence groups and instructional conditions, and how can these patterns be used as contextual information?
  • RQ4. How are pre-existing dispositions (attitudes toward emerging technologies, technology accommodation, VR interest, pre-test knowledge) associated with perceived experience measures in the VR and Traditional conditions?
  • RQ5. What themes emerge from students’ open-ended feedback regarding perceived strengths, comparative advantages, difficulties, and preferred future use of VR in relation to traditional instruction?

2. Related Work

Conceptual Framing for Perceived Experience and User Acceptance

Research on VR, Virtual Laboratories (VLs), and other forms of technology-enhanced learning often draws on established frameworks to interpret how learners perceive, accept, and engage with digital instructional environments. In the present study, these frameworks provide a conceptual basis for interpreting self-reported usability, engagement, and user experience in this classroom context.
The first relevant perspective concerns the relationship between learner characteristics, instructional environments, and reported outcomes. The Inputs–Environment–Outcome (IEO) model has been used to examine how prior experience, academic background, and contextual features interact with students’ responses to learning environments [28]. In studies involving immersive or simulation-based learning, this approach is useful because students do not encounter VR as neutral users; they bring pre-existing attitudes, varying familiarity with digital tools, and different levels of confidence into the instructional setting. For this reason, the present study also considers technology-related dispositions and prior knowledge as contextual factors that may be associated with reported experience across conditions.
The second relevant line of work comes from technology-acceptance research, particularly the Technology Acceptance Model (TAM), which is widely used to examine how learners evaluate the usefulness and usability of educational technologies [28,37]. In VR- and VL-based settings, TAM-related constructs such as perceived usefulness and perceived ease of use have often been adapted to instructional contexts, where they help explain whether students regard a system as understandable, manageable, and relevant to their learning activities [28]. This perspective is directly relevant to the present study because user acceptance of a VR lesson depends not only on the novelty of the medium, but also on whether students perceive the system as usable and educationally worthwhile.
Some studies further extend interpretation through frameworks such as engineering role identity, particularly when the educational goal is to understand how virtual environments may support students’ sense of participation in engineering practice [28]. Likewise, broader acceptance-oriented models such as UTAUT2 have been used in evaluations of gamified and interactive educational systems, where constructs including performance expectancy, effort expectancy, self-efficacy, and hedonic motivation help explain intention to use and reported acceptance [38].

3. Experimental Design

The study employed a two-period mixed 2 × 2 crossover design with one between-subject factor, Sequence (VR-first vs. Traditional-first), and one within-subject factor, Condition (VR vs. traditional instruction). This structure was adopted because crossover designs reduce inter-individual variability by allowing each participant to serve as their own control, thereby supporting more balanced condition comparisons while also permitting exploratory examination of order-of-exposure patterns [39]. Each participant therefore completed both instructional conditions across two successive periods.
Students were allocated to the two sequences using simple randomization based on a computer-generated assignment list, without stratification by prior academic performance or demographic characteristics. The allocation list was prepared before the first instructional session, and participants were assigned to sequence after enrollment was completed, giving each participant an equal a priori probability of entering either sequence. Sequence allocation was finalized before Period 1 and retained unchanged across both periods.

3.1. Participants

Fifty-two undergraduate students enrolled in an environmental engineering program participated in the study. Participation was voluntary, and all enrolled participants completed both instructional sessions. The sample was distributed evenly across sequence groups: 26 students were assigned to the VR-first sequence and 26 to the Traditional-first sequence (Table 1).
The age profile was relatively homogeneous. Most participants (43 of 52) reported being between 20 and 24 years old, while a smaller subset reported older ages, a pattern that may occur in engineering programs because of delayed progression or re-entry into study.

3.2. Materials and Instructional Content

3.2.1. VR Lesson

The VR lesson was developed in Unreal Engine 5.4 and deployed on Meta Quest 3 headsets with controller-based interaction. Headsets were used in wireless mode over a Wi-Fi 6 network to enable untethered movement; streaming performance was sufficient to avoid noticeable lag during the sessions. The lesson was divided into three parts that followed one another to ensure that all core concepts and procedures were presented systematically to all students.
Part 1: An introduction to the theory. Students were in a virtual classroom where a guided drone gave them AI-generated narration. There were animated diagrams and 3D models that showed how UV-C radiation works, how the system works, and how the sensors work.
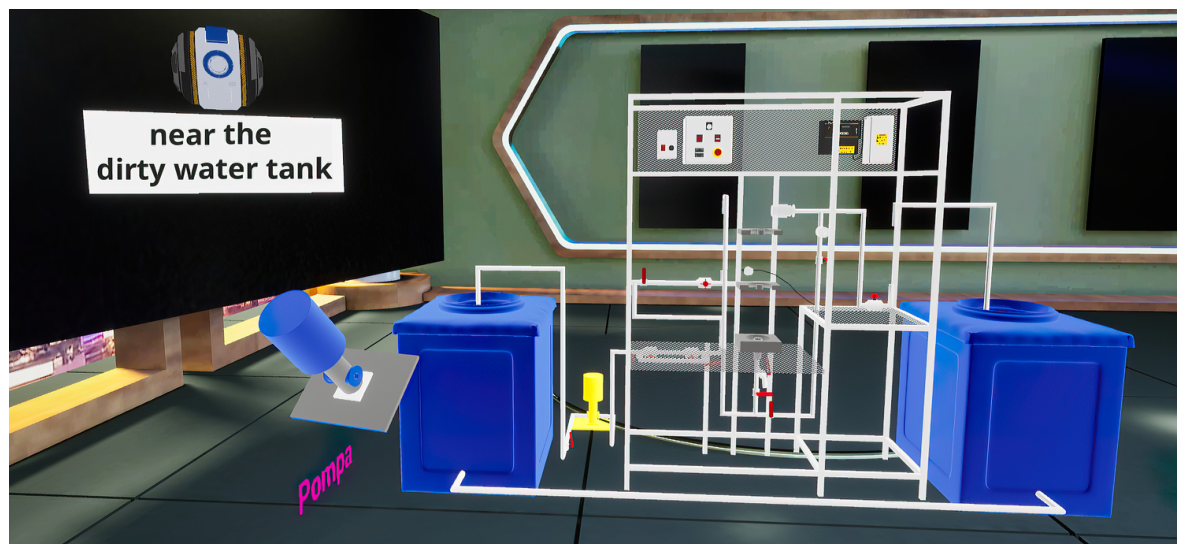
Part 2: Putting it together in real life (Figure 1). Students used VR controllers to put together the disinfection system (for example, the UV lamp, UV chamber, pump, and sensors) in a simulated lab, following audio and video instructions.
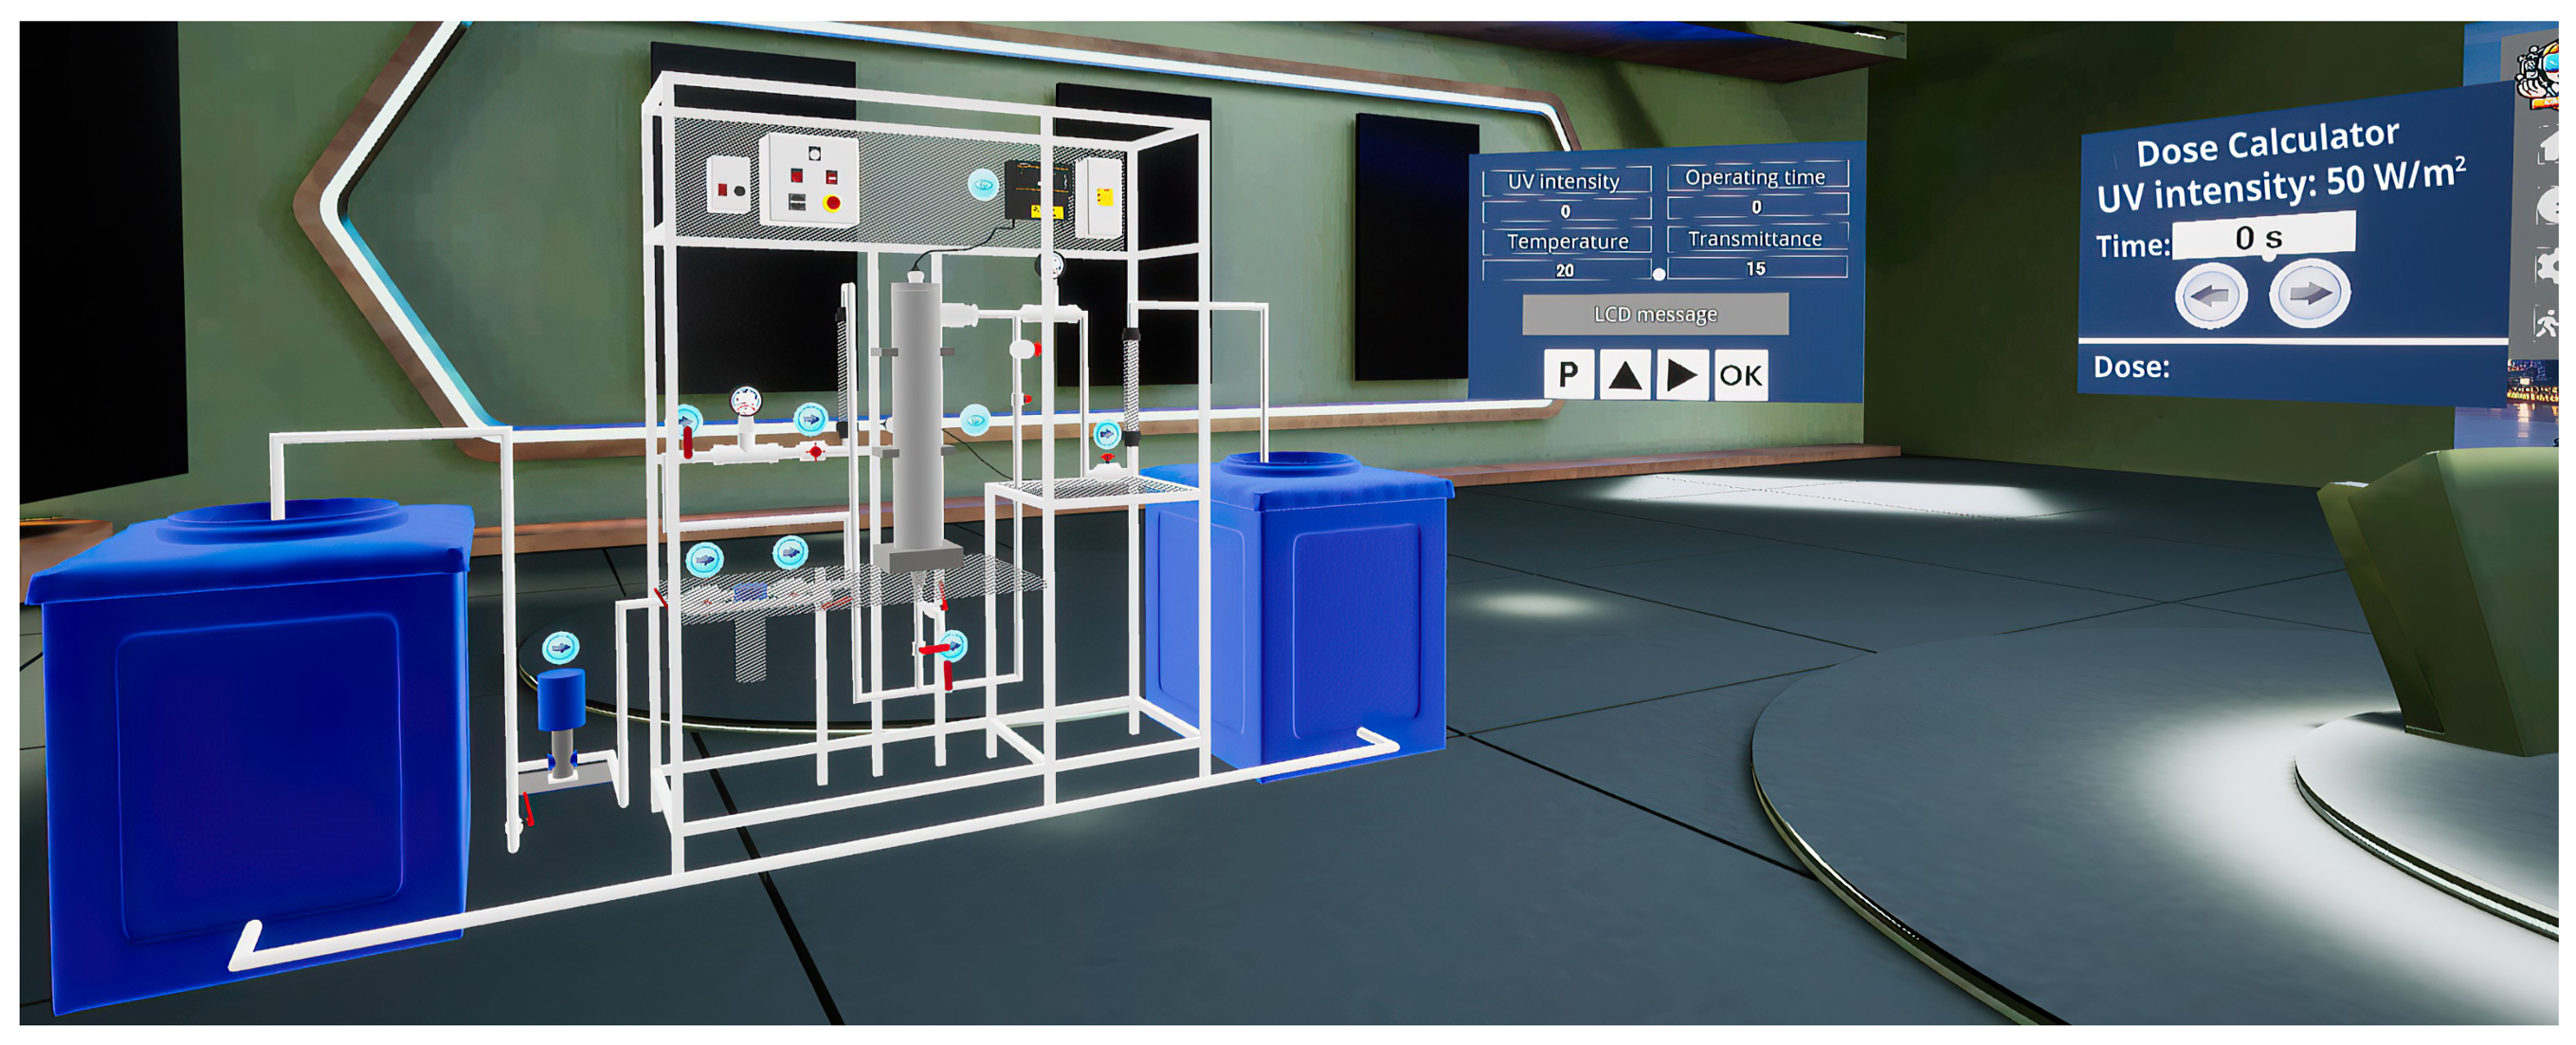
Part 3: Simulating the system (Figure 2). Students ran the fully built system and adjusted UV intensity and flow rate via an interactive dashboard. A real-time dose calculator showed how well the microbes were being killed.

3.2.2. Traditional Lesson

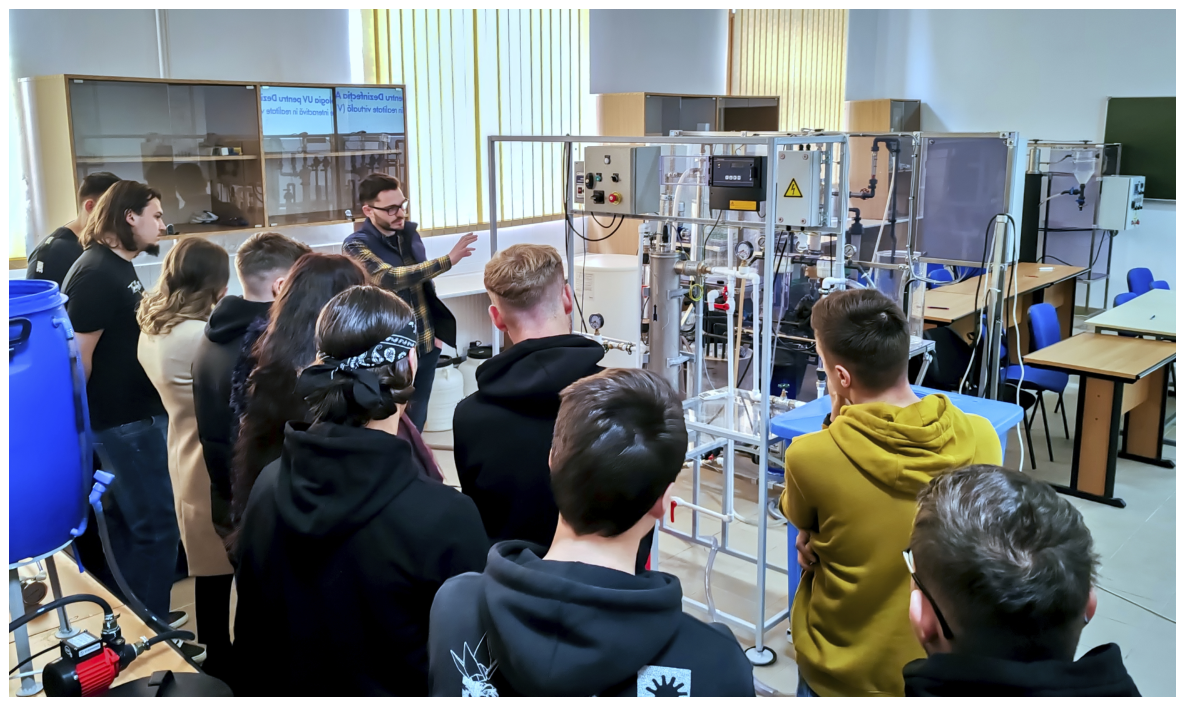
The traditional lesson covered content aligned at the conceptual, procedural, and operational levels with the VR lesson. It was delivered in a laboratory setting by an instructor using a slide-based presentation and the physical UV disinfection stand (Figure 3). Students first followed the slide presentation, which included diagrams, text, and 2D visuals mirroring the information presented in the VR environment, to ensure content equivalence across formats. Under instructor supervision, they then operated the real UV stand by performing the same key steps modeled in VR (e.g., starting the system, adjusting relevant parameters, and observing the disinfection process). This combination of presentation and hands-on manipulation was intended to align the procedural sequence and time-on-task with the VR lesson while maintaining a conventional instructional format.
Although the two instructional formats were designed to be closely aligned in terms of learning objectives, procedural sequence, and time-on-task, complete equivalence cannot be assumed. Differences in modality—such as physical versus virtual manipulation, instructor presence, and the novelty of immersive interaction—may have influenced students’ experiential responses. These residual differences are inherent to comparative studies of VR and traditional instruction and are acknowledged as potential sources of variance in perceived engagement and usability rather than as confounds affecting learning effectiveness.

3.3. Instruments

Knowledge tests. A short multiple-choice quiz captured students’ task performance on UV water disinfection concepts before and after instruction. The pre-test consisted of 3 dichotomously scored items (1 = correct, 0 = incorrect); the post-test extended this to 5 items. Scores were summed within each administration and used descriptively as indicators of immediate task performance only.
Flow State Scale. Perceived flow was assessed with a short five-item scale developed for this study, based on key dimensions from existing Flow State Scales [40,41]. Items captured concentration, absorption, time distortion, challenge, and perceived control, and were translated into Romanian. Wording was contextualized to the instructional format (e.g., “I felt completely absorbed in the VR activity” versus “I felt completely concentrated during the lesson”). This adapted short form should be interpreted as a study-specific flow index rather than as the original validated FSS. Cronbach’s α indicated good to excellent internal consistency across sessions ( α = 0.728 0.911 ).
User Engagement Scale. Perceived engagement was assessed using an adapted version of the UES [42]. The VR condition used an 8-item form; the Traditional condition used a 7-item form, with one item omitted because it was considered more closely tied to the immersive character of the VR condition. UES scores were therefore treated as parallel but not fully symmetric indicators of engagement across conditions, and cross-condition comparisons should be interpreted with this asymmetry in mind. Internal consistency was high in both configurations (VR condition: α = 0.87–0.95; Traditional condition: α = 0.89–0.91).
System Usability Scale. Perceived usability of the VR application was measured with the standard 10-item System Usability Scale [43], translated into Romanian, and administered only after the VR condition. Items were rated on a 5-point Likert scale; odd-numbered items were recoded as (response – 1) and even-numbered items as (5 – response), with recoded scores summed and multiplied by 2.5 to yield a 0–100 SUS score. Internal consistency was excellent in both sequence groups (VR-first: α = 0.906; Trad-first: α = 0.867).
Feedback questionnaire. A final set of open-ended questions collected qualitative feedback on perceived strengths, comparative advantages over traditional methods, difficulties encountered, and suggestions for improvement.

3.4. Procedure

The study followed a structured five-phase procedure implementing the 2 × 2 crossover design:
Phase 1 (Pre-test/Baseline). Before any instructional exposure, all participants completed a pre-session questionnaire including demographics, familiarity with relevant technologies, attitudes toward VR and modern learning methods, and a 3-item multiple-choice knowledge test on UV water disinfection.
Phase 2 (First Instructional Session—Period 1). Participants in the VR-first sequence attended the VR lesson, whereas participants in the Trad-first sequence attended the traditional lesson. Both sessions lasted approximately 35–40 min and covered content aligned at the conceptual, procedural, and operational levels, differing only in delivery format (VR simulation versus slide-based instruction with the real UV stand).
Phase 3 (Post-session Assessments—Period 1). Immediately after the first instructional session, all participants completed the post-session assessment package: the 5-item knowledge post-test, the short FSS and UES for the just-completed lesson, and the SUS only for those who had experienced the VR lesson in this period.
Phase 4 (Second Instructional Session—Period 2/Crossover). After a 15–20-min break to reduce fatigue and allow room reconfiguration, the sequences crossed over instructional formats.
Phase 5 (Post-session Perception Scales and Comparative Feedback—Period 2). Immediately after the second instructional session, participants again completed the FSS and UES for the second lesson and the SUS for the VR session in this period. Finally, all participants completed a comparative feedback questionnaire in which they reflected on and contrasted the VR and traditional lessons in terms of perceived clarity, engagement, and usefulness.

3.5. Data Analysis

A comprehensive, assumption-aware analytical approach was employed to examine patterns in self-reported perceptions of experience and usability within the crossover design. The plan prioritized non-parametric methods due to observed violations of parametric assumptions while also making use of linear mixed models to account for the within-subjects structure. All analyses were conducted in Python (v3.x) using the scipy, statsmodels and pingouin libraries, with an alpha level of α = 0.05 used to flag statistically significant associations.
  • Data screening and reliability. Internal consistency for the FSS, UES, and SUS scales was assessed using Cronbach’s ( α ), calculated for each relevant session frame (Sequence × Period × Condition) to examine measurement reliability across the design.
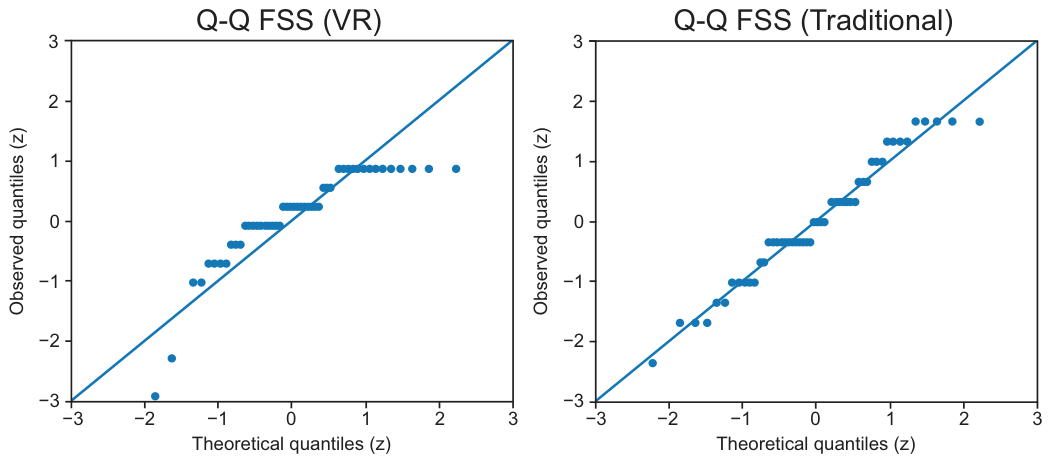
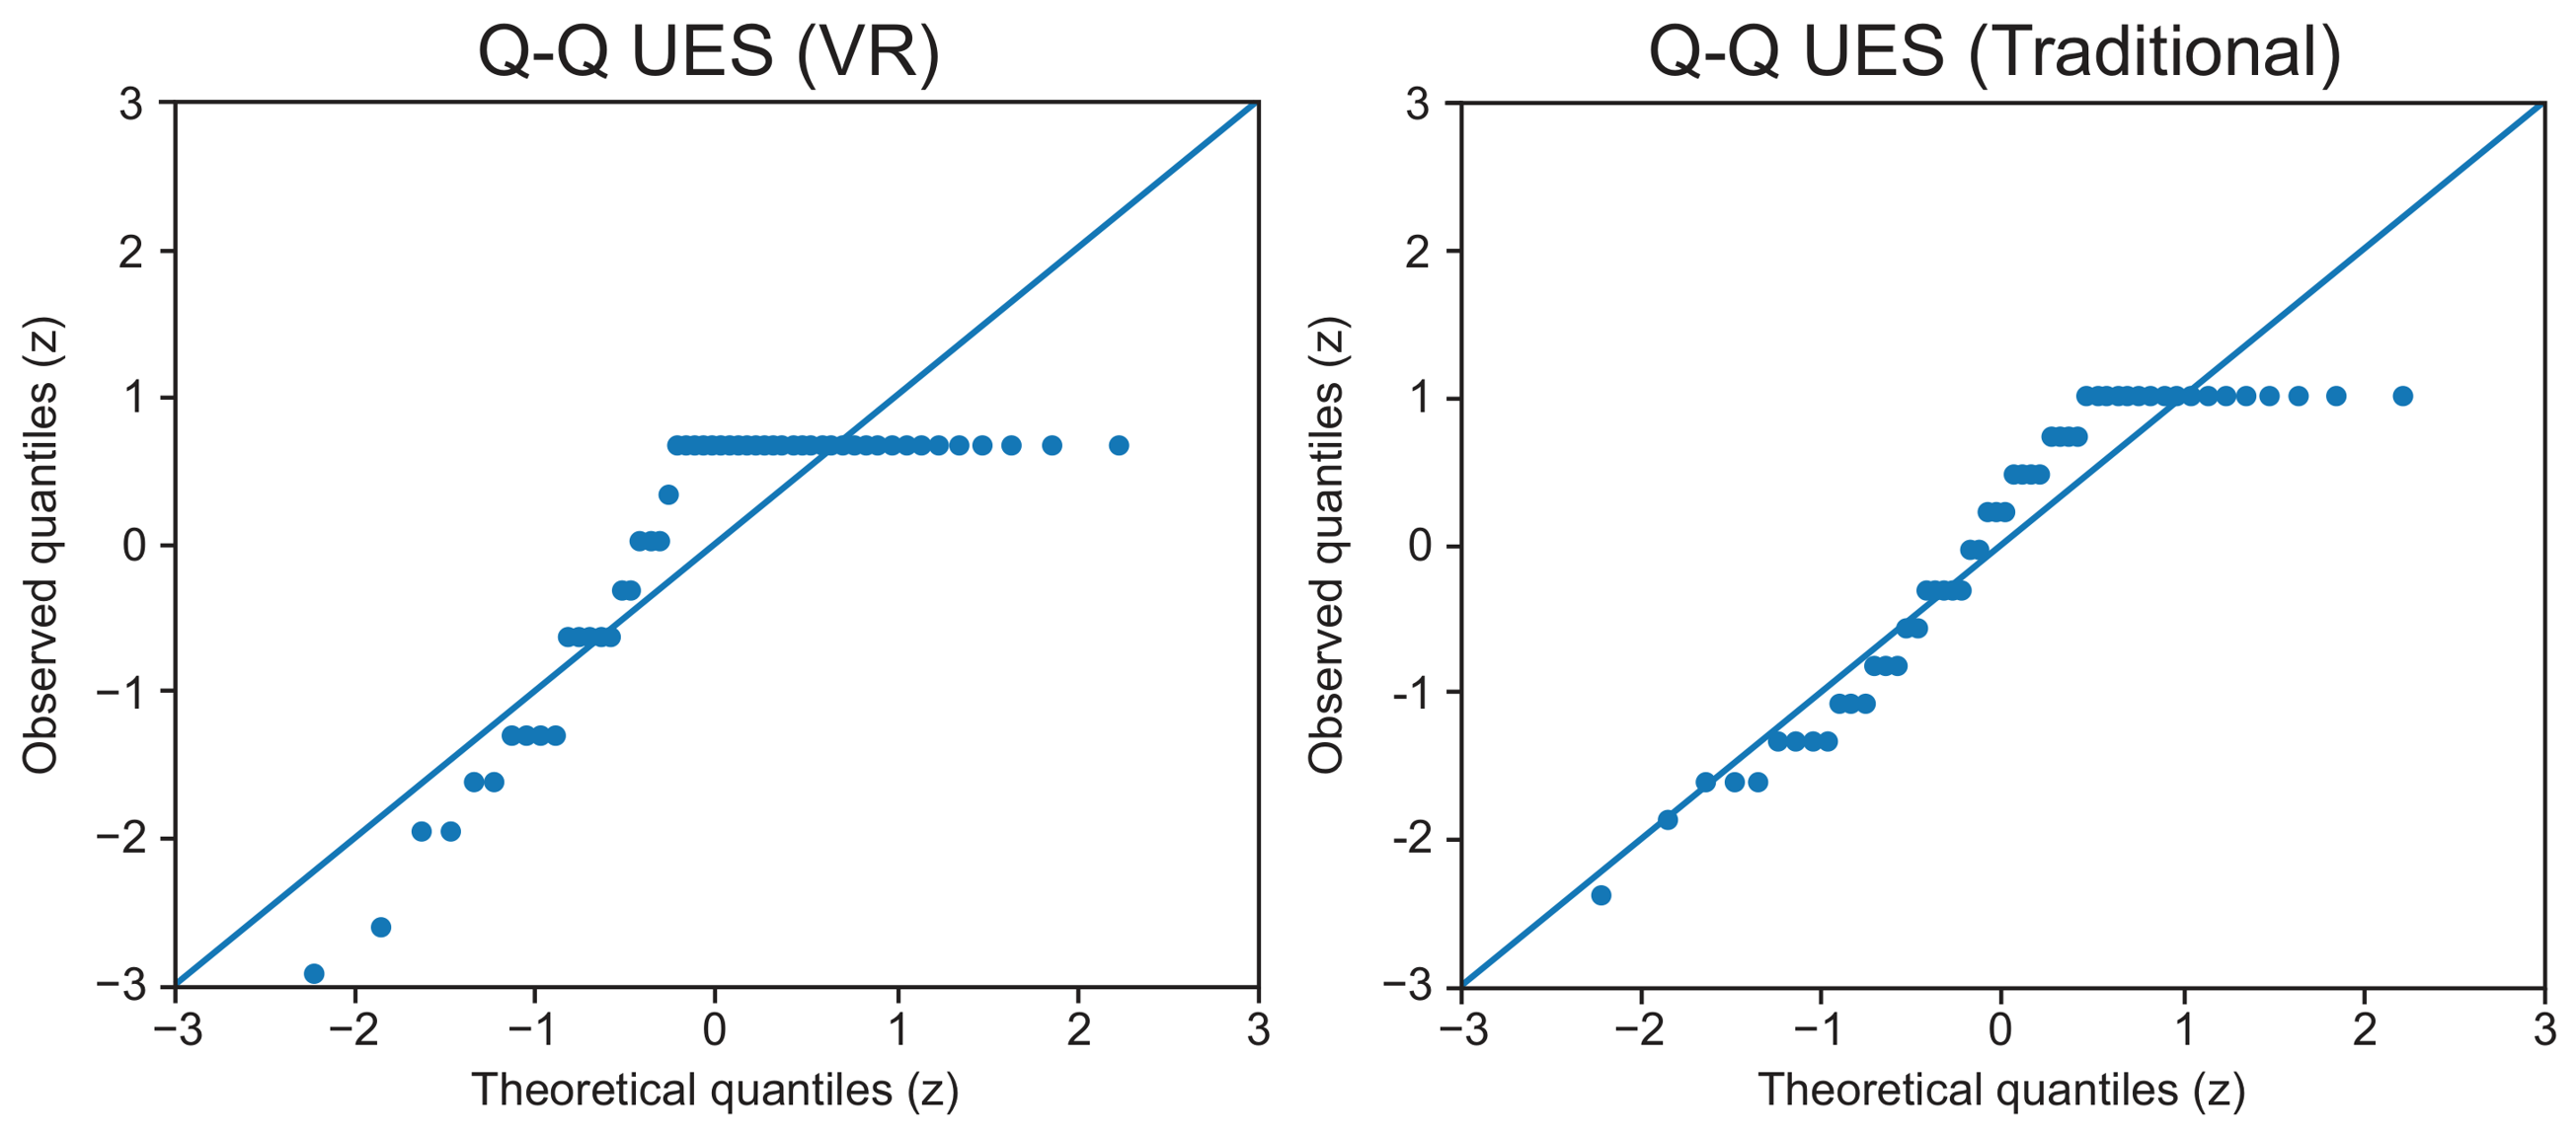
  • Assumption checking. The Shapiro–Wilk test was used to assess the normality of the primary outcome variables (FSSTotal, UESTotal, SUSScore) within each condition. Homogeneity of variances between conditions was examined using Levene’s test, and distributional properties were further inspected visually via Q-Q plots.
An a priori power analysis for paired comparisons was conducted using a t-approximation for the Wilcoxon signed-rank test. For a medium effect size of d z = 0.50 with α = 0.05 (two-tailed) and 80% power, the required sample size was approximately n = 34 participants. For a slightly larger effect size of d z = 0.60 , the required sample size decreased to n 24 . The final sample of 52 students therefore exceeded the target range for detecting medium effects in paired VR–Traditional comparisons of perceived flow and engagement.
Primary inferential analyses
Given the pronounced non-normality of most outcome distributions, non-parametric tests formed the core of the inferential framework.
  • Between-condition comparisons (RQ1). To compare the VR and Traditional conditions across all periods, two-sided Mann–Whitney U tests were employed. Effect sizes were calculated r = | z | / N and complemented with Cliff’s Delta ( δ ) and its bootstrap 95% confidence interval as a non-parametric measure of dominance. Hodges–Lehmann median differences with 95% confidence intervals were also reported.
  • Within-subject comparisons (RQ1). To leverage the within-subjects component of the design, two-sided Wilcoxon signed-rank tests were conducted on complete VR-Traditional pairs for each participant. Effect sizes (r) were calculated based on the effective sample size remaining after excluding zero-difference pairs.
  • Analysis of sequence and usability (RQ2). The effect of instructional sequence on the perceived usability of the VR system (SUSScore) was analyzed using a Mann–Whitney U test comparing VR-first and Trad-first sequences, as SUS was only administered post-VR. This was supplemented with an ordinary least squares (OLS) regression with HC3 robust standard errors to examine the same association in a regression framework.
Accounting for the crossover design
To control for the fixed effects of Condition, Period and Sequence while accounting for the non-independence of observations due to repeated measures, linear mixed-effects models (LMMs) were fitted using maximum likelihood estimation. The model structure for the primary experience outcomes (FSSTotal, UESTotal) was
Outcome ∼ Condition + Period + Sequence + (1|ID)
where a random intercept for participant (ID) was included. To examine potential period- and sequence-related influences, HC3-robust OLS models were also fitted that included a Condition × Period interaction term. These regression models were treated as robustness checks to assess whether the condition-related patterns observed in the non-parametric tests remained similar once the crossover structure was explicitly modelled.
Secondary and exploratory analyses
  • Correlational analysis (RQ4). Relationships between pre-test measures (digital competencies, emerging technology attitudes, and VR interest) and post-test perceived experience outcomes were examined using Spearman’s rank-order correlation ( ρ ), computed separately for the VR and Traditional conditions. The family-wise error rate for these multiple correlations was controlled using the Holm adjustment.
  • Qualitative analysis (RQ5). Responses to the open-ended feedback questions were analyzed using inductive thematic analysis. Codes were grouped into themes describing perceived strengths, perceived comparative advantages of VR over traditional methods, reported difficulties, instructional preferences, and suggestions for improvement. Frequencies and illustrative quotes were used descriptively to characterize user perceptions and acceptance.
This multi-faceted analytical strategy was designed to align with the distributional properties of the data, the within-subjects crossover structure and the exploratory, perception-focused aims of the study, while avoiding over-interpretation in terms of causal effects or confirmed learning outcomes.

4. Results

4.1. Participant Characteristics, Data Completeness, and Scale Reliability

4.1.1. Participant Allocation and Data Completeness

Table 2 summarizes participant allocation and complete-case counts for the self-report outcome measures across sequence, period, and condition. The study implemented a 2 × 2 crossover design with 52 participants, randomly allocated to two sequence groups: VR-first ( n = 26 ), who experienced the VR lesson in Period 1 and the traditional lesson in Period 2, and Trad-first ( n = 26 ), who experienced the conditions in the reverse order. Across the two periods, this structure yielded 104 observational records.
Data completeness for the primary self-report measures was high. All participants provided complete responses for the FSS and UES in both instructional conditions, resulting in 52 complete paired observations for each scale and 104 total observations per measure. SUS was administered only after the VR condition because it was used specifically to evaluate the perceived usability and acceptability of the VR system rather than the traditional lesson format. This resulted in 52 SUS observations in total, with 26 collected from the VR-first group in Period 1 and 26 from the Trad-first group in Period 2.

4.1.2. Baseline Technology Profile and Pre-Existing Knowledge

Table 3 presents the baseline technology-related dispositions and pre-test knowledge indicators for the two sequence groups. Overall, both groups showed broadly favorable self-reported orientations toward technology, with descriptive values in the moderate-to-high range across the technology-related measures. Baseline pre-test performance was also relatively high in both groups, indicating that participants entered the study with at least partial prior familiarity with the instructional content.
No inferential group comparisons were conducted at baseline. This decision was made because the study was designed as a feasibility- and user-perception investigation rather than as a baseline equivalence trial, and the baseline indicators were included primarily to describe the cohort and contextualize subsequent findings. Accordingly, these measures are interpreted as descriptive markers of initial preparedness rather than as evidence of statistically confirmed group differences or differences in learning ability.

4.2. Analysis Strategy and Statistical Assumptions

The analysis strategy was selected to model patterns in self-reported perceptions of experience (flow, engagement, usability) while taking into account the properties of the data and the 2 × 2 crossover design. Preliminary assumption checks were conducted to guide the choice of statistical methods. Shapiro–Wilk tests indicated marked departures from normality for the majority of outcome distributions (for example, VR condition: FSS, W = 0.775, p < 0.001; UES, W = 0.722, p < 0.001; SUS, W = 0.811, p < 0.001), a pattern that was consistent with the visual inspection of normal Q-Q plots (Figure 4 and Figure 5).

4.3. Comparative Perceived Experience: VR vs. Traditional Instruction

4.3.1. Non-Parametric and Paired Comparisons

To address RQ1, we examined how students’ self-reported flow and engagement differed between the VR and Traditional conditions in the crossover setting.
The primary contrasts in perceived experience between the VR and Traditional conditions were analyzed with non-parametric tests. Between-condition comparisons used the Mann–Whitney U test, and within-subject differences were assessed with the Wilcoxon signed-rank test on the paired data. The results for FSS and UES are summarized in Table 4.
For paired comparisons between VR and traditional lessons, all 52 students contributed complete FSS scores, with 9 zero-change pairs excluded by the Wilcoxon algorithm, yielding an effective n = 43 . Based on self-reported perceptions, the VR lesson was associated with higher perceived flow than the traditional lesson (Wilcoxon W = 139.5 , p = 0.0001, z = −4.05, r = 0.62). The median paired difference ( VR Traditional ) was 2.00 points (IQR [ 0.00 , 4.00 ] ), with a Hodges–Lehmann estimate of 2.00 and a 95% confidence interval [ 1.00 , 3.00 ] . The observed effect size corresponds to an approximate power 0.98 against a medium effect (t-approximation), consistent with the a priori power analysis.
For engagement, all 52 students provided complete scores, but 20 zero-change pairs were excluded from the Wilcoxon ranks, resulting in an effective n = 32 . Perceived engagement was higher for the VR lesson than for the traditional lesson (Wilcoxon W = 88.0 , p = 0.0009, z = −3.31, r = 0.58). The median paired difference ( VR Traditional ) was 0.50 points (IQR [ 0.00 , 4.25 ] ), with a Hodges–Lehmann estimate of 1.00 and a 95% confidence interval [ 0.00 , 2.00 ] . The observed effect size yielded an approximate power of 0.89 for detecting the targeted medium effect size (t-approximation).
Overall, these non-parametric and paired comparisons describe a consistent pattern in which the VR lesson was rated as more engaging and more conducive to flow than the traditional lesson.

4.3.2. Mixed-Effects and Robust Regression Models

To account for the crossover design and individual variability, linear mixed models (LMMs) were fitted to the data. These models assessed the associations between the experimental factors (Condition, Period, Sequence) and the self-reported experience scores, with a random intercept included for participant ID. Ordinary least squares (OLS) regression with heteroscedasticity-consistent (HC3) standard errors was used as a complementary robustness check. The model coefficients are summarized in Table 5.
For perceived flow, the model results were consistent with the non-parametric comparisons. In the linear mixed model, the VR condition was positively associated with FSS scores, with an estimated coefficient of 2.15 points (SE = 0.51, p < 0.001) relative to the Traditional condition. A similar association appeared in the OLS-HC3 robustness check (Coef. = 2.09, SE = 0.49, p < 0.001). Period and Sequence showed no substantial associations with flow scores, and the Condition × Period interaction in the OLS model was small (Coef. = 0.13, SE = 0.36, p = 0.712), suggesting that the condition-related pattern in perceived flow was broadly stable across periods in this sample.
For perceived engagement, the positive association for the VR condition also persisted. The linear mixed model suggests that the VR condition was associated with UES scores that were on average 1.79 points higher (SE = 0.48, p < 0.001) than in the Traditional condition, with a comparable estimate in the OLS-HC3 model (Coef. = 1.93, SE = 0.54, p < 0.001). Sequence showed a notable association: students in the VR-first group tended to report higher engagement across sessions (LMM Coef. = 2.67, SE = 0.74, p < 0.001; OLS-HC3 Coef. = 2.53, SE = 0.59, p < 0.001). The Condition × Period interaction was again small and not statistically compelling (Coef. = −0.28, SE = 0.32, p = 0.384).
Overall, these modelling approaches suggest that the condition-related patterns observed in the primary non-parametric analyses remain similar when accounting for the crossover design and individual variability. In this feasibility context, the VR condition maintained a positive association with both perceived flow and perceived engagement across the different analytical frameworks.

4.4. Usability and Acceptability of the VR System

4.4.1. System Usability Scale Scores

To address RQ2, we examined students’ perceived usability of the VR system, assessing how usable and acceptable the immersive lesson environment was in the present crossover context.
Table 6 presents descriptive item-level statistics for the SUS. The table is included to show which aspects of the VR system were rated more positively or less positively at the item level. These item statistics are reported for descriptive purposes only and were not subjected to separate inferential testing.
Preliminary distribution checks indicated non-normality of SUS scores within both sequences. Shapiro–Wilk tests returned W = 0.626 , p < 0.001 for the VR-first group and W = 0.907 , p = 0.0226 for the Trad-first group, supporting the use of non-parametric methods for sequence comparisons.
Descriptively, SUS scores were high in both groups, with a higher mean in the VR-first sequence. The Trad-first group obtained a mean SUS score of 78.27, while the VR-first group obtained a mean of 93.37. A Mann–Whitney comparison of SUS scores between sequences (VR-first versus Trad-first) suggests a moderate difference favoring the VR-first group ( n VR - first = n Trad - first = 26 , U = 508.5 , z = 3.120 , p = 0.0017 , r = 0.433 , Cliff’s δ = 0.504 ). In other words, participants who encountered the VR lesson in the first period tended to assign higher usability scores to the VR system.
As a complementary robustness check, an OLS-HC3 model was estimated with SUS_Score as the outcome and Sequence as the predictor (reference: Trad-first). The intercept of 78.27 (SE = 3.53, p < 0.001) corresponds to the mean SUS score in the Trad-first group, and the coefficient for the VR-first sequence was 15.10 (SE = 4.08, p < 0.001; 95% CI [7.10, 23.10]). This model-based result is consistent with the Mann–Whitney analysis and supports the interpretation that, within this feasibility study, sequence was associated with differences in perceived usability, with particularly favorable ratings in the VR-first group.

4.4.2. SUS Acceptability Benchmarks

To contextualize the perceived usability scores, overall SUS results were mapped onto the acceptability ranges and adjective ratings established in the usability literature [43,44]. Following Bangor et al. [44], scores are categorized by acceptability as Not Acceptable (0–49.9), Marginal (50–69.9), and Acceptable (70–100) and by adjective rating as Poor (0–49.9), OK (50–69.9), Good (70–84.9), and Excellent (85–100). In the present study, these benchmarks are used only as descriptive aids for interpreting participants’ perceived usability ratings in this educational setting, not as certification of product-level usability.
As shown in Table 7, the VR system was generally placed in acceptable usability ranges in both sequence groups, although the distribution was more favorable in the VR-first group. Most participants in both groups fell within the Acceptable band, and adjective ratings were concentrated in the Good-to-Excellent range. The VR-first sequence showed a particularly strong clustering in the Excellent category, whereas the Trad-first sequence displayed a broader spread across categories.
These benchmark-based categorizations are interpreted cautiously as descriptive indicators of perceived usability and acceptability in this feasibility study. They complement the continuous SUS scores by showing that participants generally rated the VR application within acceptable to highly favorable usability bands, while also suggesting a possible sequence-related difference in how positively the system was perceived.

4.5. Correlates of Perceived Experience

4.5.1. Associations in the VR Condition

To address RQ4, Table 8 reports that Spearman correlations between pre-existing technology dispositions were associated with self-reported experience metrics. Spearman rank correlations were calculated between Emerging Technologies, Technology Accommodation, Familiarity with VR, VR Interest, and Pre-test knowledge (Pre Total), as well as FSS, UES and SUS. P values were adjusted for multiple comparisons using the Holm procedure.
In the VR condition, the strongest associations were observed for perceived engagement (UES). UES correlated most clearly with Emerging Technologies ( ρ = 0.51 ), Pre Total ( ρ = 0.45 ), and VR Interest ( ρ = 0.42 ). These coefficients indicate that students with stronger interest in VR, higher baseline knowledge, and a more favorable orientation toward emerging technologies tended to report greater engagement during the immersive lesson.
By contrast, associations with FSS and SUS were more modest. For FSS, the largest coefficients were found for VR Interest ( ρ = 0.30 ), Emerging Technologies ( ρ = 0.28 ), and Pre Total ( ρ = 0.27 ), whereas Familiarity was essentially unrelated to flow ( ρ = 0.03 ). For SUS, the strongest relationship was with UES ( ρ = 0.51 ), while correlations with baseline dispositions were smaller, including VR Interest ( ρ = 0.34 ), Emerging Technologies ( ρ = 0.28 ), and Pre Total ( ρ = 0.28 ).
The results imply that participants’ broader technological orientation and prior interest in VR may be more closely linked to perceived engagement in the immersive format than to perceived flow or usability.

4.5.2. Associations in the Traditional Condition

Table 9 presents the corresponding correlations for the Traditional condition. In this condition, the clearest association was observed between Emerging Technologies and UES, while the remaining correlations were smaller.
For comparative purposes, analogous exploratory analyses were conducted for the Traditional condition, examining associations between the same pre-existing dispositions and the experience metrics FSS_Total and UES_Total (SUS was not administered for the Traditional condition).
In the Traditional condition, associations between baseline dispositions and perceived experience were generally weaker than in the VR condition. For UES, the strongest correlation was observed for Emerging Technologies ( ρ = 0.45 ), followed by Pre Total ( ρ = 0.38 ). These coefficients suggest that students with a more favorable orientation toward emerging technologies, and to a lesser extent higher baseline knowledge, tended to report higher engagement in the traditional lesson.
Correlations with FSS were uniformly small, ranging from ρ = 0.08 for Familiarity to ρ = 0.19 for Tech accommodation, with VR Interest showing virtually no association with flow ( ρ = 0.01 ). Thus, unlike the VR condition, the Traditional condition did not show a meaningful pattern linking baseline dispositions to perceived flow.
The contrast with the VR condition was especially visible for VR Interest. Whereas VR-related interest was more relevant to experience under immersive delivery, in the Traditional condition it showed only a modest association with engagement ( ρ = 0.23 ) and no meaningful association with flow ( ρ = 0.01 ). By comparison, Emerging Technologies remained the strongest baseline correlate of engagement, suggesting that broader openness to technological innovation may be more relevant than VR-specific interest in the non-immersive format.
Overall, the Traditional-condition matrix provides a useful comparative baseline for interpreting the VR results. The observed coefficients indicate a weaker and more diffuse pattern of associations, particularly for flow.
Taken together, the VR condition showed a more coherent pattern of associations than the Traditional condition, particularly for engagement, where VR-specific interest and broader technological orientation were more clearly linked to reported experience in the immersive format than in the conventional one.

4.6. Feedback

To address RQ5, we analyzed students’ open-ended feedback regarding the perceived strengths, difficulties, comparative advantages, and preferred future uses of VR in relation to traditional instruction.
Open-ended questions were included to capture participants’ perceptions of the VR lesson in their own words and to complement the structured rating scales. Table 10 summarizes response rates for each prompt in terms of the number and proportion of participants who provided a substantive answer versus those who left the item blank or explicitly abstained.
The first two questions (4.1 and 4.2), which invited participants to describe what they liked most about the VR lesson and what appeared clearer or easier to understand in VR, elicited responses from around two-thirds of the sample. This level of engagement with open-ended prompts is consistent with the generally positive self-reported experience scores, and suggests that a substantial proportion of students were willing to articulate specific aspects of the VR lesson they perceived as valuable or clarifying. At the same time, more than one-third of participants did not provide written comments to these questions, which may reflect time constraints, a preference for rating scales, or a perception that their views were already adequately expressed elsewhere in the questionnaire.
Question 4.3, which focused on potential difficulties encountered during the VR lesson, attracted fewer responses (42.31%). This pattern may suggest that only a subset of participants perceived notable challenges worth reporting, or that some students were less inclined to elaborate on negative aspects in an open format. Given the absence of missing data on the closed-ended items, the relatively lower response rate here is interpreted cautiously and does not by itself imply an absence of difficulties; rather, it provides a partial window into how willing participants were to document any problems in writing.
The highest response rate was observed for Question 4.4, which asked about preferred modes of learning in the future; 96.15% of participants answered this item. This near-universal engagement suggests that the question of how VR should be positioned relative to traditional methods is highly salient for students. The qualitative content of these preferences, analyzed separately, provides additional context for interpreting the perceived value of VR in relation to more familiar instructional formats.
By contrast, no participant provided additional comments or suggestions in response to Question 4.5. This absence of responses is not taken as evidence that no further views existed, but rather as an indication that, within the constraints of the session, students did not perceive a strong need to add free-form remarks beyond what had already been captured by the preceding questions. Overall, the response patterns to the open-ended items are consistent with the broader feasibility findings: participants were able and, in many cases, willing to provide qualitative feedback on the VR lesson, but their engagement with open-ended prompts varied by topic and perceived relevance. These observations are used to characterize user acceptance and tolerance for the questionnaire format, rather than to draw strong conclusions about the full range of participants’ views.

4.6.1. Perceived Strengths of the VR Lesson

Thematic analysis of the aspects participants most appreciated in the VR lesson indicated several recurring strengths (Table 11). The largest proportion consisted of uncategorized or non-specific positive responses (28.36%). Among the coded themes, Clarity was the most frequent (16.42%), with participants valuing the way the lesson was explained and the combination of theory and simulation. Interactivity (11.94%) was also commonly mentioned, reflecting appreciation for the step-by-step structure and active involvement in the experience. Additional positive themes included Practicality (10.45%), Autonomy (7.46%), Simulation (7.46%), and Accessibility (5.97%). Other positive impressions (11.94%) referred to general appreciation, first-time novelty, and realism.

4.6.2. Perceived Advantages over Traditional Instruction

When asked what appeared clearer or more advantageous in VR than in the traditional format, participants most often referred to Clarity (21.74%), particularly in relation to understanding system components and their functioning (Table 12). Practicality (15.94%) was the next most frequent theme, with responses emphasizing hands-on assembly and concrete interaction with the system. Participants also highlighted Specific Content (11.59%), such as component layout and function, and Interactivity (7.25%), reflecting the perceived value of direct engagement with the filtration system. Less frequent responses referred to Novelty (4.35%) and other positive aspects (10.14%), including general appreciation and increased involvement in the lesson.

4.6.3. Reported Difficulties with the VR Lesson

The difficulty analysis indicated generally positive usability, with most participants reporting no meaningful problems during the VR session (Table 13). The most common response was No Difficulties (63.46%), illustrated by comments such as “None encountered”. Among the reported challenges, the most frequent was Initial Adjustment (23.08%), suggesting that some participants needed a short familiarization period at the beginning of the experience: “It was a bit hard at first, but I got used to it quickly”. A smaller proportion referred to Movement Control difficulties (7.69%), for example, “Controlling movements was tricky”. Other issues were infrequent (3.85%) and included minor comments related to app familiarization or device handling.

4.6.4. Preferred Mode of Future Instruction

The overwhelming preference for blended learning emerged clearly (Table 14), with 88.5% of participants favoring a combination of VR and traditional methods. Only 7.7% preferred VR exclusively, while 3.8% provided no valid response.

4.6.5. Suggestions from Students for Future Iterations

Regarding improvements (Table 15), 54.5% offered no suggestions, while 20.0% explicitly stated no improvements were needed. The most common constructive feedback requested more content (9.1%) and clearer instructional steps (3.6%). Minor suggestions included content expansion, broader VR integration, gamification, improved graphics, and enhanced object interaction.

5. Discussion

The main pattern of findings suggests that, in this implementation, the VR lesson was perceived more positively than the traditional lesson across all three primary constructs: students reported higher perceived flow and engagement in the VR condition (FSS and UES, both p < 0.001), and the VR system received usability ratings that were predominantly within the Acceptable to Excellent range on the SUS, with a mean score of 93.37 in the VR-first group and 78.27 in the Trad-first group. This pattern is consistent with prior work reporting that students often describe VR-based learning experiences as more immersive, engaging, and experientially compelling than conventional formats, particularly when the instructional content benefits from visualization and interactive exploration [6,16,17,18].
The characteristics of the lesson itself are likely important for understanding this pattern. The instructional topic, ultraviolet (UV) water disinfection, involves process-based reasoning, system components, and relationships that are well suited to visual and interactive representation. In such a context, the VR format may have supported higher self-reported flow and engagement scores because it allowed learners to inspect and engage with the process individually and at their own pace, in a spatially direct way that a conventional lesson format cannot fully replicate. This interpretation is consistent with studies suggesting that VR may be particularly well matched to topics involving complex systems, spatial structure, or procedural visualization [11,12,13,14].
By contrast, although the traditional lesson included a physical UV disinfection stand that students could observe and operate, the group setting meant that individual hands-on contact with the equipment was necessarily limited. This practical constraint may partly explain the lower engagement ratings in the traditional condition: whereas every student interacted individually with the VR system using their own controllers, physical manipulation of the stand was shared across the group, which may have reduced the sense of active personal involvement for some participants. This distinction is worth considering in future comparisons of VR and hands-on laboratory instruction, particularly when individual access to physical equipment cannot be ensured.
The usability findings also fit the broader literature on student acceptance of educational VR. Most participants placed the system in acceptable to highly favorable usability ranges, which is compatible with research showing that perceived usefulness, ease of use, and enjoyment are central to user acceptance of interactive learning technologies [28,37,38]. However, the present study does not interpret these judgments as evidence of fully established product usability in a general sense. Rather, they indicate that, in this classroom setting, students were generally able to use the VR application without major difficulty and regarded it as an acceptable instructional component.

5.1. Sequence-Related Patterns

A notable feature of the findings was the sequence-related difference in perceived usability, with more favorable ratings among students who encountered the VR lesson first. This pattern should be interpreted as an exploratory order-of-exposure association rather than as evidence that VR should be introduced first in engineering instruction. Several plausible explanations exist. A first possibility is a novelty or primacy effect, in which encountering VR at the start of the instructional sequence generated a stronger initial impression that shaped subsequent usability judgments. A second possibility is a contrast effect, whereby experiencing the immersive format first sharpened students’ awareness of differences between the two instructional modes. A third possibility is a preparatory effect: students who completed the VR lesson first may have arrived at the traditional session with a stronger conceptual framework for the content, making the overall learning experience feel more coherent and productive, which in turn may have positively coloured their retrospective evaluation of the VR system. Carryover and immediate comparison effects may also have contributed, given that both sessions occurred within the same general instructional setting. The present design cannot distinguish between these mechanisms, and future studies incorporating washout intervals or delayed usability assessments would help clarify which of these explanations best accounts for the sequence-related pattern.
These interpretations are consistent with the logic of crossover-type educational comparisons, where sequence can influence reported experience even when the design helps reduce some between-group imbalance [45]. At the same time, the present study was not specifically designed to isolate sequence mechanisms, and unmeasured influences such as expectations, peer discussion, or local session dynamics may also have shaped students’ responses. The sequence-related pattern is therefore best understood as a context-bound feature of this implementation, one that highlights the need to plan and report order of exposure carefully in future studies of perceived experience and user acceptance.

5.2. Role of Learner Dispositions in Perceived Experience

The correlational results suggest that pre-existing learner dispositions were more strongly connected to perceived engagement than to flow or usability, particularly in the VR condition. In the VR condition, interest in VR, positive attitudes toward emerging technologies, and higher pre-test knowledge showed the clearest associations with UES scores, with several correlations remaining statistically significant after Holm adjustment. By contrast, associations with perceived flow and usability were generally weaker and did not retain significance once multiple comparisons were controlled. This pattern is compatible with literature indicating that prior orientation toward digital technologies can shape how positively learners respond to technology-enhanced environments [28,32,38], and helps explain why perceived engagement varied more clearly with learner profile than perceived usability, which appeared to reflect broader judgments about the interface and interaction quality of the system itself.
The comparison with the traditional condition is also informative. A generally favorable stance toward technology appeared to be associated with more positive experience in both instructional formats, but specific interest in VR was more salient in the immersive condition. This suggests that some dispositions may operate as general openness factors, whereas others are more closely tied to modality-specific enthusiasm. They imply that VR-based instruction may not be experienced uniformly across learners and that introductory scaffolding or orientation may be particularly important for students who begin with lower familiarity or weaker interest in immersive technologies.

5.3. Implications for Feasibility and Classroom Use

From a feasibility perspective, the study supports the practical implementation and acceptability of the instructional protocol in this setting. The two-period crossover procedure was completed as planned, participants were able to complete the scheduled activities and questionnaires, and the VR lesson was generally accepted by students as a usable instructional component. This is the main sense in which feasibility is claimed in the present work.
The results also suggest that VR may be most useful when positioned as a complementary instructional modality rather than as a wholesale replacement for traditional teaching. This interpretation is reinforced by the qualitative feedback, in which many students appeared to value the VR lesson as an added layer of clarity, practice, and experiential involvement, while still favoring a blended combination of immersive and conventional instruction. In practical terms, this implies that VR may be especially well suited to instructional contexts that involve visually complex processes, spatial reasoning, or procedural visualization, while traditional formats may continue to play an important role in explanation, discussion, and broader curricular integration. How these two modalities are best ordered or combined in practice remains an open question.

5.4. Methodological and Interpretive Limitations

Several limitations should be considered when interpreting these findings. First, the study was conducted with a relatively small sample drawn from a specific environmental engineering context, which limits generalizability. The results are therefore best understood as context-bound and sample-specific rather than as broadly representative of engineering students or VR-based instruction more generally.
Second, the main outcomes were self-reported measures of flow, engagement, and usability. Although these constructs are relevant to feasibility and user experience, they do not establish learning effectiveness. Participants’ ratings may also have been influenced by novelty, expectations, local framing, or the immediate contrast between instructional formats. Third, the sequence-related findings are exploratory and may reflect primacy, contrast, or carryover effects rather than stable instructional advantages linked to one order of presentation.
Finally, the findings are closely tied to the design of this particular lesson. Because UV water disinfection is especially amenable to visual and process-oriented representation, the observed advantages in perceived engagement may reflect a strong topic-modality fit that would not necessarily appear in the same way for other engineering topics or lesson types.

5.5. Implications for Future Research

Taken together, the findings support further investigation of VR in engineering education, but under more rigorous and better differentiated designs. Future studies should test similar questions across larger and more diverse cohorts, include stronger objective outcome measures, and examine whether the present pattern holds for engineering topics that differ in their degree of visual, spatial, or procedural suitability for immersive representation. Such work would help determine whether the present findings reflect a broader tendency or a particularly favorable match between this lesson topic and the VR format.
Future research should also examine sequencing more systematically. The current results suggest that order of exposure may shape how students perceive VR, but the mechanism remains unclear. Designs incorporating explicit counterbalancing, washout intervals, or alternative placement of VR within a course sequence may help disentangle novelty, contrast, and carryover influences. In addition, the exploratory associations with learner dispositions indicate that future work should consider whether pre-session orientation, technological acclimatization, or differentiated support can improve the experience for students with more varied levels of familiarity and interest.
Overall, the present study provides preliminary, perception-based evidence that a VR lesson on UV water disinfection can be implemented acceptably in an engineering education setting and can be positively received by students. These findings do not demonstrate educational superiority, but they do provide a useful foundation for subsequent studies aimed at testing broader implementation, stronger assessment, and more robust outcome evaluation.

6. Conclusions

This study provides preliminary, perception-based evidence that a VR lesson on UV water disinfection can be implemented acceptably in an undergraduate engineering setting and is positively received by students. The VR condition was associated with higher self-reported flow and engagement than the traditional condition, and usability ratings were predominantly within acceptable to excellent ranges. Perceived experience was also shaped by order of exposure and learner dispositions, though these patterns remain exploratory and correlational. Students’ qualitative feedback indicated that the VR lesson was valued most when positioned as a complement to traditional instruction rather than a replacement.
Several limitations constrain the scope of these conclusions: the sample was relatively small and context-specific, all primary outcomes relied on self-report measures, the sequence-related findings are exploratory and cannot be attributed to a single mechanism, and the UES was administered in slightly different forms across conditions (8 items in VR, 7 in Traditional), meaning engagement comparisons should be treated as approximate. Taken together, the findings remain context-bound and should not be generalized as evidence that VR is broadly more effective than traditional teaching.
Future research should test similar implementations with larger and more diverse samples, stronger objective outcome measures, and longer-term follow-up, while examining how lesson type, sequencing, and learner characteristics shape the perceived and educational value of VR in engineering education.

Author Contributions

Conceptualization, P.-I.G. and C.O.T.; Methodology, P.-I.G. and C.O.T.; Software, P.-I.G.; Validation, P.-I.G., A.Z. and C.O.T.; Formal analysis, P.-I.G. and A.Z.; Investigation, P.-I.G. and A.Z.; Resources, C.O.T. and V.N.; Data curation, P.-I.G. and A.Z.; Visualization, P.-I.G. and A.Z.; Writing—original draft, P.-I.G.; Writing—review & editing, C.O.T., A.Z. and V.N.; Supervision, V.N.; Project administration, C.O.T. and V.N. All authors have read and agreed to the published version of the manuscript.

Funding

This research received no external funding.

Institutional Review Board Statement

The study was conducted in accordance with the Declaration of Helsinki and was approved by the Institutional Ethics Committee (Subcommittee on Ethics dedicated to research ethics) of ‘Vasile Alecsandri’ University of Bacău, Romania (Ethical notification No. 14/2, dated 8 August 2025) for studies involving humans.

Informed Consent Statement

Informed consent was obtained from all subjects involved in the study.

Data Availability Statement

The original data presented in the study are openly available in Harvard Dataverse at https://doi.org/10.7910/DVN/FBOYMJ (accessed on 15 April 2026).

Acknowledgments

During the preparation of this manuscript/study, the authors used ChatGPT (OpenAI; 5.1) and QuillBot (Course Hero, https://quillbot.com/, accessed on 15 April 2026) for the purposes of language editing, paraphrasing, improving clarity/readability, and refining grammar and style. The authors have reviewed and edited the output and take full responsibility for the content of this publication.

Conflicts of Interest

The authors declare no conflicts of interest.

Abbreviations

The following abbreviations are used in this manuscript:
4MAT4MAT Learning Model
AIArtificial Intelligence
CIConfidence Interval
CNCComputer Numerical Control
FCFlipped Classroom
FSSFlow State Scale
GTGrounded Theory
HC3Heteroscedasticity-Consistent standard errors (type 3)
HCIHuman–Computer Interaction
HMDHead-Mounted Display
HLHodges–Lehmann (estimate)
IEOInputs–Environment–Outcome (model)
IQRInterquartile Range
LMMLinear Mixed-Effects Model
OLSOrdinary Least Squares
Q–QQuantile–Quantile (plot)
RQResearch Question
SDStandard Deviation
SEStandard Error
STEAMScience, Technology, Engineering, Arts and Mathematics
SUSSystem Usability Scale
TAMTechnology Acceptance Model
UESUser Engagement Scale
UTAUT2Unified Theory of Acceptance and Use of Technology 2
UVUltraviolet
UV-CUltraviolet C
VLVirtual Laboratory
VRVirtual Reality
VLEVirtual Learning Environment
Wi-Fi 6Wireless Fidelity (IEEE 802.11ax)
UMLUnified Modeling Language

References

  1. Soodtoetong, N.; Rattanasiriwongwut, M. A Virtual Reality Model for STEM Education in Thailand. In Proceedings of the International Workshop on Artificial Intelligence for Signal, Image Processing and Multimedia; AI-SIPM ’24; Association for Computing Machinery: New York, NY, USA, 2024; p. 3. [Google Scholar] [CrossRef]
  2. Singh, G.; Mantri, A.; Sharma, O.; Kaur, R. Virtual Reality Learning Environment for Enhancing Electronics Engineering Laboratory Experience. Comput. Appl. Eng. Educ. 2021, 29, 229–243. [Google Scholar] [CrossRef]
  3. Wang, Y. Application of Virtual Reality Technique in the Construction of Modular Teaching Resources. Int. J. Emerg. Technol. Learn. (IJET) 2020, 15, 126–139. [Google Scholar] [CrossRef]
  4. Trigos, F.; Tamayo-Enriquez, F. A Transdisciplinary Framework for Engineering Education, Developing Tactical Engineering Decision Making Skills. In Proceedings of the Transdisciplinarity and the Future of Engineering; Advances in Transdisciplinary Engineering; IOS Press: Amsterdam, The Netherlands, 2022; Volume 28, pp. 609–618. [Google Scholar] [CrossRef]
  5. Liang, L.M. Applied Research of VR Technology in Civil Engineering Teaching. In Proceedings of the 2021 International Conference on Internet, Education and Information Technology (IEIT), Suzhou, China, 16–18 April 2021. [Google Scholar] [CrossRef]
  6. Wang, C.; Tang, Y.; Kassem, M.A.; Li, H.; Hua, B. Application of VR Technology in Civil Engineering Education. Comput. Appl. Eng. Educ. 2022, 30, 335–348. [Google Scholar] [CrossRef]
  7. Coutinho, G.S.; Magana, A.J.; Dias, V.D.R. A Framework for the Development of Online Virtual Labs for Engineering Education. In Proceedings of the 2023 ASEE Annual Conference & Exposition, Baltimore, MD, USA, 25–28 June 2023. [Google Scholar] [CrossRef]
  8. Çoban, M.; Okur Akçay, N.; Çelik, İ. Using Virtual Reality Technologies in STEM Education: ICT Pre-Service Teachers’ Perceptions. Knowl. Manag. E-Learn. Int. J. 2022, 14, 270–285. [Google Scholar] [CrossRef]
  9. Ghazinejad, M.; Khoshnoud, F.; Porter, S. Enhancing Interactive Learning in Engineering Classes by Implementing Virtual Laboratories. In Proceedings of the 2021 IEEE Frontiers in Education Conference (FIE), Lincoln, NE, USA, 13–16 October 2021. [Google Scholar] [CrossRef]
  10. Li, F.; Jiang, J.; Qin, Q.; Wang, X.; Zeng, G.; Gu, Y.; Guo, W. Application of Sustainable Development of Teaching in Engineering Education: A Case Study of Undergraduate Course Design of Raman Spectroscopy Based on Virtual Reality (VR) Technology. Sustainability 2023, 15, 1782. [Google Scholar] [CrossRef]
  11. Grigore, P.I.; Turcu, C.O. Integrating Virtual Reality into Engineering Education: An Interactive Application for Learning Mechanisms. In Proceedings of the International Conference on Virtual Learning; National Institute for Research & Development in Informatics: Bucharest, Romania, 2025; Volume 20, pp. 155–166. [Google Scholar] [CrossRef]
  12. Vergara, D.; Rubio, M.P.; Lorenzo, M. A Virtual Resource for Enhancing the Spatial Comprehension of Crystal Lattices. Educ. Sci. 2018, 8, 153. [Google Scholar] [CrossRef]
  13. Solmaz, S.; Van Gerven, T. Integration of Interactive CFD Simulations with AR and VR for Educational Use in CRE. In Computer Aided Chemical Engineering; Pierucci, S., Manenti, F., Bozzano, G.L., Manca, D., Eds.; Elsevier: Amsterdam, The Netherlands, 2020; Volume 48, pp. 2011–2016. [Google Scholar] [CrossRef]
  14. Alkhedher, M.; Mohamad, O.; Alavi, M. An Interactive Virtual Laboratory for Dynamics and Control Systems in an Undergraduate Mechanical Engineering Curriculum—A Case Study. Glob. J. Eng. Educ. 2021, 23, 55–61. [Google Scholar]
  15. Guzsvinecz, T.; Orbán-Mihálykó, É.; Perge, E.; Sik-Lányi, C. The Effect of Engineering Education on Spatial Ability in Virtual Environments. Acta Polytech. Hung. 2023, 20, 11–30. [Google Scholar] [CrossRef]
  16. Grewe, M.H.; Gie, L. Can Virtual Reality Have a Positive Influence on Student Engagement? S. Afr. J. High. Educ. 2023, 37, 124–141. [Google Scholar] [CrossRef]
  17. Anjos, F.E.V.d.; Martins, A.d.O.; Rodrigues, G.S.; Sellitto, M.A.; Silva, D.O.d. Boosting Engineering Education with Virtual Reality: An Experiment to Enhance Student Knowledge Retention. Appl. Syst. Innov. 2024, 7, 50. [Google Scholar] [CrossRef]
  18. Grigore, P.I.; Turcu, C.O. Impact of Virtual Reality on Pre-University Students. Rom. J. Inf. Technol. Autom. Control 2024, 34, 99–113. [Google Scholar] [CrossRef]
  19. Chung, C.C.; Tung, C.C.; Cheng, Y.M.; Lou, S.J. Development of a VR STEAM Welding Project Course. In Innovative Technologies and Learning; Huang, T.C., Wu, T.T., Barroso, J., Sandnes, F.E., Martins, P., Huang, Y.M., Eds.; Lecture Notes in Computer Science; Springer: Cham, Switzerland, 2020; Volume 12555. [Google Scholar] [CrossRef]
  20. Jindal, R.; Mittal, S.K.; Bansal, A. Engineering Education and the Use of Virtual Reality: Idea and Possibility. In Proceedings of the 2023 2nd Edition of IEEE Delhi Section Flagship Conference (DELCON), Rajpura, India, 24–26 February 2023; pp. 1–7. [Google Scholar] [CrossRef]
  21. Extremera, J.; Vergara, D.; Rodríguez, S.; Dávila, L.P. Reality-Virtuality Technologies in the Field of Materials Science and Engineering. Appl. Sci. 2022, 12, 4968. [Google Scholar] [CrossRef]
  22. Parlier, J. Enhancing Advanced Manufacturing and Engineering Instruction with Augmented and Virtual Reality (AR/VR). In Proceedings of the 2022 CIEC, Tempe, AZ, USA, 17 April 2024. [Google Scholar] [CrossRef]
  23. Burgos-Lopez, M.Y.; del Carmen Bumas-Azcannio, M.; Turcios-Esquivel, A.M. Virtual Reality to Enhance User Satisfaction in an Engineering Innovation Project. In Proceedings of the 2024 IEEE Global Engineering Education Conference (EDUCON), Kos Island, Greece, 8–11 May 2024; pp. 1–7. [Google Scholar] [CrossRef]
  24. Ro’fatulhaq, H.; Wicaksono, S.A.; Falah, M.F.; Sukaridhoto, S.; Zainuddin, M.A.; Rante, H.; Al Rasyid, M.U.; Wicaksono, H. Development of Virtual Engineering Platform for Online Learning System. In Proceedings of the 2020 International Conference on Computer Engineering, Network, and Intelligent Multimedia (CENIM), Surabaya, Indonesia, 17–18 November 2020; pp. 185–192. [Google Scholar] [CrossRef]
  25. Cordero-Guridi, J.d.J.; Cuautle-Gutiérrez, L.; Alvarez-Tamayo, R.I.; Caballero-Morales, S.O. Design and Development of a I4.0 Engineering Education Laboratory with Virtual and Digital Technologies Based on ISO/IEC TR 23842-1 Standard Guidelines. Appl. Sci. 2022, 12, 5993. [Google Scholar] [CrossRef]
  26. Mahmood, K.; Otto, T.; Kuts, V.; Terkaj, W.; Modoni, G.; Urgo, M.; Colombo, G.; Haidegger, G.; Kovacs, P.; Stahre, J. Advancement in Production Engineering Education through Virtual Learning Factory Toolkit Concept. Proc. Est. Acad. Sci. 2021, 70, 374–382. [Google Scholar] [CrossRef]
  27. Saptadi, S.; Arliawan, M.A.; Nurkertamanda, D.; Widharto, Y.; Wicaksono, P.A. Development of Virtual Laboratory Applications Based on Virtual Reality Using the Requirements Engineering Method. In IOP Conference Series: Materials Science and Engineering; IOP Publishing: Bristol, UK, 2021; Volume 1072, p. 012075. [Google Scholar] [CrossRef]
  28. Cook-Chennault, K.; Farooq, A. A Validated Assessment Tool: Students’ Perceived Value of Engineering Laboratories in a Virtual Environment. Int. J. Eng. Educ. 2023, 39, 860–876. [Google Scholar]
  29. Dianova, Y.; Stolbova, I.; Tarasova, L. From Assembly Drawing to Virtual Model: Manufacturing Technologies in Engineering Education. In Proceedings of the 2024 7th International Conference on Information Technologies in Engineering Education (Inforino), Moscow, Russia, 16–19 April 2024; pp. 1–4. [Google Scholar] [CrossRef]
  30. Hamurcu, A.; Timur, Ş; Rızvanoğlu, K. A Study on the Adoption of Virtual Reality in Industrial Design Education. IEEE Trans. Learn. Technol. 2023, 16, 900–913. [Google Scholar] [CrossRef]
  31. Grigore, P.I.; Turcu, C.O. Evaluating the impact of virtual reality on student engagement and conceptual understanding in engineering education. Next Res. 2026, 3, 101172. [Google Scholar] [CrossRef]
  32. Vergara, D.; Antón-Sancho, Á.; Lampropoulos, G.; Fernández-Arias, P. Educational Use of Virtual Reality Technologies in Engineering Education: The Impact of the Digital Generation of Faculty. Educ. Inf. Technol. 2025, 30, 12807–12825. [Google Scholar] [CrossRef]
  33. Castro-Gutiérrez, N.; Flores-Cruz, J.; Acosta-Magallanes, F. Design and Implementation of a Virtual Laboratory for Electromagnetics Teaching in Engineering. In Proceedings of the CISETC 2021: International Congress on Educational and Technology in Sciences, Chiclayo, Peru, 16–18 November 2021; Volume 3037, pp. 105–113. [Google Scholar]
  34. Li, X.; Tian, Y.; Ye, P.; Duan, H.; Wang, F.Y. A Novel Scenarios Engineering Methodology for Foundation Models in Metaverse. IEEE Trans. Syst. Man Cybern. Syst. 2023, 53, 2148–2159. [Google Scholar] [CrossRef]
  35. Ntunka, M.G.; Maladzhi, R.W.; Mthombeni, N.H.; Nemavhola, F. Enhancing Project-Based Learning in Engineering Disciplines Through Emerging Technologies: A Systematic Literature Review. In Proceedings of the 2024 World Engineering Education Forum-Global Engineering Deans Council (WEEF-GEDC), Sydney, Australia, 2–5 December 2024; pp. 1–9. [Google Scholar] [CrossRef]
  36. Grigore, P.I.; Turcu, C.O.; Zaharia, A.; Nedeff, V. A VR Lesson Architecture for Environmental Engineering: Five Scenario Designs. In Proceedings of the International Conference on Virtual Learning; National Institute for Research & Development in Informatics: Bucharest, Romania, 2026; Volume 21, pp. 371–386. [Google Scholar] [CrossRef]
  37. Estriegana, R.; Medina-Merodio, J.A.; Barchino, R. Student Acceptance of Virtual Laboratory and Practical Work: An Extension of the Technology Acceptance Model. Comput. Educ. 2019, 135, 1–14. [Google Scholar] [CrossRef]
  38. Chen, H.M.; Nguyen, B.A.; Chang, Y.W.; Dow, C.R. A Gamified Method for Teaching Version Control Concepts in Programming Courses Using the Git Education Game. Electronics 2024, 13, 4956. [Google Scholar] [CrossRef]
  39. Vlahovic, S.; Suznjevic, M.; Skorin-Kapov, L. A Framework for the Classification and Evaluation of Game Mechanics for Virtual Reality Games. Electronics 2022, 11, 2946. [Google Scholar] [CrossRef]
  40. Jackson, S.A.; Marsh, H.W. Development and Validation of a Scale to Measure Optimal Experience: The Flow State Scale. J. Sport Exerc. Psychol. 1996, 18, 17–35. [Google Scholar] [CrossRef]
  41. Kyriazos, T.; Stalikas, A.; Prassa, K.; Galanakis, M.; Flora, K.; Chatzilia, V. The Flow Short Scale (FSS) Dimensionality and What MIMIC Shows on Heterogeneity and Invariance. Psychology 2018, 9, 1357–1382. [Google Scholar] [CrossRef]
  42. O’Brien, H.L.; Cairns, P.; Hall, M. A Practical Approach to Measuring User Engagement with the Refined User Engagement Scale (UES) and New UES Short Form. Int. J. Hum.-Comput. Stud. 2018, 112, 28–39. [Google Scholar] [CrossRef]
  43. Brooke, J. SUS: A Quick and Dirty Usability Scale. In Usability Evaluation in Industry; Jordan, P.W., Thomas, B., Weerdmeester, A., McClelland, I.L., Eds.; Taylor & Francis: London, UK, 1996; pp. 189–194. [Google Scholar]
  44. Bangor, A.; Kortum, P.T.; Miller, J.T. An Empirical Evaluation of the System Usability Scale. Int. J. Hum.–Comput. Interact. 2008, 24, 574–594. [Google Scholar] [CrossRef]
  45. Chen, C.; Chen, L.; Shen, N.; Luo, C.; Wang, R.; Fang, H.; Zhang, Q.; Hei, Z. The use of virtual reality to reduce stress among night-shift anesthesiologists: Study protocol for a crossover trial. Trials 2021, 22, 257. [Google Scholar] [CrossRef]
Figure 1. Assembly Stage in Virtual Reality.
Information 17 00382 g001
Figure 2. System Simulation and UV Dose Control Interface.
Information 17 00382 g002
Figure 3. Traditional laboratory lesson using the physical UV disinfection stand.
Information 17 00382 g003
Figure 4. Normal Q-Q plots for Flow State Scale total scores in the VR condition (left panel) and the Traditional condition (right panel). The blue line represents the expected quantiles under a normal distribution, while the dots represent the observed quantiles of the data. Deviations from the line indicate departures from normality.
Information 17 00382 g004
Figure 5. Normal Q-Q plots for User Engagement Scale total scores in the VR condition (left panel) and the Traditional condition (right panel). The blue line represents the expected quantiles under a normal distribution, while the dots represent the observed quantiles of the data. Deviations from the line indicate departures from normality.
Information 17 00382 g005
Table 1. Participant Demographics by sequence.
CharacteristicVR-First SequenceTrad-First SequenceTotal Sample
(n = 26)(n = 26)(n = 52)
Age (years)
       Mean (SD)22.6 (2.5)25.6 (7.3)24.1 (5.6)
       Range20–3320–4520–45
       Typical undergraduate age (20–24)241943
Gender
       Male21 (80.8%)22 (84.6%)43 (82.7%)
       Female5 (19.2%)4 (15.4%)9 (17.3%)
Table 2. Participant allocation and complete cases for self-report outcome measures.
Sequence 1PeriodConditionFSS_TotalUES_TotalSUS_Total
Trad-first1Trad26260
2VR262626
VR-first1VR262626
2Trad26260
Total 10410452
Table 3. Baseline technology profile and pre-existing knowledge by sequence group.
MeasureTrad-First (n = 26)VR-First (n = 26)
Familiarity with VR (1–5)3.193.36
Technology Accommodation (1–5)3.813.90
VR Interest (1–5)4.244.84
Emerging Technologies (1–5)4.584.77
Pre-test Item 5.1 (proportion correct)0.960.96
Pre-test Item 5.2 (proportion correct)0.810.92
Pre-test Item 5.3 (proportion correct)0.650.81
Pre-test mean (Items 5.1–5.3, proportion)0.810.90
Table 4. Non-parametric comparisons of perceived flow (FSS) and engagement (UES) between VR and Traditional conditions.
ComparisonScaleTest Statisticzp-ValueCliff’s δ HL Δ [95% CI]Direction
Between-condition
(Mann–Whitney)
FSSU = 1974.54.08< 0.001 0.463.00 [1.00, 4.00]VR higher
Between-condition
(Mann–Whitney)
UESU = 1751.52.550.0060.301.00 [0.00, 3.00]VR higher
Within-subject
(Wilcoxon)
FSSW = 139.5−4.05< 0.001 2.00 [1.00, 3.00]VR higher
Within-subject
(Wilcoxon)
UESW = 88.0−3.31< 0.001 0.50 [0.00, 2.00]VR higher
Note. Cliff’s δ represents the rank-based effect size for between-condition contrasts. HL Δ denotes the Hodges–Lehmann estimate of the median VR minus Traditional difference, followed by its 95% confidence interval. The negative z-values in Wilcoxon tests reflect the test’s calculation method; all tests suggest VR > Traditional. All tests are two-tailed and relate to self-reported perceptions of experience.
Table 5. Model coefficients for perceived flow and engagement from linear mixed models and OLS robustness checks.
FSSUES
PredictorLMM Coef. (SE)OLS-HC3 Coef. (SE)LMM Coef. (SE)OLS-HC3 Coef. (SE)
Intercept19.96 (0.59) ***19.96 (0.65) ***29.85 (0.62) ***29.85 (0.77) ***
Condition (VR)2.15 (0.51) ***2.09 (0.49) ***1.79 (0.48) ***1.93 (0.54) ***
Period (2)−0.77 (0.51)−0.84 (0.51)−0.10 (0.48)0.04 (0.58)
Sequence (VR-first)0.92 (0.65)0.99 (0.52)2.67 (0.74) ***2.53 (0.59) ***
Condition × Period0.13 (0.36)−0.28 (0.32)
Note. LMM = Linear Mixed Model; OLS-HC3 = Ordinary Least Squares with heteroscedasticity-consistent standard errors. Reference categories: Condition = Traditional, Period = 1, Sequence = Trad-first. *** p < 0.001. Coefficients are interpreted as associations with self-reported experience scores in this feasibility study.
Table 6. Item-level descriptive statistics for the SUS items by crossover sequence group.
ItemSUS Item (English/Romanian)Trad-FirstVR-First
MSDMSD
1I think I would like to use this application frequently./Aș dori să folosesc frecvent o aplicație ca aceasta.3.350.983.770.51
2 *I found the application unnecessarily complex./Aplicația a fost inutil de complexă.3.121.113.920.27
3I thought the application was easy to use./Aplicația a fost ușor de folosit.3.310.883.810.40
4 *I think I would need technical support to use this application./Cred că aș avea nevoie de suport tehnic pentru a o folosi.2.421.423.420.76
5I found the various functions in this application were well integrated./Funcțiile aplicației par bine integrate.3.380.753.850.37
6 *I thought there was too much inconsistency in this application./Am observat inconsistențe în aplicație.2.691.093.650.75
7I imagine that most people would learn to use this application very quickly./Mi-a fost ușor să învăț cum funcționează aplicația.3.380.753.730.53
8 *I found the application very cumbersome to use./Aplicația a fost greoaie sau dificil de utilizat.3.351.263.880.43
9I felt very confident using the application./M-am simțit încrezător(ă) când am folosit aplicația.3.380.703.650.56
10 *I needed to learn a lot of things before I could get going with this application./A trebuit să învăț multe lucruri înainte de a folosi aplicația.2.921.263.650.75
Note. Items marked * are negatively worded and reverse-scored in SUS computation. Means reflect raw responses on a 5-point scale (1 = strongly disagree, 5 = strongly agree) before recoding. English wording adapted from Brooke [43].
Table 7. SUS acceptability ratings and adjective benchmarks by sequence group.
Usability CategorySUS RangeTrad-First (n = 26)VR-First (n = 26)
Acceptability level
    Acceptable70–10020 (77%)25 (96%)
    Marginal50–69.95 (19%)1 (4%)
    Not acceptable0–49.91 (4%)0 (0%)
Adjective rating
    Excellent85–10010 (38%)23 (88%)
    Good70–84.910 (38%)2 (8%)
    OK50–69.95 (19%)1 (4%)
    Poor0–49.91 (4%)0 (0%)
Table 8. Spearman correlation matrix for the VR condition.
Variable12345678
1. Familiarity1.00
2. Tech accommodation0.581.00
3. VR Interest0.110.251.00
4. Emerging Tech0.190.250.721.00
5. Pre Total0.730.750.630.641.00
6. FSS−0.030.230.300.280.271.00
7. UES0.210.210.420.510.450.651.00
8. SUS0.060.180.340.280.280.400.511.00
Table 9. Spearman correlation matrix for the Traditional condition.
Variable1234567
1. Familiarity1.00
2. Tech accommodation0.581.00
3. VR Interest0.110.251.00
4. Emerging Tech0.190.250.721.00
5. Pre Total0.730.750.630.641.00
6. FSS−0.080.190.010.160.091.00
7. UES0.150.240.230.450.380.591.00
Table 10. Summary of open-ended question responses.
QuestionResponsesAbstentions
4.1 What did you like most about the VR lesson?33 (63.46%)19 (36.54%)
4.2 What was clearer or easier to understand in VR compared to traditional methods?32 (61.54%)20 (38.46%)
4.3 What difficulties did you encounter during the VR lesson (if any)?22 (42.31%)30 (57.69%)
4.4 If you could choose, how would you prefer to learn in the future?50 (96.15%)2 (3.85%)
4.5 Additional comments or suggestions regarding the VR lesson0 (0%)52 (100%)
Note. Percentages are calculated out of 52 participants. “Responses” indicates participants who provided a non-empty answer; “Abstentions” includes omitted or “no comment” entries.
Table 11. Positive aspects of the VR lesson.
ThemeFrequencyPercentageExample Responses
1928.36%
Clarity1116.42%“The way the lesson was explained.”, “Theory by drone + simulation”
Interactivity811.94%“Step-by-step presentation: theory, practice, simulation”
Practicality710.45%“Easy and practical learning process”
Autonomy57.46%“I liked that we assembled everything ourselves.”
Simulation57.46%“I liked experimenting with the disinfection process.”
Accessibility45.97%“It was more pleasant and interesting.”
Other positive impressions811.94%“Everything., It was my first time and I liked it all., Realistic design”
Table 12. Comparative advantages of VR.
ThemeFrequencyPercentageExample Responses
Clarity1521.74%“Easier to learn the components and how the system works”
Practicality1115.94%“Assembly of the system components”
Specific Content811.59%“Component layout and function”
Interactivity57.25%“Being able to interact with the filtration system”
Novelty34.35%“It’s more innovative.”, “It was new to me.”
Other positive aspects710.14%“Everything.”, “All of it”, “It involves you more in the learning process.”
Table 13. Difficulties in the VR experience.
ThemeFrequencyPercentageExample Responses
No Difficulties3363.46%“None encountered.”
Initial Adjustment1223.08%“It was a bit hard at first, but I got used to it quickly.”
Movement Control47.69%“Controlling movements was tricky.”
Other minor difficulties23.85%“Learning how to use the app”, “Manipulating the device was a bit difficult.”
-11.92%-
Table 14. Instructional method preferences.
Preferred MethodFrequencyPercentage
Combination of VR and traditional4688.5%
Only VR47.7%
No valid response23.8%
Table 15. Suggestions for VR lesson improvement.
ThemeFrequencyPercentageExample Responses
-3054.5%
No Suggestions1120.0%“No improvements needed.”, “First experience, can’t comment.”
More Content59.1%“More practice sessions.”, “More interactive games”
Clarity/Structure23.6%“The steps could be clearer.”
Content Expansion11.8%“Better understanding of the process”
More VR Lessons11.8%“Use VR in more classes.”
Gamification11.8%“Include objectives or tasks like in games”
Graphics11.8%“Improve graphic realism”, “Allow grabbing/moving objects from a distance”
Disclaimer/Publisher’s Note: The statements, opinions and data contained in all publications are solely those of the individual author(s) and contributor(s) and not of MDPI and/or the editor(s). MDPI and/or the editor(s) disclaim responsibility for any injury to people or property resulting from any ideas, methods, instructions or products referred to in the content.