Abstract
Electroencephalography (EEG), electromyography (EMG), galvanic skin response (GSR), and electrocardiogram (ECG) are among the techniques developed for collecting psychophysiological data from humans. This study presents a feature extraction technique for identifying emotions in EEG-based data from the human brain. Independent component analysis (ICA) was employed to eliminate artifacts from the raw brain signals before applying signal extraction to a convolutional neural network (CNN) for emotion identification. These features were then learned by the proposed CNN-LSTM (long short-term memory) algorithm, which includes a ResNet-152 classifier. The CNN-LSTM with ResNet-152 algorithm was used for the accurate detection and analysis of human emotional data. The SEED V dataset was employed for data collection in this study, and the implementation was carried out using an Altera DE2 FPGA development board, demonstrating improved performance in terms of FPGA speed and area optimization.
1. Introduction
Emotional intelligence heavily relies on the ability to recognize and interpret emotions. In numerous experiments in affective computing, visual stimuli have been employed to evoke human emotions. Individuals may respond emotionally to these visual stimuli when exposed to them. These emotional responses reflect how the subjects perceive the given situation and stimulus. Additionally, several studies conducted by cognitive scientists, neuroscientists, and psychologists have underscored the pivotal role that emotions play in logical and intelligent thinking. Researchers are increasingly acknowledging brain activity as a means to assess an individual’s mental and emotional state [1]. EEG is a technique for electro-physiologically monitoring and recording brain activity. EEG signals generate distinct patterns that depend on the subject’s moods, including valence, arousal, and concentration. EEG aims to quantify voltage variations caused by ionic currents in the primary ventral striatum. There are five sub-bands that determine the EEG signal, namely alpha (8 to 16 hertz), which is found in the posterior portions of the skull, beta (16 to 32 hertz), which occurs whenever the human brain is busy and focused on something, gamma (32 to 64 hertz), delta (0 to 4 hertz), and theta (4 to 8 hertz), which is slower in performance. These frequency sub-bands effectively represent brain dynamics. Generally, these sub-bands provide more insightful data on neuronal activities and reveal changes that may not be apparent in the original EEG signal.
Emotion-based EEG extraction of features and categorization of brain signal patterns are now interesting research areas. The EEG patterns produced by emotional tasks are also applicable. With the use of brain–computer interface (BCI) devices based on EEG, these patterns are useful for helping persons with disabilities convey their feelings. Additionally, it has the potential to be used for a variety of tasks, from daily living to meeting the needs of people with brain disorders, such as operating a car, controlling a cursor, playing a game, and interacting with autistic patients, among other things.
Generally, EEG signals are obtained from multiple brain regions, and there is a possibility for these regions to generate overlapping electrical activity signals. In addition, EEG signals are frequently contaminated with various types of artifacts, such as eye movements, muscle activity, and other environmental noise. Therefore, before using EEG signals for emotion recognition, preprocessing is essential. To address this, the proposed method employs ICA and an adaptive filter for preprocessing. ICA plays a pivotal role in EEG monitoring as it enhances the quality of recordings [2,3], extracts the required information from mixed signal data, and contributes to our understanding of brain function and dysfunction in a variety of research and clinical contexts. The EEG signal is further processed using an adaptive filter to smooth the signal.
This work is motivated by the need to advance real-time emotion recognition systems through efficient hardware implementations. Our contribution involves the fusion of ICA and adaptive filtering within an FPGA framework to boost the precision and speed of emotion recognition. By harnessing the LSTM-ResNet-152 algorithm, we strive to offer a robust solution for recognizing emotions across diverse applications, ranging from healthcare to human–computer interaction. ResNet-152 is a deep network with 152 layers. It can be used to learn deep features and, in this research article, focus on emotion recognition using FPGA. Even if the data size increases, ResNet-152 can handle the feature extraction without modifying the FPGA. Significantly, our research showcases the substantial performance optimization achievable with FPGA technology in emotion recognition systems, thus opening doors to more practical and real-time applications in the continually evolving domains of human emotional analysis and artificial intelligence. Furthermore, we demonstrate how the integration of ICA with CNN yields multiple advantages, including feature extraction, dimensionality reduction, and improved emotion recognition. The implementation of this system on an FPGA, utilizing the Altera DE2 development board, underscores its practicality and efficiency.
The structure of this research work is organized as follows: Section 2 provides an overview of related works, Section 3 presents the paradigm, Section 4 assesses the experimental framework and the effectiveness of the proposed work, which is compared with prior research in Section 5, and finally, Section 6 concludes the work.
2. Related Works
The study of the links between EEG signal and emotions has received a lot of interest. In [4], the authors proposed an EEG-based emotional detection system based on a Discriminant Graph-Regularized Extreme Learning Machine model (DG-RELM), which significantly improves the stability of the same subject’s repeated EEG across time. This technique was validated using emotional datasets such as DEAP and SEED. In [5], the authors suggested a physiologically heuristic feedforward neural network structure for identifying emotional states with EEG. In order to reduce redundant characteristics among the principal components and increase the accuracy of emotion classification, principal component analysis (PCA) is employed in the model’s implicit layer. This is carried out in accordance with the interaction of brain neural networks in individual emotional perception. A facial expression recognition system using FPGA is explained in [6] by the author; in this approach, the FER2013 dataset is taken for analysis and implemented in FPGA zynq-7000, and they use sliding windows to improve the performance. The development of a portable, simple emotion detector using PCA is explained by authors in [7]; this proposed design optimizes the design by employing only the necessary number of chosen Eigen values, known as the Eigen range, rather than calculating all the Eigen values and Eigen vectors. The Eigen values are acquired via a power-deflation iteration process. The Virtex 7 FPGA is used to implement the suggested emotion recognizer architecture. For an 8-bit word length, the researchers achieved 82.3% detection accuracy. The clinical verification of fully digital neonatal epileptic detection was examined in [8]. Inter EEG and single-channel ECG data are used in the novel techniques that are being developed for the detection of infant seizures. This article suggests feature fusion and classifier fusion as two approaches to combining EEG and Heart Rate Variability (HRV). By integrating the autonomous judgements made by separate HRV and EEG learners, distinctive vectors derived from EEG and HRV data were added to the feature fixation simultaneously.
This resulted in a variety of classifications. EEG signal emotion recognition by DEAP, HEAP, SEED, and SEED IV is explained in [9,10,11,12,13,14,15]. In these approaches, different types of algorithms are used to segregate the emotions from EEG signals [16]. The author demonstrated hybrid CNN and LSTM classification-based EEG-based emotion recognition. The ResNet-152 algorithm is used in the technique to identify emotions. The EEG data, brain wave patterns, and emotion analyses are all examined in this study. Based on the results of human behavior and post-traumatic stress disorder, all of these are associated. The effects of long-term sickness from post-traumatic stress disorder are linked to severe pain, disability, and social/emotional impairment. A unique kind of ANN that can be employed for noise cancellation in an auditory environment is constructed in FPGA [17]. In this procedure, an adaptive filter is used after the ICA. Numerous algorithms and designs have been developed in recent decades, but their implementation in portable, low-power devices requires a significant amount of processing time and space, which increases resource complexity [18,19]. The presented work demonstrates superior improvement in the area and power for emotion identification while being implemented in FPGA in order to overcome these difficulties. Recent comprehensive work related to emotion recognition using physical and psychological signals is presented in [20,21]. In [22,23], the authors presented the challenges and possible solutions of emotion recognition implementation in FPGA. A survey about deep learning-based, non-invasive brain signals is presented in [24], which provides the taxonomy of brain signals and learning via deep learning. Decoding brain performance from non-invasive EEG signals is explained in [25], which provides the EEG decoding algorithms for analysis.
3. Paradigm
3.1. Frequency Domain (FD)
FD analysis, which is commonly recognized by spectroscopic data, is also the most basic yet effective and frequently employed method for EEG analysis. Data analysis is the act of revealing information stored in the frequency response of EEG waveforms using Fourier transform algorithms. The most commonly used spectral approach is a power spectrum analyzer, which displays the signal’s ‘frequency content,’ or the pattern of transmitting intensity over frequency.
3.2. Time Domain (TD)
Linear prediction and component analysis are the most extensive EEG studies in TD. In general, linear prediction produces an estimated value which includes the prior production value as well as the present and previous contribution values. Component analysis, on the other hand, is an unsupervised method for converting a dataset into a set of features. Additionally, the factors involved in time-domain approaches were entirely dependent on time, despite the large spectrum used to obtain them. As a result, the time-domain technique bridges the gap between classical spectral analysis and physical time interpretations. Furthermore, time-domain approaches provide on-the-fly units of measurement of basic signal characteristics using a time-based mathematical formulation, which requires less complex equipment than standard frequency analysis.
3.3. Time-Frequency Domain (TF)
The wavelet transform, a typical TF domain method, may extract and define features from transitory biological data. Using the wavelet decomposition of EEG data, temporary properties were accurately recorded and localized in both temporal and frequency settings. As a result, the wavelet transform functions as an arithmetic microscope, allowing researchers to examine neurologic rhythm scales and focus on local oscillations of neural activity while ignoring the impacts of other scales. Aside from the wavelet transform, another popular time-frequency method for obtaining instantaneous frequency data is the Hilbert–Huang transform, which divides EEG signals into oscillatory components termed the Intrinsic Mode Function (IMF).
4. Experimental Framework
A general block diagram of the brain–computer interface unit (BCI) for EEG collection and extraction of features for emotion recognition is shown in Figure 1 below. In this, the EEG signal is collected from a human and preprocessed using ICA to split the mixed signals into individuals. Since EEG signals are mixed with other artefacts like eye movement and other muscle activities, the collected signals will be mixed signals with other artefacts.
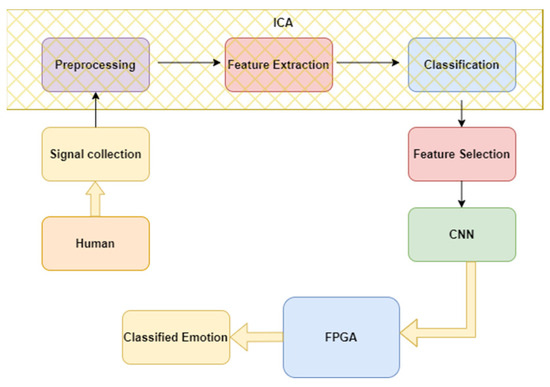
Figure 1.
General block diagram of BCI.
Figure 2 depicts the proposed architecture for long short-term memory (LSTM)-based emotion detection. The suggested system consists of two primary components: preprocessing, which involves feature selection and extraction using ICA, and dimension reduction using a single MAC FIR filter. Signal smoothing is achieved through the use of an FIR filter. CNN is then employed for emotion recognition in conjunction with retinal activation. The optimal structure is iteratively determined using an LSTM classifier. This combined approach simplifies and streamlines the planned work by integrating LSTM and ResNet-152.
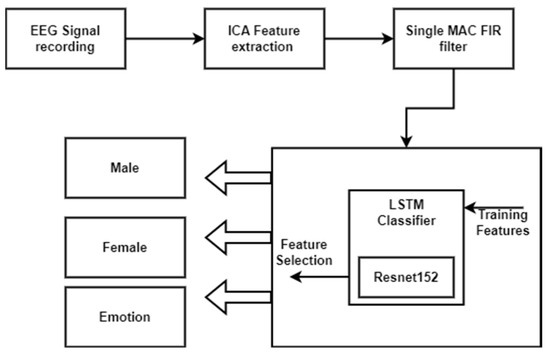
Figure 2.
Proposed LSTM classifier architecture system.
4.1. EEG Signal
The proposed system employs the SEED V EEG dataset, which includes emotions such as happiness, disgust, fear, neutrality, and sadness. This open access dataset is used for data collection in the system. The primary goal of the preprocessing phase is to prepare the data for input into the EEG channels. Raw EEG data are downsampled to 200 hz first; then, to filter the noise and artifacts, the EEG data are processed based on the characteristics of the MFCC (Mel Frequency Cepstral Coefficient) method and bandpass filter using entropy and ICA settings. SEED V is the name of the emotion dataset offered by the BCMI Laboratory. The EEG signals and eye movements of sixteen subjects for five different emotions—angry, pleased, fearful, sad, and neutral—are included in this publicly accessible dataset. A preprocessed noise-free differential entropy feature set has been made available by SEED V. Five sub-bands and sixty-two channels are utilized to extract the DE characteristics. The shape of the DE provided by the SEED V dataset is as follows: Data: (29,168, 310); Data: (rows = 3 sessions data × 16 participants, cols = 62 channels × 5 bands); Label: (29,168, 5); Label: (rows = 3 sessions data × 16 participants, cols = 5 emotions). The features include the average power of the signals across all frequency bands (alpha, gamma, beta, theta, and delta) for the relevant channels. These emotions are elicited from humans and controlled by BCI through channels connected to locations such as Frontal Pole 1 (FP1), Frontal Pole 2 (FP2), FC6, F3, and others. From the available dataset, 70% of the data are used for training, and 30% of the data are used for testing. The size of the feature set used is 29,168 × 310 (for training, 20,418 × 310; for testing, 8750 × 310), and a 5-fold cross validation is used.
4.2. Independent Component Analysis
A popular technique for decomposing EEG data is ICA, which has been extensively researched over the past two decades. In numerous signal processing applications, such as voice, image, and biological signal processing, ICA has proven to be an effective method for resolving blind source separation (BSS) issues. Many organizations are currently exploring the potential of BSS to extract unique information from physical signals and brain activity.
General ICA can process raw data, demix it, and separate it into individual signals. Advances in signal processing techniques now make it possible to integrate these cutting-edge algorithms into real-time FPGA systems for BCI applications. Cocktail party signal processing issues were addressed by ICA. Different signals produced by diverse physical sources have requirements. These signals could be radio waves from numerous mobile phones in the same area, electric impulses from various brain regions, vocal signals received from various people speaking in the same room, or signals from separate brain areas. Due to space limitations, the sensors are positioned differently, which causes the mixtures to vary from one another. In reality, only the mixed signals from sensors are known, while the information about the original signals and the mixing system is unknown. BSS is the method for separating the original signals from those blended as a result. The BSS issue is illustrated in Figure 3 below, showing source signals from different source environments, collected together as mixed signals, which can then be separated using machine learning algorithms to recover the original signals, which are shown in the figure.
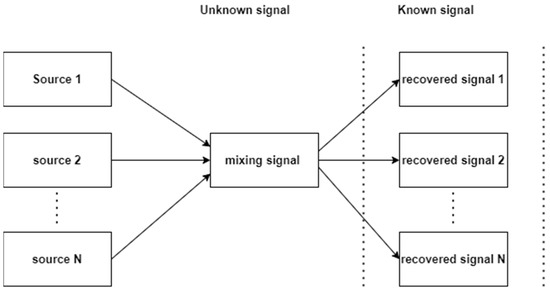
Figure 3.
Mixing and recovering process of BSS.
The use of ICA is illustrated in Figure 4. The data signal includes the mixed signal, which consists of many error signals that are mixed with many signals from the environment. By applying ICA to that signal, it is possible to remove the errors and recover the required signal.
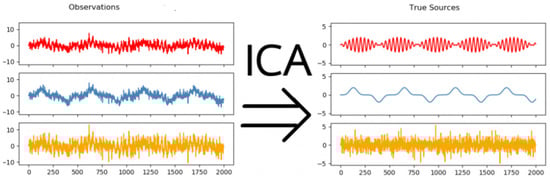
Figure 4.
Illustration of mixed signal extraction by ICA.
4.3. FIR Filter
To obtain precise results, the recorded EEG signal needs to be filtered initially. Here, the noisy signal is processed using a low-pass FIR adaptive filter. In a general adaptive FIR structure, the input signal x(n) is subtracted from the desired signal d(n) to calculate the error signal, which can be expressed as
e(n) = d(n) − x(n)
This error signal is then applied as the input to the least mean square (LMS) algorithm for coefficient updating. This process is iteratively continued until a feasible output is obtained. In the existing adaptive filters shown in Figure 5, the number of multipliers and adders increases in relation to the number of filter taps. While digital filters are commonly used in biomedical applications due to their stability, the proliferation of multipliers and adders results in hardware complexity in real-time applications. To address this, the proposed system replaces multiple multipliers and adders with a single Multiply and Accumulate (MAC) adaptive filter. The structure of the single MAC adaptive filter is illustrated in Figure 6, where a single multiplier and a single adder are used in place of multiple instances of these components. The MAC operation is employed to accumulate and add the results from individual taps. Finally, the LMS concept is implemented using the updated coefficients to obtain a feasible output.
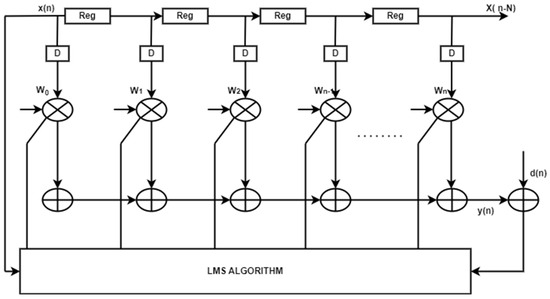
Figure 5.
Existing adaptive FIR filter.
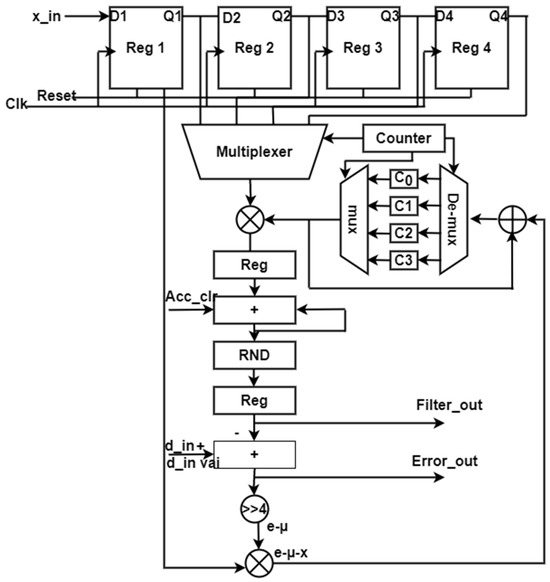
Figure 6.
Single MAC adaptive filter structure.
4.4. Convolutional Neural Network Model
In recent years, CNNs have gained popularity and have been widely employed as a deep neural network technique in various applications such as medical diagnosis [26], optical camera communication [27], and road classification [28]. CNNs consist of three primary feature layers: convolutional, pooling, and fully connected layers, with an additional layer known as the activation function layer. Among these, the convolutional layer is a crucial component that performs mathematical operations in a stacked, specialized linear operation. The fully connected layer transforms the extracted features into classification-related outputs. CNN is a deep learning model designed to handle data organized in a grid pattern, as exemplified by images. The organization of the animal visual brain has served as an inspiration for the development of CNN, with the goal of automatically and adaptively learning spatial hierarchies of features, ranging from low-level patterns to high-level patterns.
The basic structure of a CNN for feature extraction is depicted in Figure 7. CNNs are used to categorize items into K distinct classes based on a set of attributes. In this process, the object is classified using the quadratic sum of the distance between it and the relevant cluster. A deep learning technique called CNN is employed to assess image visualization. Due to a shared-weight Fourier design that scans the hidden units and their translational affine features, they were known as shift-neutral spatially artificial neural networks. Some examples of applications are image and video recognition, picture cataloging, segmentation, visualization, evaluation of text, the nervous system, and economic time series.
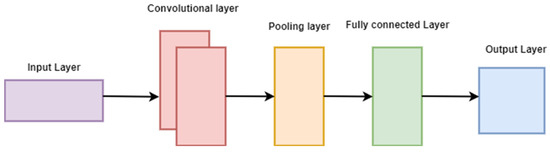
Figure 7.
Feature extraction of CNN.
Multilayer perceptrons in regularized CNN variations. Every neuron in a layer is typically coupled to every synapse in layers above in multilayer perceptrons, which are frequently fully connected systems. Both of these are “completely interrelated”. Data overfitting is a problem in networks. Changing the load when the error rate drops and randomly severing connections are common regularization approaches. CNNs use a different kind of regularization: they break down larger structures into smaller ones that are imprinted in the filters, and then use those structures to build increasingly complicated patterns depending on the patterns that others have observed in the data. Convents are therefore at the extremes of connectivity and intricacy.
Due to biochemical changes, fully convolutional neurons are connected in a manner that is compatible with the design of the vertebrate visual cortex. Feedforward neural inputs are only reacted to by a tiny subset of the theoretical neurons, or the vision field. The visual field is spanned because some of the activations of different neurons partially overlap.
CNNs require less preprocessing than specific conventional image processing methods. This suggests that the filtering is improved by the network rather than earlier hand inversion kernel construction methods. An important advantage is the fact that feature extraction does not depend on historical data or human engagement.
As shown in Figure 7, CNN inputs are structured as matrices with dimensions (number of images) × (height) × (width) × (input channels). The number of images in the shape is multiplied by the width and height of the feature map before entering the first convolutional layer. The hyper-parameters for the height and width of kernels/convolutional filters serve as identifiers. The number of channels in the convolutional kernel or the number of filters must match the network’s feature map size. Convolutional hyper-parameters include stride and padding. Convolutional layers concatenate the input before passing the output to the next layer. This process is similar to how a single occipital lobe cell responds to a particular input. Each convolutional neuron processes data only within its receptive region. Although not ideal for general image classification, closely connected CNNs can be used for tasks such as face recognition and emotion detection.
Handling large input sizes, such as those associated with images, requires each pixel to be a key variable, demanding the use of numerous hidden synapses and intricate network design. Absolute or relative convolution can be used in convolutional networks to speed up fundamental processing. Pooling layers reduce the size of the dataset by combining the responses of neuronal groups on a thin layer into a nerve cell on the following layer. Small clusters are connected by local pooling, typically two or more. All of the neurons in the convolutional layer are impacted by global pooling. The two categories of pooling are maximal and average. In max pooling, the values calculated for each group using activations from the previous layer are used, whereas in average pooling, the anticipated average is used.
The convolutional layer of a CNN is its most significant element. The sequence of kernels or convolutional layers, along with the small perceptron types, defines each layer’s characteristics, which completely encompass the complexity of the input volume. Each filter is convolved over the breadth and quantity of the output during the front pass, generating a linear model filtering both the input and output to create a dual input vector. As a result, the net might develop an input region filter that activates when it discovers a specific trait in a specified geographic area.
The mapping for all filters along the hidden layers is concatenated to construct the Fourier layer’s whole output volume. Consequently, each piece in the output generated may be read as the consequence of a synapse processing a small subset of the stimuli and sharing data with the other synapses in the same layer.
4.5. Long Short-Term Memory
The LSTM is a fully convolutional design based on artificial intelligence and incorporates an RNN. Unlike other feedforward networks, LSTM features feedback links, making it suitable for handling both single data points (e.g., images) and entire bitstreams (e.g., audio or video). For instance, it finds applications in speech recognition, unsegmented and connected writing recognition, and intrusion analysis in system activity, or intrusion detection systems. The general structure of the LSTM architecture is illustrated in Figure 8. This architecture includes an input gate, an output gate, and a forget gate. Data are received and transmitted through these three gates, and LSTM units retain values over time. Since various types of data may exhibit unexpected gaps between significant events, LSTMs excel at recognizing, interpreting, and predicting such gaps. LSTMs were developed to address the problem of vanishing gradients during training with traditional RNNs. As a result, they are highly proficient at locating and processing information, making them highly recommended. LSTMs are typically preferred over hidden Markov models, RNNs, and other sequence learning algorithms due to their low sensitivity to gap lengths.
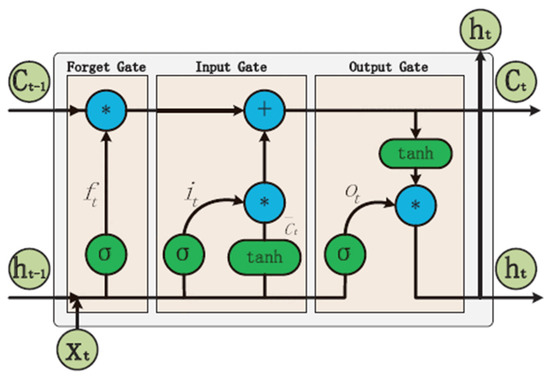
Figure 8.
LSTM architecture.
4.6. ResNet-152 Model
The ResNet-152 model is a deep learning model used for emotion recognition and computer vision tasks. Due to its design, which employs CNN blocks, it is well suited for tasks that involve CNN block classes, accepting input and output channels. In all CNN networks, batch normalization or an activation function is typically applied after each convolutional layer. The ReLU activation function is particularly useful for addressing the issue of vanishing gradients caused by non-linearity. ResNet-152 can create exceptionally deep networks with up to 152 layers by learning residual representation effects rather than the signal representation directly. It has been trained on a database known as ImageNet, which contains approximately 22,000 subcategories and is composed of 15 million high-resolution images.
5. Result and Discussion
The proposed adaptive filter and CNN algorithm were initially developed using the MATLAB-R2018b platform. After defining the CNN architecture in MATLAB, the fixed-point design of the CNN was implemented on an FPGA. FPGA devices are chosen for their energy efficiency and cost-effectiveness. Recent studies have shown excellent FPGA optimization of CNN networks. In our case, we utilized Cyclone V, a cost-effective Altera DE2 FPGA device, to construct the CNN network. Building an impartial, automatic, and emotional categorization system that can recognize a person’s face and categorize their seven fundamental emotions is our aim. The Altera DE2 Development Board’s implementation platform is shown in Figure 9. All of the elements on the board have connections to the pins of the Altera Cyclone IV FPGA chip, allowing the user to customize how the various components are connected. The Cyclone IV FPGA chip has 475 user input/output pins, 70 inbuilt multipliers, 105 M4K RAM blocks, 33,216 logic elements, and 483,840 total RAM bits. To design a system that works on FPGA chips, the SOPC builder can automate the connection of software-hardware components using toolkits. An RTL schematic view of male/female identification with emotion is given in the schematic below in Figure 10.
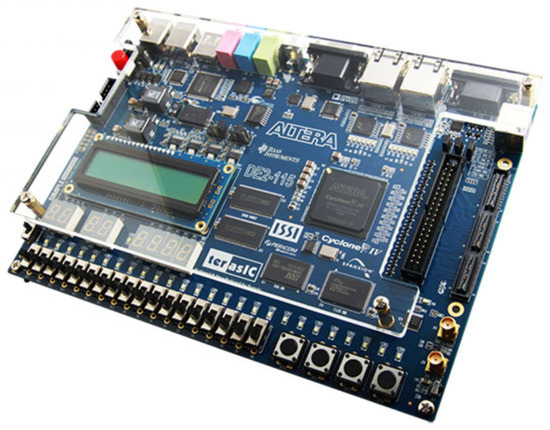
Figure 9.
Altera DE2.
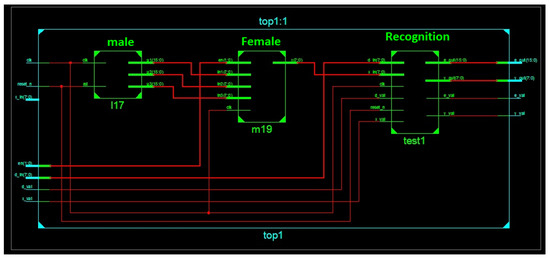
Figure 10.
Schematic view of identification.
The RTL schematic of the proposed adaptive filter is depicted in Figure 11. FPGA resources include Look-up Tables Units (LUTs), Flip-Flop Units, Block-RAM Units (B-RAMs), and Digital Signal Processing Units (DSPs). These resources determine the overall area requirements for FPGA implementation. The simulation output of a single MAC adaptive FIR filter is given in Figure 12, and test inputs are given as X_in and the desired d_in. The proposed adaptive filter is an iterative process that is continued until the minimum mean square error (MSE) is obtained. Simulation is carried out using the ModelSim simulation tool.
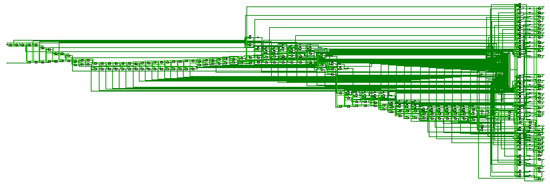
Figure 11.
RTL schematic of proposed adaptive filter.
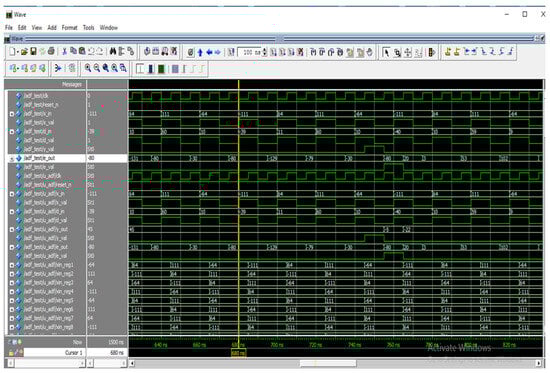
Figure 12.
Simulation result of adaptive filter with CNN.
The comparison between existing methodologies is given in Table 1. While conducting the literature search, some reliability issues were noted, and while implementing the same in the hardware, there were some constraints in the hardware resources. To overcome the above issues, the proposed work shows an improvement of around 98% accuracy with less hardware usage.

Table 1.
Comparison with benchmark techniques.
The outcomes are presented in Table 2. In this analysis, we used a Spartan 6XC6SL45FPGA device. The device utilization of Cyclone IV E is detailed in Table 3, with 668 logic elements used out of 6272 available logic elements. This FPGA implementation consumes only 10% of the available resources. A comparison of the proposed CNN LSTM with the ResNet algorithm against existing algorithms is shown in Table 4. Different devices and algorithms have been used in previous years, whereas our proposed work utilizes the Altera Cyclone IV E device, and the performance results indicate that it requires less area compared to existing solutions.
Table 2.
Device utilization of adaptive filter implementation in Spartan 6XC6SL45.
Table 3.
Device utilization for proposed system (device: Cyclone IV E).
Table 4.
Device utilization for proposed system (device: Cyclone IV E).
5.1. Strengths and Weaknesses of the Proposed Work
Strengths
- ResNet-152 contains 152 layers, and this is very much sufficient enough to handle the FPGA without changing the hardware, even if the size of the dataset increases.
- FPGA can exploit parallelism effectively, which is beneficial for deep learning models like LSTM and ResNet-152.
- A single MAC adaptive filter has been used in this proposed work; using this, the multipliers are reduced, which leads to a further reduction in hardware utilization.
Weakness
- Developing and optimizing FPGA designs for deep learning may require specialized programming language, like Verilog and VHDL. This may be difficult for machine learning practitioners.
5.2. Future Scope
Compared with the existing methods, the proposed EEG recognition using FPGA with CNN and ResNet shows better accuracy and less resource utilization in FPGA. The device utilization using the Cyclone 4 device is shown in Table 4 and shows less slice LUTs. In future, this study can be extended to additional behavior/emotional disorders in military persons, teenagers, and college students. These datasets can be used with different FPGA devices.
6. Conclusions
This research presents an implementation of independent component analysis and an adaptive filter on an FPGA for emotion recognition using the LSTM-ResNet-152 algorithm. The FPGA consists of four primary hardware resources: Look-up Tables Units, Flip-Flop Units, Block-RAM Units, and Digital Signal Processing Units. In this work, emotion recognition is realized and synthesized on an FPGA, and the results are compared with existing systems. The proposed system demonstrates superior performance compared to the existing solutions.
Author Contributions
Conceptualization, M.R.E.; methodology, M.R.E.; software, M.R.E.; validation, M.-F.L.; formal analysis, M.-F.L.; investigation, M.-F.L.; resources, M.R.E.; data curation, M.-F.L.; writing—original draft preparation, M.R.E.; writing—review and editing, M.-F.L.; visualization, M.-F.L.; supervision, M.-F.L.; project administration, M.R.E. All authors have read and agreed to the published version of the manuscript.
Funding
This research has not received any external funding.
Institutional Review Board Statement
Not applicable.
Informed Consent Statement
Not applicable.
Data Availability Statement
Publicly available data are analyzed in this study and can be analyzed here: https://bcmi.sjtu.edu.cn/home/seed/seed-v.html (Accessed on 25 August 2023).
Acknowledgments
The authors also wish to thank the anonymous reviewers for their valuable comments.
Conflicts of Interest
The authors declare no conflicts of interest.
References
- Gonzalez, H.A.; Yoo, J.; Elfadel, I.M. EEG-based emotion detection using un supervised transfer learning. In Proceedings of the 2019 41st Annual International Conference of the IEEE Engineering in Medicine and Biology Society (EMBC), Berlin, Germany, 23–27 July 2019; pp. 694–697. [Google Scholar]
- Sun, L.; Liu, Y.; Beadle, P.J. Independent component analysis of EEG signals. In Proceedings of the 2005 IEEE International Workshop on VLSI Design and Video Technology, Suzhou, China, 28–30 May 2005; pp. 219–222. [Google Scholar]
- Mehmood, R.M.; Lee, H.J. A novel feature extraction method based on late positive potential for emotion recognition in human brain signal patterns. Comput. Electr. Eng. 2016, 53, 444–457. [Google Scholar] [CrossRef]
- Zhu, J.; Zheng, W.-L.; Peng, Y.; Duan, R.; Lu, B.-L. EEG-based emotion recognition using discriminative graph regularized extreme learning machine. In Proceedings of the 2014 International Joint Conference on Neural Network, Beijing, China, 6–11 July 2014. [Google Scholar] [CrossRef]
- Khosrowabadi, R.; Quek, C.; Ang, K.K.; Wahab, A. ERNN: A Biologically Inspired Feedforward Neural Network to Discriminate Emotion From EEG Signal. IEEE Trans. Neural Netw. Learn. Syst. 2014, 25, 609–620. [Google Scholar] [CrossRef] [PubMed]
- Smitha, K.G.; Vinod, A.P. Facial emotion recognition system for autistic children: A feasible study based on FPGA implementation. Med. Biol. Eng. Comput. 2015, 53, 1221–1229. [Google Scholar] [CrossRef] [PubMed]
- Smitha, K.G.; Vinod, A.P. Low Complexity FPGA Implementation of Emotion Detection for Autistic Children. In Proceedings of the 2013 7th International Symposium on Medical Information and Communication Technology (ISMICT), Tokyo, Japan, 6–8 March 2013. [Google Scholar] [CrossRef]
- De Vos, M.; Deburchgraeve, W.; Cherian, P.J.; Matic, V.; Swarte, R.M.; Govaert, P.; Visser, G.H.; Van Huffel, S. Automated artifact removal as preprocessing refines neonatal seizure detection. Clin. Neurophysiol. 2011, 122, 2345–2354. [Google Scholar] [CrossRef] [PubMed]
- Gannouni, S.; Aledaily, A.; Belwafi, K.; Aboalsamh, H. Emotion detection using electroencephalography signals and a zero-time windowing-based epoch estimation and relevant electrode identification. Sci. Rep. 2021, 11, 7071. [Google Scholar] [CrossRef] [PubMed]
- Suhaimi, N.S.; Mountstephens, J.; Teo, J. EEG-Based Emotion Recognition: A State-of-the-Art Review of Current Trends and Opportunities. Comput. Intell. Neurosci. 2020, 2020, 8875426. [Google Scholar] [CrossRef] [PubMed]
- Liu, J.; Wu, G.; Luo, Y.; Qiu, S.; Yang, S.; Li, W.; Bi, Y. EEG-Based Emotion Classification Using a Deep Neural Network and Sparse Autoencoder. Front. Syst. Neurosci. 2020, 14, 43. [Google Scholar] [CrossRef]
- Topic, A.; Russo, M. Emotion recognition based on EEG feature maps through deep learning network. Eng. Sci. Technol. Int. J. 2021, 24, 1442–1454. [Google Scholar] [CrossRef]
- Wang, J.; Wang, M. Review of the emotional feature extraction and classification using EEG signals. Cogn. Robot. 2021, 1, 29–40. [Google Scholar] [CrossRef]
- Butt, M.; Espinal, E.; Aupperle, R.L.; Nikulina, V.; Stewart, J.L. The Electrical Aftermath: Brain Signals of Posttraumatic Stress Disorder Filtered Through a Clinical Lens. Front. Psychiatry 2019, 10, 368. [Google Scholar] [CrossRef]
- Pereira, E.T.; Gomes, H.M.; Veloso, L.R.; Mota, M.R.A. Empirical Evidence Relating EEG Signal Duration to Emotion Classification Performance. IEEE Trans. Affect. Comput. 2021, 12, 154–164. [Google Scholar] [CrossRef]
- Chakravarthi, B.; Ng, S.-C.; Ezilarasan, M.R.; Leung, M.-F. EEG-based emotion recognition using hybrid CNN and LSTM classification. Front. Comput. Neurosci. 2022, 16, 1019776. [Google Scholar] [CrossRef] [PubMed]
- Ezilarasan, M.R.; Pari, J.B.; Leung, M.-F. Reconfigurable Architecture for Noise Cancellation in Acoustic Environment Using Single Multiply Accumulate Adaline Filter. Electronics 2023, 12, 810. [Google Scholar] [CrossRef]
- Ezilarasan, M.R.; Brittopari, J. An Efficient FPGA-Based Adaptive Filter for ICA Implementation in Adaptive Noise Cancellation. SSRG Int. J. Electr. Electron. Eng. 2023, 10, 117–127. [Google Scholar] [CrossRef]
- Ezilarasan, M.R.; Pari, J.B.; Leung, M.-F. High Performance FPGA Implementation of Single MAC Adaptive Filter for Independent Component Analysis. J. Circuits Syst. Comput. 2023, 32, 17. [Google Scholar] [CrossRef]
- Khare, S.K.; Blanes-Vidal, V.; Nadimi, E.S.; Acharya, U.R. Emotion recognition and artificial intelligence: A systematic review (2014–2023) and research recommendations. Inf. Fusion 2023, 102, 102019. [Google Scholar] [CrossRef]
- Khare, S.K.; Nishad, A.; Upadhyay, A.; Bajaj, V. Classification of emotions from EEG signals using time-order representation based on the S-transform and convolutional neural network. Electron. Lett. 2020, 56, 1359–1361. [Google Scholar] [CrossRef]
- Darshan, B.D.; Vyshnavi Shekhar, B.S.; Totiger, M.M.; Priyanka, N.; Spurthi, A. Classification of Emotion using Eeg Signals: An FPGA Based Implementation. Int. J. Recent Technol. Eng. (IJRTE) 2023, 12, 102–109. [Google Scholar]
- Rashid, M.; Sulaiman, N.; PPAbdul Majeed, A.; Musa, R.M.; Ab Nasir, A.F.; Bari, B.S.; Khatun, S. Current status, challenges, and possible solutions of EEG-based brain-computer interface: A comprehensive review. Front. Neurorobotics 2020, 14, 515104. [Google Scholar] [CrossRef]
- Zhang, X.; Yao, L.; Wang, X.; Monaghan, J.; Mcalpine, D.; Zhang, Y. A survey on deep learning-based non-invasive brain signals: Recent advances and new frontiers. J. Neural Eng. 2021, 18, 031002. [Google Scholar] [CrossRef]
- Wang, W.; Qi, F.; Wipf, D.; Cai, C.; Yu, T.; Li, Y.; Yu, Z.; Wu, W. Sparse Bayesian learning for end-to-end EEG decoding. IEEE Trans. Pattern Anal. Mach. Intell. 2023, 45, 15632–15649. [Google Scholar] [CrossRef] [PubMed]
- Li, S.; Mo, Y.; Li, Z. Automated pneumonia detection in chest x-ray images using deep learning model. Innov. Appl. Eng. Technol. 2022, 1, 1–6. [Google Scholar] [CrossRef]
- Li, M.; Ling, P.; Wen, S.; Chen, X.; Wen, F. Bubble-wave-mitigation algorithm and transformer-based neural network demodulator for water-air optical camera communications. IEEE Photonics J. 2023, 15, 7303710. [Google Scholar] [CrossRef]
- Zhao, T.; He, J.; Lv, J.; Min, D.; Wei, Y. A comprehensive implementation of road surface classification for vehicle driving assistance: Dataset, models, and deployment. IEEE Trans. Intell. Transp. Syst. 2023, 24, 8361–8370. [Google Scholar] [CrossRef]
- Jafari, A.; Page, A.; Sagedy, C.; Smith, E.A.; Mohsenin, T. A low power seizure detection processor based on direct use of compressively-sensed data and employing a deterministic random matrix. In Proceedings of the 2015 IEEE Biomedical Circuits and Systems Conference (BioCAS), Atlanta, GA, USA, 22–24 October 2015. [Google Scholar] [CrossRef]
- Gao, J.; Shi, W.; Choy, C.-S. Hardware Design of Real Time Epileptic Seizure Detection Based on STFT and SVM. IEEE Access 2018, 6, 67277–67290. [Google Scholar] [CrossRef]
- Feng, L.; Li, Z.; Wang, Y. VLSI Design of SVM-Based Seizure Detection System With On-Chip Learning Capability. IEEE Trans. Biomed. Circuits Syst. 2018, 12, 171–181. [Google Scholar] [CrossRef]
- Elhosary, H.; Zakhari, M.H.; Elgammal, M.A.; Abd, M.A.; Salama, K.N.; Mostafa, H. Low-Power Hardware Implementation of a Support Vector Machine Training and Classification for Neural Seizure Detection. IEEE Trans. Biomed. Circuits Syst. 2019, 13, 1324–1337. [Google Scholar] [CrossRef]
- Daoud, H.; Abdelhameed, A.M.; Bayoumi, M. FPGA Implementation of High Accuracy Automatic Epileptic Seizure Detection System. In Proceedings of the 2018 IEEE 61st International Midwest Symposium on Circuits and Systems (MWSCAS), Windsor, ON, Canada, 5–8 August 2018. [Google Scholar] [CrossRef]
Disclaimer/Publisher’s Note: The statements, opinions and data contained in all publications are solely those of the individual author(s) and contributor(s) and not of MDPI and/or the editor(s). MDPI and/or the editor(s) disclaim responsibility for any injury to people or property resulting from any ideas, methods, instructions or products referred to in the content. |
© 2024 by the authors. Licensee MDPI, Basel, Switzerland. This article is an open access article distributed under the terms and conditions of the Creative Commons Attribution (CC BY) license (https://creativecommons.org/licenses/by/4.0/).