Abstract
Evaluation and selection of a third-party reverse logistics provider (3PRLP) is an important tool for enterprises to improve the level of reverse logistics management. The identification of critical indicators plays a crucial role in the evaluation process. Firstly, on the basis of fully considering the characteristics of 3PRLP evaluation and selection, we summarized 27 evaluation indicators from 5 dimensions—overall operation level, management service level, information technology level, social and ecological benefits, and strategic alliance. Secondly, we adopted the Delphi method to determine the formal evaluation index system, and the best–worst method (BWM) to calculate the weight of each indicator. We determined the critical evaluation indicators on the basis of the weights. Finally, based on our results, corresponding countermeasures and implications regarding the process of 3PRLP evaluation were put forward. The research results show that the critical indicators include transportation allocation capacity, network coverage, service price level, service response speed, recovery efficiency, and service flexibility level.
1. Introduction
Reverse logistics was first proposed by the American scholar Stock in 1992. It includes logistics activities such as resource conservation, recycling, replacement, material reuse, and waste disposal. Reverse logistics has the characteristics of uncertainty, complexity of processing systems, and high cost of operation [1]. With the increasingly prominent ecological and environmental issues, countries around the world attach great importance to the research and practice of reverse logistics. Nowadays, reverse logistics has become a research hotspot in the field of logistics and supply chains. It is not only an important foundation and condition for promoting circular economy and achieving sustainable development, but also a powerful guarantee for promoting limited resource circulation and green development of enterprises. For enterprises, strengthening the management of reverse logistics can not only save resources and alleviate environmental pollution issues, but also reduce logistics costs, enhance their competitive advantage, and thus improve economic efficiency [2].
The self-operated reverse logistics model facilitates enterprises to take the initiative to control and manage their supply chains. However, due to the complexity of reverse logistics systems, their operations require specialized reverse logistics information tracking equipment and facilities. Therefore, many enterprises with limited resources often choose to outsource their reverse logistics operations to third-party reverse logistics provider (3PRLP). Third-party reverse logistics corresponds to self-operated reverse logistics. Its supplier has a powerful network information query system, which can provide fast and accurate data support and personalized reverse logistics services to the entrusted enterprises. Compared to self-operated reverse logistics, choosing to outsource reverse logistics activities can give full play to the intensive advantages of 3PRLP. It can also reduce the logistics costs and risks of enterprises and improve the efficiency of reverse logistics [3,4]. Therefore, for the entrusted enterprises, how to select the appropriate 3PRLP has become a crucial step in reverse logistics decision-making.
Evaluating 3PRLP is an important means for enterprises to select suitable suppliers. 3PRLP is a service-oriented supplier, while the traditional supplier evaluation index system in the supply chain cannot be directly used to evaluate service-oriented suppliers. Therefore, the service characteristics of 3PRLP should be reflected in the evaluation process [5,6]. The evaluation and selection of 3PRLP involves many factors and often faces the problem of redundant evaluation indicators. Therefore, identifying critical indicators in the evaluation process of 3PRLP can help enterprises identify key value drivers, thereby promoting the realization of decision-making objectives.
The identification of critical indicators in the evaluation of 3PRLP is a typical multi-criteria decision-making (MCDM) problem. The essence of MCDM problems is to rank and analyze the indicators in the set of indicators under consideration through specific mathematical tools and logical preferences [7]. Some traditional methods of weight calculation include the analytic hierarchy process (AHP) method, the analytic network process (ANP) method, entropy method, and the decision-making trial and evaluation laboratory (DEMATEL), among others. These methods can all be used to rank the importance of indicators. However, they are all based on matrix analysis, which requires a large amount of data collection during the research process and involves complex calculations. For example, the AHP method requires pairs of comparisons during the calculation process, and involves fractional calculations. These will greatly increase the complexity of the calculation and may affect the consistency of the final results.
In our study, we explore the answers to the following research questions: What dimensions and indicators should be considered in the evaluation of 3PRLP? Which are the critical indicators? Furthermore, is the BWM method appropriate for this type of problem and how should it be applied? Answering these questions has certain theoretical and practical implications. Theoretically, we sort out the performance evaluation indicators of 3PRLP systematically and comprehensively with the BWM method, which furtherly expands the application of BWM. Practically, our study reduced the complexity for enterprises to identify the critical indicators.
The remainder of this paper is organized as follows: Section 2 introduces related research results on the evaluation of 3PRLP. Section 3 introduces the methods used in the study. In Section 4, we present the empirical research, which comprehensively uses the Delphi and BWM method to identify and analyze the critical evaluation indicators of 3PRLP. Section 5 discusses managerial implications and outcomes for the evaluation of 3PRLP. Section 6 concludes the paper.
2. Related Literature Review
Third-party reverse logistics emerged with the sustainable and cyclical development of economic models. It is an important means to strengthen the core competitiveness of enterprises, reduce operational costs and risks, and improve customer satisfaction. The evaluation of 3PRLP is a powerful guarantee for ensuring the effectiveness and rationality of the entire third-party reverse logistics operation process. Third party reverse logistics has always been a hot topic in the field of green logistics research. With the promulgation of national green legislation, the concept of sustainable development has taken root in the hearts of the public, and the issue of evaluating 3PRLP is also being studied by scholars. Currently, the research results on the evaluation and selection of 3PRLP mainly focus on the construction of evaluation index system and the selection of evaluation methods.
2.1. Analysis of Evaluation Indicators for 3PRLP
Many scholars have begun to pay attention to the selection of evaluation indicators for 3PRLP and have conducted research from different perspectives. One focus of research is the service level of 3PRLP. From this perspective, scholars believe that when establishing a 3PRLP evaluation index system, in addition to meeting the integrity, flexibility, and objectivity of the general evaluation index system, it is also necessary to reflect the service-oriented characteristics of 3PRLP. Li and Jin constructed an evaluation index system of four aspects by comparing 3PRLP vertically and horizontally. In order to achieve the purpose of controlling management and services, they subdivided the management service quality dimension into secondary indicators such as response speed, service breadth and depth, etc. [8]. Wu, Ma, and Xin believed that service level indicators are key elements that customers face directly, which can reflect the maximum affordability of reverse logistics. They established an evaluation index system of five aspects: management level, service level, technical operation level, informatization level, and social ecological benefits, in order to objectively reflect the operation and service level of reverse logistics providers [9,10,11]. Liu et al. used five aspects as the selection criteria for 3PRLP: total assets, transport cost, customer satisfaction, personalized service, and technology level. Among them, customer satisfaction and personalized service were used to measure the service level of suppliers [12].
Another focus of research is the strategic alliance relationship between 3PRLP and entrusted enterprises, which can comprehensively evaluate their strategic compatibility and stability of the alliance relationship. Li and Zhao embodied the contractual oriented strategic alliance relationship between 3PRLP and entrusted enterprises through four aspects: historical cooperation status, sharing of benefits and risks, core capabilities, and compatibility of strategic concepts [13]. Li and Wang, and Senthil et al. divided the evaluation index system of 3PRLP into four dimensions: service quality, technical level, operational ability, and strategic alliance. Additionally, they further subdivided strategic alliance into secondary indicators such as cultural compatibility, strategic goal compatibility, and sharing of benefits and risks [14,15]. Wu and Yu, Guo et al., and Song et al. constructed an evaluation index system based on the characteristics of 3PRLP selection from four dimensions: service capability, operational capability, cost factor, and cooperative alliance. They measured the level of cooperative alliances through secondary indicators such as the compatibility of strategic concepts, the sharing of benefits and risks, and corporate reputation [16,17,18].
As the research content continues to deepen, extensive research has also been carried out on various evaluation indicators of 3PRLP, and on refining evaluation indicator systems. In a study on evaluation indicator segmentation, Dickson used 23 indicators, such as service quality, production capacity, and technical level, as evaluation indicators for reverse logistics suppliers [19]. Wen comprehensively considered economic, social, and ecological benefits, and constructed a green evaluation indicator system for 3PRLP selection based on three aspects: internal evaluation, external evaluation, and comprehensive evaluation. Their evaluation index system included 9 first-level indicators and 33 secondary indicators [20]. Wang took into account that the existing evaluation index system rarely considered deficiencies in ecological benefits, technological innovation capabilities, waste disposal capabilities, and other aspects. Therefore, he comprehensively constructed 24 indicators including 7 aspects: service capacity, cost, transportation capacity, technical strength, informatization level, ecological benefits, and comprehensive strength of the enterprise [21]. Yang summarized the existing research achievement indicator system of 3PRLP, and finally created an evaluation system including 18 secondary indicators from 6 aspects: logistics indicators, hardware indicators, service indicators, energy consumption indicators, management indicators, and carbon emission reduction indicators [22]. Zarbakhshnia et al. constructed an evaluation system consisting of 16 indicators mainly from 4 aspects: economic standards, environmental standards, social standards, and risk standards [23]. Liu et al. divided the overall goal into 4 first-level indicators and 10 secondary indicators based on the principle of 3PRLP evaluation indicators. The first-level indicators included technical level, service level, management level, and financial level [24]. Liu and Wu constructed an evaluation index system from the four dimensions of cost, technology, service quality, and resources. They further subdivided these indicators into 15 secondary indicators to study the selection and evaluation of third-party reverse logistics service providers [25].
Based on the above literature analysis, we have summarized the indicators involved in previous studies into five dimensions: overall operational level, management service level, information technology level, social and ecological benefits, and strategic alliance, as shown in Table 1.

Table 1.
The initial evaluation index system of 3PRLP.
2.2. Analysis of Evaluation Methods for 3PRLP
The evaluation of 3PRLP is a typical MCDM problem. Currently, typical methods to address this kind of problem include the analytic hierarchy process (AHP) method, the step-wise weight assessment ratio analysis (SWARA) method, the decision-making trial and evaluation laboratory (DEMATEL), the entropy weight method, the technique for order of preference by similarity to ideal solution (TOPSIS) method, the quality function deployment (QFD) method, and the combined application of the above methods.
For example, Zarbakhshnia et al. used the fuzzy SWARA method to weight the evaluation criteria, and then proposed a fuzzy complex proportional assessment (fuzzy COPRAS) method to rank and select 3PRLP with risk factors [23]. Li and Pei proposed a grey TOPSIS method based on rough sets to solve problems in the evaluation process of 3PRLP, such as the need for direct weighting in determining indicator weights and information uncertainty. The application of this method made the evaluation results more scientific and reasonable [26,27]. Liu et al. established an evaluation model for G1 combination weighting based on entropy correction, which was used to perform combination weighting on the indicator system. This model realized the effective combination of subjectivity and objectivity, and provided a decision-making basis for enterprises to choose 3PRLP [28]. Pan used entropy weight method to determine the weight of indicators based on the MCDM method, and then used TOPSIS and gray correlation analysis to obtain the final ranking of indicators. Finally, she proved the feasibility and effectiveness of the research model based on the empirical research of a Chinese automobile manufacturer [29]. Li and Wang constructed a customer-demand-oriented evaluation index system and proposed an evaluation method based on fuzzy QFD. They used a deblurring method based on α-cut set to solve the fuzzy weights. The application of this method compensated for the absence of subjective and objective information in the weight calculation process [30]. Wu, Zhou, Sheng et al., and Guo constructed a 3PRLP evaluation index system based on the characteristics of third-party reverse logistics, and used the AHP method to determine the weight of each evaluation index [31,32,33,34]. Wang et al. exploited fuzzy AHP and fuzzy VIKOR methods to evaluate and select the most efficient 3PLs [35]. Wang et al. developed a decision support system to assist businesses in the selection and evaluation of different 3PRLPs using a hybrid fuzzy MCDM approach [36]. Zarbakhshnia et al. used fuzzy step-wise weight assessment ratio analysis to weight the evaluation criteria and applied a developed fuzzy complex proportional assessment of alternatives to rank and select the sustainable 3PRLPs [23]. Prakash et al. used fuzzy analytic hierarchy process for evaluation and prioritization of selection criteria and fuzzy technique for order performance by similarity to ideal solution for the selection and development of reverse logistics partner [37].
The above evaluation methods have been applied to qualitative analysis, quantitative analysis, and qualitative and quantitative combination analysis. However, some methods, such as the entropy weight method, rely excessively on practical data, and sometimes lead to conclusions that are diametrically opposed to common sense. Methods such as fuzzy QFD are limited to customer-demand-oriented perspectives, so they cannot be widely used. Other methods, such as the AHP method, ANP method, and TOPSIS method, have a cumbersome calculation process and risk failing the consistency test.
To overcome the shortcomings of the above methods, we proposed a 3PRLP evaluation method based on BWM. The best–worst method is an MCDM method based on comparison, which is used to calculate the weight of indicators. Compared to other methods, BWM not only has fewer paired comparison data and inputs, but also has better consistency and robustness.
2.3. Research Gap
We used the above research results on 3PRLP evaluations to guide our study. We combined the actual requirements of the 3PRLP evaluation process, integrating and optimizing them on the basis of previous research to form a 3PRLP evaluation index system. The aforementioned studies have proposed some factors for analyzing the evaluation of 3PRLP. However, it is unrealistic for enterprises to manage all evaluation indicators one by one due to their limited resources. Therefore, it is necessary to identify the critical indicators for evaluation, so as to allow managers to focus on research. To do so, the AHP method, SWARA method, entropy weight method, TOPSIS method, and QFD method were used for qualitative and quantitative combination analysis. However, these methods share a common problem; that is, the calculation process is cumbersome and inconsistent, which may affect the final result judgment. Compared with other methods, BWM has a simpler calculation process and more reliable weight distribution results. In this study, we use the BWM method to identify critical indicators. Compared to other MCDM methods, BWM is based on vector analysis, with a concise calculation process and significantly simplified data collection, so the calculation results have good consistency [38]. Therefore, based on the unique advantages of BWM, we achieve the identification of critical indicators for the evaluation of 3PRLP.
3. Methodologies
3.1. Delphi Method
The Delphi method was proposed by the RAND Corporation in the 1950s. It is a forecasting and information gathering process which, instead of physically bringing people together, uses written responses from participants who remain anonymous to each other. The objective of the Delphi method is to obtain the most reliable consensus of a group of experts.
It is characterized by anonymity, feedback, and statistics [39]. The characteristic of anonymity enables experts to make independent judgments on decision-making issues. The characteristic of feedback can ensure the achievement of consensus by overcoming the subjective differences caused by different expert fields, experiences, and personal cognition of each expert. The characteristic of statistics indicates that certain statistical indicators are needed in the decision process. In our study, a consensus deviation index (CDI) is adopted to indicate the degree of expert consensus. The CDI value is equal to the standard deviation divided by the mean. The larger the CDI, the weaker the expert consensus. In our paper, we use 0.1 as the basis for judgment of the CDI. Figure 1 shows the process of the Delphi method.
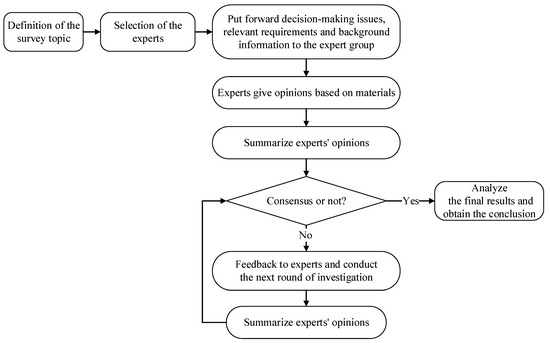
Figure 1.
Implementation process of the Delphi method.
3.2. Best–Worst Method
The best–worst method is a new MCDM method proposed by the Dutch scholar Rezaei to define the index weight coefficient. This method quantifies qualitative factors by expressing and processing people’s subjective judgments in quantitative form. To some extent, it weakens the subjective impact, improves the accuracy of indicator weights, and makes the evaluation process more scientific. The BWM is similar to the AHP method in that they are both based on pairwise comparisons between indicators. However, the BWM constructs a structured way to compare, simplifying the steps that require pairwise comparisons of all indicators in the AHP method. In addition, a small number of paired comparisons eliminate inconsistencies in the indicator comparison process, making the calculation process simpler [40]. Therefore, the BWM is suitable for the evaluation of 3PRLP, which involves many factors and complex operations. Applying the BWM to the study of this problem can play a good simplification role, and the results obtained will be more reliable.
When using the BWM for evaluation, we first conduct in-depth analysis of complex decision-making issues. Then, we use less quantitative information to mathematically model the decision-making process. Finally, we construct a mathematical programming problem and solve it to obtain the optimal weight of each indicator. In some cases, the BWM can produce multiple optimal solutions, which means that solving the problem will result in different weight sets of decision indicators. With the rapid development of BWM, relevant theories such as interval weights, nonlinear models, and linear models have emerged. Among them, the process of finding the optimal solution through a linear model is concise, and the results are unique and reasonable. Therefore, the linear solution model of BWM has been widely used in various evaluation fields [41,42]. In our study, we adopt the linear BWM model for identifying the critical evaluation indicators of 3PRLP. The specific operation steps are as follows:
Step 1: Determine a set of decision-making indicators C by summarizing and sorting out existing literature and research results. C = {,,…,}, n represents the number of indicators in the decision indicator set.
Step 2: In the determined set of indicators, determine the best (most important) indicator and the worst (least important) indicator based on expert opinions.
Step 3: Determine the preference of the best indicator over all the other indicators. We assumed that there are m experts and n evaluation indicators in the study. Experts compared the relative importance of the best indicator with other indicators, using a number between 1 and 9 in Table 2. The resulting best-to-others (BO) vector is shown as
where represents the preference of expert k for the best indicator over the other indicators .
Table 2.
The evaluation scale for pairwise comparison of BWM indicators.
Step 4: Determine the preference of all the other indicators over the worst indicator. We assumed that there are m experts and n evaluation indicators in the study. Experts compared the relative importance of the other indicators with the worst indicator, using a number between 1 and 9 in Table 2. The resulting others-to-worst (OW) vector is shown as
where represents the preference of expert k for the other indicators over the worst indicator .
Step 5: Construct a linear BWM model to calculate the unique optimal weights =(,,,). Given that the weights and sum of weights are non-negative, the model is as shown in Formula (1).
Formula (1) is equivalent to the following Model (2):
The above model is a linear problem, which has a unique solution, where represents the weight of the best indicator , represents the weight of the worst indicator , and represents the weight of indicator . By solving model (2), the optimal weights and are obtained.
Step 6: Conduct consistency check. To check the consistency of the comparison, the consistency ratio (CR) is calculated as follows:
The consistency index (CI) is shown in Table 3.
Table 3.
Consistency index table.
The CR values close to 0 show a high level of consistency.
The operation process of BWM is shown in Figure 2.
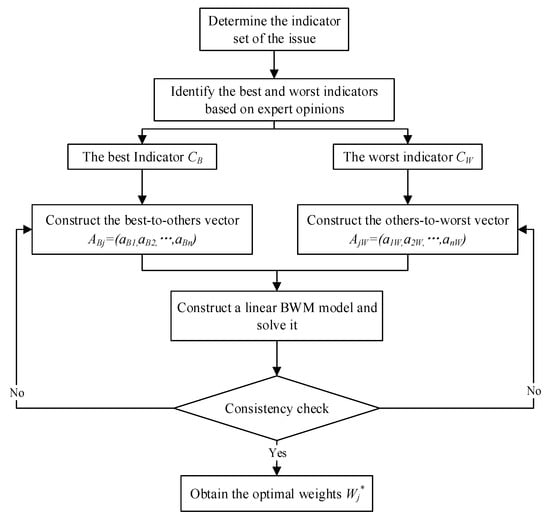
Figure 2.
Implementation steps of the BWM.
4. Empirical Study
4.1. Establishing the Formal Decision Structure Based on the Delphi Method
Through a literature review, the initial set of 3PRLP evaluation indicators in this paper included 5 first-level indicators and 27 second-level indicators, as shown in Table 1.
In order to verify the scientificity and rationality of the evaluation index, it is necessary to use the Delphi method to seek expert opinions on the initial evaluation index system. We invited five experts from the field of third-party reverse logistics with rich practical experience and professional theoretical background to form an expert group, as shown in Table 4.
Table 4.
Professional backgrounds of the five experts for Delphi survey.
We used points between 0 and 10 to measure the necessity of each evaluation indicator, and then judged the necessity of the evaluation index according to the average score and CDI [43]. The specific rules for this study are as follows. First, we considered the average score of each indicator. If the average score is too low, it indicates that the indicator is relatively unnecessary and needs to be removed. Second, we considered the CDI value of each indicator. If the CDI value is too high, it indicates that the experts have differing opinions on the indicator, and no consensus has been reached. The next round of scoring is thus required until the expert group agrees. We took 6 points as the critical value of necessity and 0.1 as the critical value of CDI.
In the first round of the Delphi survey, we provided the experts with the initial evaluation index system as shown in Table 1. Experts examined the description of the indicators and gave a preliminary judgment on the rationality of the initial indicators.
In the second round of the Delphi survey, the experts rated each indicator in 3PRLP evaluation. They scored from 0 to 10, where 0 indicated absolutely unnecessary, while 10 indicated absolutely necessary. The rating scores are shown in Table 4. The CDI values of the 4 indicators (average processing time, coordination and communication ability, proportion of professionals, and enterprise environmental protection awareness) were lower than 0.1, indicating that experts reached consensus on the above-mentioned 4 indicators. Meanwhile, the average scores of the above-mentioned 4 indicators were lower than 6, indicating that experts agreed that these four indicator elements were unnecessary and could be directly eliminated. In addition, the average scores of 13 indicators were higher than 6 and the CDI values were lower than 0.1, indicating that these indicators were necessary for our 3PRLP research, and experts had reached consensus. As shown in Table 5, there were still 11 indicators whose average scores were greater than 6 and CDI values were greater than 0.1. Therefore, we conducted the third-round survey.
Table 5.
Necessity analysis of indicators in the second round of Delphi questionnaire.
In the third round, the summarized results formed in the second-round survey were provided to the experts for reference. The scores for the third round are shown in Table 6. After statistical analysis of the questionnaire survey results, it was found that the CDI values of all indicators were less than 0.1, indicating that the evaluation indicators had passed the expert consistency test. Among them, the average scores of 6 secondary indicators were lower than 6 points. According to the principle of judging the necessity of the above indicators, the 6 evaluation indicators were eliminated, including resource recovery cost, industry experience, cost of information, rate of R&D investment, rate of resource utilization, and compatibility of management system.
Table 6.
Necessity analysis of indicators in the third round of Delphi questionnaire.
After the above three rounds of Delphi questionnaire surveys, the final indicator system for evaluation of 3PRLP was obtained as shown in Table 7.
Table 7.
Final indicator system for 3PRLP evaluation.
4.2. Identification of Critical Evaluation Indicators Based on BWM
The BWM method was used to identify the critical indicators in 3PRLP evaluation. The preference of pairwise comparison between indicators was obtained through a questionnaire. There were 38 questions in the questionnaire, including the selection of 12 best and worst indicators and 26 paired comparative questions. The questionnaire was completed by five experts in the field of third-party reverse logistics using a 1–9 scoring scale. The question was “Select the best and worst indicators from the following indicators. Preference of optimal indicators compared to other indicators. Preferences of other indicators compared to the worst indicators”.
Firstly, we determined a set of 3PRLP evaluation index systems, as shown in Table 5.
Secondly, experts determined the best and worst indicators for each dimension based on their own knowledge and experience. Differences in professional fields could lead to differences in the best and worst indicators determined. If there were multiple best and worst criteria, only one of them was selected as a representative.
Thirdly, experts compared the determined best indicator with other indicators in pairs, and compared the other indicators with the determined worst indicator. We took the opinion of expert A in the comparison of first-level indicators as an example, who selected C1 as the best indicator and C5 as the worst indicator. This expert used the pairwise comparison between the best indicator (C1) and other indicators to obtain the best-to-others vector = (1, 2, 2, 3, 8), and used the pairwise comparison between other indicators and the worst indicator (C5) to obtain the others-to-worst vector = (8, 5, 5, 4, 1). Similarly, according to the BWM operation steps 2–4, the best-to-others vector and the others-to-worst vector for each dimension and each secondary indicator could be obtained in turn. The experts’ preference scores for pairwise comparison between indicators are shown in Table 8.
Table 8.
Comparative preference scores for each dimension/secondary indicator.
According to the analysis of experts’ preferences in the dimensions in Table 6, we found that all experts considered the overall operation level (C1) to be the best indicator dimension. While two experts (I, II) considered strategic alliance (C5) to be the worst indicator dimension, three experts (III, IV, V) considered the information technology level (C3) to be the worst indicator dimension, and no expert believed that the level of management service (C2) and social and ecological benefits (C4) were the best or worst indicator dimensions. In addition, most indicators were identified by experts as the best or worst. However, no experts identified five indicators, such as inventory turnover rate (C11), technical innovation capability (C33), and comprehensive degree of environmental pollution (C42) as the best indicators, and no experts identified seven indicators, such as network coverage (C12), transportation allocation capacity (C13), and service response speed (C21) as the worst indicators.
Finally, we substituted the above scoring results into the linear model proposed in step 5 of the BWM operation. After solving the model, we obtained the optimal weights and of five experts for each dimension, as shown in Table 9.
Table 9.
Optimal weights and consistency test of each dimension.
Similarly, by solving the model, we obtained the optimal weights and of each secondary indicator as shown in Table 10.
Table 10.
Optimal weights and consistency test of secondary indicators.
According to the results in Table 9 and Table 10, we can derive that all the CR values are close to 0, indicating that the optimal weights are reliable. Considering that the 3PRLP index system is a multi-layer structure, we multiplied the weight of each dimension by the weight of the secondary indicators under that dimension to obtain the global weight and ranking of each secondary indicator [43,44]. The results are shown in Table 11.
Table 11.
Global weight and ranking of indicators.
According to the analysis of the above results, among the evaluation dimensions of 3PRLP, the overall operational level was determined as the most critical indicator dimension, with an importance of 0.4475. The management service level and social ecological benefits were identified as the next most important dimensions, with their relative weights of 0.2297 and 0.1253, respectively. According to the partial weights of each indicator in Figure 3, “transportation allocation capacity” was determined as the optimal indicator for the overall operational level, followed only by “network coverage” and “service price level”. In addition, the three indicators related to management service level (service response speed, recovery efficiency, and service flexibility level) were equally important, indicating that these three indicators were important indicators for evaluating management service level. “Information integration and sharing capability” and “Level of recyclability“ were the most important indicators for the information technology dimension and the social and ecological benefits dimension, respectively. The indicators of high importance in strategic alliance were “compatibility of strategic objectives” and “sharing of benefits and risks”. Overall, based on global weights, the six most critical indicators in the evaluation of 3PRLP were as follows: transportation allocation capacity, network coverage, service price level, service response speed, recovery efficiency, and service flexibility level.
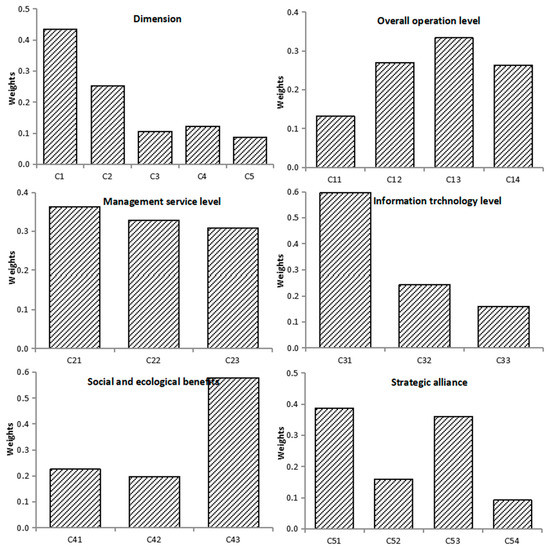
Figure 3.
Local weights of each dimension/sub indicators.
5. Discussion and Implications
As we can see in the empirical results, the overall operational level (C1) and management service level (C2) were the most important dimensions of 3PRLP evaluations, and social and ecological benefits (C4) were important dimensions for evaluations. Critical evaluation indicators included transportation allocation capacity (C13), network coverage (C12), service price level (C14), service response speed (C21), recovery efficiency (C22), and service flexibility level (C23).
In order to verify the effectiveness and sensitivity of the BWM model, we conducted a comparative analysis with the AHP model. The result was as shown in Table 12. We can see that the weights of each indicator derived by the BWM model and the AHP model vary slightly. The sorting of the six critical indicators was basically consistent. This means that the BWM model is robust. As for the complexity, the AHP model needed 31 paired comparisons while the BWM model needed just 26 paired comparisons. Therefore, the BWM method has significantly higher efficiency.
Table 12.
Comparative analysis with AHP model.
Based on the above analysis results, the following implications for 3PRLP evaluations were put forward:
- (1)
- The overall operation level (C1) and management service level (C2) are the most critical evaluation dimensions in 3PRLP evaluation. This result has also been supported by other studies. Pei evaluated candidate 3PRLP based on the G2-weighted TOPSIS method. The result showed that the transportation capacity in the operation level was the key indicator, and the degree of informatization in the operation level was an important indicator [27]. Liu and Wu used the fuzzy analytic hierarchy process (FAHP) to study the selection of 3PRLP, and the results showed that service quality was an important evaluation dimension [25]. The overall operation level involves the operational efficiency, quality, reliability, and other aspects of the entire reverse logistics supply chain, which directly affects the reputation and customer satisfaction of 3PRLP. The management service level is related to whether a 3PRLP can establish a stable long-term cooperative relationship with the entrusted enterprise. Moreover, enterprises with high management service levels can not only ensure that their operational processes are fully optimized and monitored, but also quickly respond to service issues. Therefore, the entrusted enterprise should pay special attention to the importance of the overall operation level and management service level during the evaluation process. The evaluation of these dimensions can more comprehensively reflect the overall strength and business level of reverse logistics suppliers, which is of great significance for entrusted enterprises to formulate appropriate cooperation strategies and decisions.
- (2)
- Transportation allocation capability (C13), network coverage (C12), and service price level (C14) are critical factors in 3PRLP evaluation. These three indicators are also the most important indicators under the overall operational level dimension. Among them, transportation allocation capacity is the most important of all evaluation indicators. It is the key to reflecting the timeliness, safety, and efficiency of cargo transportation, as well as an important factor affecting customer satisfaction. This result is consistent with the discovery of Li [26]. He determined the weight of evaluation indicators based on the grey TOPSIS method of rough sets, and found that transportation and quality were the most important indicators. In addition, network coverage is also a very important indicator for evaluating 3PRLP. Extensive network coverage can better meet customer needs and better achieve resource sharing, thereby improving operational efficiency. Service price level is an important indicator for evaluation, but it needs to be comprehensively considered in combination with other indicator elements. Under the same conditions, selecting suppliers with high service quality and efficiency may be relatively expensive. However, in the long run, high-quality service and efficient operation may bring more benefits to the enterprise. Therefore, when evaluating 3PRLP, the entrusted enterprise should take transportation and allocation capabilities as the core criteria for selecting third-party suppliers, while seeking a balance between cost and benefit based on comprehensive consideration of network coverage and service price level.
- (3)
- Service response speed (C21), recovery efficiency (C22), and service flexibility level (C23) are important indicators for 3PRLP evaluation. These three indicators are all secondary indicators under the management service dimension, with similar importance, indicating that these three indicators are closely related under this dimension. First of all, good service response speed can solve customer problems from the source, laying the foundation for in-depth service development. It is the key to carrying out recycling and flexible adjustment. Secondly, recovery efficiency can ensure that customers receive timely, accurate, and high-quality services. It is the fundamental guarantee for improving service response speed and flexibility. Finally, the level of service flexibility reflects the coordinated response ability of suppliers to handle various uncertain and unexpected situations. It is a comprehensive reflection of service response speed and recovery efficiency. Therefore, it is necessary for the entrusted enterprise to focus on the development of third-party suppliers in these three aspects to ensure the efficiency, quality, and flexibility of reverse logistics services.
- (4)
- Social ecological benefit (C4) is an important evaluation dimension for evaluation. In previous studies, Yang constructed a six-dimensional indicator system and assigned the weight of evaluation indicators based on the information entropy method [22]. The results showed that the carbon emission reduction indicator dimension had the highest importance. Similar to the above research, with the high attention paid to sustainable development issues, we all emphasized the importance of social and ecological benefits in 3PRLP evaluation. However, in contrast, this study does not identify social and ecological benefits as the most important indicator dimension. We believe that brand image and social responsibility are one of the important factors for enterprises to choose suitable suppliers, but not the critical factors. As a service-oriented enterprise, the value of 3PRLP should be reflected in their services and operations. The level of recyclability (C43), as the most important secondary indicator in the social and ecological benefits dimension, reflects the level of resource recycling by third-party suppliers. It has a significant impact on the sustainable development and environmental image of enterprises. Entrusted enterprises should pay attention to the importance of social and ecological benefits while measuring economic benefits. Therefore, in the process of 3PRLP evaluation, it is necessary not only to evaluate the reverse logistics capabilities of third-party suppliers, but also to pay attention to their recycling and reuse levels.
- (5)
- The indicators related to the level of information technology (C3) and strategic alliance (C5) are also indicators for 3PRLP evaluation. Among them, the weight of information integration and sharing capability (C31) in the information technology dimension is as high as 0.5963. It is the most important indicator under this dimension, but its global weight is not high. This is because the global weight of secondary indicators is affected by the weight of the first indicators, resulting in a lower final ranking. In addition, from the empirical research results, other secondary indicators under these two dimensions are not critical indicators, and their comprehensive rankings are not high [45]. In previous studies, Song et al. studied the selection of 3PRLP based on the intuitionistic fuzzy MCDM method. They ultimately determined that customer satisfaction and corporate reputation in cooperative alliances were the two most important criteria for entrusted enterprises to select third-party suppliers [18]. Liu et al. constructed a 3PRLP evaluation model based on entropy correction G1 combination weighting, and the final result showed that the technical indicator dimension had the highest importance [28]. As the elements of innovation and development, information technology level and strategic alliance have a certain degree of impact on the evaluation of third-party reverse logistics, but they will not play a decisive role in the evaluation results. 3PRLP is a service-oriented supplier, and efficient operational processes and high-quality service quality are more important and practical choices for entrusted enterprises.
6. Conclusions
Based on a summary of the existing literature, we constructed a 3PRLP evaluation index system, and optimized and adjusted it on this basis to ensure the comprehensiveness and rationality of the evaluation process. Then, we applied BWM to the identification of critical indicators for 3PRLP evaluation. Finally, based on the empirical research results, we discussed and proposed corresponding countermeasures. The conclusions were as follows:
Firstly, we reviewed the related literature to form an initial indicator set, and on this basis, we optimized and collated the final indicator system for 3PRLP evaluation. We extracted 27 initial indicator elements that affect the evaluation and selection of 3PRLP from 5 dimensions: overall operation level, management service level, information technology level, social and ecological benefits, and strategic alliance. The formal indicator set was determined based on the Delphi survey. By calculating the average scores and CDI values of each indicator, 10 unnecessary indicator elements were discarded. After three rounds of Delphi questionnaire surveys, a 3PRLP evaluation index system with 17 secondary indicators in 5 dimensions was finally obtained.
Then, we used BWM to calculate the weights and comprehensive ranking of dimensions and secondary indicators, and determined the critical evaluation indicators. Five experts and scholars with rich practical experience and professional theoretical background in the field of third-party reverse logistics were invited to fill in the questionnaire. The comparison vector was determined through pairwise comparison between indicators. By solving the BWM linear model and calculating the average values, the local weights of each index were obtained. The global weights and comprehensive ranking of each index were obtained by further solving. The six critical evaluation indicators finally determined included transportation allocation capacity, network coverage, service price level, service response speed, recovery efficiency, and service flexibility level.
Finally, we proposed some managerial implications according to the analysis results, regarding the process of evaluating 3PRLP.
The proposed final evaluation indicator system combined qualitative and quantitative indicators which affected the performance of 3PRLP. Additionally, we took into account the combination of long-term and short-term indicators. Indicators such as strategic alliance and social ecological benefits focus on long-term performance, while indicators such as overall operation level and management service level focus on recent performance. Furthermore, the connotation of the indicators is clear, and the data of indicators is easy to obtain in practice. During the process of pair comparisons through questionnaire surveys, the computational complexity of the BWM method is greatly reduced. All in all, the proposed method in this study is easy to apply and it is appropriate for both short-term and medium-to-long-term evaluation of 3PRLP.
There were some limitations to this study. Although we divided 27 evaluation indicators into 5 dimensions in detail, we did not consider a more exhaustive indicator set and did not conduct a one-by-one inspection for all indicators. At the same time, with the innovative development in the field of third-party reverse logistics and the publication of relevant research, the selection of evaluation indicator elements should be further expanded. In addition, we did not consider ambiguity and uncertainty in the rating process of BWM. In future research, we will consider the fuzzy condition. Finally, we identified key evaluation indicators based on the BWM, but we did not explore the interaction between the indicators and the occurrence of multiple best and worst indicators at the same time. Therefore, considering combining BWM with other methods and improving traditional BWM to consider the issue of data uncertainty and inaccuracy will be an interesting and promising topic in future research.
Author Contributions
Conceptualization, C.Z. and J.Z.; methodology, C.Z.; software, L.T.; validation, C.Z., J.Z. and L.T.; formal analysis, C.Z.; investigation, L.T.; resources, J.Z.; data curation, L.T.; writing—original draft preparation, L.T.; writing—review and editing, C.Z.; visualization, C.Z.; supervision, J.Z.; project administration, J.Z.; funding acquisition, J.Z. All authors have read and agreed to the published version of the manuscript.
Funding
This research was funded by The Project of Cultivation for young top-motch Talents of Beijing Municipal Institutions under Grant BPHR202203236, and the operating funding for Beijing Key Lab of Big Data Decision Making for Green Development under grant 5026023502.
Data Availability Statement
All data that support the findings of this study are available from the corresponding author upon reasonable request.
Conflicts of Interest
The authors declare no conflict of interest.
References
- Liu, J.; Zhao, Q.Q. Review and prospect of reverse logistics research. J. Commer. Econ. 2020, 1, 66–70. [Google Scholar]
- Li, Y.J.; Feng, L.P.; Zhao, X.K.; Xu, F.C. Overview on reverse logistics management research in new era of operations management. Syst. Eng. Theory Pract. 2020, 40, 2008–2222. [Google Scholar]
- Meng, X.R. Study of Evaluation and Selection on Third Party Reverse Logistics Providers. In Proceedings of the 2008 International Seminar on Business and Information Management; IEEE: New York, NY, USA, 2008; Volume 1, pp. 518–521. [Google Scholar]
- Meng, X.R.; Zhang, Y.J.; Song, W. Analysis on 3PRL and Its Provider Selection. In Proceedings of the 2009 International Conference on Environmental Science and Information Application Technology; IEEE: New York, NY, USA, 2009; Volume 1, pp. 631–634. [Google Scholar]
- Abdel-Basset, M.; Gamal, A.; Elhoseny, M.; Chakrabortty, R.K.; Ryan, M. A Conceptual Hybrid Approach from a Multicriteria Perspective for Sustainable Third-Party Reverse Logistics Provider Identification. Sustainability 2021, 13, 4615. [Google Scholar] [CrossRef]
- Tang, H.L. Design and Application of Performance Evaluation Indicators for Reverse Logistics Outsourcing. China Townsh. Enterp. Account. 2007, 8, 26–27. [Google Scholar]
- Pamučar, D.; Ecer, F.; Cirovic, G.; Arlasheedi, M.A. Application of Improved Best Worst Method (BWM) in Real-World Problems. Mathematics 2020, 8, 1342. [Google Scholar] [CrossRef]
- Li, Z.P.; Jin, Y.F. Application of TOPSIS in Evaluation of Third Party Reverse Logistics Service Providers. Logist. Technol. 2013, 32, 179–181. [Google Scholar]
- Wu, N. Research on evaluation indicators of third-party reverse logistics suppliers under the low-carbon concept. J. Commer. Econ. 2010, 32, 44–45. [Google Scholar]
- Ma, L. Research on the construction of third-party reverse logistics supplier evaluation index system. Logist. Technol. 2014, 24, 77–79. [Google Scholar]
- Xin, G.Q. Study on the Building of Performance Evaluation Index System for the Third Party Reverse Logistics Enterprise under Circular Economy. In Proceedings of the Fourth International Conference on Operations and Supply Chain Management (ICOSCM), Hong Kong, China, 25–31 July 2010; Volume 4, pp. 927–930. [Google Scholar]
- Liu, Y.M.; Zhou, P.; Li, L.Y.; Zhu, F. An Interactive Decision-Making Method for Third-Party Logistics Provider Selection under Hybrid Multi-Criteria. Symmetry 2020, 12, 729. [Google Scholar] [CrossRef]
- Li, M.; Zhao, T. Decision-making of the Third Party Reverse Logistics Provider Selection. J. Northwest AF Univ. (Soc. Sci. Ed.) 2006, 4, 73–77. [Google Scholar]
- Li, J.; Wang, Y.M. Evaluation and Selection of Third Party Reverse Logistics Suppliers Based on CCSD/TOPSIS. Logist. Technol. 2015, 34, 145−147+168. [Google Scholar]
- Senthil, S.; Srirangacharyulu, B.; Ramesh, A. A robust hybrid multi-criteria decision making methodology for contractor evaluation and selection in third-party reverse logistics. Expert Syst. Appl. 2014, 41, 50–58. [Google Scholar] [CrossRef]
- Wu, R.; Yu, Y.G. Selection of the Third Party Reverse Logistics Providers based on AHP and DEA. J. Anhui Agric. Sci. 2008, 36, 14767–14769. [Google Scholar]
- Guo, Z.X.; Zhang, Y.T.; Tian, Y.; Cao, X.M.; Wang, Z.Z. Selection of reverse logistics suppliers based on intuitionistic fuzzy multiple attribute decision making. J. Hebei Univ. (Nat. Sci. Ed.) 2021, 41, 638–644. [Google Scholar]
- Song, J.K.; Jiang, L.N.; Liu, Z.C.; Leng, X.L.; He, Z.G. Selection of Third-Party Reverse Logistics Service Provider Based on Intuitionistic Fuzzy Multi-Criteria Decision Making. Systems 2022, 10, 188. [Google Scholar] [CrossRef]
- Dickson, G.W. An Analysis of Vendor Selection and the Buying Process. J. Purch. 1996, 21, 5–17. [Google Scholar]
- Wen, F. Study on Selecting and Evaluating Third-party Reverse Logistics Enterprises. Sci. Technol. Prog. Policy 2009, 26, 152–155. [Google Scholar]
- Wang, K.J. Indicators for Third Party Reverse Logistics Supplier Evaluation in Remanufacturing. Logist. Technol. 2011, 30, 82−84+97. [Google Scholar]
- Yang, W.T. Research on Multi-Objective Decision-Making in the Selection of Third Party Reverse Logistics Supplier. J. Langfang Norm. Univ. (Nat. Sci. Ed.) 2016, 16, 61–66. [Google Scholar]
- Zarbakhshnia, N.; Soleimani, H.; Ghaderi, H. Sustainable third-party reverse logistics provider evaluation and selection using fuzzy SWARA and developed fuzzy COPRAS in the presence of risk criteria. Appl. Soft Comput. 2018, 65, 307–319. [Google Scholar] [CrossRef]
- Liu, B.P.; Zhang, K.; Li, G.H. Third-party Reverse Logistics Supplier Optimization Method Based on TFN-AHP and Entropy Combination Model. In Proceedings of the 25th Annual International Conference on Management Science and Engineering (ICMSE), Frankfurt, Germany, 7–20 August 2018; pp. 40–46. [Google Scholar]
- Liu, P.; Wu, M.J. Selection of third-party reverse logistics service providers based on FAHP. China Mark. 2019, 5, 170–173. [Google Scholar]
- Li, X.L. Rough Set-based Grey-Topsis Approach to the Third Party Reverse Logistic Vendor Selection. Sci. Technol. Manag. Res. 2013, 33, 67–71. [Google Scholar]
- Pei, X. Evaluation of Third Party Reverse Logistics Service Providers Based on G2-weighted TOPSIS. Logist. Technol. 2015, 34, 145−147+160. [Google Scholar]
- Liu, Q.S.; Wang, X.Z.; Hou, Y.Z. Research on Third Party Reverse Logistics Provider Evaluation Based on Entropy. Sci. Technol. Manag. Res. 2013, 33, 179−182+192. [Google Scholar]
- Pan, A.J. Selection of Automotive Third Party Reverse Logistics Suppliers Based on the MCDM. Logist. Technol. 2017, 36, 117−120+164. [Google Scholar]
- Li, J.; Wang, Y.M. Evaluation of Third Party Reverse Logistics Suppliers Based on Fuzzy-QFD. Logist. Technol. 2015, 34, 165–168. [Google Scholar]
- Wu, N. Application of Weighted Fuzzy Clustering in the Selection of Third Party Reverse Logistics Suppliers. Mod. Prop. Manag. 2010, 9, 33–35. [Google Scholar]
- Zhou, Z.F. Research on Selection of Third-Party Reverse Logistics Supplier Based on Fuzzy Analytic Hierarchy Process Method. Adv. Mater. Res. 2012, 472, 3395–3398. [Google Scholar] [CrossRef]
- Sheng, X.H.; Yang, W.P.; Chen, L.H.; Yang, H.Y. Research on the Choice of the Third-Party Reverse Logistics Enterprise Based on the Method of AHP and Goal Programming. Adv. Mater. Res. 2012, 452, 581–585. [Google Scholar] [CrossRef]
- Guo, W.D. Selection model of third-party reverse logistics service providers under supply chain management. In Proceeding of the 2012 24th Chinese Control and Decision Conference (CCDC), Taiyuan, China, 23–25 May 2012; pp. 1761–1764. [Google Scholar]
- Wang, C.N.; Nguyen, N.I.T.; Dang, T.T.; Lu, C.M. A Compromised Decision-Making Approach to Third-Party Logistics Selection in Sustainable Supply Chain Using Fuzzy AHP and Fuzzy VIKOR Methods. Mathematics 2021, 9, 886. [Google Scholar] [CrossRef]
- Wang, C.N.; Dang, T.T.; Nguyen, N.I.T. Outsourcing Reverse Logistics for E-Commerce Retailers: A Two-Stage Fuzzy Optimization Approach. Axioms 2021, 10, 34. [Google Scholar] [CrossRef]
- Prakash, C.; Barua, M.K. An analysis of integrated robust hybrid model for third-party reverse logistics partner selection under fuzzy environment. Resour. Conserv. Recycl. 2016, 108, 63–81. [Google Scholar] [CrossRef]
- Jia, F.; Wang, X.Y. BWM-RST Method for Decision Analysis of New Product Attributes Combination. Soft Sci. 2016, 30, 109–113. [Google Scholar]
- Mahajan, V.; Linstone, H.A.; Turoff, M. The Delphi Method: Techniques and Applications. J. Mark. Res. 1976, 13, 317. [Google Scholar] [CrossRef]
- Rezaei, J. Best-worst multi-criteria decision-making method. Omega 2015, 53, 49–57. [Google Scholar] [CrossRef]
- Liu, J.H.; Yu, Y.; Yu, J.X.; Ge, S.W.; Wu, S.B.; Zhou, W. Risk assessment method based on BWM group decision-making weighting and FMEA. J. Saf. Sci. Technol. 2022, 18, 37–43. [Google Scholar]
- Rezaei, J. Best-worst multi-criteria decision-making method: Some properties and a linear model. Omega 2016, 64, 126–130. [Google Scholar] [CrossRef]
- Tseng, C.C.; Zeng, J.Y.; Hsieh, M.L.; Hsu, C.H. Analysis of Innovation Drivers of New and Old Kinetic Energy Conversion Using a Hybrid Multiple-Criteria Decision-Making Model in the Post-COVID-19 Era: A Chinese Case. Mathematics 2022, 10, 3755. [Google Scholar] [CrossRef]
- Zhu, J.; Feng, J.G.; Gao, Y.Q.; Guo, Z.C.; Zheng, H. Comprehensive evaluation model for happy rivers and lakes based on BWM-CRITIC-TOPSIS. Adv. Sci. Technol. Water Resour. 2022, 42, 8−14+20. [Google Scholar]
- Jia, P.; Dong, J. Evaluation of Extension Excellence of Logistics Service Supply Chain Performance Indicators Based on BSC. Stat. Decis. 2018, 34, 44–48. [Google Scholar]
Disclaimer/Publisher’s Note: The statements, opinions and data contained in all publications are solely those of the individual author(s) and contributor(s) and not of MDPI and/or the editor(s). MDPI and/or the editor(s) disclaim responsibility for any injury to people or property resulting from any ideas, methods, instructions or products referred to in the content. |
© 2023 by the authors. Licensee MDPI, Basel, Switzerland. This article is an open access article distributed under the terms and conditions of the Creative Commons Attribution (CC BY) license (https://creativecommons.org/licenses/by/4.0/).