Abstract
The topological structure in vehicular communication networks presents challenges for sustaining network connectivity on the road. Highway dynamics, for example, encourage the need for an adaptive and flexible structure to handle the rapid events of vehicles joining and leaving the road. Such demand aligns with the advancement made in software-defined networks and related dynamic network re-orchestration. This paper discusses the development of a virtual model that represents the operation of an autonomous vehicular network. It also investigates the ability to re-orchestrate the topology through software definition while running the various operational phases. Network self-formation, network expansion, retraction via vehicular members joining and leaving, and network self-healing when a topological rupture occurs as a result of a key member leaving the network are the key grouping phases. The communication approach is analyzed based on the status of network members and their ability to assume the various network roles. The concept is tested using both a Contiki–Cooja network simulator and a MATLAB analytical modeling tool to reflect the operation and performance of the grouping approach under various road scenarios. The outcome of the analysis reflects the ability of the group to be formulated within a measured latency considering the various network parameters such as communication message rate. The approach offers tools for managing the dynamic connectivity of vehicular groups and may also be extended to assume the function of an on-road network digital twin during the lifetime of a given group.
1. Introduction
As with the development of vehicular network (VN) system architecture, the dynamic and heterogeneous features of VN, coupled with rapid data flow within the topological structure of VN, impose significant challenges for sustaining network connectivity on the road, decision-making within the network set-up, timely data delivery, and network response time under the dynamic events [1]. Data communication management in VN has also become challenging due to limited bandwidth, line of sight, and intermittent communication among the vehicles and with the cloud [2,3]. Lane-changing across the road network can disrupt the overall network operation, resulting in network re-formation. This calls for an adaptive and flexible network mechanism that can keep up with the dynamics of the network in order to maintain communication between the vehicles and the transport management system and to structure an intelligence-enabled network with ever-increasing traffic data demands that can react dynamically to events such as road accidents. For instance, the nature of highway dynamics necessitates the development of a real-time, self-organizing mechanism to deal with the sudden events of vehicles entering and exiting the road. As the topological network structure is restricted by the road and its regulations, the network tends to adhere to a common structural formation considering the road structure layout. Therefore, adapting to road traffic and its dynamic challenges necessitates traffic analysis modeling and full network connectivity wherein using powerful communication techniques such as intelligent clustering (grouping) can support a flexible network structure and connection maintenance. A clustering approach can organize communication through the optimal management of vehicles having similar attributes into groups to reutilize the resources within the group and increase system operational capacity [4,5]. Several clustering protocols and algorithms have been designed to serve various VN applications. The research in routing algorithms and clustering approaches for VN has brought attention to the need to analyze and support cluster performance metrics, network connectivity, data dissemination, and reliability [6,7,8,9,10,11]. Despite the potential advantages of vehicular clustering, the main challenges for clustering algorithms are the flexibility of the network to handle dynamic road events and high network mobility where structure formation and re-formation could take place on the road. These events cause the challenge of initiating, forming, and maintaining any structured group (such as on-going healing in response to a rupture caused by the departure or failure of network components within the group) on the road within low or zero network downtime. The other challenge here is the definition of the group size that can adapt to dynamic changes along with the definition of the node’s role to be part of the on-going grouping process on the road in offering a flexible structure and rapid response to the events. Road parameters such as the number of lanes, road stretch, the minimum two-second rule separation distance between any two vehicles within the same lane [12], and driving speed can impact vehicle distribution, network density, and hence the size of the network, which can range from small to large-scale in organization. Additionally, the topology of the network such as a single-hop or multi-hop structure needs to be considered as per the road requirements.
Employing recent technologies such as a software-defined network (SDN) can enable a rapid response to network fragmentation and redefine the associated dynamic network re-orchestration through software. This, in turn, promotes the development of a software-defined vehicular wireless sensor network (SDVWSN), where the core wireless sensor network (WSN) functions (i.e., Leaf Sensor Node, Router Node, and IoT Gateway Node) are integrated into the vehicular network through softwarization. This, in conjunction with cloud-based virtualization, wherein relevant operational parameters could be manipulated to generate specific functional configuration parameters to be delivered to the physical nodes, could be conceived as a highly prospective solution towards adaptively satisfying the service demands associated with such dynamic vehicular environments. Running trials of various group formation possibilities can facilitate converging upon the optimal or near optimal VN topological framework (e.g., resorting to multi-hop, tree-based topology from conventional star topology to increase the network coverage and serve more nodes) in an expedited manner without interrupting the actual, physical VN data collection process.
Our proposed flexible, self-organized network structure (self-X phases) is investigated with the dynamic clustering/grouping strategy through phases of self-formation, self- leaving, self-healing, and self-joining based on wireless sensor network (WSN) functions [13,14,15,16]. The approach can adapt to dynamic events and re-orchestration demands by obtaining the required response in group re-organization when vehicular network dynamic changes occur on the road. The data in each phase can be managed through the communication messages exchanged among the vehicles, and the gateway can be an infrastructure represented by a roadside unit (RSU) or a mobile node such as a vehicle or unmanned aerial vehicles (UAVs) hovering above the ground network [17,18,19,20]. The cloud can support the performance analysis through the virtual unit, where the possible re-orchestration of network behavior can be deployed and tested before real-world implementation [15]. This can be utilized to facilitate dynamic planning for orchestrating the physical vehicular network as demanded by the road dynamics through live data monitoring.
The main contributions of this work are summarized as follows:
- A comprehensive analytical model for the road traffic scenario (focusing on the highway case) is proposed and presented. This model reflects the capacity of the road and the possible distribution of vehicles on a road with a given number of lanes. Factors such as the road stretch, the number of lanes, and the two-second safety distance are considered in the model. This model can reflect the dynamics of the road and support the size of a vehicular group, which can be orchestrated and re-orchestrated on the road. Herein, a focus has been made on the lane as well as road capacity. This analysis can further be reflected on the possible number of hops of the network and size of a hop within a given road stretch. MATLAB is utilized for the road traffic model analysis.
- From the vehicular grouping approach point of view, the analysis of the main Self-X phases, i.e., self-formation and self-healing, is provided for formulating and healing the vehicular group on the virtual platform prior to the physical network implementation. Herein, the capacity of a gateway router-capable node in terms of maximum number of connections is aligned with the road capacity analysis. The capacity is considered an important parameter for the node selection process in both self-formation and self-healing processes.
- The latencies in communication prior to group structure and the hop latency post structure are provided, reflecting the need for a structured group to improve the latency of the communication. From the network re-orchestration latency point of view, model testing is focused on the Event Trigger and Event Response stages to reflect the time it takes for the network to go through recovery. The latency entailed by the network under those phases is analytically modeled and evaluated using the Contiki–Cooja network simulator.
The remainder of this paper is structured as follows: Section 2 provides the state-of-the-art and related work, mainly highlighting the clustering approaches and the role of softwarization and the cloud VN. Section 3 describes the use case of a highway traffic scenario with an analysis of road parameters such as capacity. Section 4 provides the vehicular grouping Self-X phases approach. Testing and analysis of both the highway road model and the network model are carried out in Section 5. Finally, in Section 6, conclusion of the work is discussed.
2. Related Work
The intelligent VN is realised through communication among the vehicles, with the infrastructure, and with the cloud, collectively creating vehicle-to-everything (V2X) communication [2]. Smart operation of the network requires adaptation to various road parameters. Driving speed and the minimum distance between two consecutive vehicles have significant impacts on the road, mainly on road capacity [21]. Some studies have focused on the distribution of the vehicles on an urban road as an example for evaluating network performance [22].
From the network dynamic operation point of view, efficient vehicular grouping algorithms can be designed to be aligned with the road structure and traffic demands. It should also serve various VN applications, considering the characteristics of VN, i.e., its dynamic nature, complexity, and inconsistency. To date, the literature in this area has investigated communication among the vehicles based on a clustering approach focusing on the main clustering algorithm stages, including cluster formation, maintenance, and management to improve cluster features of stability, scalability, and reliability [2,23,24,25]. The structure approach of a vehicular cluster has been studied by researchers proposing various methods highlighting the use of a ‘Hello’ message as an initial stage for establishing the process [26]. The formation process is supported by criteria and parameters for selecting the involved nodes in the group. The main role is given to the group head responsible for establishing the structural group. The cluster head selection is a crucial part of any clustering algorithm, as it improves the system performance by providing better intra-cluster and inter-cluster communication. The selection parameters that differ from one algorithm to another significantly affect the formation of a stable and adaptive cluster structure. The parameters could be based on the number of vehicles, road stretch, node connectivity, mobility mode, average driving speed, distances among members of the group, direction, position of the vehicles, and RSSI (received signal strength indicator) [27,28,29,30,31]. Taha et al. [31] considered the metrics of relative velocity, relative position, and RSSI for selecting the cluster head in their lightweight group authentication scheme. However, factors like cluster size and cluster optimization to find the dominant parameter that affects the cluster head selection could have been considered.
From the network performance point of view, a variety of network evaluation components can impact vehicular network performance, such as altering the transmission rate, number of nodes, and average vehicle speed [32]. Therefore, the end-to-end delay increases when the transmission rates, the number of vehicles, and the average speed increase. Marzak et al. [33] have proposed a clustering algorithm based on the calculation that a stable node can be a cluster head when considering the metrics of vehicle speed, distance, and probability parameters. A node with a higher value of stability will be selected as a cluster head. The proposed algorithm has not been supported by simulation of the evaluation. Mehmood et al. [34] have presented an intelligent clustering scheme in VN through the Bayesian probabilistic estimation technique to enhance cluster stability and extend the lifetime of the cluster head. Herein, the knowledge of the current traffic flow as well as the factors like direction, distance, connectivity level, and speed difference are considered for selecting a cluster head from the lane having the heaviest traffic flow. However, the proposed algorithm is used in urban scenarios with intersections without considering other road scenarios. Moreover, the naïve Bayesian algorithm requires real datasets, making it inapplicable to other scenarios. In [35], a cluster head selection scheme has been presented and evaluated in terms of packet loss ratio and average packet delay. The scheme is based on the middle position of the cluster head within the cluster. The work in the above-mentioned reference has focused on the average cluster head, cluster member lifetime, and average cluster duration as some of the performance metrics. However, less attention has been given to the analysis of a clustering approach based on the network formation time, pre-selection time, and cluster size based on the road structure. Hamedani et al. [36] have proposed a two-level, cluster-based routing protocol in VN to mitigate the link failure issue, to improve PDR, and to reduce latency using a greedy algorithm. The quality of link (QoL) metric is used for sending the data within the cluster, wherein the node that has a strong link towards the cluster head can send its data directly. Otherwise, the node will rely on a neighboring node that has a strong link towards the cluster head to forward its data to the head. The best path between cluster head and destination is selected using a greedy approach based on distance and velocity. However, more computational resources are needed for sending a request to the neighboring nodes and receiving a reply to be informed about the QoL with the cluster head.
Despite considerable work in VN clustering, frequent formation and re-formation due to the high mobility of VN are still challenging and require more robust schemes. Additionally, the traditional clustering approaches cannot cope with current challenges such as low latency, bandwidth utilization, scalability, etc. Therefore, an intelligent clustering approach is needed where vehicles on the road can formulate a group on demand, avoiding unnecessary computation for grouping when fewer vehicles are in the network and achieving high bandwidth utilization for grouping a large number of vehicles on the road. Furthermore, selecting a backup cluster head from the eligible vehicles within the cluster in the case of cluster head departure can prolong the cluster connectivity. Moreover, the multi-hop approach in VN clustering algorithms is used to reduce the number of clusters, where a selected cluster head can cover more than one hop area, complying with the road structure.
The cloud can support performance analysis through the virtual unit, where the possible re-orchestration of network behavior can be deployed and tested before real-world implementation. Therefore, the virtualization approach could allow for the reformulation and integration of the network and related virtual functions to be deployed onto virtual motes [13,37]. This could promote the conceptualization of the digital twin for the virtual representation of real-life physical components. The vision of twinning technology refers to a near real-time, comprehensive, physical, and functional representation of a network with available operational data that are useful in all lifecycle network phases [38,39]. The context of network twinning reflects two main aspects: the dynamic behavior of the network and the history of the key critical events. Network twinning has evolved with the advent of the Internet of Things (IoT), wherein each plays an important role in networking. Although most studies in the field of digital twinning have highlighted the importance of this technology for various purposes, network digital twinning of vehicular grouping dynamics has not been adopted.
To gain the most essential insights, most of the research work and approaches for vehicular clustering have been considered to improve clustering efficiency and connection stability. Since the vehicular cluster is frequently affected by changes in network topology and vehicles can join or leave the cluster at any time, network lifetime plays a role in maintaining cluster dynamics. The challenges of network formation and recovery and network adaptability to the road structure have not been fully investigated. Mainly, the impact of high road dynamics such as lane changes, departure of vehicles, etc., on network sustainability and a possible overhead for the system during network recovery require more attention. Therefore, latency and communication delivery messages as performance measures for forming and maintaining a cluster need to be associated with road dynamics. Furthermore, the size of the cluster that can effectively be accommodated on the road, whether highway or city, and can flexibly manage the dynamic mechanism within this certain size has not been considered in relation to road parameters such as road capacity. Hence, the current clustering algorithms lack the elements of cluster flexibility under dynamic changes and scalability while adhering to traffic regulations. Utilizing technologies such as softwarization to improve the clustering approach is another significant area to be taken into consideration, paving the way towards network intelligence, 5G, and possibly future 6G networks. Additionally, cloud-level, software-driven virtualization serves as a testing platform for running and analyzing soft trials of dynamic network scenarios. By eliminating the need for hardware, such a parallel co-simulation operating on the cloud backend can significantly help expedite the network configuration process (during the testing process) [40]. Furthermore, it greatly accelerates the ability to facilitate the adaptive network reconfiguration process, allowing for real-time coordination of VN dynamics with those of externally monitored events. In our previous works [13,14], the self-formation and self-healing phases have been proposed and tested. In [14], the focus was on offering a group structure that can align with road traffic requirements and identifying the capacity of a given group per lane using the road parameters. From the network point of view, the capacity of the group is identified through the number of vehicles connected to a gateway router-capable node. In addition, the work examined the flexibility of the nodes to establish the process of formation on the virtual platform based on their functionality through softwarization [14]. The rapid dynamic events that require proper responses and adaptation to the occurrence of a dynamic event within the associated group of vehicles were considered in our previous work [13]. Such events could be attributed to a number of reasons such as diverging routes to be traversed by the various nodes, switching from one group to another, and members moving with dissimilar and varying speeds (owing to traffic conditions, etc.). The network fragmentation process arising out of events such as a node death caused by a sudden departure of a member node from its particular group would most likely result in an abrupt disruption of the sensed data flow and communication within the group. For example, in the case of the departure of the group leader, certain dependent children member nodes (of the departing node) could possibly be disconnected from the group and thus be rendered unmonitored. The work offered the algorithm of self-healing based on the software definition of the nodes to offer the flexibility of re-orchestrating the network. Preliminary testing highlighted the consistency of the node replacement selection process.
In this paper, an integration of the full lifecycle of the grouping scheme is proposed, employing the network virtualization. Herein, the performance of the scheme is crucial to be analyzed in terms of end-to-end delay to highlight the required time of the network to go through the phases of Self-X (i.e., self-formation, self-leaving, self-healing, and self-joining). This should be aligned with the road analysis reflecting the group lifecycle through life, sustainability, and death. This in effect requires identification of the ideal size of a given group on the highway as it goes through the phases of grouping. The scheme could be placed on a virtual machine to be tested and analyzed in order to offer the best performance for a physical network. It could also be used as an edge computational resource for managing group dynamics in reaction to various road-generated events.
3. Road Parameters and Modeling: Use Case of Highway Traffic Scenario
Looking into road parameters such as the safety distance between two vehicles traveling in the same lane, number of lanes, and the road stretch can provide the required analysis for the vehicular network. The capacity of a given lane, the capacity of the road, distribution, and density can reflect the possible size of a vehicular group that can be distributed and accommodated on the road. Additionally, the possibility of the network to have multi-levels/hops can be correlated with a given communication protocol and the road stretch. The size of each hop can be related to the overall road capacity. The highway is chosen as a use case scenario due to the continuous flow of vehicles with various speed limits. Figure 1 below depicts an example of a highway scenario where vehicles are distributed over four lanes within a given stretch. The distance between two vehicles (safety distance) is denoted as a two-second distance. A one-way road is considered for communication to avoid any interference between the two directions. The tree topology reflects the levels of connectivity represented by router level 1, router level 2, and router level 3 along with nodes configured with leaf functionality being the child of the parent node.
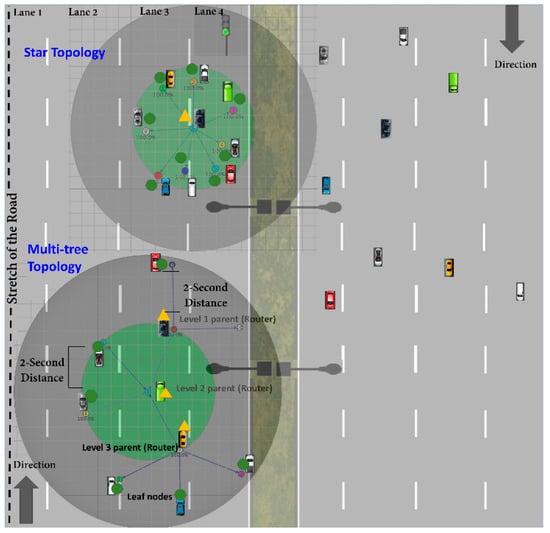
Figure 1.
Highway traffic scenario for vehicular grouping.
The road traffic and communication parameters can offer the ideal size of the vehicular group (be it a single hop or multi-hop) from the capacity point of view. The capacity and density of any group on the road can be defined to analyze the group size on a given stretch of the road. Additionally, factors including communication type, number of hops, and type of measurements are the network parameters used for the group size performance analysis. In our previous works [14,16], the main components of traffic modeling, such as distribution, density, and road capacity, have been provided. In this work, the algorithms of the model implementation are provided, and the testing results and analysis are explained in Section 5.
Based on a given mobile group stretch (boundary) over the road (road boundary or ) and the two-second distance (safety distance or ), which can be determined based on a given lane speed , the lane capacity on a highway road can be calculated and expressed as in Equation (1):
in which is the lane capacity (the maximum number of vehicles that the lane could accommodate within a given ) and the is obtained as per the lane speed ().
In a multiple lane road system, it is anticipated that the high-speed lane will typically have the fewest vehicles due to its restricted capacity, whereas the lower speed lane will typically have a larger number of vehicles. The distribution percentage of vehicles per lane, denoted by , and the density percentage of each lane, denoted by , are obtained using Equations (2) and (3), respectively, as below:
The total number of vehicles entering the road is represented by , and is the total number of vehicles distributed per lane.
In keeping with the context of vehicular group size calculations, the lane occupancy on a highway with, for example, a stretch of , assuming different numbers of vehicles on the road, can be calculated as in Equation (4):
As the number of lanes, is one of the road parameters that can have an impact on the possible distribution of number of vehicles on the road, and the ultimate road capacity can be calculated as in Equation (5):
in which is dependent on the speed of each lane within the road. For example, the majority of the highways in New Zealand specify the speed limit to be 100 km/h. Here, 80 and 110 km/h can be considered as and , respectively. For analytical purposes, the minimum road boundary for a vehicular group is assumed to be 1 km, and the maximum road boundary , which is subject to network performance evaluation, is assumed to be 4 km (discussed in Section 5).
The pseudo-code for defining a group size for a lane and for the road with a given number of lanes using road traffic parameters such as capacity is shown in Algorithm 1. Herein, the input values are lane speed, road boundary, number of lanes, etc., as shown in the pseudo-code. The main calculations involved are lane capacity, occupancy, density, distribution, and road capacity to analyze the estimated size of the group and thus relate it to the network design. These are all set based on the conditions given in the pseudo-code.
| Algorithm 1. Pseudo-code for group size based on road parameters. |
| Inputs: Lane speed , Road Boundary , Number of lanes , total number of vehicles travelling along the highway , number of vehicles travelling along a lane Initialize Safety distance based on a given Workout the ultimate capacity per lane CL using Equation (1) & ultimate road capacity using Equation (5) |
| for every do |
| if then |
| calculate the lane occupancy OL using Equation (4) |
| else |
| the lane is saturated |
| end if |
| end for |
| for each set of do |
| if then |
| is distributed on the road with if then |
| calculate distribution percentage using Equation (2) & density percentage using Equation (3) |
| end if |
| end if |
| end for |
| Output: estimated vehicular group size per lane and along the road |
The population of a specific group should be investigated as a network given that the road capacity across a given stretch has been specified. Here, we are examining the parameter that promotes a particular network structure. From the perspective of network communication and structure, the number of hop(s) is calculated as in Equation (6):
The ideal depends on the and the communication protocol’s transmission range for vehicle-to-vehicle communication. Herein, the maximum effective transmission range is multiplied by the confident range factor , where . The factor is defined based on the received RSSI being higher than a RSSIth constraint. IEEE 802.11p, for instance, has a transmission range of up to 1 km, with = 1, = 0.5, and = 2 hops.
The size of each hop in terms of the number of vehicles can be calculated based on the road capacity and the obtained number of hops as in Equation (7):
Based on defining the number of hops that is based on the road boundary and the transmission range of the chosen communication protocol, the maximum size of each hop in terms of number of vehicles can be obtained when the road capacity and number of hops are inputs in the pseudo-code as shown in Algorithm 2. However, this size is also dependent on conditions within each level/hop such as the type (functionality) of the connections. This can result in formulating the serial and parallel hops as described in Algorithm 2. Also, the capacity of a router node plays an important role in providing connectivity to the nodes, thus formulating the other levels based on the total number of hops for a given stretch. For example, the maximum size of a hop is 34 vehicles when the road capacity is 68 distributed over 4 lanes with a stretch of , and the obtained number of hops are 2 hops for the same stretch. Therefore, the number of vehicles for each hop could be equal to or less than the maximum hop size depending on the node functionality. This is subjected to network modeling and testing.
| Algorithm 2. Pseudo-code for the size of hop. |
| Inputs: Road capacity , Number of hops/levels Initialize Workout the maximum number of vehicles in each hop as “hop size” using Equation (7) |
| Initialize Head of level one () is one node |
| Initialize Number of connections (nodes) connected to as () |
| Initialize Number of connections (nodes) connected to (router function only) as () |
| if then |
| is either “leaf”, or “router” |
| if is router then |
| formulate level 2 (L2) |
| else network is one level only |
| end if |
| end if |
| if of level 1 then |
| are either “all leaf”, “all router”, or “mix of functions” |
| if some or all are with router functions then |
| formulate level 2 (L2) with possible parallel hops |
| else if are all with leaf function then |
| network is one level only |
| end if |
| end if |
| for each Level (L(n+1), n = (1, 2…)) formulated after level (1) do check |
| if one is with router function then |
| of L2 |
| else if more than one is with router function then |
| maximum capacity of each and |
| total of L2 |
| end if |
| if = 2 and all the nodes are connected then |
| a vehicular group with 2-hop is running in the highway |
| else |
| more hops are formulated |
| end if |
| end for |
| Output: serial and parallel hops as per each level’s connections and their functionalities |
4. Vehicular Grouping Self-X Phases Approach
The proposed structure of the vehicular network is based on a clustering approach designed to comply with the road regulations and intelligent communication methodology. As the network is bounded within a structured region, the term ‘grouping’ is used here to refer to the number of vehicles placed in a group based on a shared sequence of communication messages and the decision-making process among them. Our approach has looked at vehicular grouping through the Self-X (self-formation, self-leaving, self-healing, and self-joining) four-phase integration in which each phase goes through the stages of initialization and data dissemination, dynamic event trigger, and event response. While each stage is defined by a series of exchanged communication messages, the event response stage will also have a decision-making element that is represented by the fitness model.
From the general strategy and roles of the nodes point of view, the ad hoc communication between the nodes is a crucial stage for data collection and analysis, such as reflecting the ability of nodes to assume one of the three networking roles/functions within the group. This can significantly benefit the selection process when maneuvering the orchestration of the organization. As the network is formulated, the tree structure can have multi-hops/levels wherein each level can have a key network connectivity component (router/gateway node) as a head node. The existing active router/gateway node could depart from its initial position and leave the group/its level due a change in route, its movement with dissimilar and varying speed, etc., causing a failure within the level and/or the whole group. Herein, the Self-X mechanism is enhanced by the importance of the node function to trigger a given phase and take responsibility for any healing required in the network. For example, as dynamic events occur rapidly on the road, dynamic re-orchestration is required to recover the network from any fragmentation that may occur in the tree-based network topology. Therefore, a node configured with a router role is a potential replacement for the departed router if the selection requirements are met. The other process that emphasizes the node function is when the unconnected leaf nodes that have not been part of any level of the network request to join an eligible router located on any level/hop of the network.
Therefore, based on the WSN defined core functions, each phase is conditionally initiated and maintained to offer the full virtual organization of a flexible vehicular network. This in effect is an on-going mechanism, as some of the processes can be initiated at any time. However, the ending point of these processes is when the network becomes only a single vehicle and the possibility of node connectivity is not available. This could relate to the vehicular node being on a highway, its transmission range with respect to other nodes, and the speed compared to the speed of other vehicular nodes. Therefore, the lifecycle phases of the network dynamics can be reflected by networks running on a highway wherein each has its own lifecycle. Each network sustains its integrity with members until most of its members leave the network. Figure 2 depicts the state machine of the grouping approach design, reflecting the main phases. The initial process is when there is a call for network self-formation. The conditional transition to the self-healing state, for example, is the departure of a router node from the formulated network (the free-running state that is running the network after the self-formation state is completed). When the network is healed by a replacement router node, the transition back to the free-running state takes place to update the formulated network.
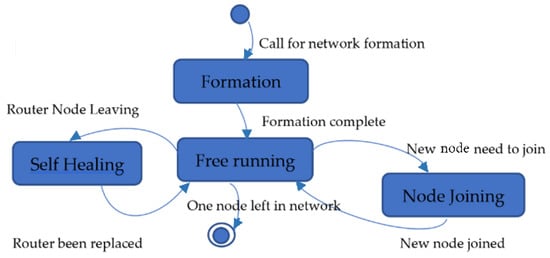
Figure 2.
State machine of vehicular grouping approach.
While Figure 2 above reflects the high-level state machine, a detailed illustration of the internal behavior represented by ‘entry’, ‘do’, and ‘exit’ of each phase, and the transitioning between states, is provided in Figure 3.
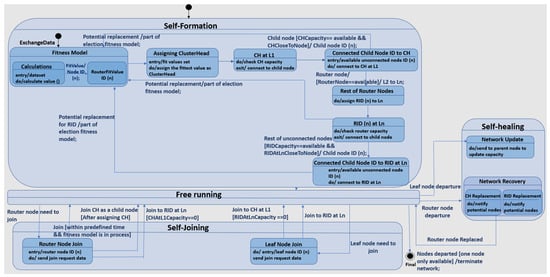
Figure 3.
Self-X grouping phases in the detailed state machine.
- Self-Formation: this is a compound state that has sub-states running; these are the fitness model, assigning cluster head (CH), cluster head at level 1 (L1), connected child node ID to cluster head, rest of router nodes, a router ID (RID) at level n (Ln), and connected child node ID to router ID at level n. The fitness model sub-state is initiated by exchanging data among the nodes, leading to calculations of the sub-state which has as its entry a data set to perform the required calculations. The outcome of the calculations are the fit values that can trigger the transition to the sub-state of router nodes ID with their fit values. The fitness model sub-state transits to assigning the cluster head sub-state where the entry is the set of fit values to perform, assigning the fittest value as the cluster head. Now that the cluster head has been assigned at level 1, this sub-state can check the cluster head capacity and exit this sub-state to connect to child nodes. The transition to the connected child nodes sub-state is conditional, as the cluster head capacity should be available and the cluster head is close to the nodes. Some of the nodes connected to the cluster head are routers that need to be assigned according to the levels of the network. Therefore, the transition from the connected child node sub-state is triggered when there is a router node as a child, and hence level 2 to level n can be taking place in the network. After the router ID at level n has been assigned, it will also check its capacity to connect to the available child nodes.
- Self-Joining: this process depends on the type of node that can join the network. When a leaf node requests joining, its sub-state has the leaf node ID as an entry to send the joining request to either the router node at level n where it can check the capacity within the sub-state of RID at Ln and then transit to connected child node sub-state if the capacity is available, or it sends the request to join the cluster head when the RID at Ln capacity is zero. Hence, the node will join the CH if it has a capacity to transition to the connected child node ID to CH sub-state. When a router node requests joining, its sub-state has the router node ID as an entry to send the joining request to the fitness model sub-state if the joining request is within a predefined time and the fitness model is in a process. This can lead to the node being part of the CH selection process where the followed sub-states can be performed as in the self-formation state. The second case is when the joining request is sent after assigning CH and hence requesting to join CH as a child node. This is a conditional transition to sub-state CH at L1 where the followed sub-states can be performed. The third case is when the cluster head capacity is zero and hence the transition will lead to RID at the Ln sub-state to perform the joining.
- Self-Leaving: this process also depends on the type of node that may leave the network. The departure of a leaf node can be from any level of the self-formulated network that will not cause disruption to the network. Therefore, the sub-state of leaf node departure needs to transit to the network update sub-state that is part of the self-healing state. The departure of a router node at any level of the self-formulated network may cause network disruption, depending on its level. Therefore, the sub-state of router node departure needs to transit to the network recovery sub-state that is part of the self-healing state.
- Self-Healing: this process has two main sub-states that depend on the type of departed node. When the departed leaf node is the child node of the cluster head, then the transition from the network update sub-state to the CH at the L1 sub-state within the compound self-formation state has the action of updating the capacity of CH. However, a transition to RID at the Ln sub-state within the compound self-formation state has the action of updating the RID at Ln capacity when the departed leaf node is the child of RID at Ln. When the CH departs the network, the network recovery sub-state has the cluster head replacement sub-state that can transit to the ‘connected child node to the CH’ sub-state within the compound self-formation state only when the potential replacement is a router child node. Then the transition will be to the ‘fitness model’ sub-state to be part of selecting a replacement node. This can also involve RID at Ln to be part of replacement CH selection. When RID at Ln departs the network, the network recovery sub-state has the RID replacement sub-state that can transit to the ‘connected child node to RID at Ln’ sub-state within the compound self-formation state only when the potential replacement is a router child node. Then the transition will be to the fitness model sub-state to be part of selecting a replacement node. The free running state can lead to the final state when the nodes have departed and only one node is left, causing the network to be terminated.
The key parameters for structuring the vehicular dynamic grouping phases are related to RSSI (received signal strength indicator), node capacity, and vehicular speed. Furthermore, the look-ahead approach using route information is also considered as part of the overall vision in sustaining the dynamic structure of the mobile vehicular group [13,14]. Additional parameters are utilized in some of the phases as part of the dynamic phase requirements, such as the RSSI between the gateway node and potential node replacement in the self-healing phase.
From a packet format point of view, the packet format has an impact on the node selection within each phase of the vehicular grouping approach (such as a replacement router node for the departed one). Hence, every router node within the network, regardless of its level, should have the same packet format, which promotes consistency in selecting a node, be it at a lower or upper level. The size of the packet depends on the communication protocol such as Wi-Fi to offer the appropriate format in which to load the packet with the required data. Within the multi-hop approach, a mixed mode of a given hop dealing with lower-level router(s) and leaf node(s) can be applied. This can affect the packet format that needs to be sent to the upper levels of the network. Hence, the packet format of a router includes the data of its connected leaf nodes and its own data, taking into account the protocol used in the network design to comply with the packet size. As shown in Figure 4, node RL1-1 receives data from RL2-1 and RL2-2 and sends them as they are to the upper level. It also generates the packet related to its own data.
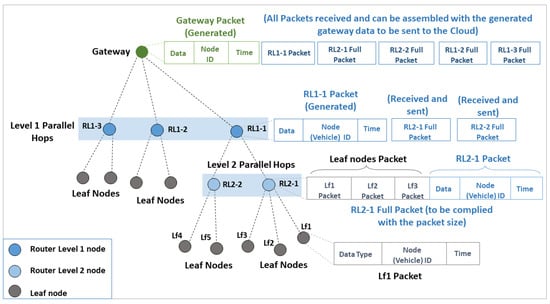
Figure 4.
The packet format of a self-formulated tree structure.
It is assumed that the delay that occurs in a single-hop (the lowest level), , when the data are transmitted from the source (leaf node) to the destination (router node), is calculated based on the propagation delay within a hop and the transmission delay . , , and are obtained using Equations (8)–(10), respectively, as below [16]:
wherein is the difference between time stamps of the message receipt () of the destination and transmission () of the source node. In doing so, can also be increased depending on the number of nodes connected to the router. The transmission delay is calculated as in [41]. However, the propagation delay is considered in our work as it was obtained in Equation (8). is described in Equation (9):
wherein is the length of a packet/message transmitted by a node. Herein, of a router or gateway node can vary depending on the number of connections. is the communication message transmission rate. The delay in a hop is described in Equation (10):
An event could take place in the vehicular group that causes a latency that needs to be analyzed. For example, the self-healing phase is one of the crucial processes that can take place at any level of the network. The latency in executing the healing process is highly important as it leaves some of the network nodes unable to pass their data. Pre-planning using available vehicular routing data is therefore highly important to avoid this blind region. As the stages of the vehicular grouping approach have been mentioned earlier, the Event Trigger stage is defined in the self-healing phase when a router node at any level of the network or a gateway node departs the network. Therefore, the Event Response stage is defined when a capable node replacement is selected. This phase depends on the entailed delay by the communication messages/packets that are generated and exchanged between the eligible nodes and gateway node, and the computational processing time. Figure 5 illustrates the nodes involved in the process when RL1-1 departs from its location. Herein, the departed router disseminates information about its departure to the gateway, RL2-1 and RL2-2. The latency of the Event Trigger represented by the departed router data dissemination is calculated in Equation (11):
wherein is the difference between the time of the destination (last affected node to receive the data from ) and the transmission time of . is the transmission delay entailed by .
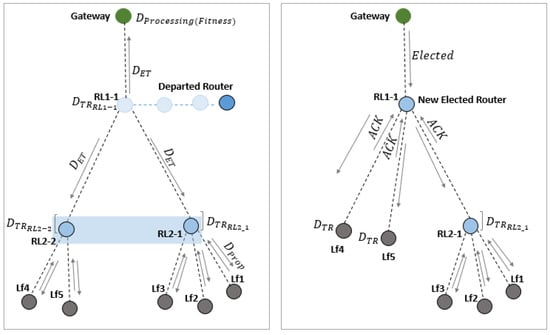
Figure 5.
Self-healing phase latency modeling.
The eligible nodes being part of the replacement departed node selection, based on their functionality, maximum capacity, and available vacancy, can entail latency in sending the data to the gateway, causing . The delay entailed by the data received by the gateway and thus processing delay caused by running the fitness model for the eligible nodes result in the total delay entailed by the eligible nodes during the event response stage. This is expressed in Equation (12):
The gateway node (GW) sends the new role of replacement to the node that has a superior fitness value. For example, RL2-2 is the new selected node (EN) that sends a notification of its new role to the affected nodes. The latency for the stage of announcing the selected node ( is expressed in Equation (13):
Then, the leaf nodes of the selected node and other connected nodes send acknowledgment (Ack) to the selected node, causing . Each node sending the Ack can experience transmission delay . The processing on gateway nodes, such as updating its capacity, causes . Also, the new selected node will update its ID to be the RL1-1 and its capacity, causing . The latency of the post-selection is expressed in Equation (14):
5. Model Testing and Analysis
5.1. Road Traffic Model Development and Analysis
From the analysis point of view, Figure 6 shows the ultimate capacity of a lane within a given speed based on various ranging from 1 to 4 km. Therefore, the lane occupational capacity is increased with the increase in . For example, the capacity of a lane with a speed of is increased from 22 to 90 vehicles when is increased from 1 to 4 , respectively. This indicates the relationship between various numbers of vehicles and the speed limit of highway lanes within the road stretch, reflecting the estimated number of vehicles in a formed group.
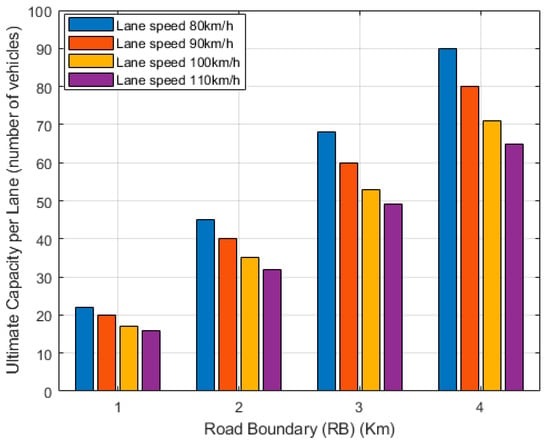
Figure 6.
The lane vehicular capacity as a function of road stretch.
With the increase of number of lanes , the overall road capacity is obtained in which is dependent on the speed of each lane within the road. is one of the road parameters that can have an impact on the possible distribution of number of vehicles on the road. As an example and for analysis purposes, if is considered to be 100 km/h for all the lanes within the road, then will be , and can be obtained depending on the set of number of lanes and road boundary as shown in Figure 7. Therefore, for example, the ultimate road capacity is 284 vehicles when the road boundary () is 4 km and the number of lanes is 4. Figure 7 below clarifies the variation in road capacity in relation to the number of lanes and stretch of the road.
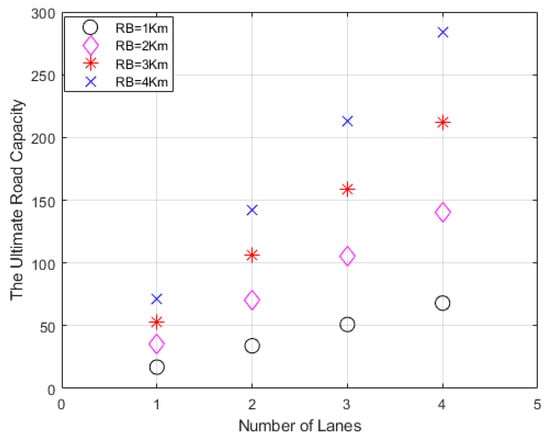
Figure 7.
Ultimate road capacity.
In keeping with the context of the road structure model parameters, the lane occupancy on a highway with a stretch of can be obtained. Having a set of number of vehicles traveling along the highway, a lane with a given speed can be partially or fully occupied with vehicles depending on the lane’s ultimate capacity. This can be shown in Figure 8, wherein four lanes with various speeds range from 80 to 110 km/h and the number of vehicles (5, 10, 15, and 22) moving along each lane are utilized for testing lane occupancy. The lane with a speed of is 23% occupied by vehicles from its maximum limit when the number of vehicles entering the lane is 5. However, the lanes with speed of 90, 100, and 110 reach a saturation point (beyond 100%), as highlighted in red in Figure 8, as the number of vehicles is increased to 22. This is due to the ultimate capacity of these lanes as shown in Figure 6.
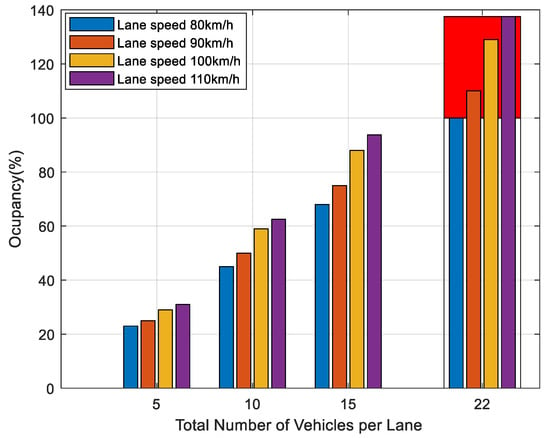
Figure 8.
Percentage of lane occupancy.
The other road parameters that have an impact on the vehicular network structure on the road are density () and distribution of vehicles (). Depending on the total number of vehicles traveling on a given highway road stretch that has several lanes with a defined capacity for each lane, the distribution of vehicles for each lane would vary accordingly. Hence, a lane can be less or fully dense. It is assumed in a multiple lane road system that the high-speed lane could have the lowest number of vehicles due to its limited capacity while the lower speed lane could have a greater number of vehicles. Figure 9 below shows hypothesized distribution percentages of vehicles on a road with four lanes. A total number of 10-, 20-, 30-, 40-, and 50-vehicle scenarios are considered for distribution on a 4-lane highway with a stretch of . The distribution percentage for each lane here takes into consideration the ultimate lane capacity. For example, with 10 vehicles traveling along the highway, 40% of the vehicles can be traveling along the lane with a speed of , as shown in Figure 9. This contributes to 4 vehicles out of 22 vehicles, which is the ultimate capacity for this lane. The random distribution of various cases can be reflected in the vehicular grouping model to evaluate the network structure.
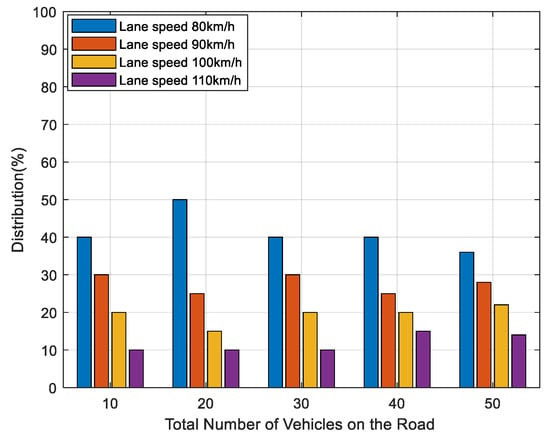
Figure 9.
Percentage of distribution of vehicles.
Figure 10 indicates the density percentage for each lane considering the obtained distribution percentage of the lane that depends on allocating the number of vehicles for each lane based on the total number of vehicles traveling along the highway. This can be a validation for the possible vehicular grouping structure, as the lanes should be less dense to offer the flexibility for the network to perform under future dynamic scenarios. For example, vehicles can join the formulated group based on the self-joining approach, which requires the network to be below saturation in terms of density. This can allow the network to have vacancy for the nodes to join its group. As is shown in Figure 10, the density percentage is almost 82% for the lane with a speed of when 18 vehicles are distributed in this lane out of 50 vehicles traveling along the highway.
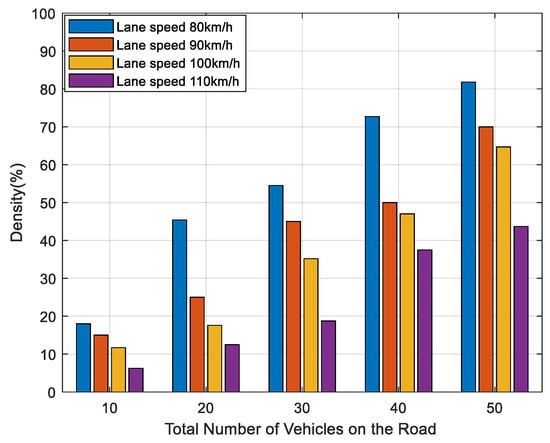
Figure 10.
Percentage of density.
5.2. Vehicular Network-Based Model Development and Analysis
The behavior of the vehicular network-based Self-X grouping approach is modeled using the Contiki–Cooja network simulator. Simulation parameters, such as number of hops, are set to design the various scenarios and processes. Table 1 depicts the Cooja main simulation parameters taking into consideration the network and road parameters. Herein, the simulation time is chosen as 5 min for running the network to generate and collect data. The number of lanes is set to 4 for distributing the nodes in Cooja that are represented by the squares in the simulation window. The other parameter is the number of nodes configured with a given function to perform the main tasks in the network, such as a gateway-capable node. This parameter may vary for testing purposes. Self-formation and self-healing are considered as core processes for the vehicular grouping that need to be evaluated based on measures like latency.

Table 1.
Simulation parameters.
5.2.1. Pre-Grouping Structure Latency
Under this stage, the latency in the communication that is both the transmission and propagation delay is analyzed based on the time that the node takes to disseminate its data to the neighbor nodes and all the neighboring nodes are receiving the data. Figure 11 below shows that with the increase in number of vehicles (5, 10, 15, 20, 25, and 30), latency in communication occurs due to the ad hoc flat communication nature among the nodes where the messages are being sent and could be received by every node within the transmission range. Herein, the timestamps in cooja, with the focus on and , were collected to reflect the latency.
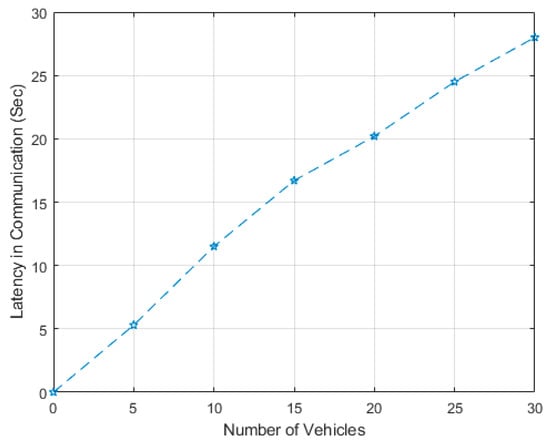
Figure 11.
Latency in communication.
This pre-grouping analysis reflects the need for a formation where a dedicated node can act as a receiver and therefore the latency in communication can have a better performance. In addition, it shows that it is necessary to configure a given number of nodes (the number of nodes that are performing well) to have the ability to perform the ‘call for formation’ task.
5.2.2. Gateway Router-Capable Node Capacity
The suggested road stretch and its ultimate capacity based on the suggested highway traffic scenario indicate a possible distribution in which the available vehicles within the road may occupy full or partial capacity. Based on that, the number of hops and the time needed for formulating the vehicular network will vary accordingly. The other factor that can influence the structure of the network is the transmission range of the communication protocol, where the nodes should be within the line of sight (LoS) to formulate the level(s) of connectivity. The gateway router-capable functional node that is operational under any phase of the vehicular grouping approach is set to have a number of connections (capacity). Herein, the best size of a formulated group is tested through the analysis of the gateway-router node capacity in covering the available nodes using a Cooja simulator. As indicated by the road traffic model in which the road’s ultimate capacity is 17 vehicles when the speed lane is 100 km/h, the set of number of vehicles (5, 10, 15, and 20) is considered. In the Cooja scenario, the communication message rate is considered in the range of 5, 10, 15, and 20 messages/second. Based on Figure 12 below, the received messages by a gateway router node connecting five vehicles range from 100% to 86%, whereas the received messages by a gateway router node connecting 10 vehicles, 15 vehicles, and 20 vehicles, respectively, range from 100% to 70%, from 93% to 64%, and from 85% to 61%. The outcome here reflects the possible size of a vehicular group as well as its boundary in a given hop. The ideal size in this scenario would be a group head node connected to 5 or 10 vehicles, forming a single-hop group, with a message rate of 5 messages/second, with 100% of the messages being received. However, this is subject to the number of available vehicles on the road and the type of vehicular application for which a suitable message rate can be chosen.
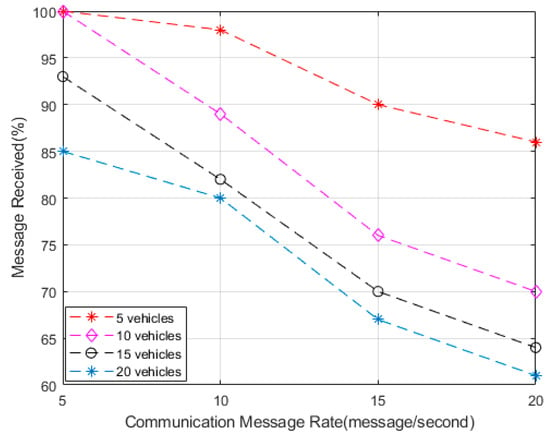
Figure 12.
Gateway router-capable node capacity.
5.2.3. Hop Latency
This phase has stages of initialization and data dissemination represented by the ‘Hello’ packet exchanged by the gateway router-capable nodes. The Event Trigger stage is when potential nodes are part of selecting a group head. The event response stage is when the fitness values are exchanged to make a decision for group head selection as well as the rest of the topology. Since each stage has a latency associated with it when it is executed, the self-formation phase is assessed based on the transactional latency. The router node load, in terms of number of connections, within the formulated network is tested based on the average latency in transmitting the data through a router to a gateway as shown in Figure 13. This is related to , , and in the latency model. The set of number of vehicles (5, 10, 15, and 20) is chosen as the number of connections to the router. This also sheds light on the router’s current load and the latency experienced during the parallel hop [16].
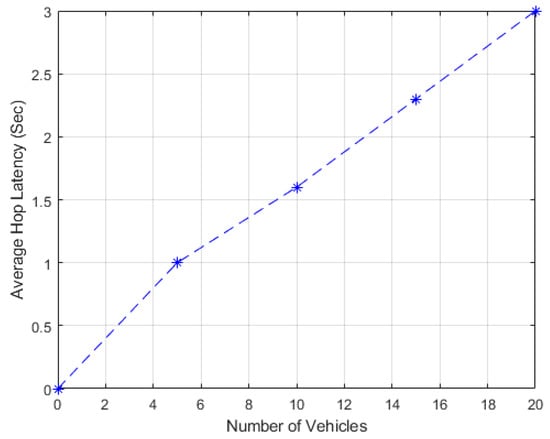
Figure 13.
Average hop latency (router node load latency).
5.2.4. Latency in Event Response: Network Self-Healing Case
The Cooja scenarios are designed for evaluating the self-healing process with a focus on the event response wherein the network can be re-orchestrated. This stage is dependent on the network factors of network size (in terms of number of hops) and the number of the eligible nodes configured with the replacement functionality to be part of the fitness model. The analysis with the focus on latency is discussed based on the evaluation of the number of capable nodes during the event response, including the processes of the fitness model, when a node is selected, and taking the responsibility of the unconnected nodes (resuming the operation of the network). Latency that occurred within the event response stage is looked at from the fitness computation process and the announcement of the new selected node to resume the operation of the network. This stage is mainly dependent on the number of eligible (capable) nodes participating in the selection process. For the fitness computation, the analytical latency model involves the main components creating the delay within this process. After computing the values of the nodes (an example of the node values is depicted in Figure 14, where node ID 4 is 235 and node ID 6 is 255), the node is selected (node ID 6 in the given example) owing to its superior fitness value. The latency entailed by the announcement of the new replacement node and by establishing the connection with the child nodes of the departed router is part of the event response and re-orchestration of the network.

Figure 14.
The outcome of computing the fitness values based on Cooja.
Figure 15 depicts the number of ‘capable replacement’ nodes experiencing latency in Event Response as part of the competition’s fitness computation process. The number of eligible (capable replacement) nodes competing to replace the departed node increases the average latency during the fitness computation process. This is due to the propagation, transmission, and processing (running the fitness model) delay, which is explained in Section 4.
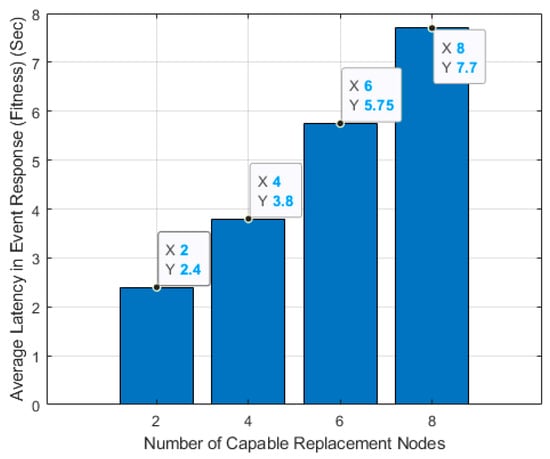
Figure 15.
Average latency in event response (fitness computation).
Figure 16 depicts the event response latency following the selection of the eligible node. This includes the latency associated with the gateway announcing the new role to the new replacement node and the new node establishing the connection to the departed node’s child nodes. The increase in number of nodes that the new node needs to establish the connection will impact the latency of the process. Herein, latency increases when the new node establishes a connection with 15 nodes.
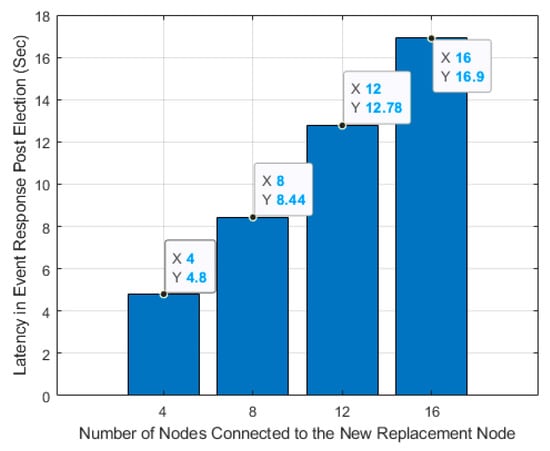
Figure 16.
Latency in event response (post-selection).
6. Conclusions
The paper proposes phases of the Self-X vehicular grouping approach (i.e., self-formation, self-leaving, self-healing, and self-joining) based on a flexible network that can adapt to dynamic changes on the road. For example, vehicles leaving the group may rupture the data network and cause fragmentation or isolation of part of the network, which raises the need for intelligence for smart healing. The aim of the proposed approach is developing an effective framework for vehicular grouping that is mainly governed by the road regulations, the size of a vehicular group that is bounded by a given road stretch, the number of lanes, and the road type to facilitate data dissemination and route optimization with the ever-increasing data traffic demands.
As vehicular grouping tends to be influenced by road dynamics and frequent topological changes, the performance of the network, mainly its response and recovery time, can be significantly affected by road dynamics. Therefore, it is crucial to analyze the performance of the scheme in terms of latency to highlight the time required for the network to be healed, as an example. This should be aligned with road analysis reflecting the group lifecycle through life, sustainability, and death. This in effect requires identification of the ideal size of a given group on the road as it goes through the phases of grouping. For this purpose, a road traffic and latency models are designed to support the vehicular group dynamic structure on the road.
The paper provides an analysis of the vehicular grouping approach with emphasis on the flexibility of the nodes to assume one or more functions for the orchestration and re-orchestration processes. The proposed approach is modeled using the Contiki–Cooja simulation tool and analyzed based on latency. The road traffic model is considered to support the vehicular grouping approach analysis. Therefore, we focused on the road capacity, density, and distribution, and the results obtained reflect the ideal size of a group that can be distributed on the road. This was analyzed based on a set number of lanes ranging from 1 to 4 lanes. The group formation process is tested based on router node capacity considering the road stretch and its ultimate capacity. This analysis reflects the need of the vehicular network structure to be complied with the road layout. Therefore, the data received by a router node with a different number of vehicles reflect the possible size of a vehicular group. The other scenarios explore the organization of a vehicular network with emphasis on resolving the vehicular clusters’ self-healing in the event of a routing node’s departure. The model is tested based on the latency entailed by a different number of eligible nodes during the fitness computation process. Finally, the latency that occurred post-selection was considered.
Author Contributions
Conceptualization, D.Z.A.-H. and A.A.-A.; methodology, D.Z.A.-H. and A.A.-A.; software, D.Z.A.-H.; validation, D.Z.A.-H.; formal analysis, D.Z.A.-H.; investigation, D.Z.A.-H.; resources, D.Z.A.-H. and A.A.-A.; data curation, D.Z.A.-H.; writing—original draft preparation, D.Z.A.-H.; writing—review and editing, D.Z.A.-H. and A.A.-A.; visualization, D.Z.A.-H.; supervision, A.A.-A.; project administration, A.A.-A.; All authors have read and agreed to the published version of the manuscript.
Funding
This research received no external funding.
Data Availability Statement
Not applicable, the study does not report any data.
Conflicts of Interest
The authors declare no conflict of interest.
References
- Arena, F.; Pau, G.; Severino, A. V2X communications applied to safety of pedestrians and vehicles. J. Sens. Actuator Netw. 2020, 9, 3. [Google Scholar] [CrossRef]
- Ayyub, M.; Oracevic, A.; Hussain, R.; Khan, A.A.; Zhang, Z. A comprehensive survey on clustering in vehicular networks: Current solutions and future challenges. Ad Hoc Netw. 2022, 124, 102729. [Google Scholar] [CrossRef]
- Ahmad, M.; Ikram, A.A.; Wahid, I.; Ullah, F.; Ahmad, A.; Khan, F.A. Optimized clustering in vehicular ad hoc networks based on honey bee and genetic algorithm for internet of things. Peer-Peer Netw. Appl. 2020, 13, 532–547. [Google Scholar] [CrossRef]
- Khan, Z.; Fan, P.; Abbas, F.; Chen, H.; Fang, S. Two-level cluster based routing scheme for 5G V2X communication. IEEE Access 2019, 7, 16194–16205. [Google Scholar] [CrossRef]
- Khan, Z.; Fang, S.; Koubaa, A.; Fan, P.; Abbas, F.; Farman, H. Street-centric routing scheme using ant colony optimization-based clustering for bus-based vehicular ad-hoc network. Comput. Electr. Eng. 2020, 86, 106736. [Google Scholar] [CrossRef]
- Wahid, I.; Ikram, A.A.; Ahmad, M.; Ali, S.; Ali, A. State of the art routing protocols in VANETs: A review. Procedia Comput. Sci. 2018, 130, 689–694. [Google Scholar] [CrossRef]
- Rashid, S.A.; Audah, L.; Hamdi, M.M.; Alani, S. Prediction Based Efficient Multi-hop Clustering Approach with Adaptive Relay Node Selection for VANET. J. Commun. 2020, 15, 332–344. [Google Scholar] [CrossRef]
- Khan, Z.; Fan, P.; Fang, S.; Abbas, F. An unsupervised cluster-based VANET-oriented evolving graph (CVoEG) model and associated reliable routing scheme. IEEE Trans. Intell. Transp. Syst. 2019, 20, 3844–3859. [Google Scholar] [CrossRef]
- Abbas, F.; Fan, P. Clustering-based reliable low-latency routing scheme using ACO method for vehicular networks. Veh. Commun. 2018, 12, 66–74. [Google Scholar] [CrossRef]
- Senouci, O.; Harous, S.; Aliouat, Z. Survey on vehicular ad hoc networks clustering algorithms: Overview, taxonomy, challenges, and open research issues. Int. J. Commun. Syst. 2020, 33, e4402. [Google Scholar] [CrossRef]
- Pal, R.; Prakash, A.; Tripathi, R.; Singh, D. Analytical model for clustered vehicular ad hoc network analysis. ICT Express 2018, 4, 160–164. [Google Scholar] [CrossRef]
- Abbas, T.; Tufvesson, F. Line-of-sight obstruction analysis for vehicle-to-vehicle network simulations in a two-lane highway scenario. Int. J. Antennas Propag. 2013, 2013, 1–9. [Google Scholar] [CrossRef]
- Al-Hamid, D.Z.; Al-Anbuky, A. Vehicular Grouping and Network Formation: Virtualization of Network Self-healing. In Proceedings of the 2018 International Conference on Internet of Vehicles; Springer: Paris, France, 2018; pp. 106–121. [Google Scholar]
- Al-Hamid, D.Z.; Al-Anbuky, A. Vehicular Grouping Protocol: Towards Cyber Physical Network Intelligence. In Proceedings of the 2021 IEEE International Conferences on Internet of Things (iThings), Melbourne, Australia, 6–8 December 2021; pp. 9–16. [Google Scholar]
- Al-Hamid, D.Z.; Al-Anbuky, A. Vehicular Network Dynamic Grouping Scheme. In Proceedings of the 2021 IEEE International Conference on Autonomic Computing and Self-Organizing Systems Companion (ACSOS-C), Washington, DC, USA, 27 September–1 October 2021; pp. 316–318. [Google Scholar]
- Al-Hamid, D.Z.; Al-Anbuky, A. Vehicular Intelligence: Towards Vehicular Network Digital-Twin. In Proceedings of the 2022 27th Asia Pacific Conference on Communications (APCC), Jeju Island, Republic of Korea, 19–21 October 2022; pp. 427–432. [Google Scholar]
- Aung, N.; Zhang, W.; Dhelim, S.; Ai, Y. T-Coin: Dynamic traffic congestion pricing system for the Internet of Vehicles in smart cities. Information 2020, 11, 149. [Google Scholar] [CrossRef]
- Karegar, P.A.; Al-Anbuky, A. Travel Path Planning for UAV as a Data Collector for a Sparse WSN. In Proceedings of the 2021 17th International Conference on Distributed Computing in Sensor Systems (DCOSS), Pafos, Cyprus, 14–16 July 2021; pp. 359–366. [Google Scholar]
- Karegar, P.A.; Al-Anbuky, A. UAV-assisted data gathering from a sparse wireless sensor adaptive networks. Wirel. Netw. 2022, 1–18. [Google Scholar] [CrossRef]
- Magsino, E.R.; Ho, I.W.-H. An enhanced information sharing roadside unit allocation scheme for vehicular networks. IEEE Trans. Intell. Transp. Syst. 2022, 23, 15462–15475. [Google Scholar] [CrossRef]
- Knoop, V.; Keyvan-Ekbatani, M.; De Baat, M.; Taale, H.; Hoogendoorn, S. Lane change behavior on freeways: An online survey using video clips. J. Adv. Transp. 2018, 2018, 9236028. [Google Scholar] [CrossRef]
- Xie, Y.; Ho, I.W.-H.; Magsino, E.R. The modeling and cross-layer optimization of 802.11 p VANET unicast. IEEE Access 2017, 6, 171–186. [Google Scholar] [CrossRef]
- Mukhtaruzzaman, M.; Atiquzzaman, M. Clustering in vehicular ad hoc network: Algorithms and challenges. Comput. Electr. Eng. 2020, 88, 106851. [Google Scholar] [CrossRef]
- Katiyar, A.; Singh, D.; Yadav, R.S. State-of-the-art approach to clustering protocols in VANET: A survey. Wirel. Netw. 2020, 26, 5307–5336. [Google Scholar] [CrossRef]
- Jalooli, A.; Zhang, K.; Song, M.; Wang, W. A Novel Clustering Scheme for Heterogeneous Vehicular Networks. In Proceedings of the 2020 IEEE International Conference on Communications (ICC), Dublin, Ireland, 7–11 June 2020; pp. 1–6. [Google Scholar]
- Alsuhli, G.H.; Khattab, A.; Fahmy, Y.A. Double-head clustering for resilient VANETs. Wirel. Commun. Mob. Comput. 2019, 2019, 2917238. [Google Scholar] [CrossRef]
- Cheng, X.; Huang, B. A center-based secure and stable clustering algorithm for VANETs on highways. Wirel. Commun. Mob. Comput. 2019, 2019, 8415234. [Google Scholar] [CrossRef]
- Dua, A.; Sharma, P.; Ganju, S.; Jindal, A.; Aujla, G.S.; Kumar, N.; Rodrigues, J.J. RoVAN: A rough set-based scheme for cluster head selection in vehicular ad-hoc networks. In Proceedings of the 2018 IEEE Global communications conference (GLOBECOM), Abu Dhabi, United Arab Emirates, 9–13 December 2018; pp. 206–212. [Google Scholar]
- Abbas, A.; Audah, L.; Alduais, N. An Efficient Load Balance Algorithm for Vehicular Ad-Hoc Network. In Proceedings of the 2018 Electrical Power, Electronics, Communications, Controls and Informatics Seminar (EECCIS), Batu, East Java, Indonesia, 9–11 October 2018; pp. 207–212. [Google Scholar]
- Ren, M.; Khoukhi, L.; Labiod, H.; Zhang, J.; Veque, V. A mobility-based scheme for dynamic clustering in vehicular ad-hoc networks (VANETs). Veh. Commun. 2017, 9, 233–241. [Google Scholar] [CrossRef]
- Taha, S.; Shen, X. Lightweight Group Authentication with Dynamic Vehicle-Clustering for 5G-Based V2X Communications. In Proceedings of the 2018 IEEE Global Communications Conference (GLOBECOM), Abu Dhabi, United Arab Emirates, 9–13 December 2018; pp. 1–6. [Google Scholar]
- Mir, Z.H.; Filali, F. LTE and IEEE 802.11p for vehicular networking: A performance evaluation. EURASIP J. Wirel. Commun. Netw. 2014, 2014, 89. [Google Scholar]
- Marzak, B.; Toumi, H.; Talea, M.; Benlahmar, E. Cluster head selection algorithm in vehicular Ad Hoc networks. In Proceedings of the 2015 International Conference on Cloud Technologies and Applications (CloudTech), Marrakech, Morocco, 2–4 June 2015; pp. 1–4. [Google Scholar]
- Mehmood, A.; Khanan, A.; Mohamed, A.H.; Mahfooz, S.; Song, H.; Abdullah, S. ANTSC: An intelligent Naïve Bayesian probabilistic estimation practice for traffic flow to form stable clustering in VANET. IEEE Access 2017, 6, 4452–4461. [Google Scholar] [CrossRef]
- Banikhalaf, M.; Khder, M.A. A Simple and Robust Clustering Scheme for Large-Scale and Dynamic VANETs. IEEE Access 2020, 8, 103565–103575. [Google Scholar] [CrossRef]
- Hamedani, P.S.; Rezazadeh, A. A New Two Level Cluster-Based Routing Protocol for Vehicular Ad Hoc NETwork (VANET). In Proceedings of the 2018 UKSim-AMSS 20th International Conference on Computer Modelling and Simulation (UKSim), Cambridge, UK, 27–29 March 2018; pp. 121–126. [Google Scholar]
- Karegar, P.A.; Al-Anbuky, A. UAV as a Data Ferry for a Sparse Adaptive WSN. In Proceedings of the 2022 27th Asia Pacific Conference on Communications (APCC), Jeju Island, Republic of Korea, 19–21 October 2022; pp. 284–289. [Google Scholar]
- Madni, A.M.; Madni, C.C.; Lucero, S.D. Leveraging Digital Twin Technology in Model-Based Systems Engineering. Systems 2019, 7, 7. [Google Scholar] [CrossRef]
- Khan, L.U.; Han, Z.; Saad, W.; Hossain, E.; Guizani, M.; Hong, C.S. Digital Twin of Wireless Systems: Overview, Taxonomy, Challenges, and Opportunities. IEEE Commun. Surv. Tutor. 2022, 24, 2230–2254. [Google Scholar] [CrossRef]
- Acharyya, I.S.; Al-Anbuky, A. Towards wireless sensor network softwarization. In Proceedings of the 2016 IEEE NetSoft Conference and Workshops (NetSoft), Seoul, Republic of Korea, 6–10 June 2016; pp. 378–383. [Google Scholar]
- Cao, L.; Yin, H.; Hu, J.; Zhang, L. Performance analysis and improvement on DSRC application for V2V communication. In Proceedings of the 2020 IEEE 92nd Vehicular Technology Conference (VTC2020-Fall), Victoria, BC, Canada, 16 December 2020; pp. 1–6. [Google Scholar]
Disclaimer/Publisher’s Note: The statements, opinions and data contained in all publications are solely those of the individual author(s) and contributor(s) and not of MDPI and/or the editor(s). MDPI and/or the editor(s) disclaim responsibility for any injury to people or property resulting from any ideas, methods, instructions or products referred to in the content. |
© 2023 by the authors. Licensee MDPI, Basel, Switzerland. This article is an open access article distributed under the terms and conditions of the Creative Commons Attribution (CC BY) license (https://creativecommons.org/licenses/by/4.0/).