Abstract
Vessel recognition plays important role in ensuring navigation safety. However, existing methods are mainly based on a single sensor, such as automatic identification system (AIS), marine radar, closed-circuit television (CCTV), etc. To this end, this paper proposes a coarse-to-fine recognition method by fusing CCTV and marine radar, called multi-scale matching vessel recognition (MSM-VR). This method first proposes a novel calibration method that does not use any additional calibration target. The calibration is transformed to solve an N point registration model. Furthermore, marine radar image is used for coarse detection. A region of interest (ROI) area is computed for coarse detection results. Lastly, we design a novel convolutional neural network (CNN) called VesNet and transform the recognition into feature extraction. The VesNet is used to extract the vessel features. As a result, the MVM-VR method has been validated by using actual datasets collected along different waterways such as Nanjing waterway and Wuhan waterway, China, covering different times and weather conditions. Experimental results show that the MSM-VR method can adapt to different times, different weather conditions, and different waterways with good detection stability. The recognition accuracy is no less than 96%. Compared to other methods, the proposed method has high accuracy and great robustness.
1. Introduction
In recent years, the economic effects of inland waterway navigation have been highlighted than ever along with the rapid development of the Chinese economy [1], whose safety is coming to the fore with increasingly more inland vessels. Waterway safety is focusing on timely monitoring and accurately recognizing vessels that may be monitored employing many systems such as automatic identification system (AIS), marine radar, and closed-circuit television (CCTV). AIS refers to aid to navigation system applicable to maritime safety and communication among vessels and shores [2] so that important information such as position, speed, course, vessel name, and call sign can be automatically exchanged and traffic information can be effectively obtained without radar detection; as a consequence, vessel collision accidents can effectively reduce. However, many vessels without AIS are sailing in some areas especially in China although they are always required to equip AIS. Therefore, it is necessary to develop a hybrid method for inland ship recognition using marine radar and CCTV.
In recent years, marine radar has been improved rapidly to detect vessels. Radar systems with high sensitivity provide many informative images of surroundings. The latest S-band marine radar is capable of tracking a 0.5 (m2) object 5 miles away. Maritime radar can detect a long distance but cannot recognize the kind of vessels. Meanwhile, CCTV can provide high-quality images and shows the detail of the vessels [3,4]. If the image and maritime radar are fused and their advantages are given full play, the detection speed and recognition accuracy can be improved as well, as shown in Figure 1. In general, the overall goal of the detection presented in this paper is to fuse the above two systems and recognize the vessels in a fast and accurate way. The nomenclature list of this paper is shown in Table 1.
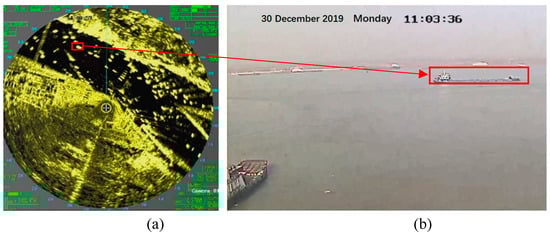
Figure 1.
Data collected from marine radar and CCTV: (a) marine radar; (b) CCTV.

Table 1.
Nomenclature list of this paper.
2. Related Work and Contributions
Vessel recognition can be divided into two steps: vessel detection and vessel recognition and various marine radar-based methods were proposed for the latter. For instance, a pre-processing approach was put forward to estimate the length of small and slow marine targets for forward scatter maritime radar. Unfortunately, most marine radar systems work on a low pulse repetition frequency mode, and the Doppler signal and velocities are ambiguous. Ma et al. proposed a generalized Bayesian inference method which is called the evidential reasoning (ER) rule for vessel recognition by using radar images. The method has three steps. Firstly, the method computes the likelihood for velocity, direction by radar images. Furthermore, the likelihood is transformed to be multiple evidence and then weight coefficients are trained with a nonlinear optimization model. Vessels are recognized by weight coefficient [5]. A Bayesian network-based methodology was presented recently to extract vessels based on radar images [6], where the inter-frame difference is primarily applied to take vessels velocity, direction and shape into account and a directed acyclic graph is set up for vessel recognition. The proposed method includes laying the foundation of targets extraction on original radar images and verified records without making any unrealistic assumptions on objects’ states. Some recent studies indicate that laser as one popular object recognition means was utilized to measure objects to offer more accurate distance information for vessel recognition. For example, Misović et al. proposed a concept lock gate zone based on the application of a laser monitoring system whose detection was developed under the modular principle and where there are many functional partitions based on pattern recognition [7]. However, the detection distance of the laser is relatively short, about 80–150 m. Therefore, this method is mostly applicable to vessel recognition in special environments such as port and wharf. Due to the inland waterway width (over 1 km), it is not suitable for inland waterways.
Cameras as popular sensors for object recognition are cheap but can offer rich details of targets. The typical cameras are CCTVs for maritime applications [8], whose image-based recognition focuses on feature extraction and where images are converted into multi-dimensional vectors rather than images that are able to save data storage. Scale-invariant feature transform (SIFT) proposed in 2004, perhaps being a popular method among the mass of descriptors, initially involved extraction stability. Recognition may be performed employing various approaches for SIFT. For example, a bag-of-raw-features model was set up for SIFT to recognize objects [9] despite its descriptor taking disadvantages of low detection efficiency and complex computational processes. For this reason, speeded-up robust features (SURF) was proposed to simplify the computation complexity and present extraction results similar to those based on SIFT [10].
With deep learning becoming more popular in recent years, Convolutional Neural Network (CNN) was utilized for feature extraction in various methods. For instance, a novel network for CNN [11] was proposed to solve multi-label problems. Their results show that their network can obtain a better classification than comparisons. A semantic encoder was presented in an unsupervised learning method [12]. A metric was offered to compute the distances between the descriptors pairs by merging the descriptors of the fragment pairs during scene segmentation [13]. Corresponding research findings are rarely public so far due to the short history of deep learning except for only a few public studies on vessel recognition. For example, a multi-task learning framework was set up in the deep learning-based method proposed by Solmaz et al., which is divided into five tasks (namely visual recognition, coarse-grained classification, fine-grained classification, coarse-grained retrieval, fine-grained retrieval, and verification). Then, its recognition performances were improved based on the application of the proposed framework [14]. Similarly, a CNN-based vessel recognition method proposed by Voinov et al. has potential for near-real-time applications [15], where images are collected utilizing optical satellite sensors primarily for marine applications. Although deep learning was applied to realize vessel recognition in the above studies, there is no network specifically designed for such function to date. Thus, a neural network model was designed here for inland vessels.
All the above indicate that a single sensor such as a camera, maritime radar, and a laser is primarily utilized in the current methods to recognize vessels. If the above sensors are integrated to make use of their different advantages, the recognition accuracy can be improved. Calibration as the first step for data fusion above all mainly focuses on cameras or laser scanners. For example, in [16] the authors proposed a calibration method by using a chessboard. The method is perhaps the most popular method for laser and camera calibration, where there are at least five chessboard inputs. In [17,18], the authors reduce the scanning times from five to three. A perspective-n-point (PnP) model was established by Naikal et al. to ensure that the images shall manually correspond to LIDAR data [19]. Unfortunately, their invisible and calibration results with large errors result in difficultly corresponding to the LIDAR data. A calibration method was put forward based on the application of these algorithms for CCTV and maritime radar, but such method is based on checkerboard calibration so that it shall do not apply to maritime sensors. The reflectivity of LRFs is utilized as a constraint to detect different objects for calibration in some of the recent target-less-based calibration approaches. The LIDAR and edges of images are matched to compute their sensors relationship in the edge-based calibration approach, on the base of which gradient edge orientations were computed for calibration of LRF and camera [20]. Moreover, the degree to which orientations of edge are aligned between LIDAR and images was estimated. A calibration method was also presented here for CCTV and maritime radar.
The paper proposes a hybrid method for inland ship recognition using marine radar and CCTV. The contributions may be summarized as follows:
- (1)
- A novel coarse-to-fine recognition method was put forward, where both image and radar data were initially fused to recognize inland vessels to the best of our knowledge. A detection step added for coarse recognition before vessel recognition can narrow the search area and improve recognition accuracy.
- (2)
- Our novel calibration method was presented for CCTV and marine radar does not need any chessboard or other object unrelated to maritime. By utilizing inland vessels as the calibration target, calibration is transformed into N point registration and the calibration parameters of CCTV and marine radar can be computed.
- (3)
- The theory of deep learning was introduced into our novel network called as VesNet for vessel recognition. Different from other convolutional neural networks, the VesNet we used is solely for extracting features of the vessels. We do not have to look for vessel data sets to train on. The processing of recognition is to use the traditional feature matching method. The matching method is similar to SIFT, SURF, or ORB. This can reduce the time spent on CNN training. Hence, the recognition method we proposed is a method that combined CNN and the traditional feature matching method.
3. Inland Ship Recognition Framework Using CCTV and Marine Radar
A coarse-to-fine recognition method called multi-scale matching vessel recognition (MSM-VR) was put forward based on the fusion of CCTV and marine radar. The concept of multi-scale is that we use the radar scale for detection and use the camera scale for recognition. The mathematical notation is shown in Table 2. The method includes three steps:
Table 2.
Mathematical notation.
- (1)
- A calibration method is presented as the basis of data fusion for CCTV and maritime radar;
- (2)
- A marine radar was utilized for coarse detection and a region of interest (ROI) area was computed;
- (3)
- A network was set up for vessel recognition based on the application of CCTV images so that vessels can be detected and their type and position can be obtained.
Our MSM-VR method is schematically shown in Figure 2.
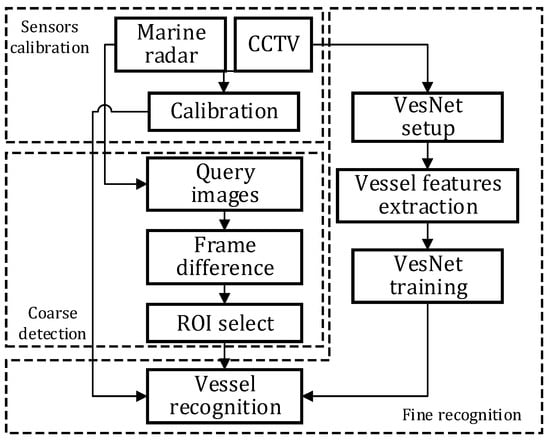
Figure 2.
Schematic diagram of our MSM-VR method for vessel recognition.
3.1. Sensors Calibration
Calibration of CCTV and radar as the first step of vessel recognition is primarily to compute the relationship between the radar coordinate and CCTV coordinate. Firstly, two three-dimensional (3D) coordinate systems (namely radar coordinate system (RCS) and CCTV coordinate system (CCS)) shall be set up to transform the calibration issue into the solution of two parameters (namely rotation matrix and translation vector) employing the following equation:
where represents a point in CCS, R represents the rotation matrix (rank size: 3 × 3), t represents the column translation vector (size 3 × 1), and represents the same point in RCS.
Equation (1) indicates that the critical fact of the calibration lies in the solution of finding corresponding points in RCS and CCS. Unlike any other calibration method, vessels were utilized here to compute their mass points as corresponding points. Our practicability can be guaranteed without any other additional calibration target.
Thus, no less than three vessels were first selected manually from CCTV and the corresponding vessels were sequentially found from radar.
Then, calibration was divided into two steps (namely rotation and translation). The RCS and CCS points were normalized for rotation based on the following equations:
Hence, the RCS and CCS vessel points can be rewritten as follows, respectively:
An N point registration model can be set up to compute R, which is expressed as:
As a result, R is computed by:
Notably, the rank of or is less than three.
t can be solved for translation as:
3.2. Coarse Detection
In the coarse detection as the second step, the radar images were utilized to determine whether there is any vessel in the waterway. The presence or absence of any vessel can be quickly and more efficiently determined utilizing radar rather than CCTV due to a wider perspective. A-frame difference method was utilized here to detect vessels based on the following equation:
where represents the k frame image, and represents the k − 1 frame image.
and are shown in Figure 3. The difference image is binarized as follows:
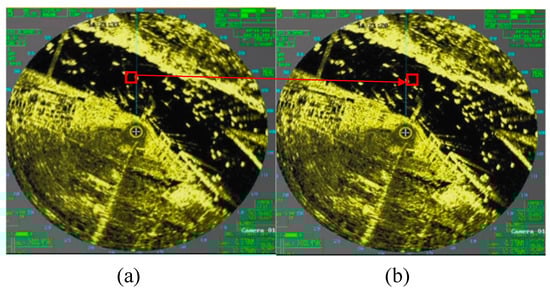
Figure 3.
Marine radar images: (a) k − 1 frame; (b) k frame, from the red box in (a,b), we can find the slight movement of the target.
A threshold was set for comparison with the pixel in the difference image during such binarization process. If the pixel is less than the threshold, it can be determined as the background; otherwise, the pixel can be regarded as a vessel candidate.
Afterward, the binarization image was further processed using image filtering and morphological processing to denoise the target smooths the boundary. The binarization image is then further identified. Another threshold was set following the detected vessel using a comparison of the area of the candidate and such threshold. If the area is larger than the threshold, it is determined as a vessel; otherwise, it is determined as the misjudgment region and it shall be removed. The results are shown in Figure 4.
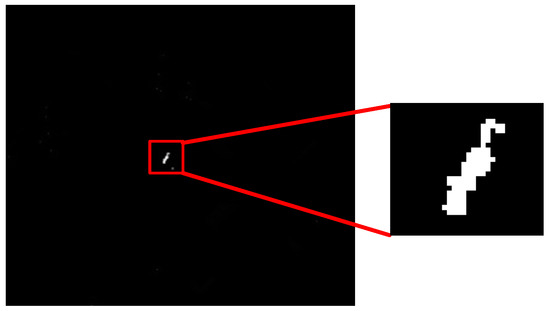
Figure 4.
Frame difference results.
At last, the vessel was mapped into a CCTV image, whose center of mass was computed by selecting the radius of the ROI area as 50 m.
3.3. Fine Recognition
The region of interest was obtained from the step of coarse detection. Deep learning was performed to enhance the vessel recognition accuracy and the recognition was divided into three steps (namely establishment of VesNet, extraction of vessel features, and VesNet based recognition) which are described in detail as follows:
- (1)
- Establishment of VesNet: a deep learning network known as VesNet was established for vessel recognition.
To this end, the concept of the AlexNex network as a typical CNN was introduced here. AlexNex that won the champion in the ImageNet competition in 2012 [21] offers some novel technologies such as local response normalization (LRN) and is designed as an eight-layer structure including the first five convolutional layers and the last three fully connected layers. The structure is shown in Figure 5. The deepening of the network can attenuate the detection effect of the vessel training model for AlexNet. In this regard, the vessel characteristics shall be taken into account so that the residual concept [22] is added here to generate VesNet based on AlexNet.
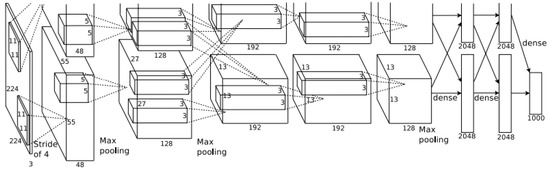
Figure 5.
Structure diagram of AlexNet.
In Figure 6, a residual learning module was added in VesNet, which is a way to build the deep network by means of the application of the shallow network and self-mapping. In this way, the error of the training model shall be no more than that of the shallow network model along with the growth of the number of network layers. Its calculation equation is:
where p and q represent the input and output of the modules, respectively; represents the residual mapping.
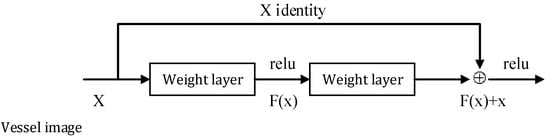
Figure 6.
Schematic diagram of our residual learning module.
It should be noted that the dimensions of p shall be consistent with those of . Otherwise, a linear projection would be necessarily added into the short-circuit connection to guarantee such consistency based on the following equation:
In addition to all the above, a VesNet neural network model was designed here for vessel recognition in accordance with the following two rules:
- As for those network layers with the same output characteristic graph size, both their filters and channels shall be the same in number;
- When the output pattern size has fallen to half (pooling operation), filters shall be doubled in number. Hence, a 34-layer VesNet was designed which is structurally shown in Figure 7 where:
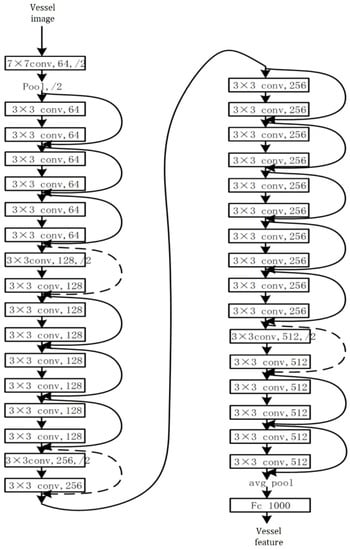 Figure 7. Structural representation of our VesNet.
“3 × 3 conv, 64” and “64” represent the convolutional layer including a filter (size: 3 × 3) and extracting vessel features, such as edge, corner, and arc features of the VesNet and the number of channels in the feature graph, respectively;
“avgpool” represents the average of the pooling layer which can compress features of vessels. On the one hand, it can simplify our complexity of computation. On the other hand, it is helpful to extract the main features of a vessel; and “fc” represents the fully connected layer that can map the features from the upper-layer network by means of convolution calculation to the sample marker space that is set during data annotation. Specifically, its input is the vessel feature from the upper network while its output is a 1 × 1000 one-dimensional vector where each element represents the probability of the vessel type so that its output shall be the vessel features.
- (2)
- Vessel feature extraction: The MSM-VR method is to realize vessel recognition. A VesNet was set up to extract all types of vessel features. In light of related rules of Changjiang Maritime Safety Administration of China, inland vessels can be divided into three types (namely container, cargo, and dangerous vessels) [23,24]. However, there exists a kind of vessel that has unique characteristics and shall be individually classified as empty vessels in the light of features or waterway channel management based on a large number of experiments, as shown in Figure 8.
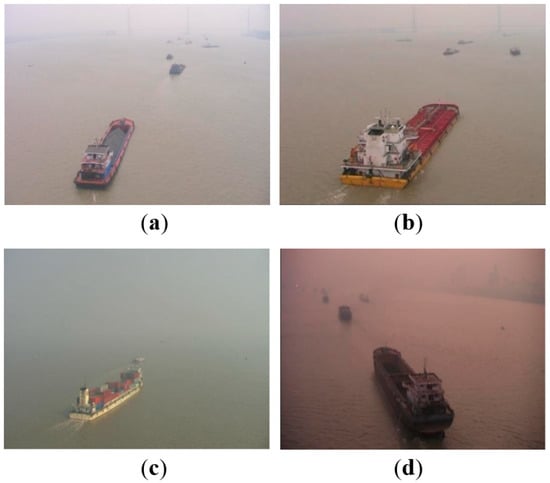 Figure 8. 4 kinds of inland vessels: (a) cargo vessels; (b) dangerous vessels; (c) container vessels; (d) empty vessels.
As shown in Figure 9, four kinds of vessel features are extracted by our VesNet, respectively. Each feature is represented by a 1 × 1000 one-dimensional vector. Figure 9 indicates that various vessel features are also different so that different types of vessels can be correspondingly distinguished.
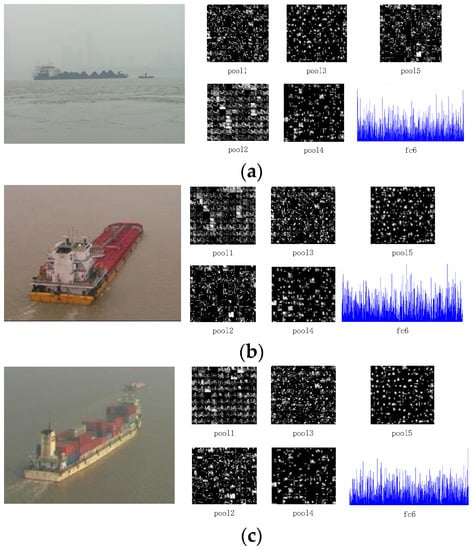
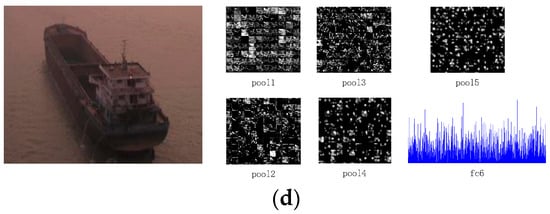
Figure 9.
4 kinds of extracted vessel features: (a) cargo vessels; (b) dangerous vessels; (c) container vessels; (d) empty vessels.
- (3)
- VesNet based recognition: Four kinds of vessel features were trained after extraction of them, for each kind of them a database was set up. It should be noted that such a process was going offline. While a vessel is detected by marine radar, its features can be extracted and matched with the database online. Because the extracted features are a row vector (size: 1 × 1000), the cosine similarity between query features and matching feature database was calculated here based on the following equation:where ; ; the maximum of is 1, with whose growth the two features are more similar.
The kind of vessel whose peaks while its query features matching four kinds of database.
3.4. MSM-VR Algorithm
Our MSM-VR algorithm can be summarized as follows:
- (1)
- Three vessels were selected at most in marine radar and CCTV, whose mass points were computed in both sensors, respectively. Two sensors were calibrated based on the application of the N-point registration model (from Equations (1) to (10)).
- (2)
- The frame difference method was utilized to process radar data for coarse detection (Section 3.2, Figure 3 and Figure 4). An ROI area was determined and calibration results were applied to map the results into CCTV.
- (3)
- As for four different kinds of vessels, a CNN called the VesNet was set up to extract their features. The extracted features function in two ways: four kinds were trained to set up their database (Figure 9), and coarse detection results in each ROI area. VesNet extracted their features online (Figure 7).
- (4)
- Their features matched the database to compute their cosine similarities and select their maximum; then, the kind of query vessel can be determined (Equation (15)).
4. Experimental Results
At this point, experiments with the actual data were presented to evaluate our method. Our experimental site was the Yangtze River which is the longest river in China and the third-longest in the world to act as the golden waterway of water transportation between east and west China. Its largest cargo volume in the world is of great strategic significance for China’s economic development and social progress. Wuhan and Nanjing located in its middle stream and downstream of the Yangtze River were selected here to fully evaluate our MSM-VR method. Their CCTVs and maritime radars were set up, respectively. The difference between their navigable environments can be utilized to adequately evaluate our method.
4.1. Case 1: Experiment in Nanjing
Nanjing as the capital of Jiangsu Province is one of the central cities downstream of the Yangtze River, in which Banqiao ferry its CCTV, and marine radar was set up. Its CCTV and marine radar were calibrated at first to make a coarse-to-fine recognition using our MSM-VR method. Our experiment last more than a week (8:00–17:00 per day) and more than 400 vessels were detected. The corresponding data included different weather conditions (sunny and rainy days).
Figure 10 shows our recognition results in Nanjing, where blue, red, and yellow frames represent cargo, empty, and container vessels, respectively. Notably, there were no dangerous vessels during this experiment. Moreover, vessels can be recognized while they entered the CCTV surveillance area and they can also be recognized utilizing our MSM-VR method while more vessels appeared simultaneously in such surveillance area. It is important to understand the differences between our method and other methods.
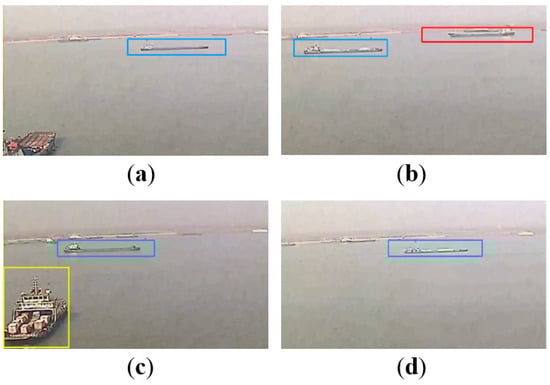
Figure 10.
Recognition results, Blue frame—cargo vessel; red frame—empty vessel; yellow frame—container vessel: (a) cargo vessel I; (b) cargo vessel II and empty vessel I; (c) cargo vessel III and container vessel I; (d) cargo vessel IV.
Those methods in References [3,5] were selected here for comparison to evaluate our method. The comparison results are presented in Table 3; moreover, 400 images were also selected for comparison of these methods. Table 3 indicates that 387 images were recognized from 400 test images with a recognition accuracy of 96.75% and the FP is about 0.50% because more than one vessel would be mutually shielded in such area. Figure 11 as an example for error detection shows that a small vessel was behind the recognized empty vessel so that it cannot be recognized. The FN is about 2.75% because some small vessels are too far from the camera to be detected and some vessels and the background are similar in color. The comparison indicates that our MSM-VR method offers better results. The recognition accuracies of the other two methods are about 90.50% and 91.25%, respectively. Next, it is important to know that the performance of our MSM-VR method under various weather conditions and during different periods is better.
Table 3.
Comparison of results in different methods.
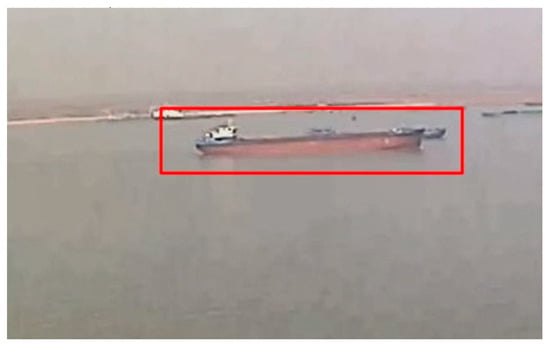
Figure 11.
An error detection example.
Table 4 shows the recognition results under two weather conditions (rainy and sunny days) and during two periods (8:00–12:00 and 12:00–17:00), respectively. 200 images were selected for each period and every sunny day, respectively. However, 100 images were selected for every rainy day because its occurrence probability was less. Moreover, the accuracies are 96.00% and 97.50% during the two periods. Similarly, two weather conditions (rainy and sunny days) correspond to their accuracies of 96.00% and 97.00%, respectively. All statistics show that our MSM-VR method improves the accuracy and its robustness is greater on rainy days and two weather conditions (rainy and sunny days).
Table 4.
Recognition results from the proposed method in different conditions.
Precision–recall curves of three types of vessels were utilized to experimentally evaluate our method during the vessel type recognition process. Figure 12 indicates that there shall be no dangerous vessel in the Nanjing test area and their recalls can be up to 59%, 56%, and 48.5% for each vessel type, respectively, while their precision rates peak.
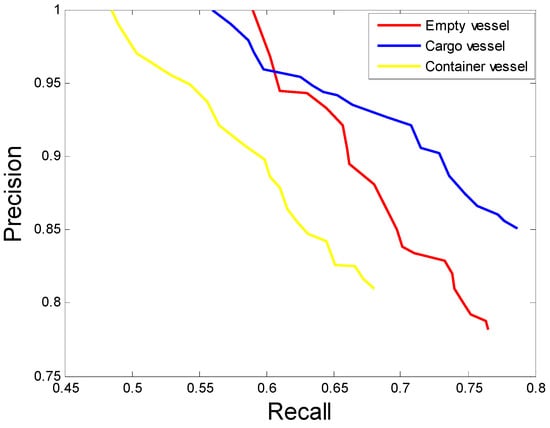
Figure 12.
Precision–recall curves for different vessel types in Nanjing.
4.2. Case 2: Experiments in Wuhan
Wuhan—as the capital of Hubei Province—is one of the central cities in the middle stream of the Yangtze River. Both CCTV and marine radar were set up in Wuhan Yangtze River Bridge, where our experiments last about 1 month. Few vessels appeared in our middle stream test area rather than the downstream one (specifically, only about 800 vessels passed through our test site in Wuhan). Our test period is also from 8:00 to 17:00 and sunny and rainy days are covered.
The same methods were also selected to evaluate our method. The comparison results (Table 5) indicate that 800 images were input for vessel recognition with an accuracy (97.63%) that is higher than that in Nanjing because fewer vessels were detected in the Wuhan test site where there are almost no multiple vessels simultaneously passing through its waterway. The FP in the Wuhan test dramatically zeroed out; moreover, our MSM-VR method also performed better than the other two methods whose accuracies are 91.88% and 90.38%, respectively. Our MSM-VR method shall be experimentally robust in different test sites.
Table 5.
Comparison of results from various methods.
Experiment results are shown in Table 6 for two weather conditions (rainy and sunny days) and two periods (8:00–12:00 and 12:00–17:00), respectively, to further evaluate our method. Four hundred images were selected under each condition except the rainy days when 300 images were selected. Table 6 indicates that our accuracies are up to 98.00% and 97.25% for both periods. Moreover, the accuracy remains 96.33% on rainy days although it is a bit lower than that on sunny days. Thus, our MSM-VR method can be said to be robust.
Table 6.
Recognition results for two weather conditions and two periods.
In Figure 13, precision–recall curves for vessel type recognition indicate that dangerous vessels clearly existed in Wuhan Waterway and their recalls can be 68%, 63%, 48%, and 48.5% for each vessel type, respectively, while their precision rates come up to 100%. Our test results shall be stable in Wuhan Waterway rather than Nanjing Waterway. Thus, our method is robust in vessel type recognition.
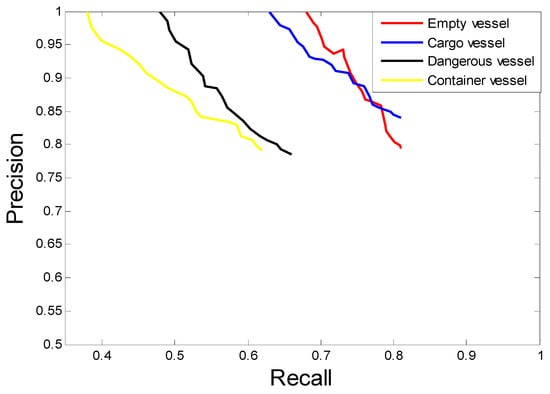
Figure 13.
Precision–recall curves for various vessel types in Wuhan.
A summary of the results included the data in Wuhan and Nanjing in Table 7.
Table 7.
Summary of the results.
5. Conclusions
Our study not only fused CCTV and marine radar but also presented a calibration method (MSM-VR method) between them; moreover, an N point registration model was set up and corresponding vessels were utilized to solve the calibration issues. An additional target is not necessary. Then, the marine radar was utilized for coarse detection based on the application of frame differences, for whose results an ROI area is an output to be mapped to CCTV. Furthermore, a novel CNN known as VesNet was designed for vessel recognition that is transformed for more accurate and efficient extraction of vessel features with the help of the additional residual learning module. All processes created our coarse-to-fine vessel recognition method. In addition, our experimental results show that our method has great robustness in different test sites and conditions. Our experimental recognition accuracies are all more than 96% except those on rainy days, which fall moderately. Our method, with high accuracy, presents better robustness. The applicable range of the proposed method is in the inland river waterway, especially in the Yangtze River which is the longest river in China.
However, the method also has some drawbacks, e.g., it is only suitable for use where the river is narrow due to the detection range of the camera. In future work, we will focus on the detection in rainy conditions and the integration of sensor networks within the proposed surveillance system for small boat detection. Moreover, we will also fuse the AIS data to enhance the recognition precision.
Author Contributions
Conceptualization, W.H. and Z.L.; methodology, Y.L. and X.L.; software, Y.W. and Y.L.; writing—review and editing, X.L. and Z.W.; funding acquisition, X.L, W.H. and Z.L. All authors have read and agreed to the published version of the manuscript.
Funding
This research was funded by the Fujian Province Natural Science Foundation (No: 2021J011028, 2020J01860) and University-industry cooperation program of Department of Science and Technology of Fujian Province (No. 2019H6018) and The Key Project of Science and Technology of Wuhan (No. 201701021010132) and Fund of National Engineering Research Center for Water Transport Safety (No. A2021001) and Fund of Hubei Key Laboratory of Transportation Internet of Things (No. WHUTIOT-2019002) and Narodowego Centrum Nauki, Poland (No. 2020/37/K/ST8/02748).
Institutional Review Board Statement
Not applicable.
Informed Consent Statement
Not applicable.
Data Availability Statement
Not applicable.
Conflicts of Interest
The authors declare no conflict of interest.
References
- Wei, Z.; Xie, X.; Lv, W. Self-adaption vessel traffic behaviour recognition algorithm based on multi-attribute trajectory characteristics. Ocean. Eng. 2020, 198, 106995. [Google Scholar] [CrossRef]
- Zhao, L.; Shi, G. A trajectory clustering method based on Douglas-Peucker compression and density for marine traffic pattern recognition. Ocean. Eng. 2018, 172, 456–467. [Google Scholar] [CrossRef]
- Chen, Z.; Xue, J.; Wu, C.; Qin, L.; Liu, L.; Cheng, X. Classification of vessel motion pattern in inland waterways based on Automatic Identification System. Ocean. Eng. 2018, 161, 69–76. [Google Scholar] [CrossRef]
- Tai, J.C.; Tseng, S.T.; Lin, C.P.; Song, K.T. Real-time Image Tracking for Automatic Traffic Monitoring and Enforment Application. Image Vis. Comput. 2004, 22, 485–501. [Google Scholar] [CrossRef]
- Ma, F.; Chen, Y.W.; Yan, X.P.; Chu, X.M.; Wang, J. Target recognition for coastal surveillance based on radar images and generalised Bayesian inference. IET Intell. Transp. Syst. 2017, 12, 103–112. [Google Scholar] [CrossRef]
- Ma, F.; Chen, Y.W.; Yan, X.P.; Chu, X.M.; Wang, J. A novel marine radar targets extraction approach based on sequential images and Bayesian Network. Ocean. Eng. 2016, 120, 64–77. [Google Scholar] [CrossRef] [Green Version]
- Misović, D.S.; Milić, S.D.; Đurović, Ž.M. Vessel Detection Algorithm Used in a Laser Monitoring System of the Lock Gate Zone. IEEE Trans. Intell. Transp. Syst. 2015, 17, 430–440. [Google Scholar] [CrossRef]
- Qiao, D.; Liu, G.; Lv, T.; Li, W.; Zhang, J. Marine Vision-Based Situational Awareness Using Discriminative Deep Learning: A Survey. J. Mar. Sci. Eng. 2021, 9, 397. [Google Scholar] [CrossRef]
- Zhang, H. BoRF, Loop-closure detection with scale invariant visual features. In Proceedings of the 2011 IEEE International Conference on Robotics and Automation, Shanghai, China, 9–13 May 2011; pp. 3125–3130. [Google Scholar]
- Bay, H.; Ess, A.; Tuytelaars, T.; Van Gool, L. Speeded-up robust features (SURF). Comput. Vis. Image Underst. 2008, 110, 346–359. [Google Scholar] [CrossRef]
- Zhang, X.; Zhou, F.; Lin, Y.; Zhang, S. Embedding label structures for fine-grained feature representation. In Proceedings of the IEEE Conference on Computer Vision and Pattern Recognition, Las Vegas, NV, USA, 27–30 June 2016; pp. 1114–1123. [Google Scholar]
- Kodirov, E.; Xiang, T.; Gong, S. Semantic autoencoder for zero-shot learning. In Proceedings of the IEEE Conference on Computer Vision and Pattern Recognition, Seattle, WA, USA, 21–23 June 2017; pp. 3174–3183. [Google Scholar]
- Teney, D.; Brown, M.; Kit, D.; Hall, P. Learning similarity metrics for dynamic scene segmentation. In Proceedings of the IEEE Conference on Computer Vision and Pattern Recognition, Boston, MA, USA, 7–12 June 2015; pp. 2084–2093. [Google Scholar]
- Solmaz, B.; Gundogdu, E.; Yucesoy, V.; Koç, A.; Alatan, A.A. Fine-grained recognition of maritime vessels and land vehicles by deep feature embedding. IET Comput. Vis. 2018, 12, 1121–1132. [Google Scholar] [CrossRef]
- Voinov, S.; Krause, D.; Schwarz, E. Towards Automated Vessel Detection and Type Recognition from VHR Optical Satellite Images. In Proceedings of the 2018 IEEE International Geoscience and Remote Sensing Symposium, Valencia, Spain, 22–27 July 2018; pp. 4823–4826. [Google Scholar]
- Zhang, Q.; Pless, R. Extrinsic calibration of a camera and laser range finder (improves camera calibration). In Proceedings of the IEEE/RSJ International Conference on Intelligent Robots and Systems (IROS’04), 28 September–2 October 2004; pp. 2301–2306. [Google Scholar]
- Zhang, Z. A flexible new technique for camera calibration. IEEE Trans. Pattern Anal. Mach. Intell. 2000, 22, 1330–1334. [Google Scholar] [CrossRef] [Green Version]
- Vasconcelos, F.; Barreto, J.; Nunes, U. A minimal solution for the extrinsic calibration of a camera and a laser-rangefinder. IEEE Trans. Pattern Anal. Mach. Intell. 2012, 34, 2097–2107. [Google Scholar] [CrossRef] [PubMed]
- Naikal, N.; Kua, J.; Zakhor, A. Image Augmented Laser Scan Matching for Indoor Localization; Technical Report. No. UCB/EECS-2009-35; University of California Berkeley: Berkeley, CA, USA, 2009. [Google Scholar]
- Taylor, Z.; Nieto, J.; Johnson, D. Automatic calibration of multimodal sensor systems using a gradient orientation measure. In Proceedings of the IEEE International Conference on Intelligent Robots & Systems (IROS), Tokyo, Japan, 3–7 November 2013; pp. 1293–1300. [Google Scholar]
- Krizhevsky, A.; Sutskever, I.; Hinton, G. ImageNet Classification with Deep Convolutional Neural Networks. Adv. Neural Inf. Process. Syst. 2012, 25, 1097–1105. [Google Scholar] [CrossRef]
- He, K.; Zhang, X.; Ren, S.; Sun, J. Deep residual learning for image recognition. In Proceedings of the IEEE Conference on Computer Vision and Pattern Recognition, Las Vegas, NV, USA, 27–30 June 2016; pp. 770–778. [Google Scholar]
- Wu, Z.; Zhu, J. Marine Traffic Engineering; Dalian Maritime University Press: Dalian, China, 2004. (In Chinese) [Google Scholar]
- Changjiang River Administration of Navigational Affairs, MOT. Report on Changjiang River Shipping Development; China Communications Publishing & Media Management: Wuhan, China, 2011. (In Chinese) [Google Scholar]
Publisher’s Note: MDPI stays neutral with regard to jurisdictional claims in published maps and institutional affiliations. |
© 2021 by the authors. Licensee MDPI, Basel, Switzerland. This article is an open access article distributed under the terms and conditions of the Creative Commons Attribution (CC BY) license (https://creativecommons.org/licenses/by/4.0/).