Numerical Study of Wave Forces on Crown Walls of Mound Breakwaters with Parapets


Abstract
1. Introduction
2. Literature Review on Wave Forces on Coastal Structures with Parapets
3. Model Tests
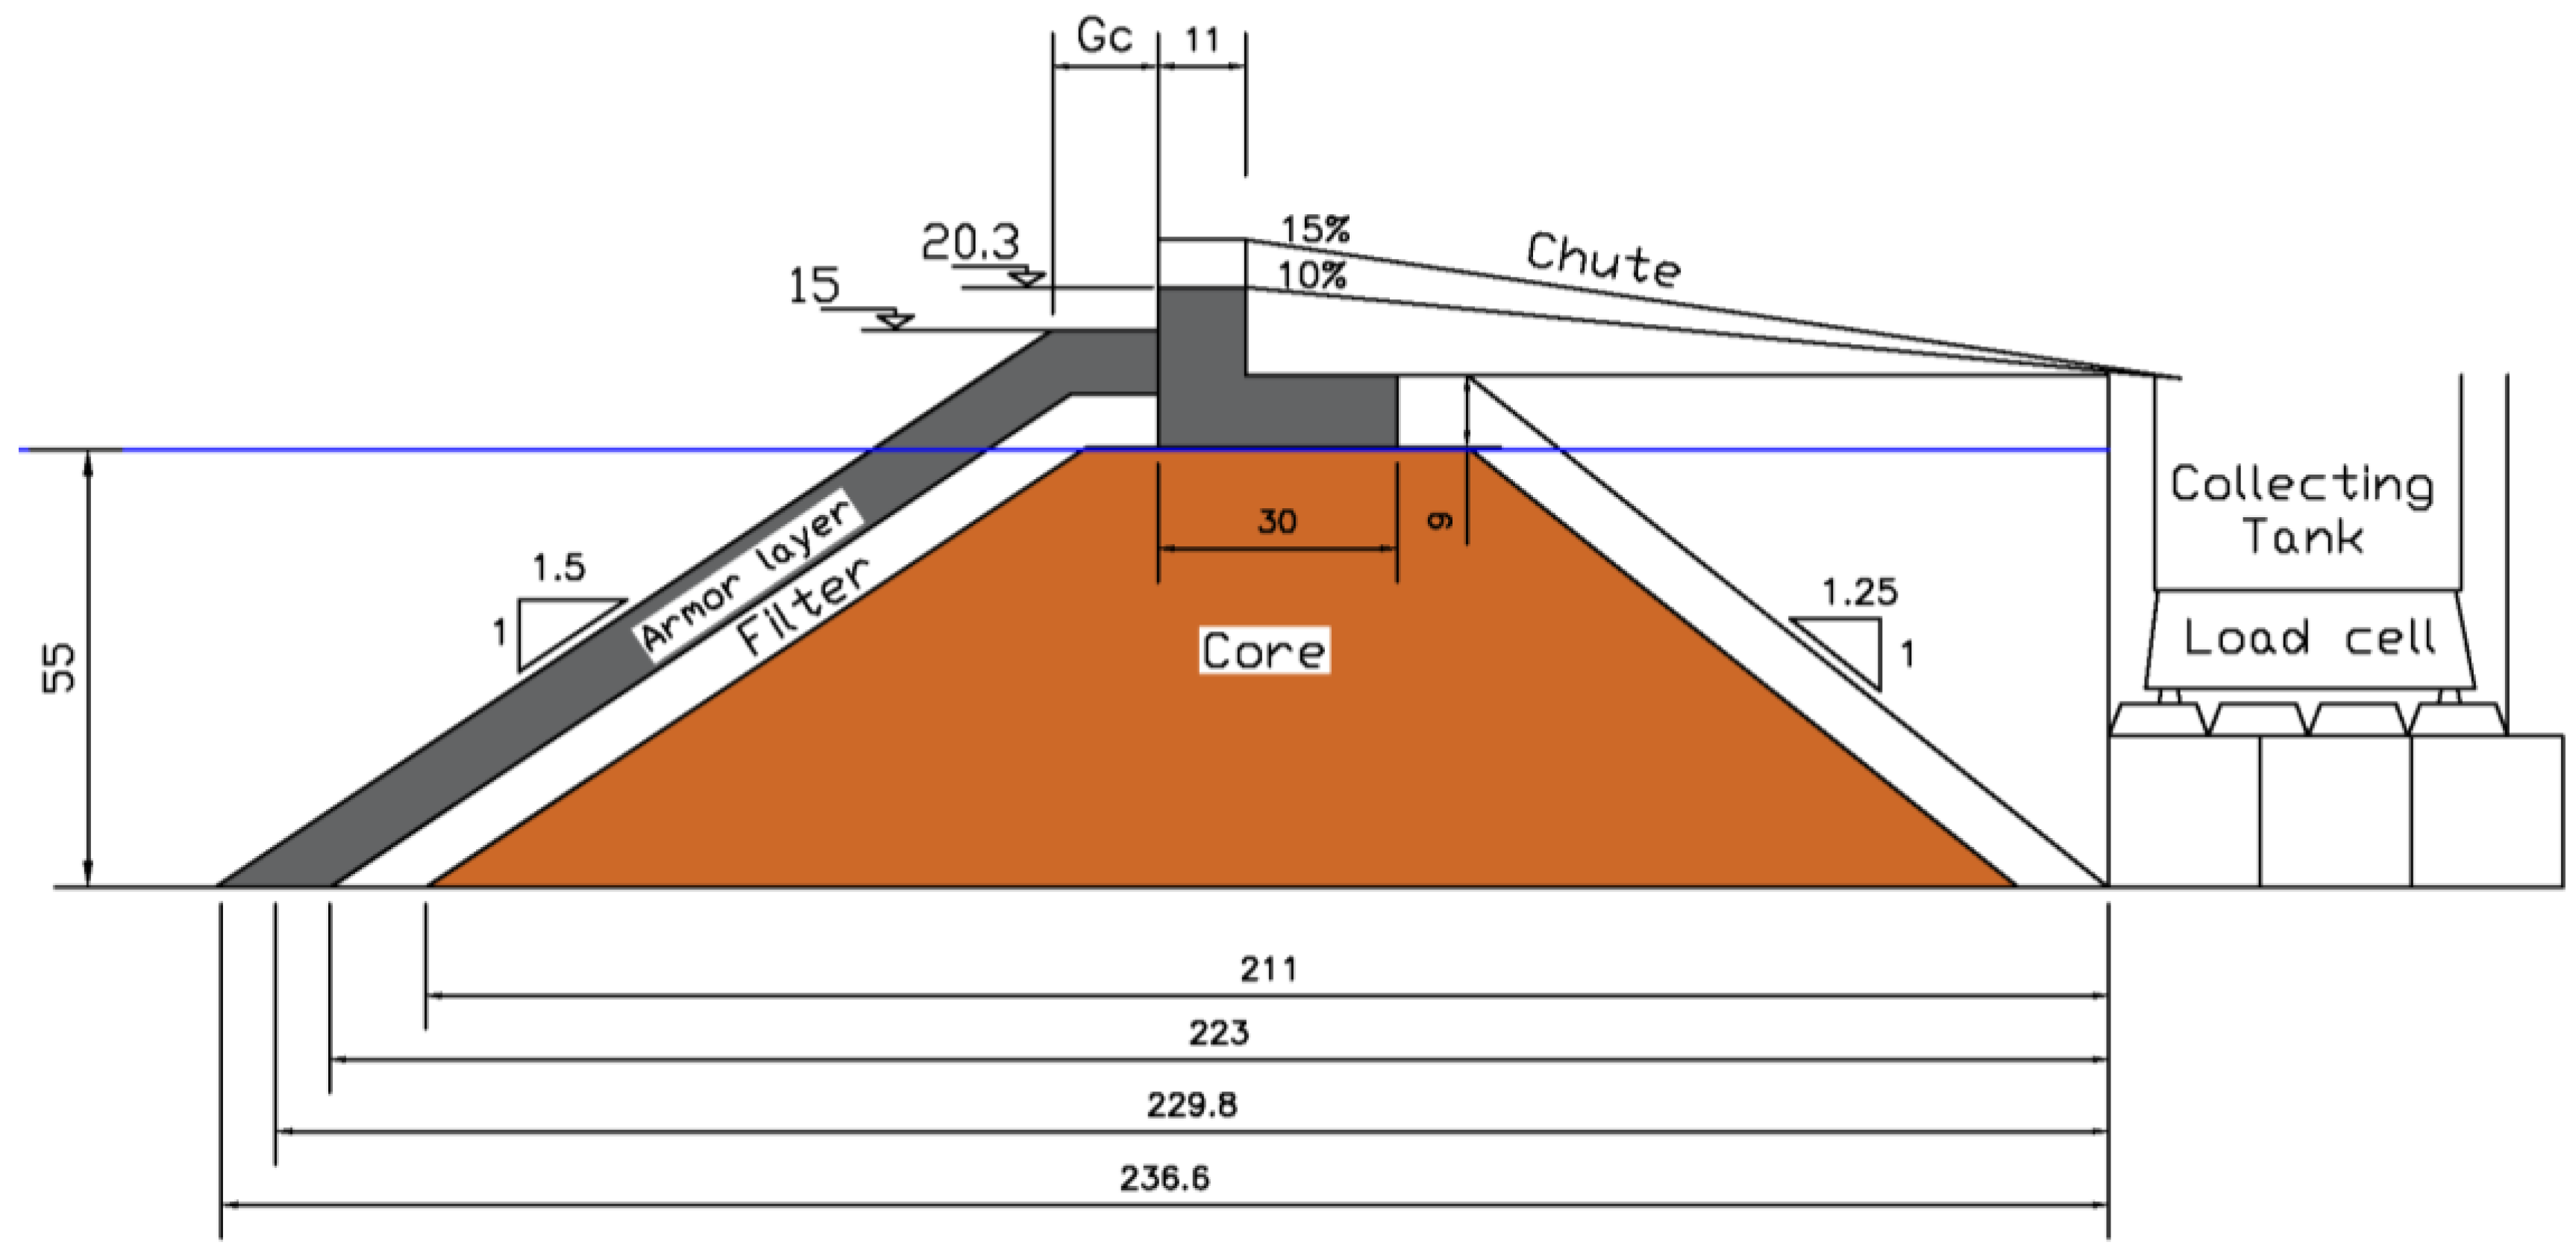
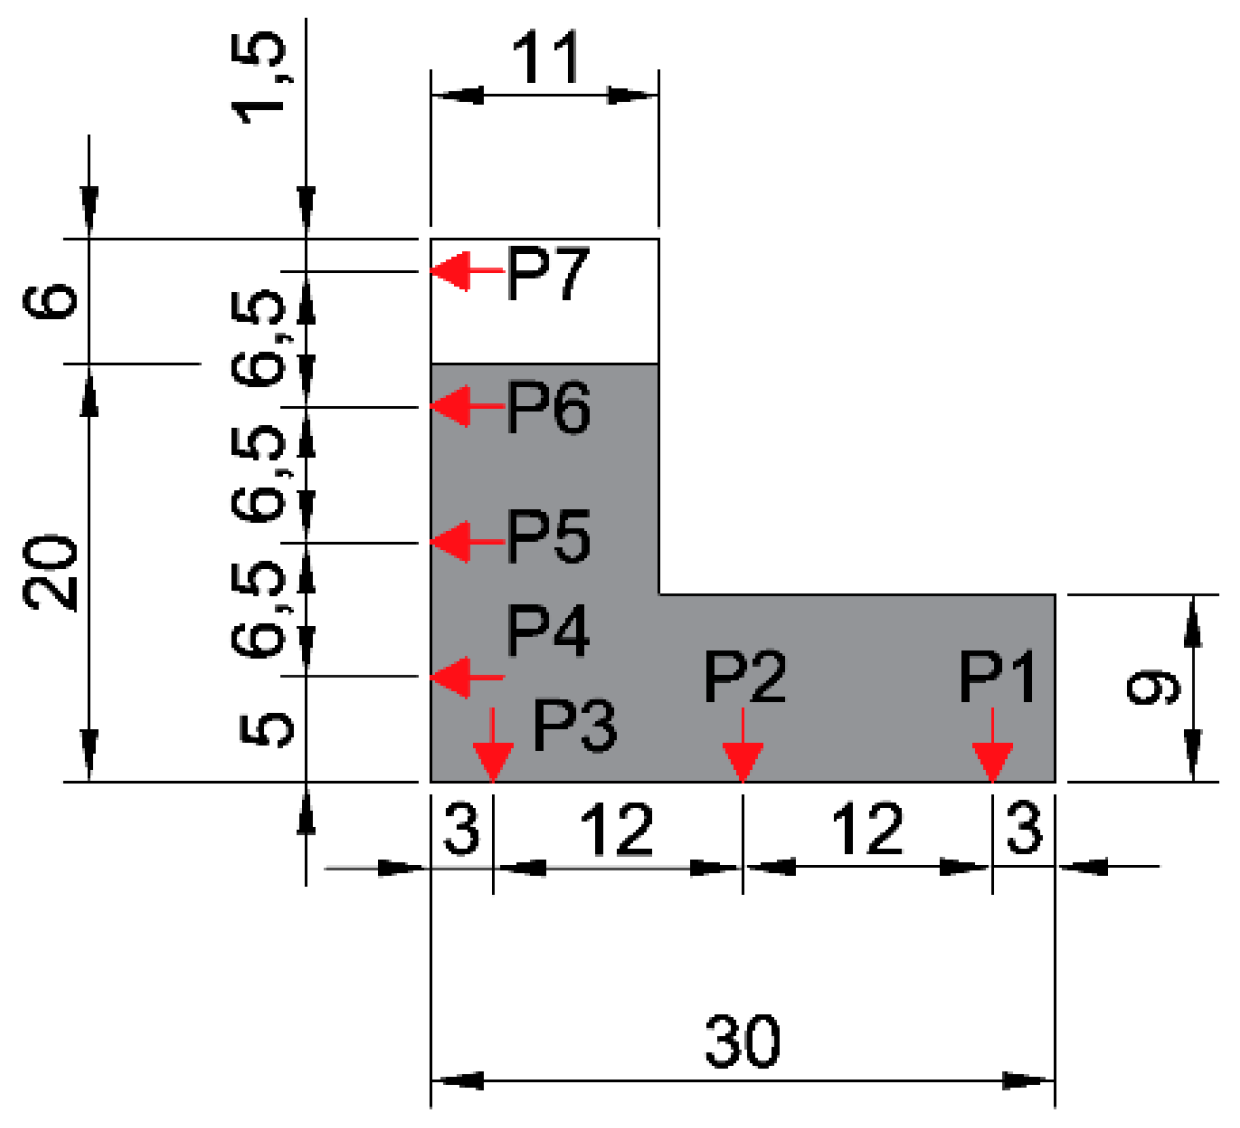
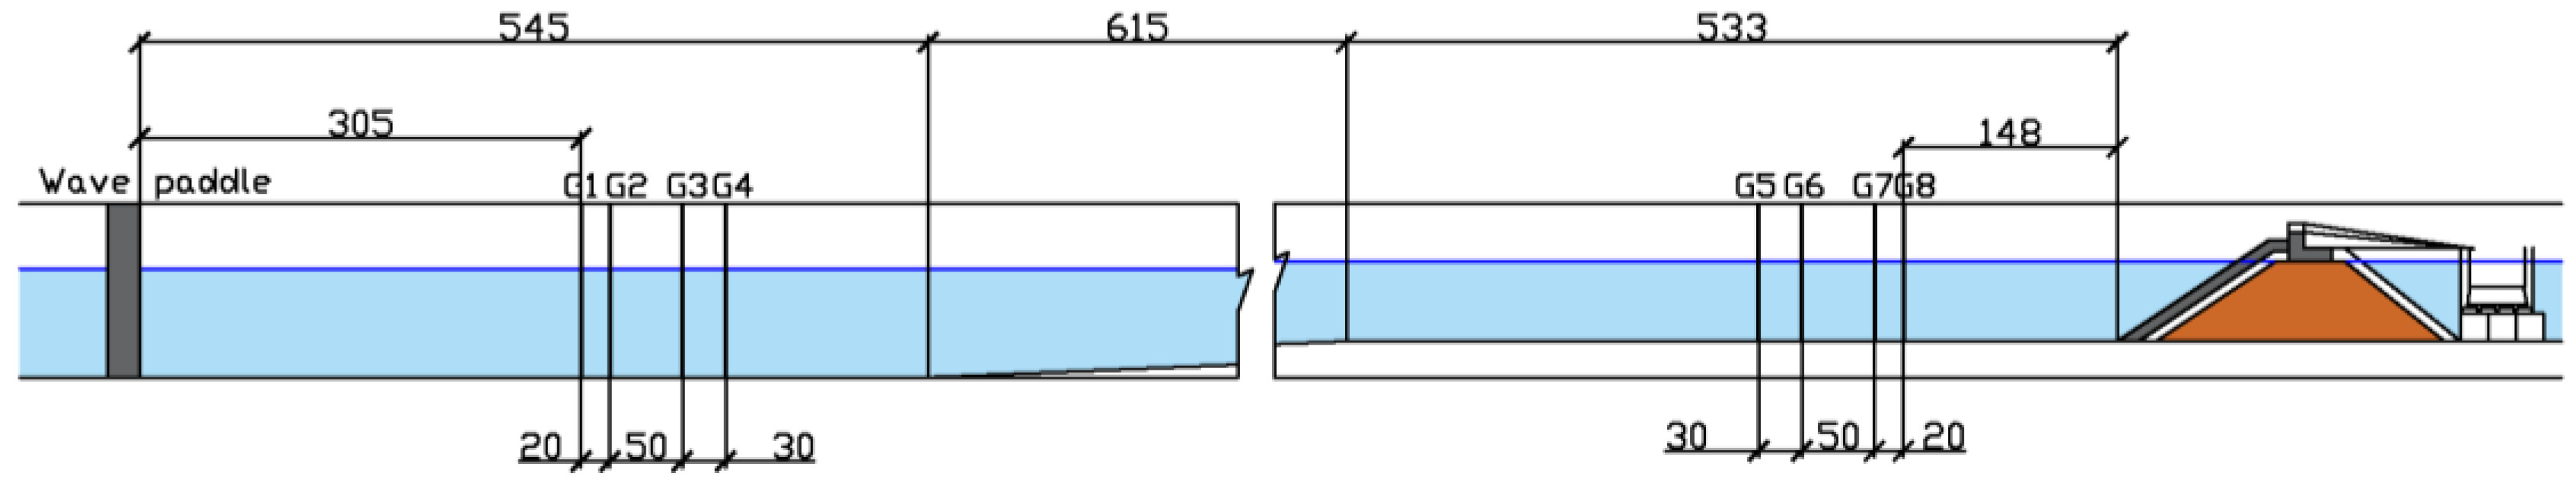
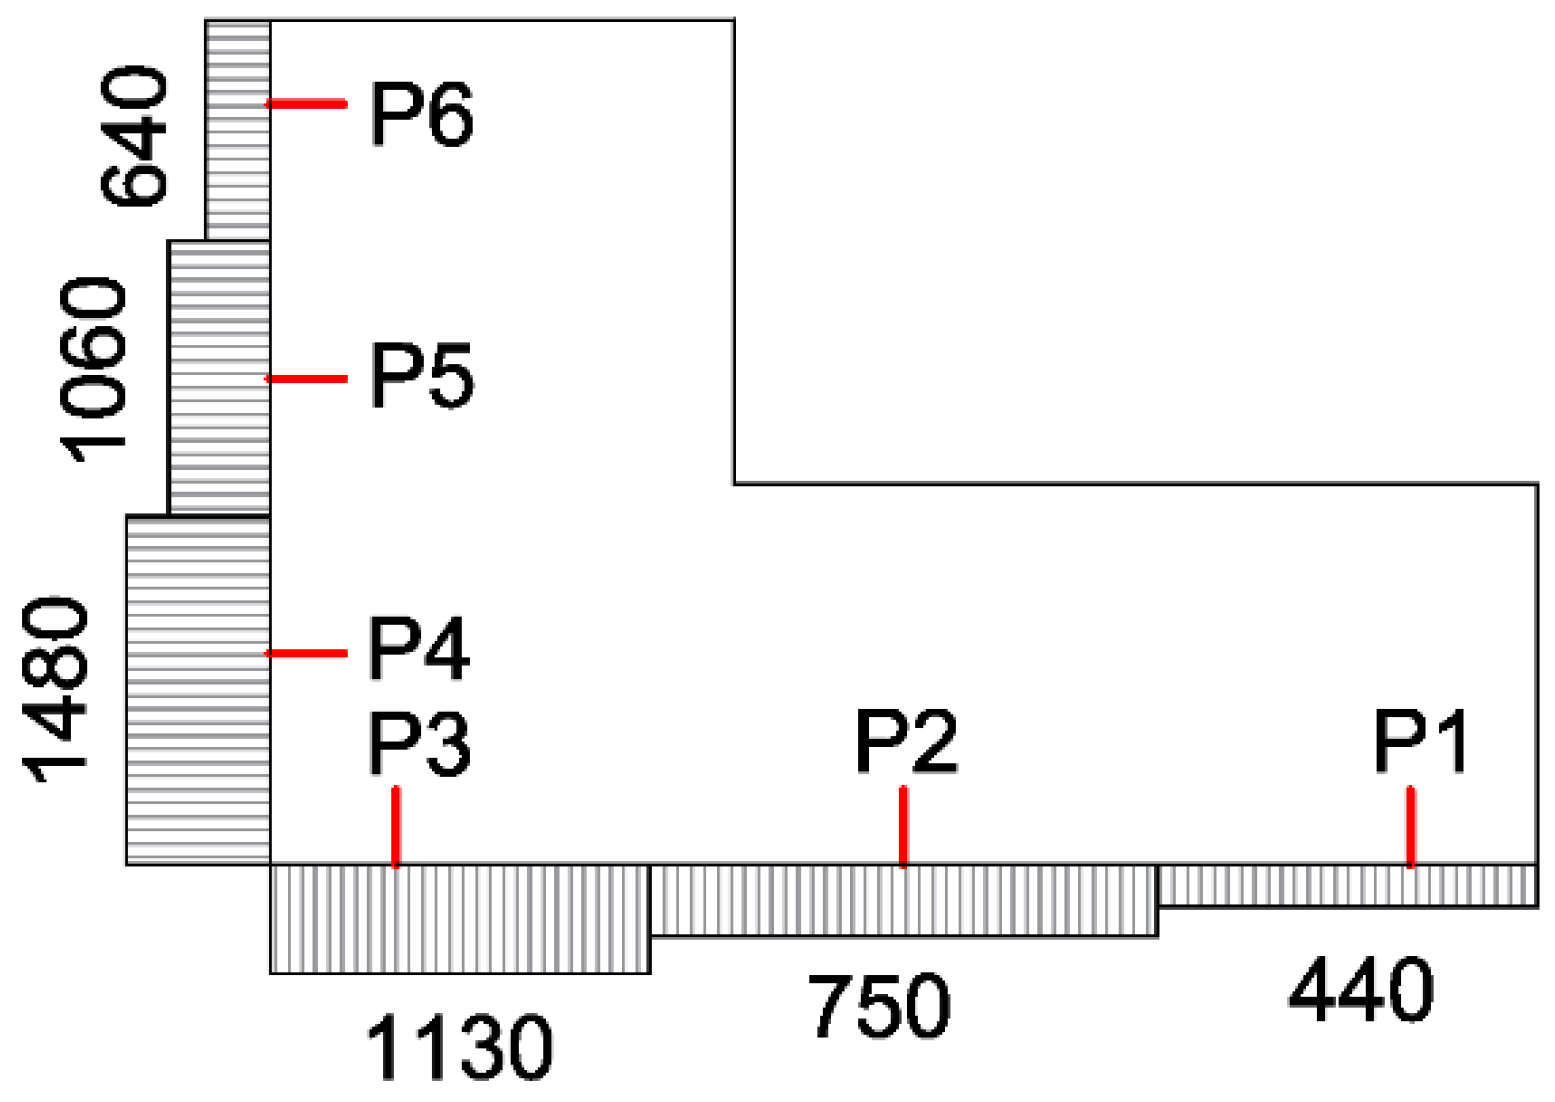
3.1. Physical Model
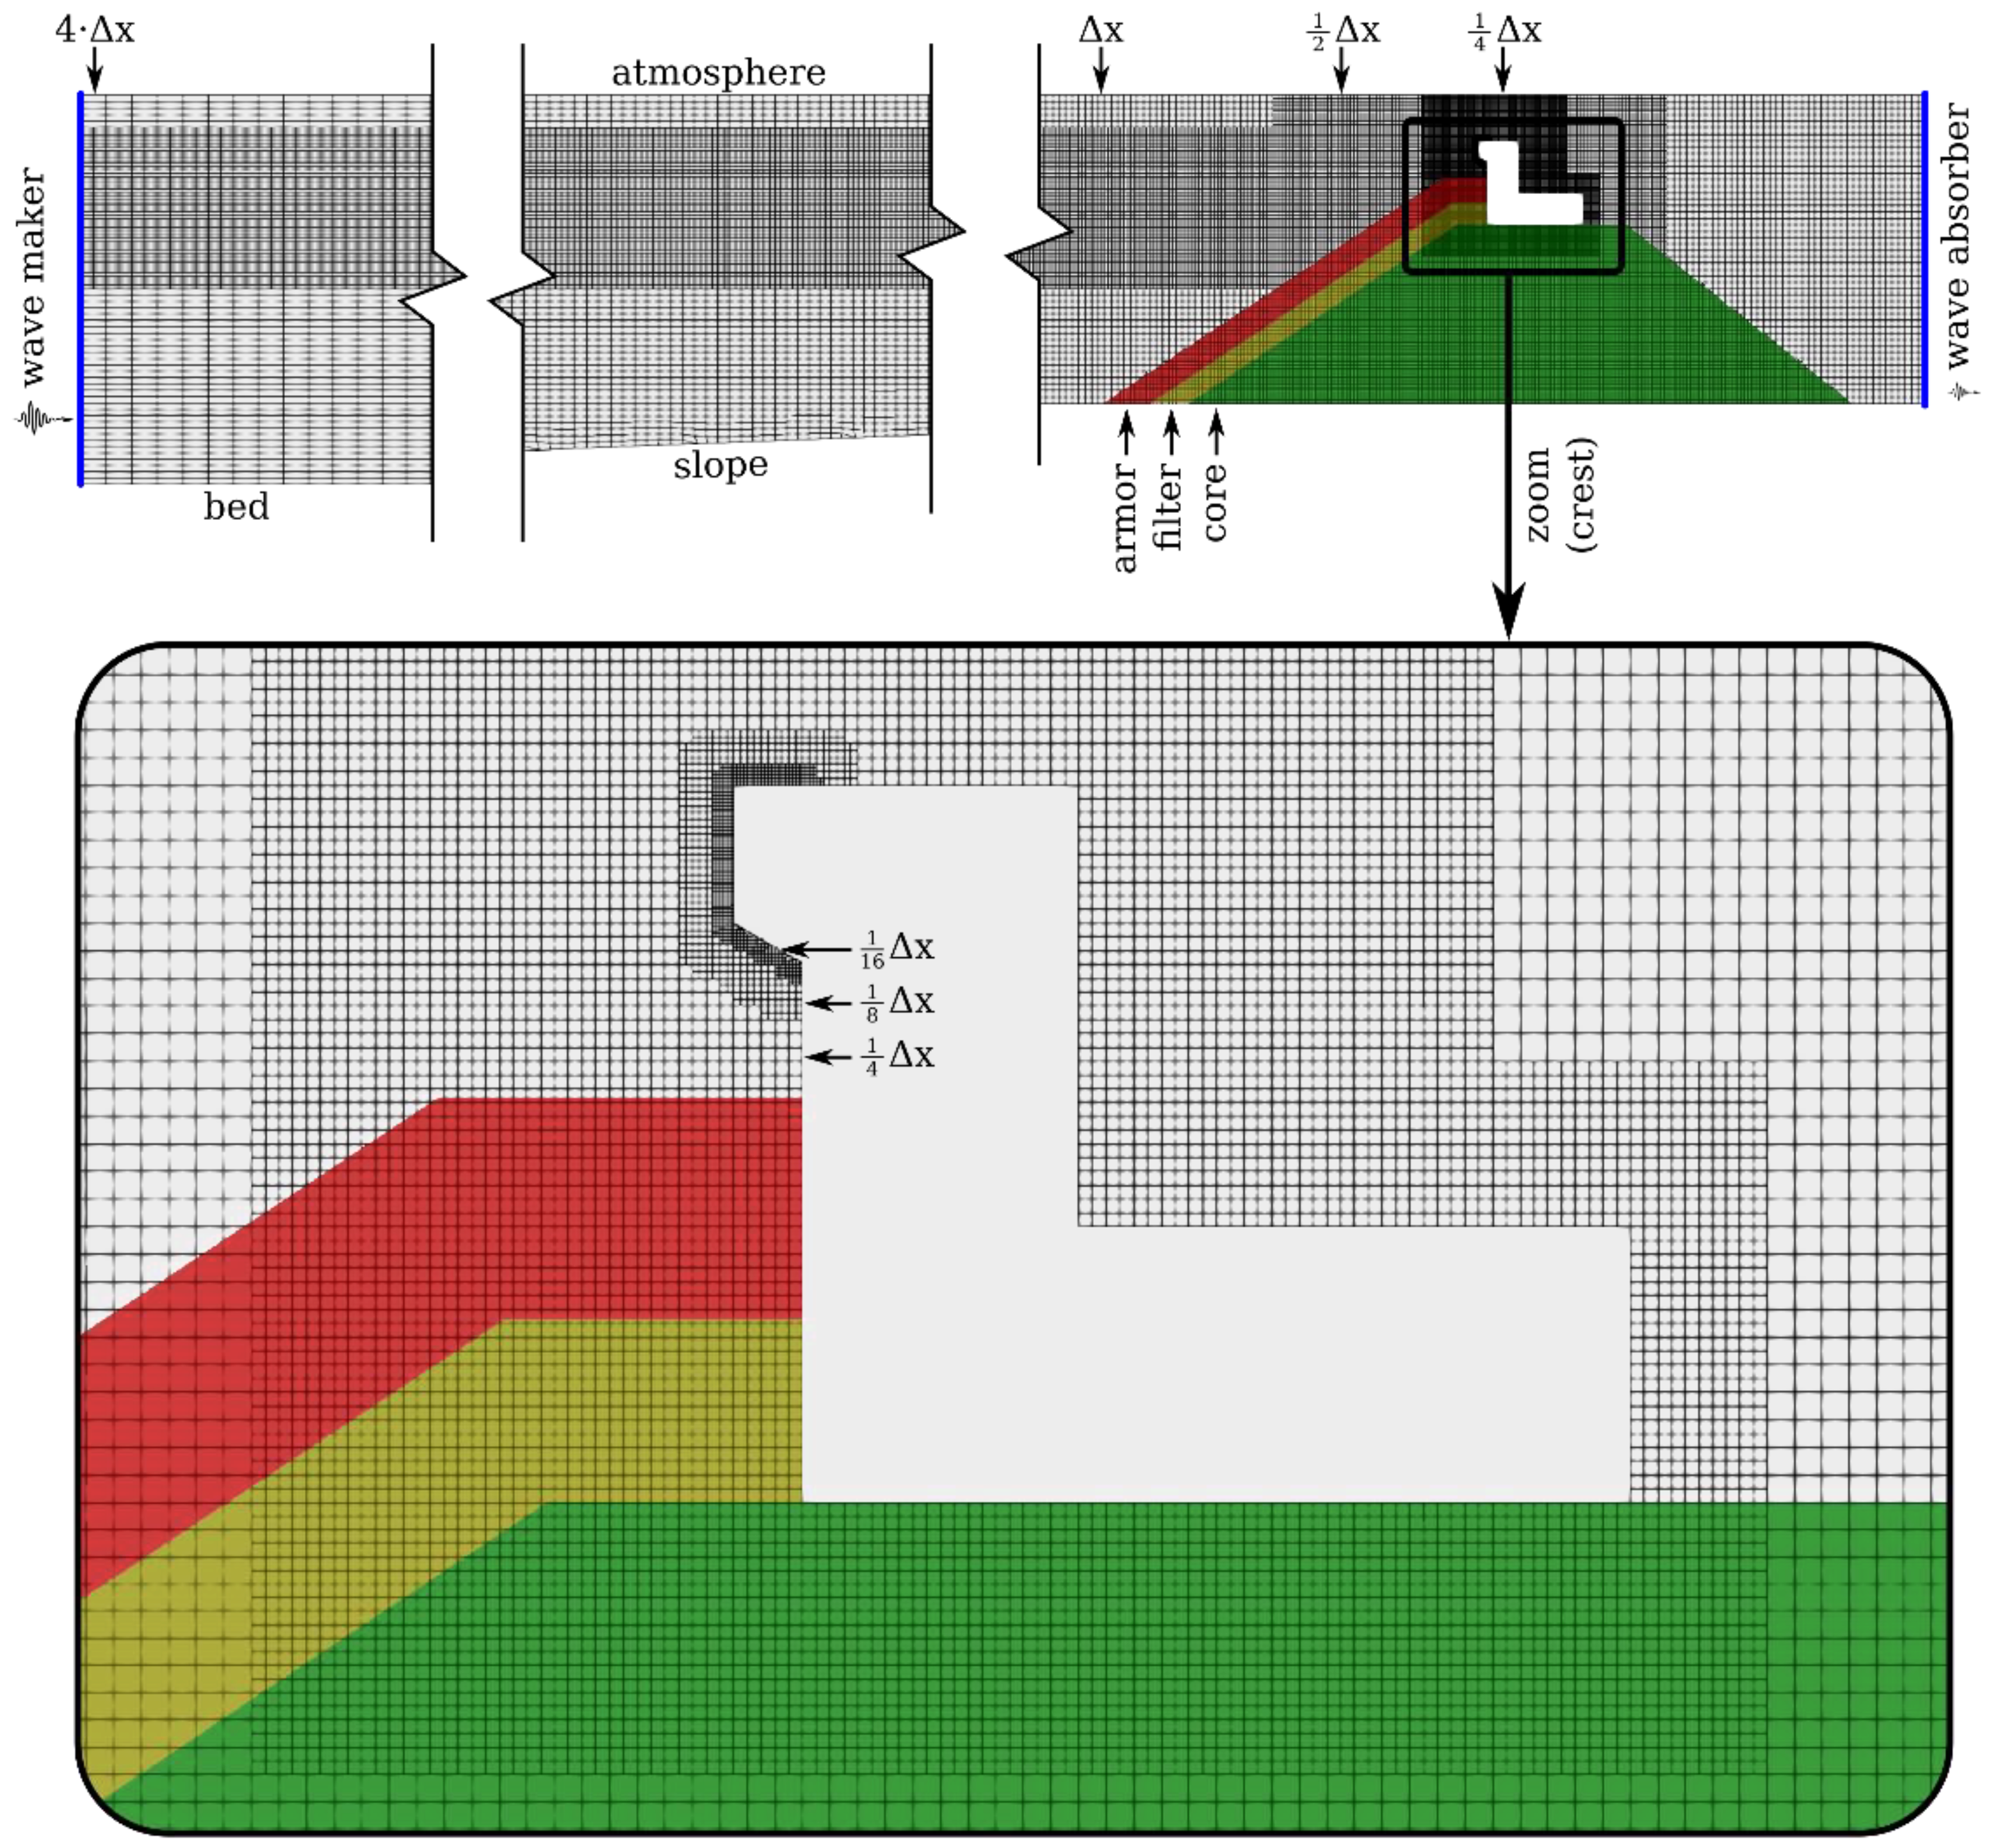
3.2. Numerical Model
4. Validation of the OpenFOAM® Model
4.1. Regular Test
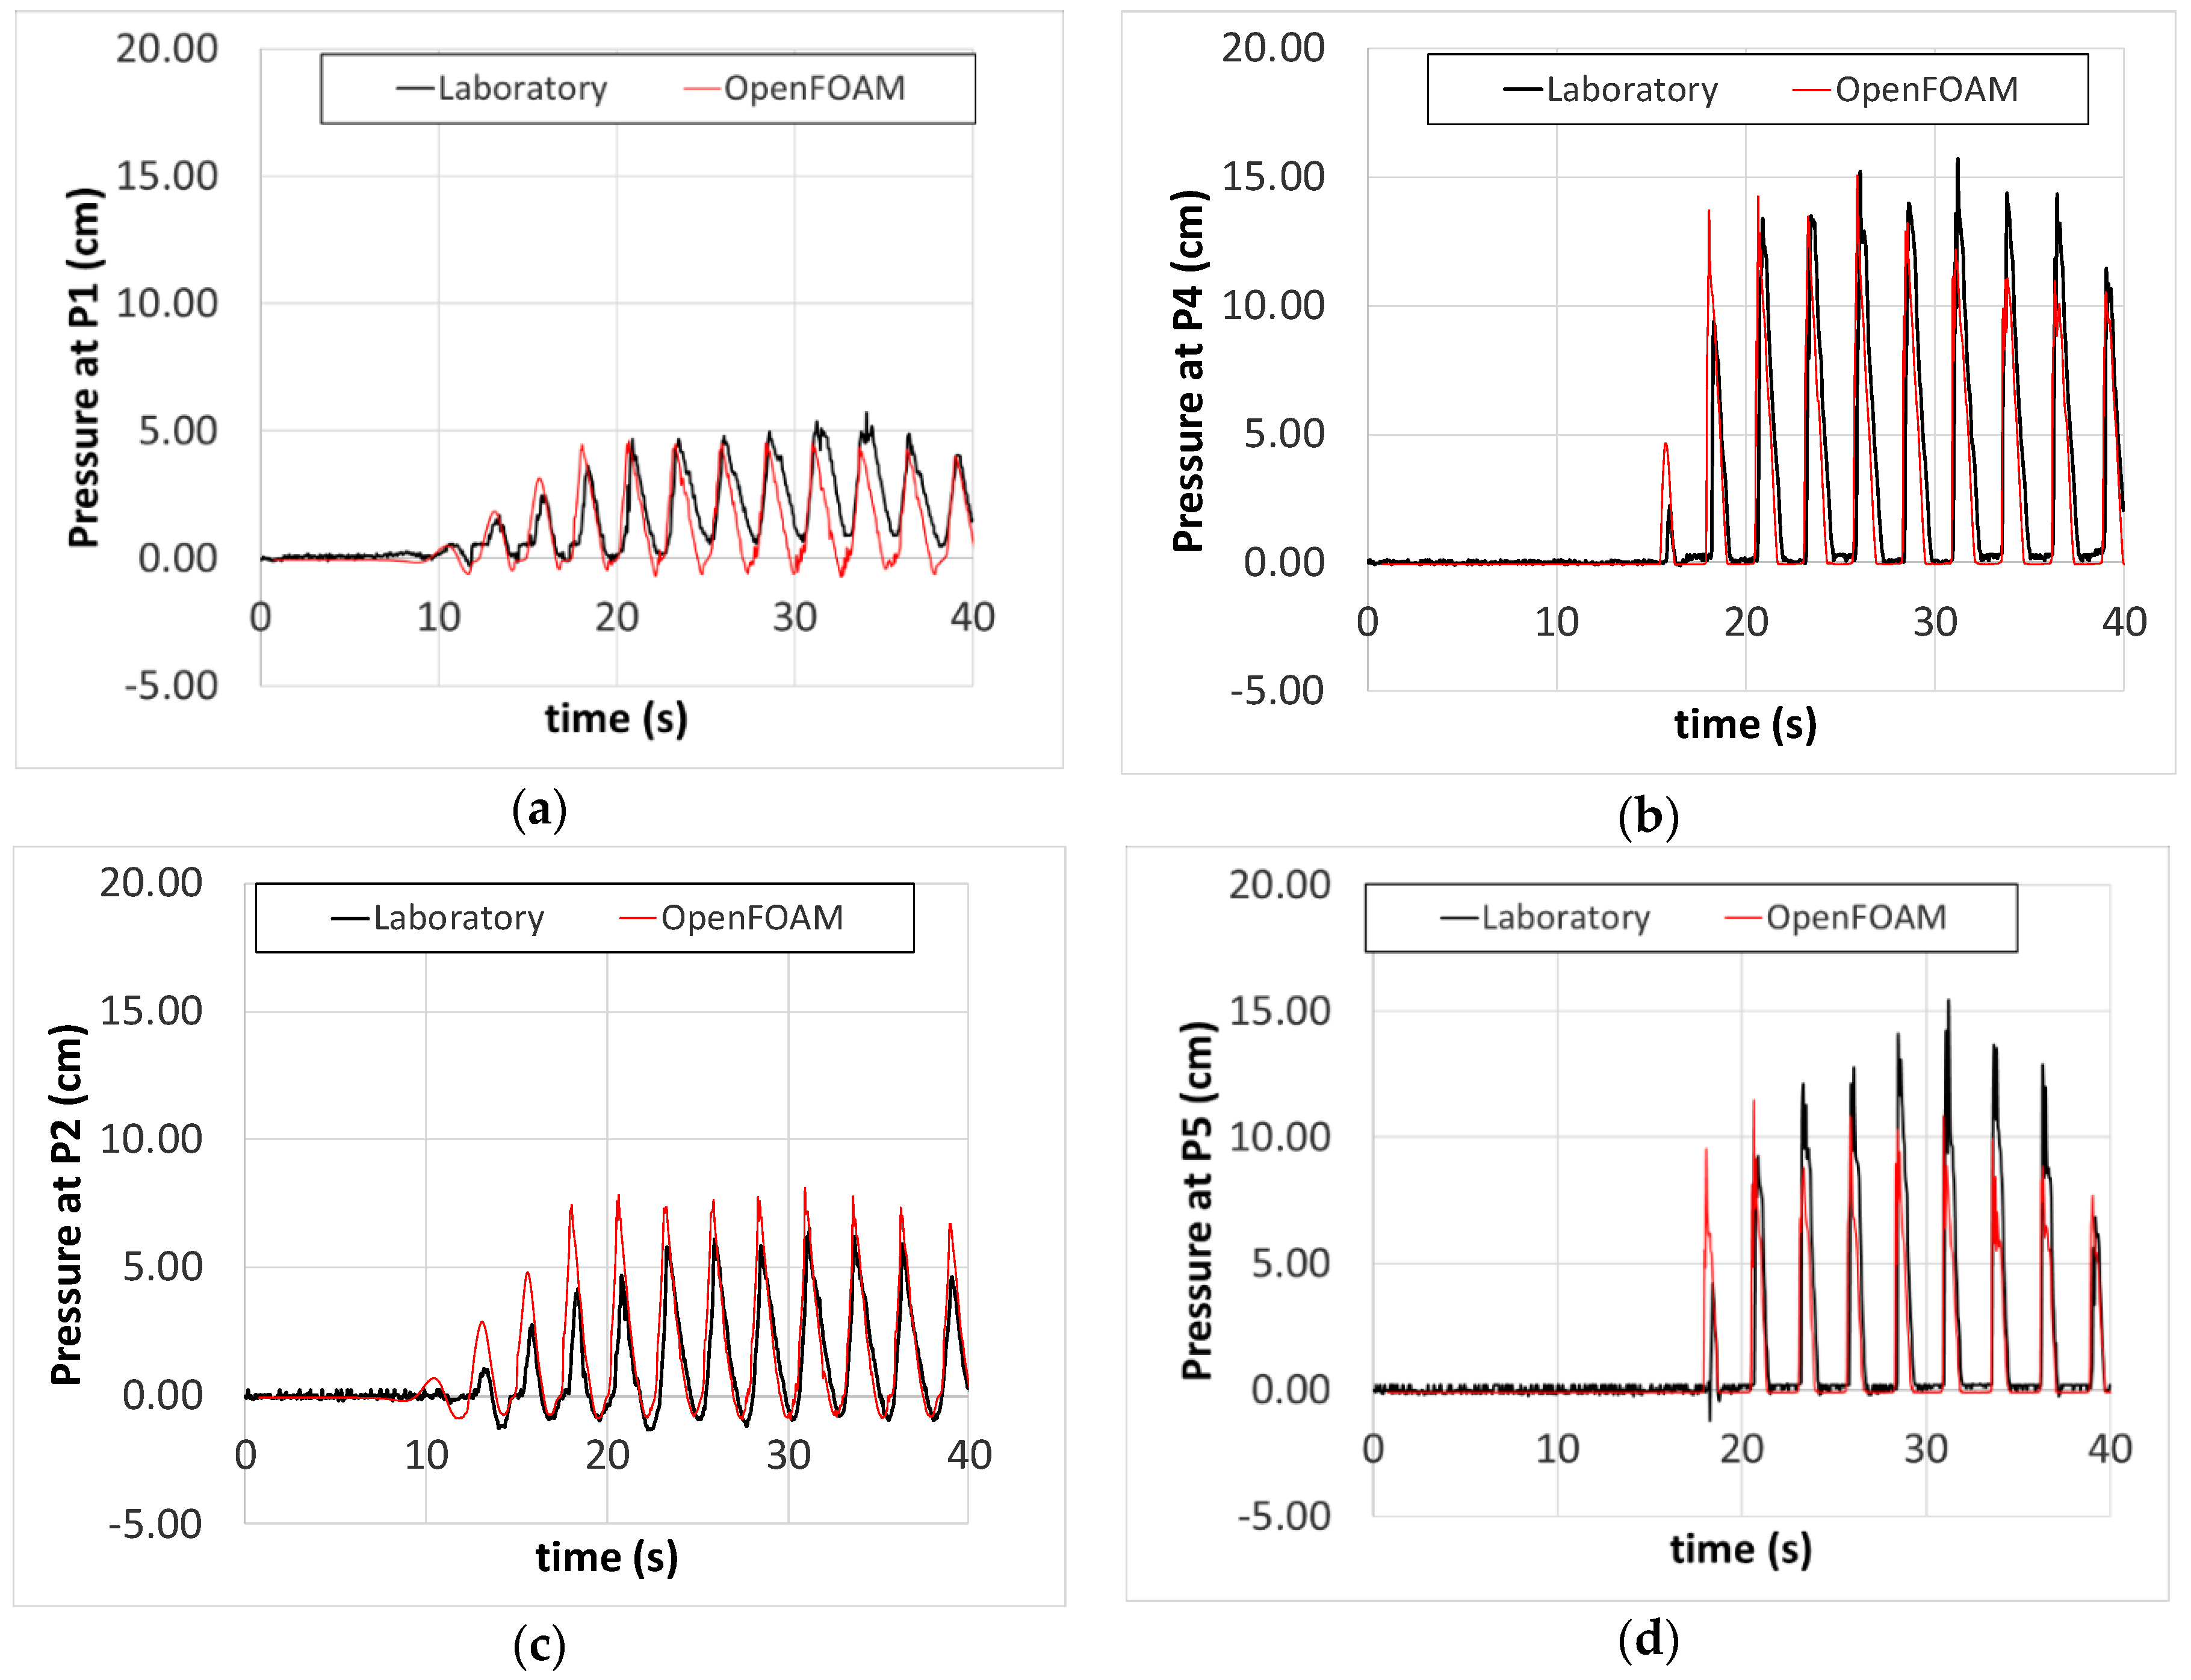
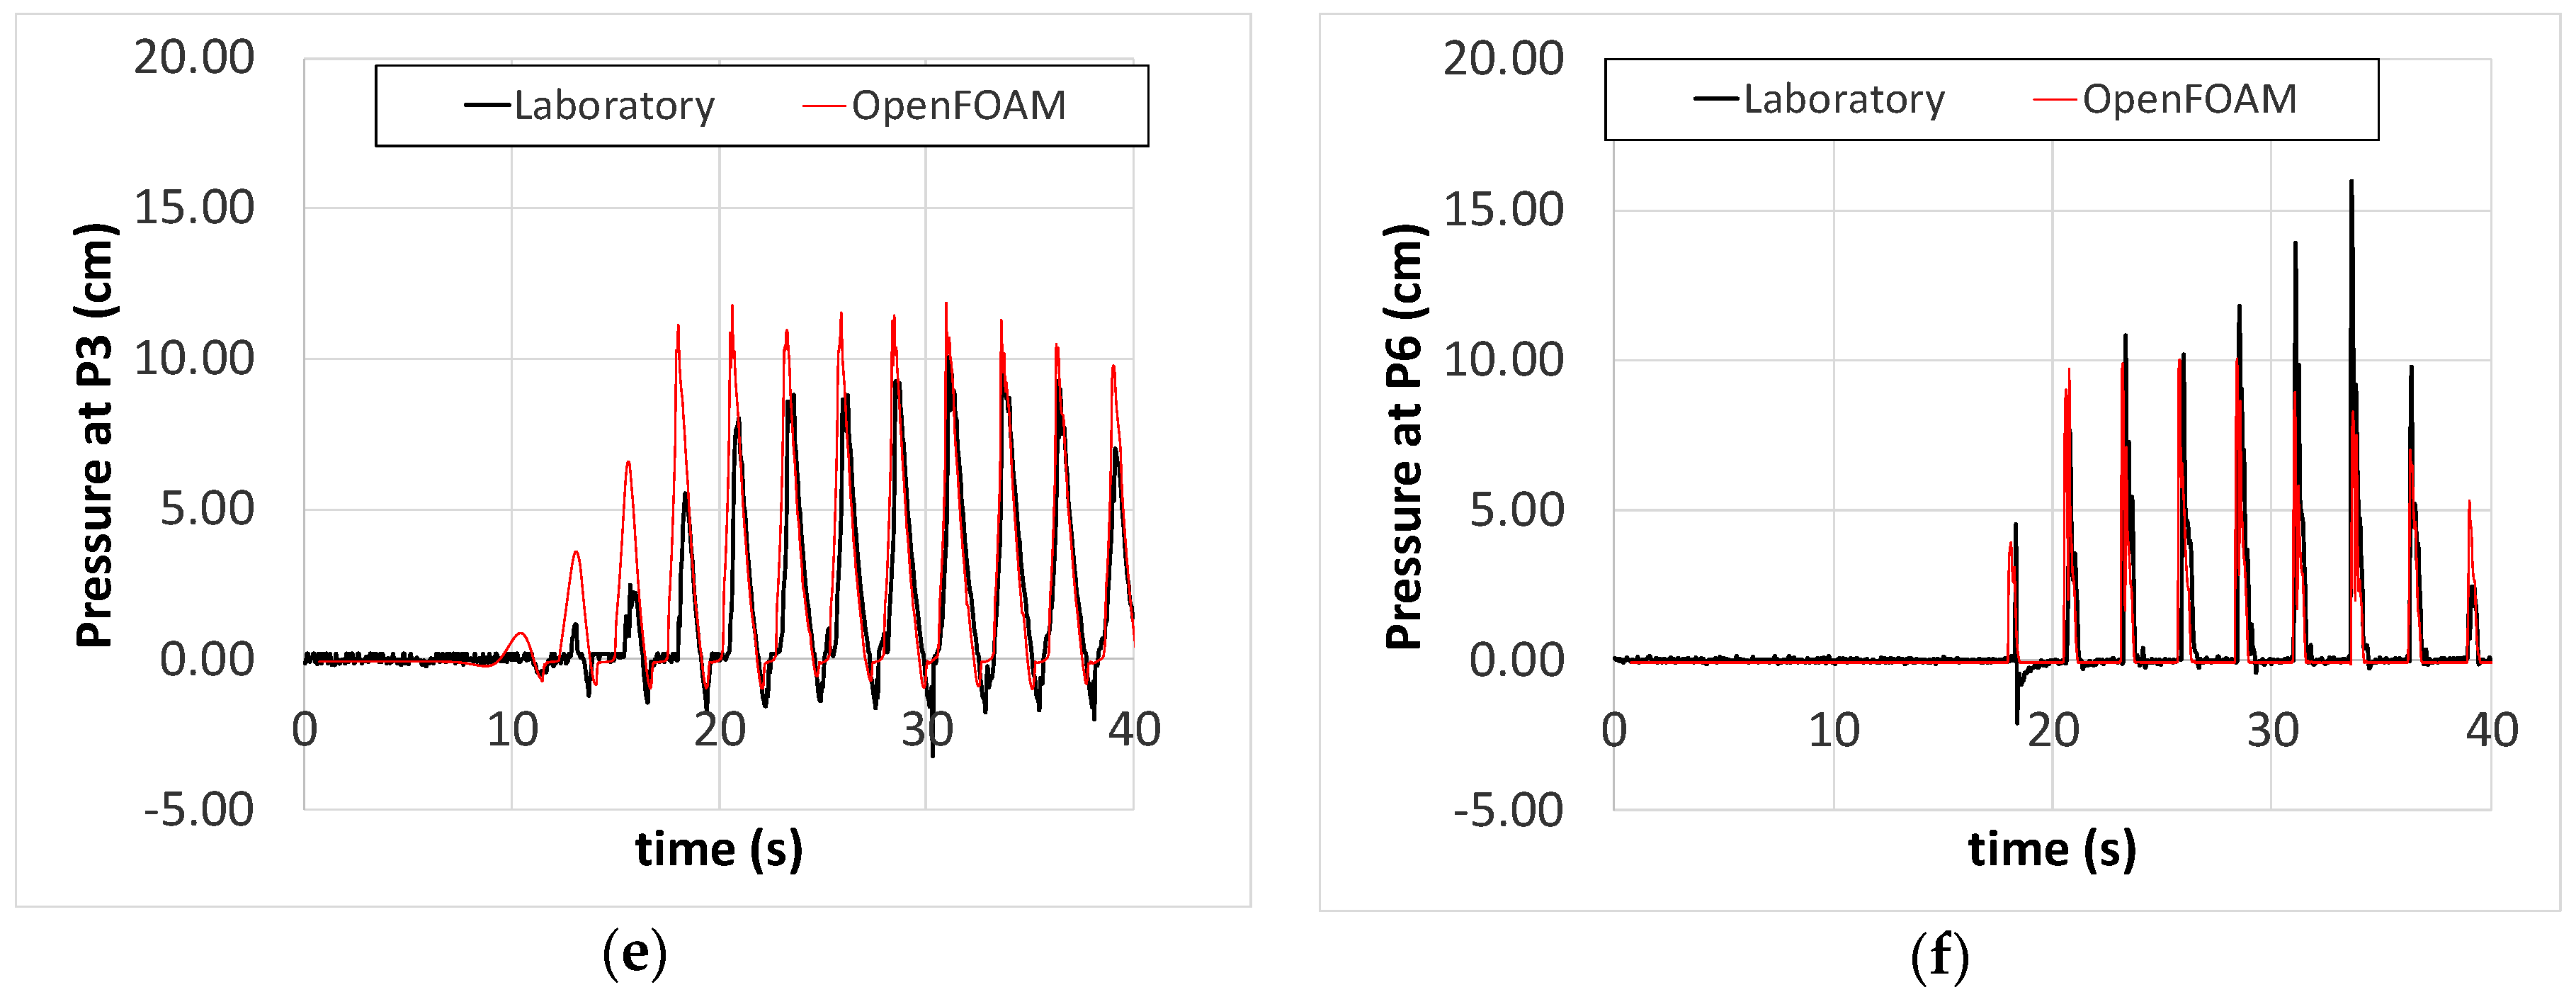
4.2. Irregular Tests
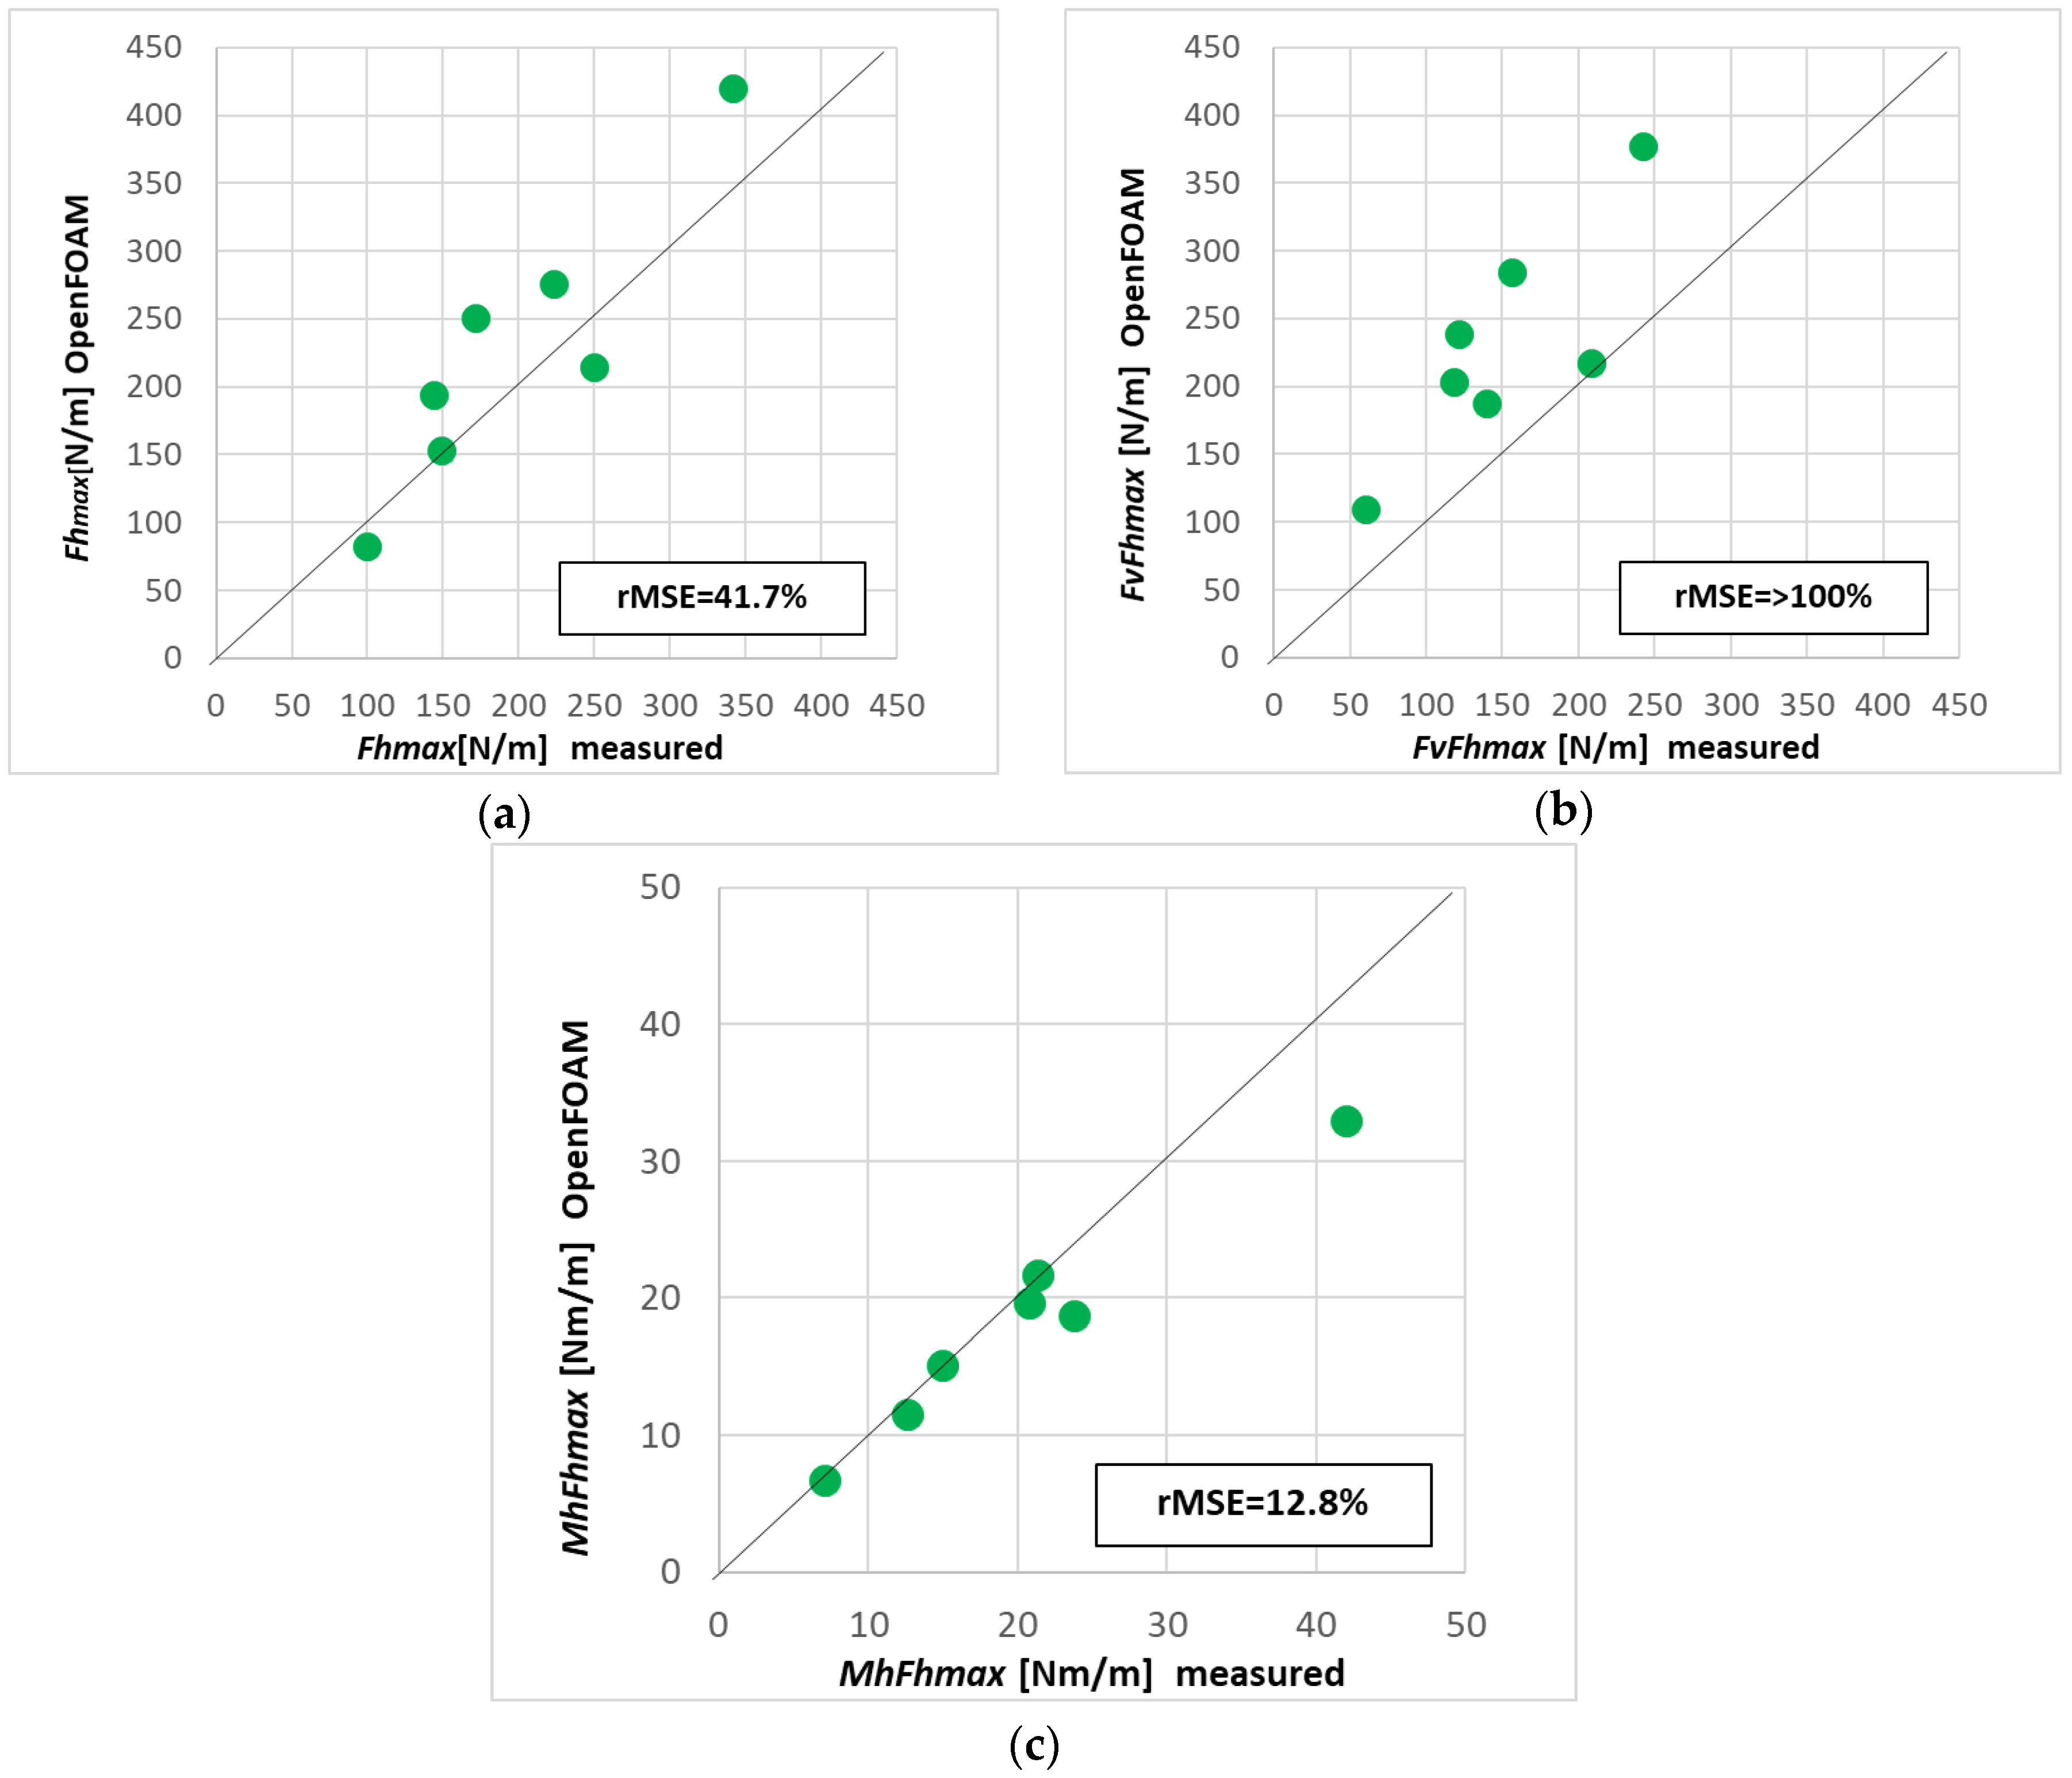
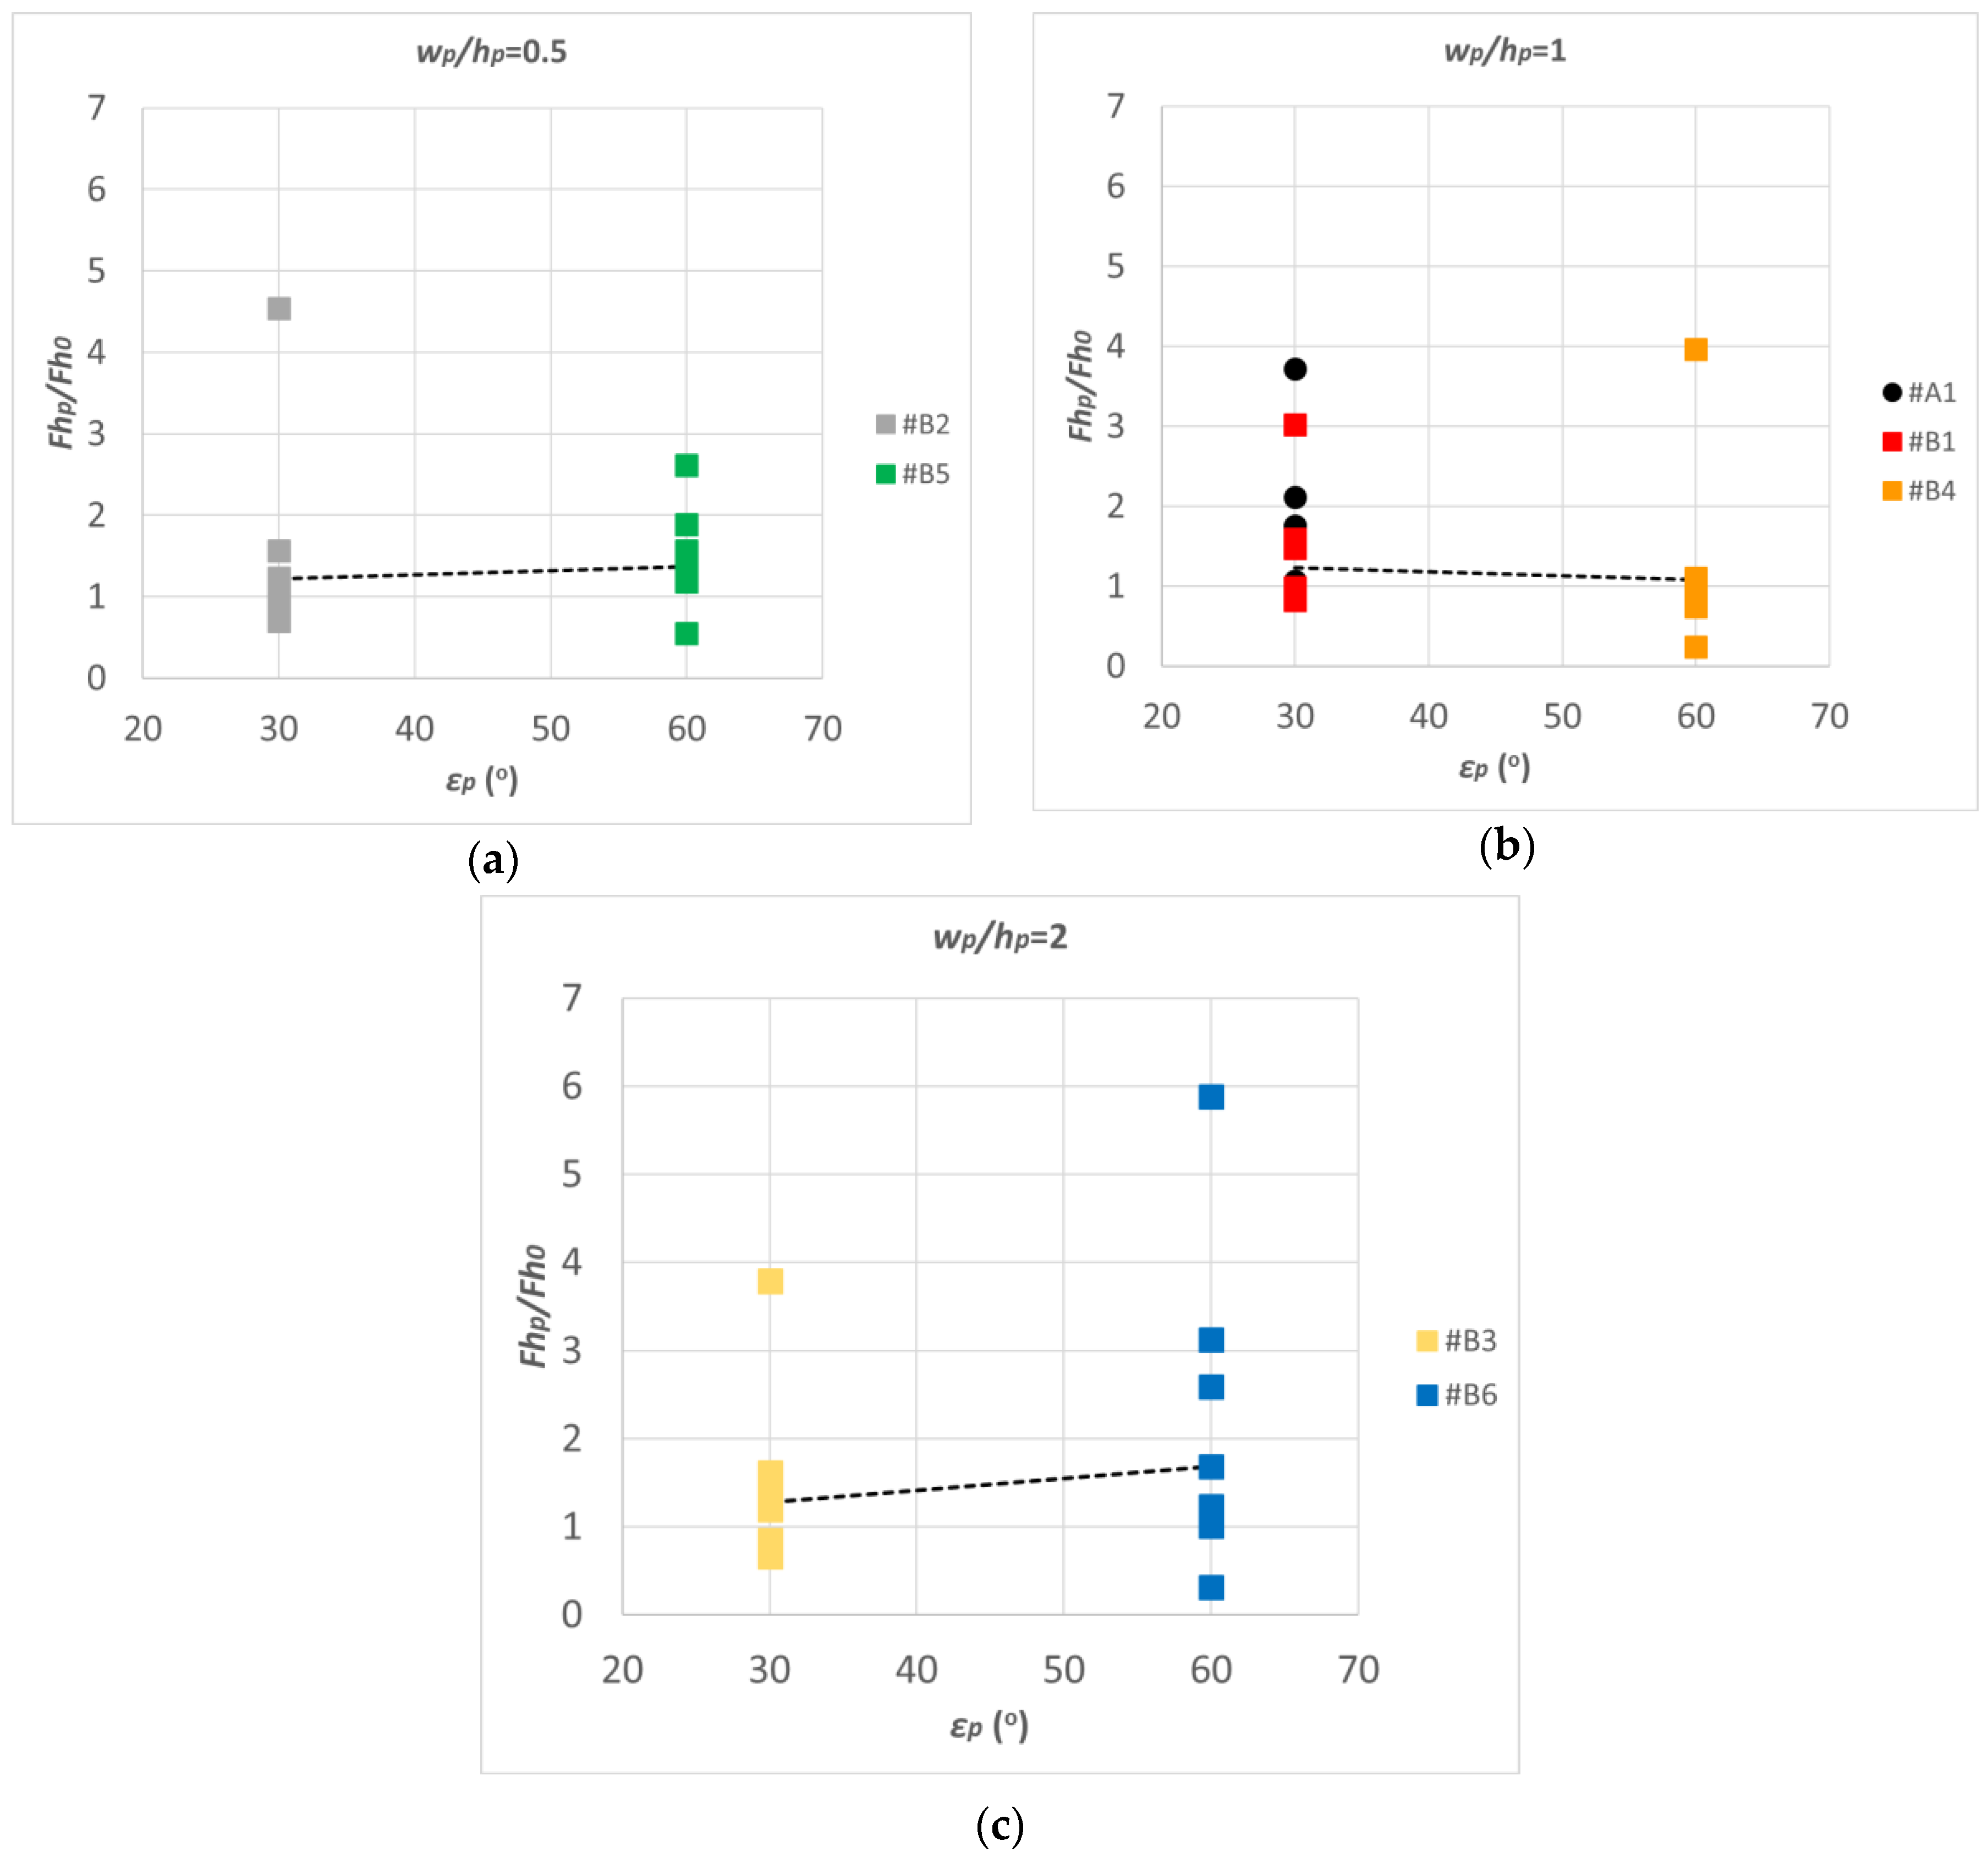
5. Influence of a Parapet on Wave Forces on Crown Walls
6. Conclusions
Author Contributions
Funding
Acknowledgments
Conflicts of Interest
References
- Molines, J.; Bayon, A.; Gómez-Martín, M.E.; Medina, J.R. Influence of parapets on wave overtopping on mound breakwaters with crown walls. Sustainability 2019, 11, 7109. [Google Scholar] [CrossRef]
- Martinelli, L.; Ruol, P.; Volpato, M.; Favaretto, C.; Castellino, M.; De Girolamo, P.; Franco, L.; Romano, A.; Sammarco, P. Experimental investigation on non-breaking wave forces and overtopping at the recurved parapets of vertical breakwaters. Coast. Eng. 2018, 141, 52–67. [Google Scholar] [CrossRef]
- Pedersen, J. Wave Forces and Overtopping on Crown Walls of Rubble Mound Breakwaters; Series Paper 12; Hydraulic and Coastal Engineering Laboratory, Department of Civil Engineering, Aalborg University: Aalborg, Denmark, 1996. [Google Scholar]
- Norgaard, J.Q.H.; Lykke-Andersen, T.; Burcharth, H.F. Wave loads on rubble mound breakwater crown walls in deep and shallow-water wave conditions. Coast. Eng. 2013, 80, 137–147. [Google Scholar] [CrossRef]
- Molines, J. Wave Overtopping and Crown Wall Stability of Cube and Cubipod-Armored Mound Breakwaters. Ph.D. Thesis, Universitat Politecnica de Valencia, Valencia, Spain, 2016. [Google Scholar]
- Molines, J.; Herrera, M.P.; Medina, J.R. Estimations of wave forces on crown walls based on wave overtopping rates. Coast. Eng. 2018, 132, 50–62. [Google Scholar] [CrossRef]
- Van Gent, M.R.A.; van der Werf, I.M. Influence of oblique wave attack on wave overtopping and forces on rubble mound breakwater crest walls. Coast. Eng. 2019, 151, 78–96. [Google Scholar] [CrossRef]
- Kortenhaus, A.; Pearson, J.; Bruce, T.; Allsop, N.W.H.; van der Meer, J.W. Influence of Parapets and Recurves on Wave Overtopping and Wave Loading of Complex Vertical Walls. In Coastal Structures; ASCE: Reston, VA, USA, 2003; pp. 369–381. [Google Scholar]
- Kortenhaus, A.; Haupt, R.; Oumeraci, H. Designs Aspects of Vertical Walls with Steep Foreland Slopes. In Breakwaters, Coastal Structures and Coastlines; ICE: London, UK, 2001; pp. 221–232. [Google Scholar]
- Pearson, J.; Bruce, T.; Allsop, N.W.H.; Kortenhaus, A.; van der Meer, J.W. Effectiveness of Recurve Walls in Reducing Wave Overtopping on Seawalls and Breakwaters. In Proceedings of the 29th International Conference on Coastal Engineering, Lisbon, Portugal, 19–24 September 2004; pp. 4404–4416. [Google Scholar]
- Castellino, M.; Sammarco, P.; Romano, A.; Martinelli, L.; Ruol, P.; Franco, L.; De Girolamo, P. Large impuplsive forces on recurved parapets under non-breaking waves. A numerical study. Coast. Eng. 2018, 136, 1–15. [Google Scholar] [CrossRef]
- Smolka, E.; Zarranz, G.; Medina, J.R. Estudio Experimental del Rebase de un Dique en Talud de Cubípodos. Libro de las X Jornadas Españolas de Costas y Puertos; Universidad de Cantabria-Adif Congresos: Santander, Spain, 2009; pp. 803–809. (In Spanish) [Google Scholar]
- Mansard, E.P.D.; Funke, E.R. The Measurement of Incident and Reflected Spectra Using a Least Swuares Method. In Proceedings of the 17th International Conference on Coastal Engineering, Sydney, Australia, 23–28 March 1980; pp. 154–172. [Google Scholar]
- Van Gent, M.R.A. Wave Interaction with Permeable Coastal Structures. Ph.D. Thesis, Delft University, Delft, The Netherlands, 1995. [Google Scholar]
- Issa, R.I. Solution of the implicitly discretized fluid flow equations by operator-splitting. J. Comput. Phys. 1985, 62, 40–65. [Google Scholar] [CrossRef]
- Patankar, S.V.; Spalding, D.B. A calculation procedure for heat, mass and momentum transfer in three-dimensional parabolic flows. J. Heat Mass Transf. 1972, 15, 1787–1806. [Google Scholar] [CrossRef]
- Jacobsen, N.G.; van Gent, M.R.A.; Capel, A.; Borsboom, M. Numerical prediction of integrated wave loads on crest walls on top of rubble mound structures. Coast. Eng. 2018, 142, 110–124. [Google Scholar] [CrossRef]
- Jensen, B.; Jacobsen, N.G.; Christensen, E.D. Investigations on the porous media equations and resistance coefficients for coastal structures. Coast. Eng. 2014, 84, 56–72. [Google Scholar] [CrossRef]
- Hirt, C.W.; Nichols, B.D. Volume of fluid (VOF) method for the dynamics of free boundaries. J. Comput. Phys. 1981, 39, 201–225. [Google Scholar] [CrossRef]
- Berberovic, E.; van Hinsberg, N.P.; Jakirlic, S.; Roisman, I.V.; Tropea, C. Drop impact onto a liquid layer of finite thickness: Dynamics of the cavity evolution. Phys. Rev. 2009, 79, 036306. [Google Scholar] [CrossRef] [PubMed]
- Jacobsen, N.G.; van Gent, M.R.; Wolters, G. Numerical analysis of the interaction of irregular waves with two dimensional permeable coastal structures. Coast. Eng. 2015, 102, 13–29. [Google Scholar] [CrossRef]
- Higuera, P.; Lara, J.L.; Losada, I.J. Three-dimensional interaction of waves and porous coastal structures using OpenFOAM. Part II: Applications. Coast. Eng. 2014, 83, 259–270. [Google Scholar] [CrossRef]
- Higuera, P.; Lara, J.L.; Losada, I.J. Realistic wave generation and active wave absorption for Navier-Stokes models: Application to OpenFOAM. Coast. Eng. 2013, 71, 102–118. [Google Scholar] [CrossRef]
- Higuera, P.; Lara, J.L.; Losada, I.J. Simulating coastal engineering processes with OpenFOAM. Coast. Eng. 2013, 71, 119–134. [Google Scholar] [CrossRef]
- Higuera, P.; Lara, J.L.; Losada, I.J. Three-dimensional interaction of waves and porous coastal structures using OpenFOAM. Part I: Formulation and validation. Coast. Eng. 2014, 83, 243–258. [Google Scholar] [CrossRef]
- Bayon, A.; Lopez-Jimenez, P.A. Numerical analysis of hydraulic jumps using OpenFOAM. J. Hydroinf. 2015, 17, 662–678. [Google Scholar] [CrossRef]
- Bayon, A.; Valero, D.; Garcia-Bartual, R.; Valles-Moran, F.J.; Lopez-Jimenez, P.A. Performance assessment of OpenFOAM and flow-3d in the numerical modeling of a low reynolds number hydraulic jump. Environ. Model. Softw. 2016, 80, 322–335. [Google Scholar] [CrossRef]
- Bayon, A.; Toro, J.P.; Bombardelli, F.A.; Matos, J.; López-Jiménez, P.A. Influence of VOF technique, turbulence model and discretization scheme on the numerical simulation of the non-aerated, skimming flow in stepped spillways. J. Hydro Environ. Res. 2018, 19, 137–149. [Google Scholar] [CrossRef]
- Romano, A.; Bellotti, G.; Briganti, R.; Franco, L. Uncertainties in the physical modelling of the wave overtopping over a rubble mound breakwater: The role of the seeding number and of the test duration. Coast. Eng. 2015, 103, 15–21. [Google Scholar] [CrossRef]


| Irm | Hm0 (m) | Tp (s) | Wave Type |
| 4 | 0.097 | 1.49 | Irregular |
| 4 | 0.113 | 1.70 | Irregular |
| 4 | 0.132 | 1.83 | Irregular |
| 4 | 0.139 | 1.99 | Irregular |
| 5 | 0.099 | 2.22 | Irregular |
| 5 | 0.117 | 2.55 | Irregular |
| 5 | 0.137 | 3.00 | Irregular |
| Irm | H (m) | T (s) | Wave Type |
| 5 | 0.203 | 2.62 | Regular |
| Structure # | Rc = Ch (m) | Cb (m) | Parapet | wp (m) | hp (m) | εp (º) |
|---|---|---|---|---|---|---|
| A0 | 0.20 | 0.30 | No | - | - | - |
| A1 | 0.20 | 0.30 | Yes | 0.025 | 0.025 | 30 |
| B0 | 0.26 | 0.30 | No | - | - | - |
| B1 | 0.26 | 0.30 | Yes | 0.025 | 0.025 | 30 |
| B2 | 0.26 | 0.30 | Yes | 0.025 | 0.050 | 30 |
| B3 | 0.26 | 0.30 | Yes | 0.050 | 0.025 | 30 |
| B4 | 0.26 | 0.30 | Yes | 0.025 | 0.025 | 60 |
| B5 | 0.26 | 0.30 | Yes | 0.025 | 0.050 | 60 |
| B6 | 0.26 | 0.30 | Yes | 0.050 | 0.025 | 60 |
© 2020 by the authors. Licensee MDPI, Basel, Switzerland. This article is an open access article distributed under the terms and conditions of the Creative Commons Attribution (CC BY) license (http://creativecommons.org/licenses/by/4.0/).
Share and Cite
Molines, J.; Bayón, A.; Gómez-Martín, M.E.; Medina, J.R. Numerical Study of Wave Forces on Crown Walls of Mound Breakwaters with Parapets. J. Mar. Sci. Eng. 2020, 8, 276. https://doi.org/10.3390/jmse8040276
Molines J, Bayón A, Gómez-Martín ME, Medina JR. Numerical Study of Wave Forces on Crown Walls of Mound Breakwaters with Parapets. Journal of Marine Science and Engineering. 2020; 8(4):276. https://doi.org/10.3390/jmse8040276
Chicago/Turabian StyleMolines, Jorge, Arnau Bayón, M. Esther Gómez-Martín, and Josep R. Medina. 2020. "Numerical Study of Wave Forces on Crown Walls of Mound Breakwaters with Parapets" Journal of Marine Science and Engineering 8, no. 4: 276. https://doi.org/10.3390/jmse8040276
APA StyleMolines, J., Bayón, A., Gómez-Martín, M. E., & Medina, J. R. (2020). Numerical Study of Wave Forces on Crown Walls of Mound Breakwaters with Parapets. Journal of Marine Science and Engineering, 8(4), 276. https://doi.org/10.3390/jmse8040276