Abstract
Quaternary carbonate strandplains serve as archives of land–sea interaction, including the impacts of storms and tsunamis. Incipient lithification, especially of compound beach/dune ridges within the action zone of salt spray, presents challenges to geological research, which is often limited to exposures. This study combines aerial image analysis with geophysical datasets to assess the morphostratigraphy and internal structure of the Freedom Beach Strandplain along southern Eleuthera Island, The Bahamas. Color-intensity analysis of field photographs and satellite images revealed general patterns that can be used to distinguish between areas with different grayscale parameters (sand-covered surfaces, lithified ridges, vegetation, etc.). Cross-shore (dip-section) high-resolution (800 MHz) georadar images across ten ridges (A-J) documented the internal architecture of swash-aligned ridge–swale sets. Signatures attributed to storms include truncations in shore-normal radargrams, scour features in alongshore (strike-section) images, and an extensive accumulation of large mollusk shells along one of the oldest ridges (ridge J). Preliminary radiocarbon dating yielded ages of up to 600 years, suggesting intense storms with 50–60-year periodicity as a possible mechanism for ridge formation.
1. Introduction
Coastal strandplains (beach/dune ridge and swale systems) exist on all continents and are characterized by seaward accretion (progradation) during the Holocene. These systems serve as archives of morphodynamic processes punctuated by hydroclimatic events (e.g., intense storms), which are often responsible for the origin of the ridge morphology itself [1,2]. This aspect is particularly important for sea-level research, where care must be taken in using morphological elements as water-level indicators [3,4,5,6].
The Bahamian archipelago contains numerous strandplains with variable orientations, and there has been recent interest in understanding their origin and distribution [6,7]. However, to date, little research has focused on the morphostratigraphy (spatial ridge–swale relationships) and internal architecture of the Bahamian strandplains. The latter aspect is due largely to substantial challenges presented by semi-indurated limestone substrates and limited outcrops of low-lying ridge sets. Understanding key architectural elements of wave-built and aeolian facies not only has implications for locating similar structures in areas where morphology is lacking (e.g., graded surfaces) but also has important implications for recognizing analogous sequences in the rock record [8,9].
Using a small strandplain along the southern coast of Eleuthera Island as an example, the aims of this paper are as follows: (1) to characterize morphostratigraphy of vegetated ridges using color patterns on aerial images; (2) to assess the general erosional-accretionary patterns of ridge and swale systems using high-resolution geophysical images; and (3) to establish the preliminary chronology of the strandplain based on preliminary radiocarbon ages.
2. Study Site
The research area is located in Freetown, southern Eleuthera (“Freedom”) Island, the Bahamas (24°45′40″ N/76°15′45″ W; Figure 1). Here, the study area is referred to as the Freedom Beach Strandplain (FBS), a ridge-and-swale set bounded by a beachrock headland to the west and Plum Creek to the east (Figure 1C). This swash-aligned (concave-seaward or catenary) strandplain has a southerly exposure to Exuma Sound and spans >900 m in alongshore extent (modern beach), with a maximum width of ~300 m in its central section. This is a microtidal setting (mean tidal range: 0.6 m) with a ~2 h lag between the Exuma Sound and the east coast of Eleuthera exposed to the Atlantic Ocean (Figure 1B). The study site has low wave energy due to its leeward location and an embayed morphology bounded by headlands, with the greatest morphodynamic impact occurring during intense storms.
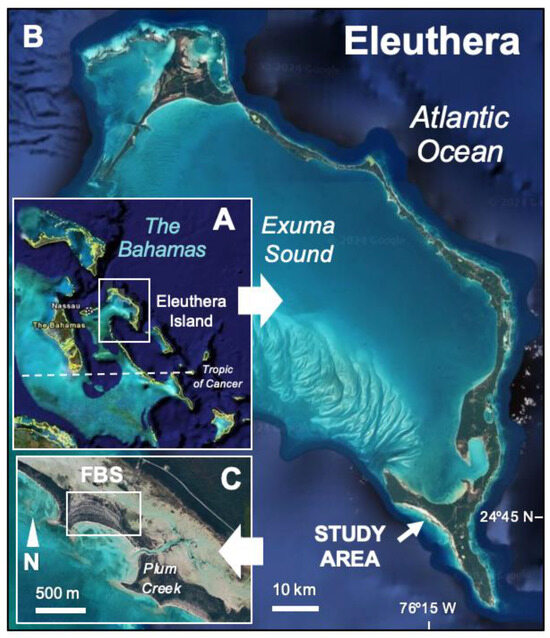
Figure 1.
The locations of the study site: (A) Eleuthera Island, the Bahamas; (B) Location along the southwest coast of the island; (C) Freedom Beach Strandplain (FBS). Image source: Google Earth.
3. Materials and Methods
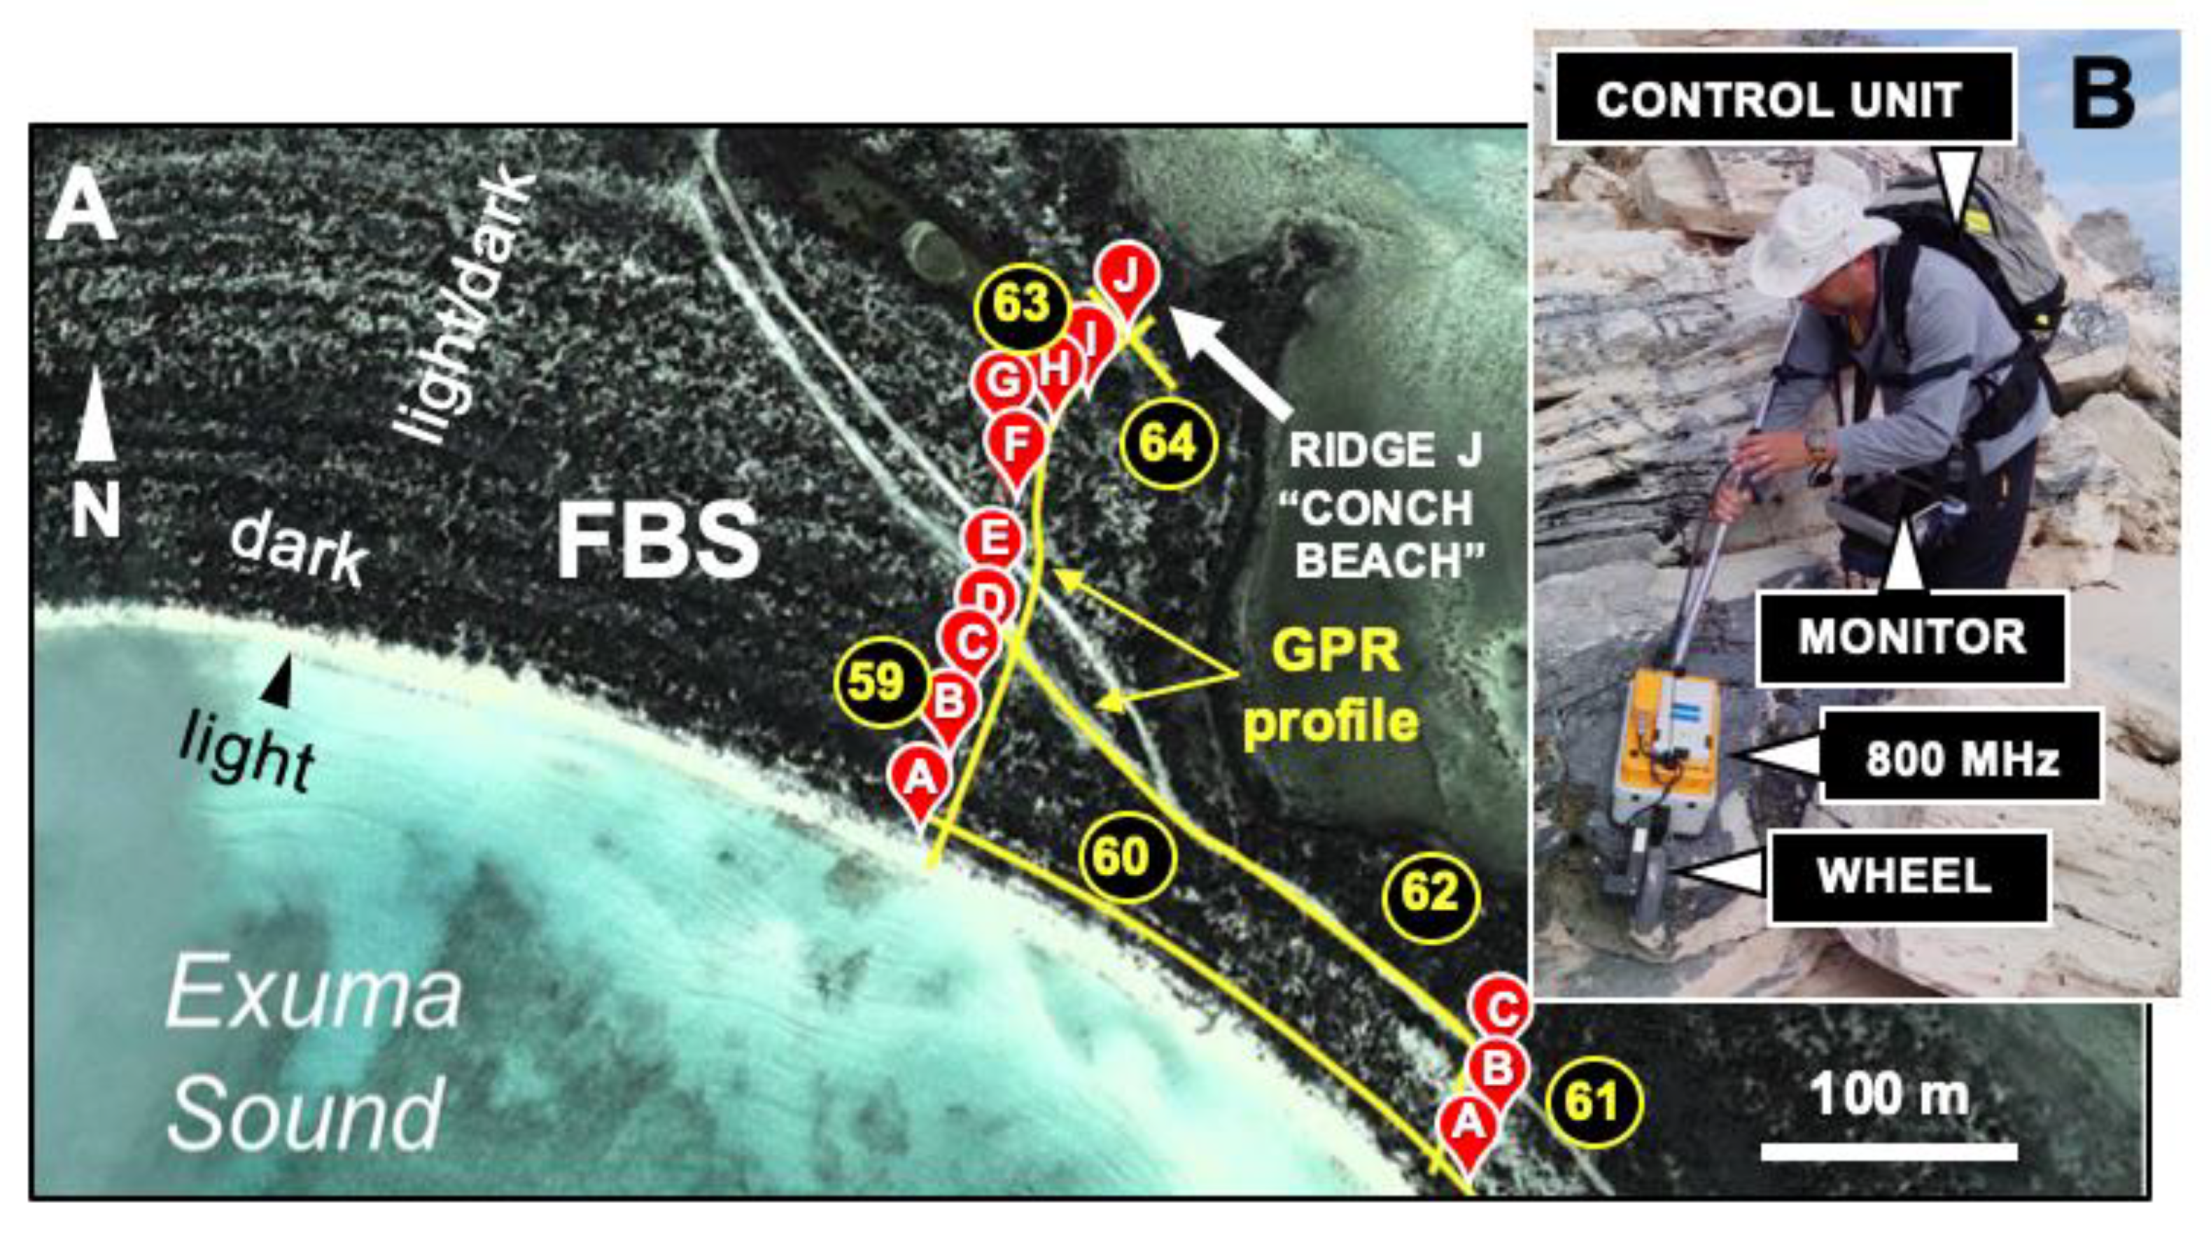
This study was part of a regional field research program conducted in June 2013 that included several sites on Eleuthera Island (Figure 1). The main 250-m-long topographic and geophysical profile is located in the eastern portion of the FBS (Figure 2A). Topographic leveling was accomplished using the Emery-style rod-and-level method, with a vertical accuracy of <2 cm. Key inflection points were geolocated with a hand-held Garmin GPS (accuracy: <1.5 m) and included seaward ridge base, ridge crest, and landward ridge base, with areas between adjacent ridge bases representing swales (e.g., swale D/E spans between the landward edge of ridge D and seaward edge of ridge E).

Figure 2.
Geophysical database: (A) Layout of GPR survey lines 59–64; The ridge–swale topography visible as an alternating light/dark pattern of bare sand/vegetation (or beachrock), respectively. Note that the younger outer (seaward) part of the strandplain is darker in color than the landward section. Image source: Google Earth. Radiocarbon samples were obtained from ridges A, H, and J. (B) MALÅ georadar setup: 800 MHz shielded transceiver antenna with an odometer wheel, a ProEx control unit, and a digital Ramac XV11 monitor.
The light/dark patterns visible in satellite images (Google Earth; resolution ~0.3 m; Figure 1C and Figure 2A) and in field photographs were analyzed using ImageJ freeware (v. 1.54g). The image color-intensity (ICI) was expressed by variable-range spectral modes [10,11]. A 256-shade grayscale (GS) spectrum varied from lowest intensity black (GS = 0) to highest intensity white (GS = 255). A 16-color option rendered the light/dark regions as hotter (red)/cooler (blue) hues, respectively. The pattern of GS values was used to represent the relative ICI variations between light (bare carbonate sand) and dark (vegetation, beachrock) surfaces. At study sites where ridge tops have higher-intensity values (e.g., exposed light sand) or shallow/exposed surfaces are contrasted with dark underwater regions, a normal grayscale was used. This way, topographically low areas were represented by troughs or negative peaks. The scale bar was inverted or values were re-calculated as an inverse grayscale (IGS: 256-GS) to facilitate the visualization of patterns where darker values (e.g., vegetated ridges; Figure 2A) were expressed as positive peaks.
Geophysical surveys were collected using a digital MALÅ GPR system with a ProEx control unit, a Ramac XV11 monitor, and a shielded 800 MHz transceiver antenna with an odometer wheel for triggering and along-ground distance measurements (Figure 2B). The main shore-normal (dip-section) profile (combined lines 59 and 63) traversed all ridges from A to J, with profile 61 to the south spanning the youngest set (Figure 2A). Profiles 60, 62, and 64 were collected along the swales to offer strike-section visualization of the subsurface architecture. A signal velocity of 12 cm/ns was used for upper unsaturated parts of the carbonate lithosome (semi-consolidated and unconsolidated) based on empirical data from a number of Bahamian sites [8] and hyperbola fitting during surveys. Basic post-processing protocols were applied to representative radargrams (2D sections or B-scans) for technical aspects of data collection and processing [8,12,13,14,15]. The topographic profile collected along the main shore-normal transect served as the basis for the surface normalization of georadar images. Preliminary radiocarbon ages were obtained at the Beta Analytic Laboratory on whole-rock samples from ridges A, H, and J, as well as a mollusk shell from ridge J, following weathering rind removal and local reservoir correction’s application.
4. Results
Remotely sensed databases (satellite images, aerial photography; Figure 2) and field surveys (Figure 3) demonstrate a clear visual pattern of ridge–swale topography based on relative color-intensity characteristics. In the field, the image color-intensity varies from light (GS > 100) for exposed carbonate sand (modern beach and swales) to darker surfaces characteristic of lithified limestone and vegetation, both common for the ridges. It is important to note that this is a relative difference assessed for every field photograph (Figure 3); however, common ranges of grayscale values are sufficient to differentiate the key sub-environments.
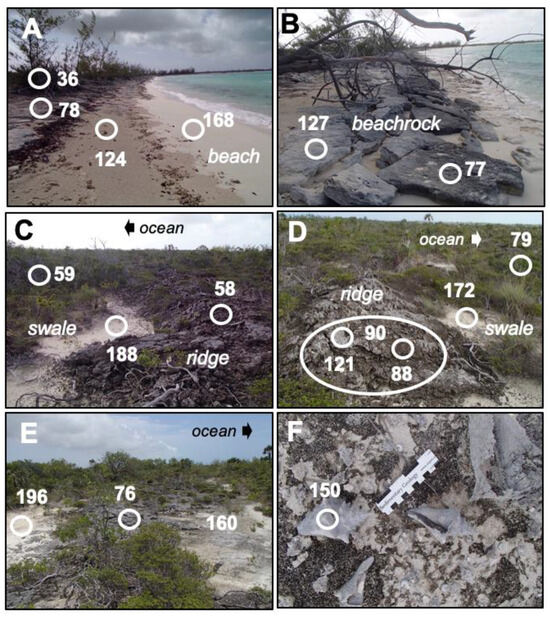
Figure 3.
Strandplain morphology and ICI values (circles with numbers): (A) Youngest ridge (A) with lithified beachrock fronted by an active sandy beach, facing east; (B) Eroding beachrock along the beach; (C) Dark ridge from a younger (outer) set (B–E), looking west; (D) Example of a weathered older ridge (F–J), facing east; (E) Oldest ridge (J), looking east; (F) Subfossil conch shells along the paleo-beach surface of ridge J. Note the relative color-intensity variation in each field photograph (circles), with all images taken within several hours.
Similarly, the spatial patterns of the gross ridge–swale geometry visible in satellite images (Figure 4A) were expressed in a 16-bit color rendition (Figure 4B), with cooler (blue) colors corresponding to vegetated ridges. The topographic profile along the geophysical survey line in the eastern part of the strandplain (Figure 4C) shows that most ridges range between 1.5 m (ridge I) and 2.7 m (ridge A) were above the higher high-water level. Grayscale profiles D (~topographic profile location) and E (central part of strandplain) show general similarity in ICI patterns that correlate with topography (Figure 4D,E).
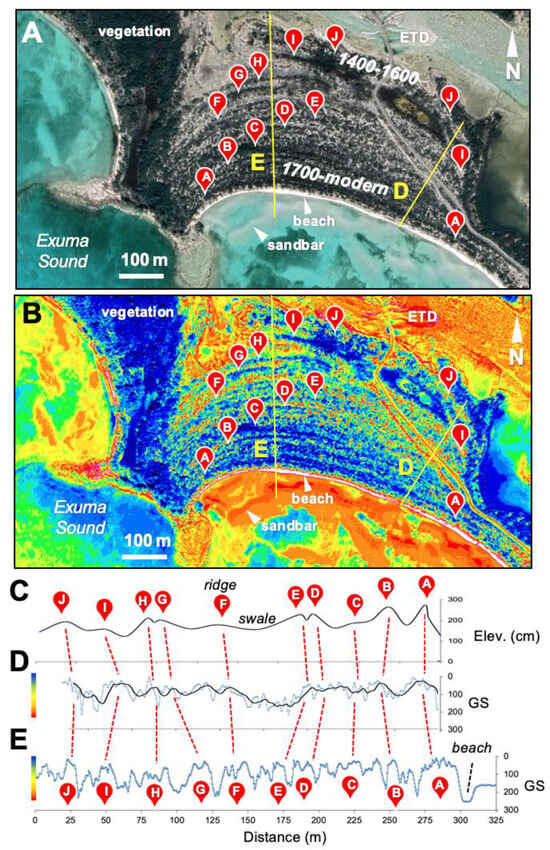
Figure 4.
Strandplain topography: (A) Satellite image (Google Earth); Calibrated radiocarbon ages (years CE) are shown in italics. (B) Sixteen-color rendition. (C) Topographic profile along GPR line (59/63). (D) Inverse grayscale profile along the GPR transect (blue), with a running average (black). (E) Inverse grayscale profile across the widest strandplain section. ETD—ebb tidal delta.
This correlation is further demonstrated in Figure 5, with higher seaward (younger) ridges having darker colors and most of the older ridges yielding relatively light values (low inverse grayscale, IGS). Profiles D and E have similar trends, with a second-order (quadratic) polynomial producing a good fit.
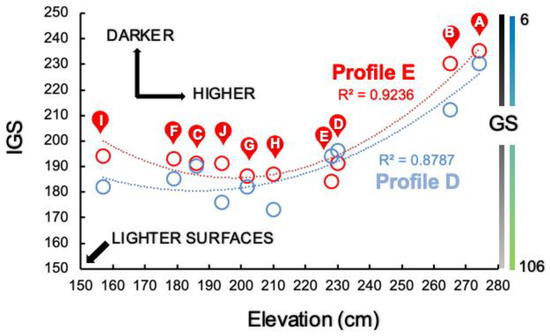
Figure 5.
Relationship between ridge elevation (topographic profile in Figure 4C) and mean color-intensity value expressed as inverse grayscale (IG) for profiles D (blue) and E (red; Figure 4). Second-order polynomial trendlines are shown, although the absolute elevation values are coincidental. In general, the seaward (younger) ridges are higher and darker.
The subsurface architecture of the ridges is expressed in shore-normal (dip-section; Figure 6 and Figure 7) and shore parallel (strike-section; Figure 8) GPR images. The second youngest ridge B reveals a complex pattern of seaward-dipping reflections (note: high-amplitude 2D scans are designed to show the fine resolution of the 800 MHz setup). In the landward portion (B/C swale), a sharp and deep seaward-dipping reflection is onlapped by landward-dipping bounding surfaces. The complex and chaotic bedding of the ridge B superstructure transitions into a series of seaward-dipping radar facies, with multiple hyperbolic diffractions (point-source targets) seen throughout the radargram (Figure 6).
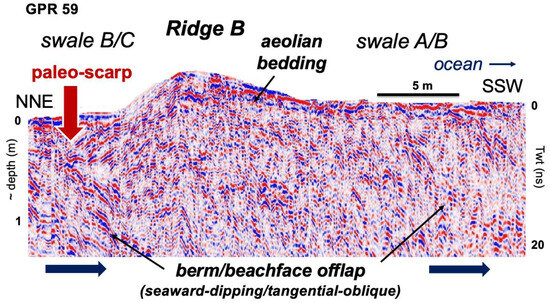
Figure 6.
High-amplitude shore-normal GPR image of ridge B. Note the sharp truncation at the left, which is interpreted as an erosional surface (scarp). Twt—two-way travel time (nanoseconds).
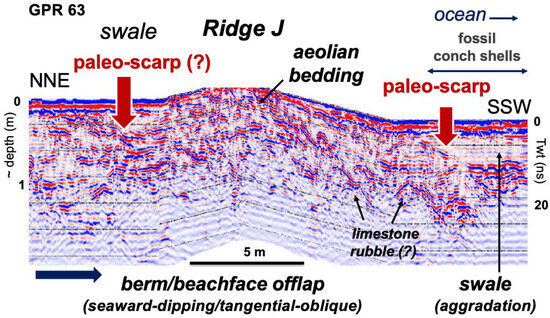
Figure 7.
Shore-normal GPR image of ridge J. Erosional surfaces (paleo-scarp disconformities) are visible both landward and seaward of the ridge. An anomalous accumulation of conch shells (Figure 3F) stretches along the seaward slope. The shore parallel survey (Figure 7) was collected along this paleo-beach surface (swale I/J). Twt—two-way travel time (nanoseconds).

Figure 8.
The shore-parallel image (westerly segment of GPR profile 64) reveals a concave pattern interpreted as paleo-depressions. The profile was collected along the paleo-beach surface (Figure 7) covered by fossil conch shells. Twt—two-way travel time (nanoseconds).
Along the landward portion of the FBS, the oldest surveyed ridge J contains a similar pattern, with sharp truncations both landward and seaward of the ridge (Figure 7). Above the deeper zone of attenuated signal response, there are numerous hyperbolic diffractions underlying the offlapping sequence.
The shore-parallel survey collected along the seaward portion of ridge J reveals several concave-up structures, which extend to ~1 m below the ground surface (note: no topographic correction was necessary). Similar to shore-normal radargram segments, multiple point-source diffractions are visible at depth, with signal attenuation beginning at a ~2 m depth.
The first set of radiocarbon dates ranges between 570 ± 30 yBP (cal CE 1710 to post-1950) for ridge A, 370 ± 30 yBP (post-1950) for ridge H, and 970 ± 40 yBP (cal CE 1400–1600) for ridge J (2-sigma calibrated ages in parentheses). An extensive accumulation of mostly juvenile conch shells (Aliger sp.), exhibiting different degrees of breakage, abrasion, and weathering, occur along the seaward slope of ridge J. The 290 ± 30 yBP radiocarbon date for a large shell is calibrated to a “modern” age.
5. Discussion
This study demonstrates the applicability of combining a simple image analysis tool with geophysical imaging for investigating carbonate strandplain morphology and subsurface architecture, respectively (Figure 9). The Freedom Beach Strandplain is a classic swash-aligned beach/dune ridge-and-swale system developed through progradation within a low-energy embayment [2,6,7,16]. The ridges are commonly associated with erosional features, such as storm scarps, which likely nucleate their formation. This is supported by their catenary (concave-seaward) geometry mimicking the approach of refracted waves [17,18,19,20,21,22]. Whereas sea-level position is an important long-term constraint on beach/dune ridge elevation, most ridge sets are the result of sub-century storm-mediated periodicity rather than high-frequency sea-level fluctuations [3,4,5,23].
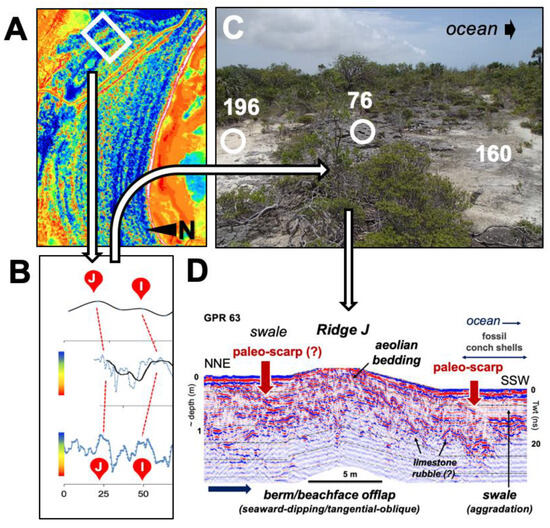
Figure 9.
Dataset summary: (A) A color-intensity image highlighting the ridge-and-swale topography (box–ridges I and J); (B) The topographic profile (top) compared to grayscale profiles of the older ridges; (C) A field photograph of a semi-lithified ridge; (D) A GPR image linking subsurface features to morphological elements.
Image-color-intensity values offer a promising means of distinguishing between ridges and swales, in this case, darker colors resulting from vegetation and carbonate lithification (Figure 3, Figure 4 and Figure 5; Figure 9A–C). The latter is likely due to incipient diagenesis, bacterial staining, or vegetation debris (Figure 3), among other factors. To show that the higher topographic features have lower intensity (darker) ICI values, profiles can be plotted either in an inverted grayscale (GS = 0 [black] at top; Figure 4D,E) or as an inverse grayscale (IG = 256 [black] at top; Figure 5). At some sites, light-colored carbonate ridges and flooded swales with vegetation or algal mats would be represented by a normal grayscale (GS = 256 [white] at top).
Georadar images of carbonate facies, both semi-lithified and unconsolidated (oolitic and bioclastic sand), have generally similar pattern characteristics to their unconsolidated siliciclastic counterparts [8,24,25,26,27,28,29,30,31]. Smaller-scale complexity documented in FBS radargrams is likely due to a combination of diagenetic features, buried vegetation (or trunk molds), water/air escape features (up to large pipe structures), and a spectrum of biogenic structures, such as medium-to-large burrows [32,33,34,35,36,37,38,39,40]. Because larger biogenic structures, like sea turtle nests, likely exist along paleo-swales at many Caribbean sites, caution must be taken in differentiating them from small storm channels or anthropogenic excavations [41,42]. Large-scale depressions (Figure 8) are likely due to storm scour, but more research is needed. Rather than merely using them as “tie” lines between traditional shore-normal transects, we highlight the importance of conducting alongshore surveys even in areas where long-term paleo-channels are not likely (tidal prism access), but event-related scouring may be identified.
The anomalous accumulation of conch shells (Aliger sp.) along the seaward slope of ridge J is likely an event-generated accumulation [43,44] and was recently interpreted as a storm-generated thanatocoenosis of mostly local mollusks [45]. This was likely a moderate storm (seaward scarp in Figure 7) that did not affect the ridge J superstructure. Intense storms, especially following limited progradation, are likely to modify or erode low unlithified ridges. Based on preliminary radiocarbon dating results, the age of 970 ± 40 yBP (cal 1400–1600 CE) for ridge J suggests a 40–60-year/ridge time-averaged accumulation rate for the 10-ridge sequence. With a medium-term 50–60-year recurrence interval of tropical cyclones suggested as a hydroclimatic forcing at many sites, including the Caribbean basin [46,47,48,49,50,51,52], the preliminary chronology is consistent with storms as a mechanism for scarp-nucleated, catenary beach/dune ridge formation.
6. Conclusions
Our study demonstrates the viability of image-color-intensity analysis and georadar imaging for characterizing the surface morphology and subsurface structure of a carbonate strandplain, respectively. Color-intensity analysis provides a rapid and very effective means of performing both the qualitative and quantitative assessment of morphological and ground-cover elements. Lighter (higher GS) shades correspond to bare carbonate sand (beach and swales), whereas darker hues are more common for lithified limestone (e.g., ridges) and vegetated areas. Grayscale inversion, depicted as an inverted GS axis or IGS value, is used for visual comparison with topographic profiles. High-resolution GPR images, especially with high-amplitude rendition, reveal highly complex depositional patterns, which are further complicated by point-source reflections attributed to limestone rubble or biogenic structures. Shallow depressions in shore-parallel radargrams may be the result of storm scour. Clear truncations (paleo-scarps) immediately behind the ridges support the mechanism of storm erosion as a nucleus for subsequent swash-generated vertical accretion and aeolian aggradation. This easily explains the swash-aligned pattern of most strandplains, which resembles wave refraction patterns within embayments. The occurrence of exposed molluscan taphoceonoses is likely related to a moderate storm, as in the case of ridge J fronted by a younger scarp. Preliminary ages are generally consistent with the 50–60-year recurrence interval of tropical cyclones in this part of the Atlantic Ocean basin.
Author Contributions
Conceptualization, I.V.B., M.S. and H.A.C.; methodology, I.V.B. and M.S.; formal analysis, I.V.B. and M.S.; writing—I.V.B.; writing—review and editing, I.V.B., M.S. and H.A.C.; funding acquisition I.V.B. All authors have read and agreed to the published version of the manuscript.
Funding
American Chemical Society PRF Grant 54935-ND8, Miami University.
Data Availability Statement
Field measurements of bathymetric profiles are available on request from the corresponding author.
Acknowledgments
We thank Perry Gnivecki for organizing the trip to Eleuthera Island, Tara Ingalsbe for providing assistance in the field, and the Cape Eleuthera Institute and the people of the Bahamas for their hospitality. Comments by three anonymous reviewers greatly improved this manuscript.
Conflicts of Interest
The authors declare no conflicts of interest.
References
- Tamura, T. Beach ridges and prograded beach deposits as palaeoenvironment records. Earth-Sci. Rev. 2012, 114, 279–297. [Google Scholar] [CrossRef]
- Isla, M.F.; Moyano-Paz, D.; FitzGerald, D.M.; Simontacchi, L.; Veiga, G.D. Contrasting beach-ridge systems in different types of coastal settings. Earth Surf. Process. Landf. 2023, 48, 47–71. [Google Scholar] [CrossRef]
- Kindler, P. Coastal response to the Holocene transgression in the Bahamas: Episodic sedimentation versus continuous sea-level rise. Sediment. Geol. 1992, 80, 319–329. [Google Scholar] [CrossRef]
- Neumann, A.C.; Hearty, P.J. Rapid sea-level changes at the close of the last interglacial (substage 5e) recorded in Bahamian island geology. Geology 1996, 24, 775–778. [Google Scholar] [CrossRef]
- Khan, N.S.; Ashe, E.; Horton, B.P.; Dutton, A.; Kopp, R.E.; Brocard, G.; Engelhart, S.E.; Hill, D.F.; Peltier, W.; Vane, C.H.; et al. Drivers of Holocene sea-level change in the Caribbean. Quat. Sci. Rev. 2017, 155, 13–36. [Google Scholar] [CrossRef]
- Savarese, M.; Curran, H.A. Origin of Late Holocene strandplains in the southern Exuma Islands, Bahamas: Progradation, ephemeral highstands, and storminess. In Proceedings of the 16″ Symposium on the Geology of the Bahamas and Other Carbonate Regions; Glumac, B., Savarese, M., Eds.; Gerace Research Centre: San Salvador, Bahamas, 2016; pp. 39–59. [Google Scholar]
- Cescon, A.L.; Cooper, J.A.G.; Jackson, D.W.T. Nature distribution of beach ridges on the islands of the Greater Caribbean. J. Mar. Sci. Eng. 2024, 12, 565. [Google Scholar] [CrossRef]
- Buynevich, I.V.; Savarese, M.; Curran, H.A.; Bitinas, A.; Glumac, B.; Pupienis, D.; Kopcznski, K.A.; Dobrotin, N.; Gnivecki, P.L.; Park Boush, L.E.; et al. Sand incursion into temperate (Lithuania) and tropical (the Bahamas) maritime vegetation: Georadar visualization of target-rich aeolian lithosomes. Estuar. Coast. Shelf Sci. 2017, 195, 69–75. [Google Scholar] [CrossRef]
- Shinn, E.A. Burrowing in Recent Lime Sediments of Florida and the Bahamas. J. Paleontol. 1968, 42, 879–894. [Google Scholar]
- Porter, S.C. High resolution paleoclimatic information from Chinese eolian sediments based on grayscale intensity profiles. Quat. Res. 2000, 53, 70–77. [Google Scholar] [CrossRef]
- Buynevich, I.V.; Davydov, O.V.; FitzGerald, D.M. Coastal inlet analysis by image color intensity variations: Implications for the barrier coast of Ukraine. J. Mar. Sci. Eng. 2025, 13, 72. [Google Scholar] [CrossRef]
- Davis, J.L.; Annan, A.P. Ground-penetrating radar for high-resolution mapping of soil and rock stratigraphy. Geophys. Prospect. 1989, 37, 531–551. [Google Scholar] [CrossRef]
- Baker, P.L. Response of ground-penetrating radar to bounding surfaces and lithofacies variations in sand barrier sequences. Explor. Geophys. 1991, 22, 19–22. [Google Scholar]
- Jol, H.M.; Bristow, C.S. GPR in sediments: Advice on data collection basic processing interpretation a good practice guide. In Ground Penetrating Radar in Sediments; Bristow, C.S., Jol, H.M., Eds.; Geological Society of London, Special Pub: London, UK, 2003; Volume 11, pp. 9–27. [Google Scholar]
- Dougherty, A.J. Prograded coastal barriers provide paleoenvironmental records of storms and sea level during late Quaternary highstands. J. Quat. Sci. 2018, 33, 501–517. [Google Scholar] [CrossRef]
- Hesp, P.A. Foredunes and blowouts: Initiation, geomorphology and dynamics. Geomorphology 2002, 48, 245–268. [Google Scholar] [CrossRef]
- Pedersen, K.; Clemmensen, L.B. Unveiling past aeolian landscapes; a ground-penetrating radar survey of a Holocene coastal dunefield system, Thy, Denmark. Sediment. Geol. 2005, 177, 57–86. [Google Scholar] [CrossRef]
- Buynevich, I.V.; Savarese, M.; Kadurin, S.V.; Larchenkov, E.P.; Park Boush, L.E.; Curran, A.H.; Beal, I.A. Morphodynamics and geological legacy of berm scarps along non-tidal (Ukraine) and microtidal (the Bahamas) coasts. Geol. Geogr. Bull. Odesa Natl. Univ. Ukr. 2014, 19, 177–187. [Google Scholar]
- Tõnisson, H.; Suursaar, U.; Kont, A.; Muru, M.; Rivis, R.; Rosentau, A.; Tamura, T.; Vilumaa, K. Rhythmic patterns of coastal formations as signs of past climate fluctuations on uplifting coasts of Estonia, the Baltic Sea. J. Coast. Res. Spec. Issue 2018, 85, 611–615. [Google Scholar] [CrossRef]
- Tamura, T.; Cunningham, A.C.; Oliver, T.S.N. Two-dimensional chronostratigraphic modelling of OSL ages from recent beach-ridge deposits, SE Australia. Quat. Geochronol. 2019, 49, 39–44. [Google Scholar] [CrossRef]
- Suursaar, U.; Rosentau, A.; Hang, T.; Tõnisson, H.; Tamura, T.; Vaasma, T.; Vandel, E.; Vilumaa, K.; Sugita, S. Climatically induced cyclicity recorded in the morphology of uplifting Tihu coastal ridgeplain, Hiiumaa Island, eastern Baltic Sea. Geomorphology 2022, 404, 108187. [Google Scholar] [CrossRef]
- Goslin, J.; Clemmensen, L.B. Proxy records of Holocene storm events in coastal barrier systems: Storm-wave induced markers. Quat. Sci. Rev. 2017, 174, 80–119. [Google Scholar] [CrossRef]
- FitzGerald, D.M.; Fenster, M.S.; Argow, B.; Buynevich, I.V. Coastal impacts due to sea-level rise. Annu. Rev. Earth Planet. Sci. 2008, 36, 601–647. [Google Scholar] [CrossRef]
- Botha, G.A.; Bristow, C.S.; Porat, N.; Duller, G.; Armitage, S.J.; Roberts, H.M.; Clarke, B.M.; Kota, M.W.; Schoeman, P. Evidence for dune reactivation from GPR profiles on the Maputuland coastal plain South Africa. In Ground Penetrating Radar in Sediments; Bristow, C.S., Jol, H.M., Eds.; Geological Society of London, Special Publication: London, UK, 2003; Volume 211, p. 2946. [Google Scholar]
- Bristow, C.S. Ground Penetrating Radar in Aeolian Dune Sands In Ground Penetrating Radar: Theory and Applications; Jol, H.M., Ed.; Elsevier: Amsterdam, The Netherlands, 2009; pp. 273–297. [Google Scholar]
- Jol, H.M.; Smith, D.G.; Meyers, R.A. Digital ground penetrating radar (GPR): An improved and very effective geophysical tool for studying modern coastal barriers (examples for the Atlantic, Gulf and Pacific coasts, USA). J. Coast. Res. 1996, 12, 960–968. [Google Scholar]
- Schenk, C.J.; Gautier, D.L.; Olhoeft, G.R.; Lucius, J.E. Internal structure of an eolian dune using ground-penetrating radar. In Eolian Sediments: Ancient and Modern, International Association of Sedimentologists; Pye, K., Lancaster, N., Eds.; Special Publication: London, UK, 1993; Volume 16, pp. 61–69. [Google Scholar]
- Neal, A.; Roberts, C.L. Applications of ground-penetrating radar (GPR) to sedimentological and geomorphological archaeological studies in coastal environments. In Coastal and Estuarine Environments: Sedimentology, Geomorphology and Geoarchaeology; Pye, K., Allen, J.R.L., Eds.; Geological Society of London, Special Publication: London, UK, 2000; Volume 175, pp. 139–171. [Google Scholar]
- Grasmueck, M.; Weger, R. 3D GPR reveals complex internal structure of Pleistocene oolitic sandbar. Lead. Edge 2002, 21, 634–639. [Google Scholar] [CrossRef]
- van Dam, R.L.; Nichol, S.L.; Augustinus, P.C.; Parnell, K.E.; Hosking, P.L.; McLean, R.F. GPR stratigraphy of a large active dune on Parengarenga Sandspit, New Zealand. Lead. Edge 2003, 22, 865–870. [Google Scholar] [CrossRef]
- Havholm, K.G.; Ames, D.V.; Whittecar, G.R.; Wenell, B.A.; Riggs, S.R.; Jol, H.M.; Berger, G.W.; Holmes, M.A. Stratigraphy of back-barrier coastal dunes northern North Carolina southern Virginia. J. Coast. Res. 2004, 20, 980–999. [Google Scholar] [CrossRef]
- Harris, J.G.; Mylroie, J.E.; Carew, J.L. Banana holes: Unique karst features of the Bahamas. Carbonates Evaporites 1995, 10, 215–224. [Google Scholar] [CrossRef]
- Mylroie, J.E. Late Quaternary sea-level position: Evidence from Bahamian carbonate deposition and dissolution cycles. Quat. Int. 2008, 183, 61–75. [Google Scholar] [CrossRef]
- Lundberg, J.; Taggart, B.E. Dissolution pipes in northern Puerto Rico: An exhumed paleokarst. Carbonates Evaporites 1995, 10, 171–183. [Google Scholar] [CrossRef]
- Stott, P. Ground-penetrating radar: A technique for investigating the burrow structure of fossorial vertebrates. Wildl. Res. 1996, 22, 519–530. [Google Scholar] [CrossRef]
- Sherrod, L.W.; Sauck, E.; Simpson, D.D., Jr.; Werkema, J. Swiontek. Case histories of GPR for animal burrow mapping and geometry. J. Environ. Eng. Geophys. 2019, 24, 1–17. [Google Scholar] [CrossRef]
- Kinlaw, A.E. M Grasmueck. Evidence for and geomorphologic consequences of a reptilian ecosystem engineer: The burrowing cascade initiated by the gopher tortoise. Geomorphology 2012, 157, 108–121. [Google Scholar] [CrossRef]
- Chlaib, H.K.; Mahdi, H.; Al-Shukri, H.; Su, M.M.; Catakli, A.; Abd, N. Using ground penetrating radar in levee assessment to detect small-scale animal burrows. J. Appl. Geophys. 2014, 103, 121–131. [Google Scholar] [CrossRef]
- Hearty, P.J.; Olson, S.L. Preservation of trace fossils and molds of terrestrial biota by intense storms in mid–last interglacial (MIS 5c) dunes on Bermuda, with a model for development of hydrological conduits. Palaios 2011, 26, 394–405. [Google Scholar] [CrossRef]
- Hearty, P.J.; Olson, S.L.; Kaufman, D.S.; Edwards, R.L.; Cheng, H. Stratigraphy and geochronology of pitfall accumulations in caves and fissures, Bermuda. Quat. Sci. Rev. 2004, 23, 1151–1171. [Google Scholar] [CrossRef]
- Martin, A.J. Trace Fossils of San Salvador; Gerace Research Centre: San Salvador, Bahamas, 2006; 80p. [Google Scholar]
- Bishop, G.A.; Pirkle, F.L.; Meyer, B.K.; Pirkle, W.A.; The Foundation for Sea Turtle Geoarchaeology and Zooarchaeology: Morphology of Recent and Ancient Sea Turtle Nests, St. Catherines Island, Georgia, and Cretaceous Fox Hills Sandstone, Elbert County, Colorado. 2011. Available online: https://www.researchgate.net/publication/286002271_The_foundation_for_sea_turtle_geoarchaeology_and_zooarchaeology_Morphology_of_recent_and_ancient_sea_turtle_nests_St_Catherines_Island_Georgia_and_cretaceous_fox_hills_sandstone_Elbert_county_Colorado (accessed on 1 April 2025).
- Buynevich, I.V.; Savarese, M.; Curran, H.A.; Gnivecki, P.L.; Berman, M.J. Coastal morphological and geoarchaeological implications of prehistoric sea turtle nesting in the Bahamian Archipelago. In Joint Symposium on the Natural History and Geology of the Bahamas, 1st ed.; Gerace Research Centre: San Salvador, Bahamas, 2015; pp. 8–9. [Google Scholar]
- Boyajian, G.E.; Thayer, C.W. Clam calamity; a recent supratidal storm-deposit as an analog for fossil shell beds. Palaios 1995, 10, 484–489. [Google Scholar] [CrossRef]
- Roberts, E.M.; Tapanila, L.; Mijal, B. Taphonomy sedimentology of storm-generated continental shell beds: Acase example from the Cretaceous Western Interior Basin. J. Geol. 2008, 116, 462–479. [Google Scholar] [CrossRef]
- Buynevich, I.V.; Savarese, M.; Curran, H.A.; Ingalsbe, T.A. Storm-generated molluscan thanatocoenosis along a carbonate paleoshoreline: Southern Eleuthera Island, The Bahamas. Current Challenges of Science and Education. In Proceedings of the 10th International Scientific and Practical Conference, Berlin, Germany, 3–25 June 2024; pp. 243–248. [Google Scholar]
- Stone, J.W.; Orford, J.D. Storms and their significance in coastal morpho-sedimentary dynamics. Mar. Geology 2004, 210, 1–5. [Google Scholar] [CrossRef]
- Mann, M.E.; Woodruff, J.D.; Donnelly, J.P.; Zhang, Z. Atlantic hurricanes and climate over the past 1500 years. Nature 2009, 460, 880–885. [Google Scholar] [CrossRef] [PubMed]
- Nott, J. A theory (involving tropical cyclones) on the formation of coarse-grained sand beach ridges in NE Australia. Geol. Soc. Lond. Spec. Publ. 2010, 346, 7–22. [Google Scholar] [CrossRef]
- Park, L.E. Comparing two long-term hurricane frequency intensity records from San Salvador Island Bahamas. J. Coast. Res. 2012, 28, 891–902. [Google Scholar]
- Wallace, E.J.; Donnelly, J.P.; van Hengstum, P.J.; Wiman, C.R.; Sullivan, M.; Winkler, T.S.; d’Entremont, N.E.; Toomey, M.; Albury, N. Intense hurricane activity over the past 1500 years at south Andros Island, the Bahamas. Paleoceanogr. Paleoclimatol. 2019, 34, 1761–1783. [Google Scholar] [CrossRef]
- Schmitt, D.; Gischler, E.; Melles, M.; Wennrich, V.; Behling, H.; Shumilovskikh, L.; Anselmetti, F.S.; Vogel, H.; Peckmann, J.; Birgel, D. An annually resolved 5700-year storm archive reveals drivers of Caribbean cyclone frequency. Sci. Adv. 2025, 11, eads5624. [Google Scholar] [CrossRef] [PubMed]


Disclaimer/Publisher’s Note: The statements, opinions and data contained in all publications are solely those of the individual author(s) and contributor(s) and not of MDPI and/or the editor(s). MDPI and/or the editor(s) disclaim responsibility for any injury to people or property resulting from any ideas, methods, instructions or products referred to in the content. |
© 2025 by the authors. Licensee MDPI, Basel, Switzerland. This article is an open access article distributed under the terms and conditions of the Creative Commons Attribution (CC BY) license (https://creativecommons.org/licenses/by/4.0/).