Abstract
Substrate classification based on remote sensing images can provide fundamental data for offshore engineering construction and coastal ecological protection without in situ data. To address the inadequate consideration of features in existing substrate classification methods and to mitigate the low classification accuracy caused by noise in single-temporal images, this paper improves the existing remote sensing classification methods and proposes a shallow-water substrate classification method based on the fusion of multitemporal remote sensing images using a random forest model. The proposed method proposes and applies adaptive weighted fusion to bathymetric inversion results from single-temporal images for optimal water depth and terrain features. It derives and constructs a depth-independent bottom reflectance equation, uses median fusion to generate optimal images for accurate bottom reflectance and spectral features, then feeds selected features into the random forest model for training to produce final classification results. Three different types of shallow-water areas were selected for the experiments. The results show that the proposed method effectively leverages multiple features and capitalizes on multitemporal advantages to circumvent the limitations of single-temporal classification, the classification accuracy reaches over 90.34% on different substrates, the maximum misclassification rate is below 8.13% and the number of misclassified pixels is significantly less than that of single-temporal images. Compared with the four mainstream classification algorithms, the proposed method not only achieves overall accuracy (OA) and F1-score exceeding 0.94 and a kappa coefficient greater than 0.90, but demonstrates excellent detail preservation capability and strong adaptability to complex shallow-water environments, and delivers stable classification results.
1. Introduction
Shallow-water substrate detection is a critical component of marine surveying and mapping [1,2,3]. Accurate substrate information serves as a foundation for offshore engineering, coastal ecological protection, and marine resource development [4,5]. Traditional substrate acquisition methods, such as gravity coring and grab sampling, are highly invasive, operationally inefficient, and costly [6,7,8]. Furthermore, the sparsity of their sampling points limits their capacity for large-scale, simultaneous detection, resulting in them being unable to meet the requirements of modern marine research and development. In contrast, the inversion of shallow-water substrate information based on remote sensing images offers significant advantages, including multitemporal observation capability, broad spatial coverage, and low measurement cost. It also facilitates data acquisition in disputed, hazardous, or remote islands and reefs, which are often difficult to access [9,10,11]. With the development of high-resolution multispectral satellite sensors, satellite inversion of shallow-water substrate information has been widely applied and has become a key method for substrate detection in shallow marine environments [12,13].
In existing studies, researchers typically acquire in situ substrate data using acoustic technologies, correlate these data with remote sensing images to extract relevant features, and construct classification models to improve substrate classification accuracy. For instance, Montereal et al. [14] utilized depth and backscatter data measured by a multibeam echosounder (MBES) as in situ samples and combined these data with optical images to map the distribution of natural hard substrates in the study area. Menandro et al. [15] integrated backscatter data with underwater photographs to characterize and map rhodolith beds in the Costa das Algas Marine Protected Area (Brazil). Wan et al. [16] paired water depth data from MBES with high-resolution images for substrate classification, thereby increasing the reliability of the classification results. Ji et al. [17] proposed an RF-SAPSO-LightGBM model using remote sensing images and MBES-derived water depth data, achieving wider coverage and greater accuracy. Evagoras et al. [18] combined single-beam bathymetric data, side-scan sonar data, and remote sensing images to achieve seabed substrate classification and mapping. However, acquiring in situ acoustic data remains costly and poses potential hazards [19], limiting the applicability of such methods for large-scale substrate monitoring in remote marine regions.
To overcome the limitations of acquiring acoustic data, researchers have explored the use of manual visual interpretation to directly select a limited number of representative regions from remote sensing images as substrate samples and to construct corresponding classification models. For instance, Traganos et al. [20] visually interpreted shallow-water seagrass distribution and generated global-scale seagrass distribution maps using the Google Earth Engine on the basis of the characteristics of these regions. Topouzelis et al. [21] leveraged 50 Landsat-8 satellite images and an object-based image analysis approach to map seagrass distribution within Greek territorial waters. Pragunanti et al. [22] extracted spectral and derived features from remote sensing images, integrated these features into a classification model, and used the model to evaluate substrate classification accuracy in the waters surrounding Pajenekang Island, South Sulawesi. Setiawan et al. [23] applied visual interpretation results to SPOT-7 satellite images and compared two classification algorithms to determine the distribution of four substrate types. Liu et al. [24] integrated bathymetric inversion results with spectral features from remote sensing images and demonstrated that incorporating water depth information significantly improved the accuracy of coral reef classification. While these studies eliminate the reliance on in situ acoustic data, their classification frameworks are limited by an overreliance on spectral features alone from remote sensing images. Insufficient consideration of feature selection and inadequate integration of additional feature dimensions often lead to reduced accuracy in the final classification results. In substrate classification, seabed bottom reflectance can mitigate interferences such as water column attenuation and light variability, directly reflect substrate properties, and enable accurate differentiation of substrate types [25]. Furthermore, seabed terrain plays a decisive role in shaping substrate types and their spatial distribution, providing critical spatial constraints for classification. However, current research rarely integrates substrate reflectance and terrain features as core inputs into machine learning-based classification models, nor does it fully explore their potential to increase classification accuracy. As a result, the substrate classification results remain suboptimal. Additionally, most existing studies depend on single-temporal remote sensing images for substrate classification. Image noise frequently results in inaccurate extraction of spectral and terrain features. Moreover, the one-sided nature of single-temporal images fails to provide a sufficient classification basis for the model. These factors compromise the stability of single-temporal classification approaches in complex marine environments and reduce overall classification accuracy [26,27].
To effectively integrate bottom reflectance and terrain features into the training model in the absence of in situ data, and to address the low accuracy of single-temporal image classification, this paper proposes a shallow-water substrate classification method based on the fusion of multitemporal remote sensing images using a random forest model. The proposed method can adopt adaptive weighted fusion to combine single-temporal water depth inversion results, generating optimal water depth data for seabed terrain feature extraction. Median fusion is used to produce an optimal image, from which reliable seabed bottom reflectance and spectral features are derived. These optimized features are fed into a random forest model for training, yielding stable, high-accuracy substrate classification results. The main contributions of this study can be summarized as follows:
- (1)
- A shallow-water substrate classification method based on the fusion of multitemporal remote sensing images using a random forest model is proposed.
- (2)
- Reliable features are derived by applying adaptive weighted fusion to water depth inversion results and median fusion to remote sensing images, which are then used to train a random forest model for substrate classification. Across different study areas, the classification accuracy reaches over 90.34% on different substrates, the overall accuracy (OA) and F1-score both exceed 0.94, with the Kappa coefficient greater than 0.90, achieving high-precision substrate classification.
- (3)
- The method addresses the insufficient consideration of features in remote sensing image substrate classification methods, resolves the low accuracy of single-temporal classification, and can be applied to diverse complex marine environments without in situ data, thereby achieving high-precision substrate classification.
The remainder of this paper is organized as follows. Section 2 describes the study areas and the data selected for this study. Section 3 provides a detailed introduction to the fundamental principles of the proposed method. Section 4 discusses the results and the accuracy of the proposed method in the selected study areas. The conclusions are presented in Section 5.
2. Study Areas and Data
2.1. Study Areas
The study areas of this paper include the shallow-water east of Key Biscayne, FL, USA, and Dongdao Island and Robert Island in the South China Sea. These sites include both coastal waters and offshore islands and reefs. The three areas differ in topography and substrate distribution, while their substrate types and water depths remain relatively stable in the short term. These characteristics enable the study areas to be used to effectively validate the broad applicability of the proposed method.
Key Biscayne (Figure 1a) is located in the southeastern part of Miami, Florida, USA. The substrate types in the shallow water area on the eastern side of the island are primarily coral reefs and seagrass beds. Dongdao Island (Figure 1b) is situated in the eastern part of the Xuande Atoll. The island has an elongated shape, with alternating distributions of different substrates. Robert Island (Figure 1c) is located in the western part of the Yongle Atoll in the South China Sea. This elliptical island is a typical sandy island formed by coral reefs [28] and is surrounded by sand embankments and coral reef structures.
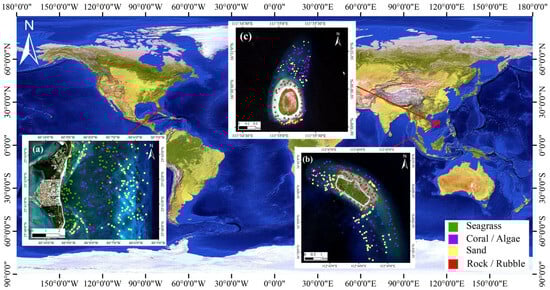
Figure 1.
Geographical location maps of the study areas. (a) Key Biscayne, (b) Dongdao Island, and (c) Robert Island.
2.2. Data
2.2.1. Sentinel-2 Data
The Sentinel-2 mission comprises Sentinel-2A and Sentinel-2B [29]. The image data can be obtained from the European Space Agency (ESA) Copernicus Data Centre (https://browser.dataspace.copernicus.eu/, accessed on 10 July 2025). Owing to the strong penetrating power of the blue and green bands within the water column, and the significant absorptivity of the near-infrared (NIR) band in the same medium, the blue (Band 2), green (Band 3), red (Band 4), and near-infrared (NIR, Band 8) bands were selected from Sentinel-2 image data, with a spatial resolution of 10 m. In Google Earth Engine (GEE), the proposed method sorts images of the same season of the study area by cloud cover, then comprehensively assesses image noise and spectral information richness to select the highest-quality images. Based on cloud cover sorting results, multitemporal images with high imaging quality and time close to the best image are selected. The specific interval depends on the availability of image data within a certain time period [30]. However, it is important to ensure that the image acquisition time belongs to the same season to reduce inversion errors caused by seasonal differences in external environment and the optical properties of the water. The images selected through this process are presented in Table 1. These single-phase images avoid the season when seagrass grows vigorously, effectively mitigating interference of changes in water optical properties caused by seagrass on sediment classification. They exhibit characteristics of high quality, rich spectral information, and low random noise. The best image for Key Biscayne is that acquired on 30 January 2022; for Dongdao Island, it is the 3 February 2024 image; and for Robert Island, it is the 4 March 2024 image. The sun zenith angle is within an optimal range, which ensures the effective penetration of light into water column and minimizes the interference of sun glint. Additionally, the small variation in viewing zenith angle guarantees consistency in the spectral response characteristics across all images.

Table 1.
Parameter information for the remote sensing images in the study areas.
2.2.2. Substrate Data
The substrate data for this study are sourced from the Allen Coral Atlas (https://allencoralatlas.org/, accessed on 12 July 2025) and supplemented through visual interpretation. This dataset is utilized for model training and accuracy assessment. The Allen Coral Atlas, supported by Arizona State University, maps global coral reefs and provides fundamental data for coastal ecosystem monitoring [31]. However, the dataset’s limited sample size and incomplete coverage of the study areas make it insufficient for robust application in machine learning algorithms. To address this limitation, this study expands the sample distribution range through visual interpretation and conducts neighborhood expansion on the 3 × 3 pixels adjacent to each sample point, leveraging the spatial clustering characteristics of seabed substrate. The distribution of the expanded data is presented in Figure 1. Key Biscayne, Dongdao Island, and Robert Island contain 2979, 1905, and 1331 samples, respectively, with sample sizes approximately evenly distributed across the different substrate types.
3. Methodology
A flowchart of the shallow-water substrate classification method based on the fusion of multitemporal remote sensing images using random forest model is shown in Figure 2. The processing of the proposed method includes the following main steps: Multitemporal images are preprocessed to eliminate data interference and unify the data format to obtain accurate remote sensing reflectance. The physics-based dual-band log-linear analytical model (P-DLA) is employed to retrieve water depth from multitemporal images, and the proportion of the reciprocal of the difference between the water depth at the homologous point and its average value to the sum of the reciprocal of all differences is calculated. This proportion is used as the fusion weight of the homologous point, and the optimal water depth is obtained through adaptive weighted fusion. Median fusion is applied to multitemporal remote sensing images to generate the optimal image. Compared to the red and near-infrared bands, the blue and green bands exhibit superior water penetration capabilities, enabling them to reach the seabed and carry bottom reflectance information back to the sensor [25]. Consequently, a depth-independent bottom reflectance equation is derived based on the radiative transfer model of water in the blue and green bands. The bottom reflectance characteristics of the blue and green bands are then calculated using the optimal image obtained after median fusion. Terrain features and spectral features are calculated using the optimal water depth from adaptive weighted fusion and the optimal image from median fusion. A feature vector corresponding to multi-dimensional features and substrate is constructed, and the screened key features are input into the random forest model for training to generate substrate classification results.
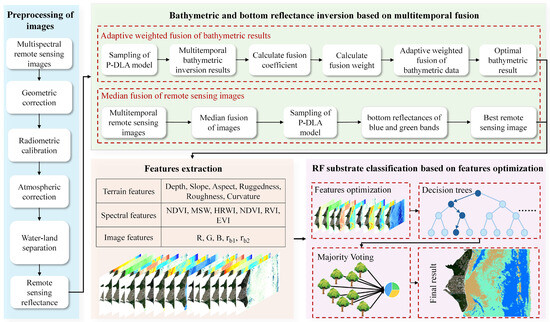
Figure 2.
Flowchart of the shallow-water substrate classification method based on the fusion of multitemporal remote sensing images using a random forest model.
3.1. Preprocessing of Remote Sensing Images
Bathymetric inversion, bottom reflectance extraction, and feature calculation depend on accurate remote sensing reflectance. To ensure reflectance accuracy, preprocessing multitemporal remote sensing images prior to the experiment is essential. First, geometric correction is applied to each remote sensing image to eliminate geometric distortion and maintain consistency for multitemporal fusion. Next, radiometric calibration is conducted to convert the digital number (DN) values into apparent radiance values. The ACOLITE (Atmospheric Correction for OLI Lite) model is subsequently used for atmospheric correction to remove the effects of atmospheric scattering and aerosols. Sun glint correction has limited effectiveness for images with spatial resolution of less than 10 m. Sun glint can be mitigated by using subsurface reflectance and multitemporal fusion [32]. Therefore, the sun glint correction is omitted. In addition, water and land are distinguished by calculating the normalized difference water index (NDWI), whose calculation formula is shown in Equation (1) [32]. With a threshold of 0, water is retained, and land is separated. NDWI can also differentiate between shallow and deep-water areas, where regions with an NDWI greater than 0.05 are generally considered suitable for shallow-water bathymetric inversion.
where and represent the reflectances of the green and near-infrared bands, respectively.
3.2. Water Depth and Bottom Reflectance Inversion Based on Multitemporal Fusion
The P-DLA model is a novel method proposed by Chen et al. in 2019 for inverting water depth from multispectral images without the need for in situ data [33]. The basic principle of this method lies in identifying substrates from multispectral images, extracting feature pixels with distinct substrate characteristics, and inverting water depth using the remote sensing reflectance information of these feature pixels [25,33]. The P-DLA model serves as the foundational model for water depth inversion in the method proposed in this study. The principle of the bathymetric inversion model is presented in Equation (2) [25]. The red and near-infrared bands undergo rapid attenuation in water and are nearly completely absorbed, rendering them unable to penetrate to the seabed. Consequently, bottom reflectance information from these bands is extremely weak or even absent, making them unsuitable for bottom reflectance retrieval. In contrast, the blue and green bands exhibit significantly lower attenuation coefficients in water compared to the red and near-infrared bands, coupled with strong penetration capabilities [25]. These bands can effectively reach the seabed, reflect off the substrate, and transmit bottom reflectance information back to the sensor. Therefore, the proposed method introduces blue and green bands to construct water radiative transfer models separately. To eliminate the influence of water depth on the extraction of bottom reflectance, the formula for the radiative transfer model of water in the blue and green bands is eliminated to construct a depth independent bottom reflectance equation. After eliminating the water depth, the calculation formula for the water radiative transfer model is simplified as shown in Equation (3). In the formula, , by replacing and with , the bottom reflectance equations for the blue and green bands can be obtained. The methods for calculating the bottom reflectance for the blue and green bands are provided in Equations (4) and (5), respectively.
where represents the water depth; and represent the bottom reflectances of the blue and green bands, respectively; and represent the subsurface reflectances of the blue and green bands in deep-water areas, respectively; ; ; and are the optimal band rotation unit vectors for the blue and green bands, respectively; , represents the substrate parameters; represents the ratio of the attenuation coefficients for the blue and green bands, in which represents the sum of the diffuse attenuation coefficients of the green band.
Image noise, such as cloud cover and atmospheric interference, can distort the spectral information of single-temporal images, resulting in inaccurate and incomplete inversions of water depth and bottom reflectance. Multitemporal fusion enables noise suppression and signal enhancement, thereby minimizing systematic errors and environmental disturbances and improving inversion accuracy. The optimal water depth is derived through adaptive weighted fusion of single-temporal bathymetric inversion results. The median fusion of multitemporal remote sensing images eliminates noise and facilitates reliable bottom reflectance retrieval. For the inversion of water depth and bottom reflectance under multitemporal fusion, two key steps are involved: adaptive weighted fusion of multitemporal bathymetric inversion data, and bottom reflectance extraction from the median fusion of multitemporal remote sensing images. The schematic workflow of the bathymetric and bottom reflectance inversion based on multitemporal fusion is shown in Figure 3.
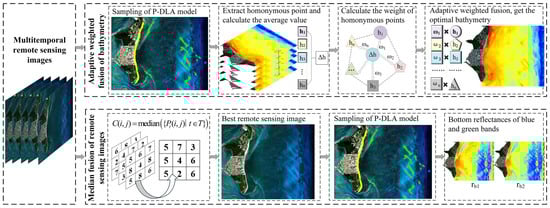
Figure 3.
Schematic diagram of bathymetric and bottom reflectances inversion based on multitemporal fusion.
Water depth is fundamental terrain data for substrate classification, and its accuracy influences the extraction of other terrain features. In order to obtain accurate and reliable water depth inversion results, we propose an adaptive weighted fusion method for multitemporal inversion results in this paper. The adaptive weighted fusion can adaptively calculate fusion weights of different phases according to the reliability of each homonymous point’s bathymetric value relative to the average depth. These points are then weighted and fused to produce the final bathymetric inversion results. Compared with traditional median fusion and average fusion methods, this method can dynamically adjust the fusion weights in complex environments and capture bathymetric features more completely, thus generating the fusion results with significantly improved accuracy and robustness.
In accordance with the principles of the P-DLA model [33] and sampling theory [34], feature pixels are extracted from preprocessed multitemporal remote sensing images, and the corresponding model parameters are computed. These model parameters are then substituted into Equation (2) to invert the instantaneous water depth information of each image. Tidal correction is subsequently applied to adjust the instantaneous water depth of each temporal phase to the steady-state water depth relative to a unified datum, thereby ensuring the consistency of the water depth data [35,36]. After this adjustment, adaptive weighted fusion is conducted on the basis of the steady-state water depths across multiple temporal phases. Specifically, the geographic coordinates of pixels in multitemporal remote sensing images are used to match the nearest homonymous points (i.e., pixels corresponding to the same geographic location). For each group of homonymous points, the water depth values across different temporal phases are extracted, after which their average values are calculated. The deviation of each individual depth value from this average value is subsequently computed. The weight of each homonymous point at a given temporal phase is determined by the ratio of its deviation to the total deviation of the group, as defined in Equation (6). These steps are repeated on a pixel-by-pixel basis to adaptively determine the fusion weights of data from different temporal phases. Finally, adaptive weighted fusion results are generated according to Equation (7), which are output as the final water depth inversion results.
where is the water depth of each homonymous point in the results for different phases, n is the number of multitemporal images, is the weight of the homonymous point in the result for each phase, and is the optimal water depth obtained by adaptive weighted fusion of each homonymous point.
Accurate estimation of bottom reflectance and spectral features relies on reliable remote sensing reflectance. However, applying adaptive weighted fusion with the average value as the fusion coefficient to remote sensing images can introduce significant noise. The median fusion of multitemporal images is a widely used method for suppressing noise and acquiring stable remote sensing reflectance. To mitigate random errors induced by noise in single-temporal images, incorporate valid temporal information, and construct an anti-interference image, the proposed method employs a median fusion strategy for multitemporal remote sensing data. This approach ensures the accuracy of the remote sensing reflectance and enhances the separability of the substrate information, as shown in Equation (6). Subsequently, feature pixels are extracted from the median-fused image for the calculation of model parameters. The expressions for the bottom reflectances of the green and blue bands are given in Equations (7) and (8), respectively. With the parameters derived from the median-fused image substituted into these equations, accurate bottom reflectance values for the blue and green bands can be directly obtained without auxiliary data such as water depth or water optical properties.
where is the pixel value of the fused image at position , is the pixel value of the original image obtained at time t in the time series at position , and is the set of all time points used for fusion.
3.3. Feature Extraction
The seabed terrain features determine the type and spatial distribution of substrates, providing key spatial constraints for substrate classification. Moreover, shallow-water bathymetry clearly depicts the surface morphology of different substrates, providing robust support for substrate identification. Independent of the in situ data, the water depth inversion results derived from adaptive weighted fusion are used as the basic terrain data for the study area to calculate the terrain attributes including slope, aspect, ruggedness, roughness, and curvature. These features can effectively reflect the structure and morphology of the seabed terrain, and the calculation formulas and functions are presented in Table 2.
Table 2.
Calculation formulas and functions of the terrain features. (window size: 3 × 3).
Spectral features serve as key identification indicators for distinguishing substrate types. Since different substrates exhibit distinct spectral responses, spectral features transform these imperceptible physical differences into quantifiable classification criteria. The spectral signals of remote sensing images are influenced primarily by water bodies and substrates; thus, the proposed method calculates the water indices and vegetation indices separately. All indices are derived from median-fused remote sensing data. The water indices include the normalized difference water index (NDWI), modified surface water index (MSWI), and high-resolution water index (HRWI). The vegetation indices include the normalized difference vegetation index (NDVI), ratio vegetation index (RVI), and enhanced vegetation index (EVI). The equations and functions for each spectral feature are presented in Table 3.
Table 3.
Calculation formulas and functions of spectral features.
Variations in the radiance response across multispectral image channels at different pixels provide an intuitive representation of substrate differentiation. Since near-infrared (NIR) bands are strongly absorbed by water and fail to reach the seabed, in this study, the red (R), green (G), and blue (B) bands of the median-fused image are employed as fundamental features. Bottom reflectance serves as an intuitive indicator of substrate properties and plays an irreplaceable role in substrate classification. Owing to their strong water penetration capability, the blue and green bands can reach the seabed and capture the reflectance characteristics of different substrates. Therefore, the bottom reflectances of the blue and green bands ( and ) derived from the median-fused image are adopted as important features.
3.4. RF Substrate Classification Based on Feature Optimization
The proposed method integrates three-band features (R, G, B), bottom reflectance features, terrain attributes, and spectral features from remote sensing images, resulting in a total of 17 feature dimensions. These features are organized into a layered structure, and feature data at matching coordinates across each layer are extracted to form a feature vector. However, an excessive number of features may increase computational complexity and introduce noise during seabed substrate classification, thereby degrading model performance. To address these issues, key features are selected from the 17 initial dimensions and low-contribution features are removed by leveraging the feature importance ranking of the random forest (RF) model, and this process is completed before the construction of the RF classification model for the study area.
Feature selection in the RF model is based on feature importance scores. In classification tasks, the Gini coefficient is employed to evaluate the contribution of features to reducing node impurity during decision tree splitting. When a given feature is involved in node splitting, the difference in Gini impurity between parent and child nodes (before and after splitting) is computed, which represents the impurity reduction for that split. The total impurity reduction contributed by a feature across all the splits within a decision tree defines its importance in that tree. Since a random forest comprises multiple independently trained decision trees, it is necessary to normalize the feature importance scores of each tree and then to compute the average across all the trees to ultimately derive the global feature importance. This process mitigates the bias introduced by the randomness of individual trees, yielding more robust and stable evaluations. Finally, the features are ranked in descending order of their average importance, and key features are selected accordingly.
In substrate classification tasks, features may contain noise and exhibit dimensional variability. The random forest algorithm, with its inherent randomness and voting mechanism, delivers an efficient and stable classification performance [37,38]. The algorithmic workflow is illustrated in Figure 4. As a typical ensemble algorithm based on the bootstrap aggregating (bagging) framework, the random forest algorithm performs bootstrap sampling with replacement from the original training set to draw distinct sample sets for each decision tree, thereby achieving sample randomness. For each split node during the construction of individual decision trees, a random subset of features is selected. This prevents certain features from dominating the structure of all the trees, thereby achieving feature randomness. This dual randomness strengthens the robustness of the model against noise, outliers, and other uncertainties. Each decision tree is constructed via the CART algorithm on the basis of its respective sample data and selected features, and a predicted category is output. The random forest algorithm relies on a majority voting mechanism, which aggregates the predicted categories from all individual decision trees. The category that receives the majority of the votes is determined as the final classification result of the random forest, as expressed in Equation (9). This ensemble mechanism compensates for the limitations of individual decision trees and significantly mitigates overfitting [39]. Consequently, the random forest algorithm delivers high accuracy and stability in substrate classification, particularly when feature distributions are imbalanced or class boundaries are ambiguous.
where is the final prediction result, is the feature function, is an individual decision tree, is the output variable, is the class that maximizes the subsequent expression within the class set , and is the total number of trees.
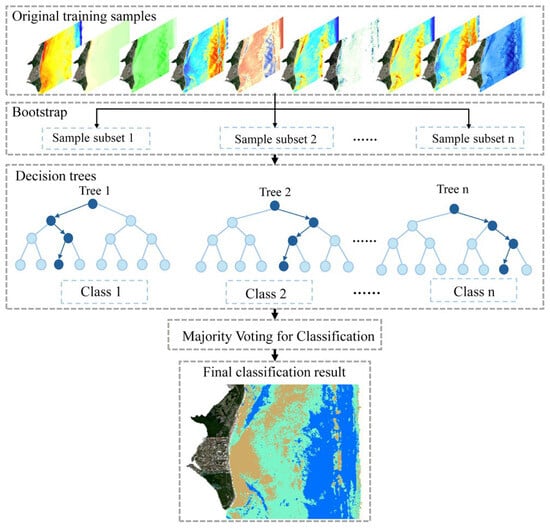
Figure 4.
Schematic diagram of the random forest model.
3.5. Evaluation Indices
To compare the substrate classification accuracy between single-temporal and multitemporal fusion scenarios, the overall accuracy (OA), precision, recall, F1 score, and kappa coefficient are used as the accuracy evaluation indices. These indices quantify the performance of classification models from distinct dimensions. Generally, the higher the values of OA, precision, recall, and F1-score are, the better the substrate classification performance. The kappa coefficient is primarily used to assess the consistency of classification results. The calculation methods are as follows:
where denotes the number of true positive samples (i.e., samples that are predicted as positive by the model and that are actually positive), is the number of true negative samples (samples that are predicted as negative and that are actually negative), represents the number of false-positive samples (samples that are predicted as positive but that are actually negative), represents the number of false-negative samples (samples that are predicted as negative but that are actually positive), refers to the total number of samples, and is the expected agreement rate.
4. Results
In this study, the classification performance of the proposed method was evaluated using three sets of multitemporal images for each of the three study areas: Key Biscayne, Dongdao Island and Robert Island. For each study area, a 17-dimensional feature matrix was constructed, followed by feature selection to identify the most relevant features. The 17 features mainly include: terrain features (depth, slope, aspect, ruggedness, roughness, and curvature) that provide spatial constraints for substrate classification, spectral features that can convert spectral response into quantifiable standards (NDWI, HRWI, MSWI, NDVI, RVI, EVI), R, G, and B bands that intuitively represent changes in radiation response, the bottom reflectances of the blue and green bands ( and ) that directly reflect substrate properties. The 17 features are all effective substrate classification-related features obtainable in this study. They serve as the original feature set, which prevents the omission of key features and provides sufficient candidate space for feature selection. However, an excessive number of features may include redundant information, increase computational complexity, and introduce noise, leading to degraded model performance. Therefore, we rank the importance of the features to identify important features, maximizing the utilization of effective features while ensuring model efficiency. The feature importance rankings for each study area are shown in Figure 5. As illustrated in Figure 5, the classification accuracy stabilized or even decreased when more than 10 features were included. Accordingly, to ensure both accuracy and efficiency, 10 key features were retained for each study area. The primary substrate types and their corresponding key features are summarized in Table 4. After the correspondence between the optimal feature matrix and substrate category labels was established, 70% of the sample data were used for training, and the remaining 30% were used for validation. Cross-validation determined the optimal number of decision trees to be 50, with the “random_state” parameter fixed at 42. Following the proposed method, shallow water substrate classification results based on multitemporal remote sensing image fusion using the random forest algorithm were generated for each study area. These results were then compared with single-temporal classification outcomes and multitemporal fusion results obtained from other training models.
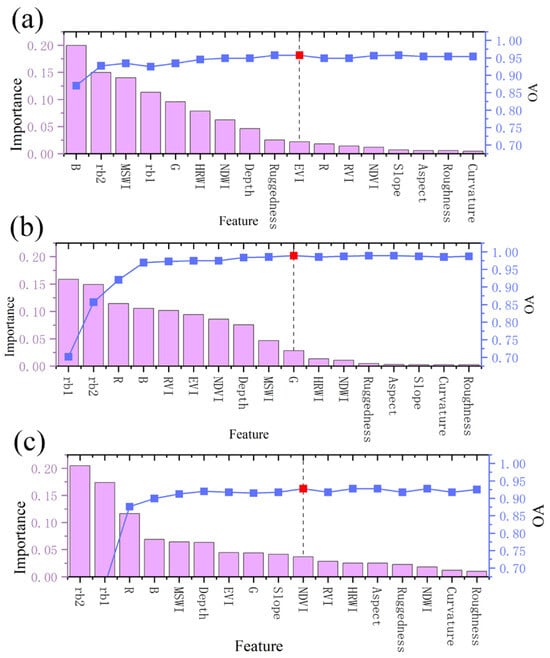
Figure 5.
Ranking results of feature importance in the study areas, (a) Key Biscayne, (b) Dongdao Island, and (c) Robert Island. The red squares and dot lines are the critical lines for feature selection, used to distinguish important features from secondary features.
Table 4.
The main substrate types and key features of each research area.
4.1. Substrate Classification Results for Key Biscayne
4.1.1. Qualitative Evaluation
The noise of single-temporal images can compromise the extraction of spectral information and water depth, ultimately resulting in low accuracy of feature extraction. In coastal waters such as Biscayne Bay, additional disturbances, including ship-induced interference and temporal variations in the water column, exacerbate this issue. The classification results of single-temporal and multitemporal fusion in Key Biscayne are shown in Figure 6, and the areas with obvious differences are highlighted for clarity. In the central shallow-water area, where water depth is low and topographic variation is minimal, dense seagrass beds and coral reefs overlap because of their similar habitat adaptability. The high chlorophyll levels associated with seagrass beds alter the spectral characteristics of coral reefs, blurring the spectral boundary between the two, and reduce water transparency, thereby interfering with accurate classification. In the eastern deep-water area, light attenuation and topographic changes pose additional challenges for the precise classification of substrates. These factors collectively result in poor single-temporal inversion outcome stability, making it difficult to generate consistent classification results. In contrast, multitemporal fusion effectively mitigates the limitations of single-temporal data. By integrating spectral and bathymetric data across different time periods, multitemporal fusion enables the acquisition of more reliable features and more fully captures the spatiotemporal distribution differences in various substrates.
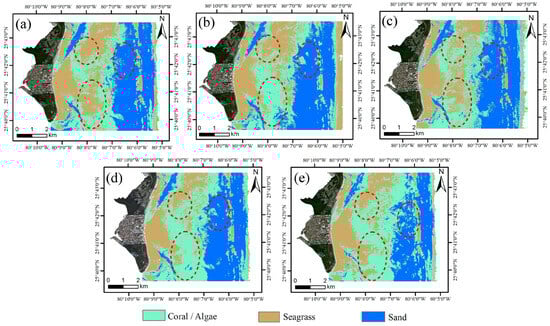
Figure 6.
Substrate classification results for Key Biscayne. (a) 30 January 2022, (b) 14 February 2022, (c) 15 January 2023, (d) multitemporal fusion results, (e) validation data. The red dashed circles represent the area with obvious differences.
4.1.2. Quantitative Evaluation
To further validate the effectiveness of the proposed method, the substrate classification accuracy in Key Biscayne was quantitatively assessed, and the performance of single-temporal and multitemporal fusion approaches were systematically compared. The results are summarized in Table 5. As shown in Table 5, the classification outcomes derived from single-temporal images vary across all accuracy indices because of single-temporal imaging constraints, and they fail to consistently achieve high classification precision. In contrast, the multitemporal fusion results demonstrate superior and more stable performance across all evaluation metrics. This confirms that multitemporal fusion effectively mitigates the one-sided interference of single-temporal environmental factors, captures the intrinsic characteristics of substrates more comprehensively, and produces more reliable feature extraction results. Figure 7 shows the confusion matrix for substrate classification in Key Biscayne. It can be seen from the figure that multitemporal fusion has the greatest improvement in accuracy for Coral/Algae, with Sand maintaining a high correct classification rate and Seagrass significantly reducing the misclassification rate. Compared to single-temporal classification results, the proposed method substantially reduces the number of misclassified samples across all categories. Specifically, the misclassification rate for the Coral/Algae category is only 4.78%, while that for the Seagrass category is merely 0.84%. This reduction in misclassification is reflected in an increased proportion of diagonal elements in the confusion matrix, indicating a decrease in the degree of confusion between distinct categories. Additionally, after multitemporal fusion, the Kappa coefficient reaches 0.9498 and the overall classification accuracy attains 0.9672, demonstrating a significant enhancement in the reliability and consistency of the classification results.
Table 5.
Substrate classification accuracy for Key Biscayne. Results in bold are the best.
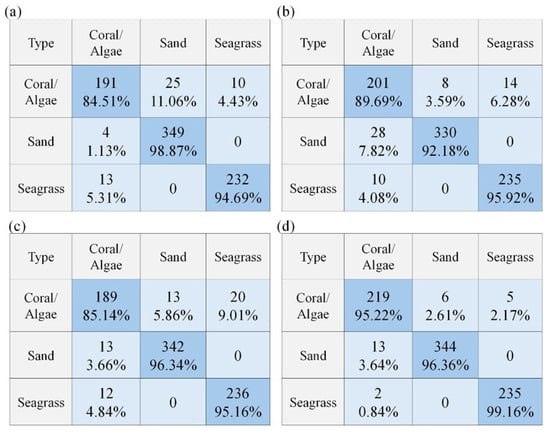
Figure 7.
Confusion matrix for substrate classification in Key Biscayne. (a) 30 January 2022, (b) 14 February 2022, (c) 15 January 2023, (d) multitemporal fusion results.
4.2. Substrate Classification Results for Dongdao Island
4.2.1. Qualitative Evaluation
The classification results of single-temporal and multitemporal fusion for Dongdao Island are shown in Figure 8. The discrepancies between the two approaches are most evident in the sand-coral mixed zones along the southern and eastern reefs of the island. In these regions, the interspersed distribution of sand and coral cause single-temporal images with a resolution of 10 m to struggle to capture fine boundary details. This results in blurred substrate type boundaries, making it difficult to produce reliable substrate classification results. The proposed method addresses these issues by integrating spectral reflectance features from multitemporal images with water depth inversion data, filtering out random noise in single-temporal images and extracting more robust discriminative features. By leveraging the complementarity of multitemporal datasets, the proposed method produces more complete and accurate classification results across substrate types, which validates the effectiveness of the proposed method in overcoming the inherent limitations of single-temporal images.
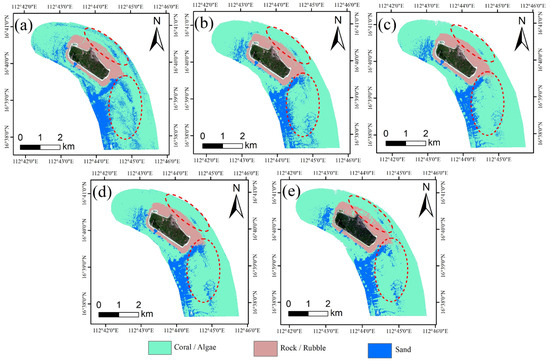
Figure 8.
Substrate classification results for Dongdao Island. (a) 5 November 2023, (b) 3 February 2024, (c) 18 February 2024, (d) multitemporal fusion results, (e) validation data. The red dashed circles represent the area with obvious differences.
4.2.2. Quantitative Evaluation
The quantitative accuracy indices for substrate classification on Dongdao Island are summarized in Table 6. Inaccurate extraction of key features leads to variations in classification performance across temporal phases, which is consistent with the visual differences shown in Figure 8. All the single-temporal results yield relatively low overall accuracy (OA), precision, and kappa values, indicating the lack of stable high-precision outcomes. In contrast, the multitemporal fusion results achieve superior performance across all indices and show the highest consistency with the actual substrate distribution. As shown in Figure 9, the accuracy of substrate classification in Dongdao Island has been improved by multitemporal fusion. The stability of Sand classification has always been high, while the misclassification of Coral/Algae and Seagrass classes has significantly decreased. The proportion of correct classifications continues to increase, and the accuracy and consistency of classification continues to improve. These improvements demonstrate that compared with single-temporal outcomes, multitemporal fusion not only increases substrate classification accuracy but also substantially increases the reliability and stability of the classification results.
Table 6.
Substrate classification accuracy for Dongdao Island. Results in bold are the best.
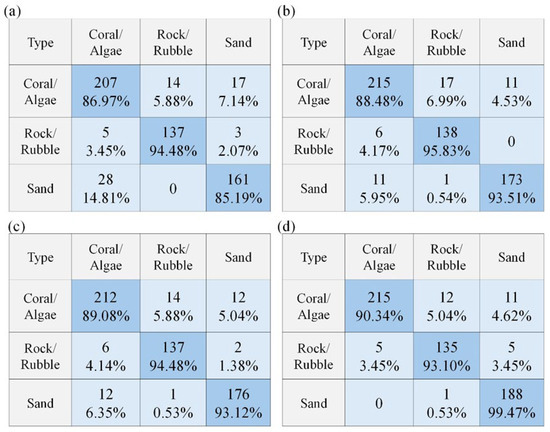
Figure 9.
Confusion matrix for substrate classification in Dongdao Island. (a) 5 November 2023, (b) 3 February 2024, (c) 18 February 2024, (d) multitemporal fusion results.
4.3. Substrate Classification Results for Robert Island
4.3.1. Qualitative Evaluation
The single-temporal and multitemporal fusion classification results for Robert Island are presented in Figure 10. Significant discrepancies in single-temporal classification are observed primarily in the deep-water zones. In the northern deep-water area, the combined effects of light attenuation and substrate mixing obscure fine boundary details. In the southern region, abrupt topographic changes further hinder accurate single-temporal classification. The proposed method addresses these challenges by mitigating the influence of light attenuation in deep-water areas, enabling accurate identification of sand patches embedded within coral reefs and increasing boundary delineation. Moreover, multitemporal fusion reduces the impact of topographic variation on feature extraction, allowing the detection of rock mixed with sand in the geomorphologically complex southern zone. Overall, the multitemporal fusion classification results reveal markedly improved boundary integrity and internal homogeneity across all the substrate types. Detailed information in key regions is effectively preserved, yielding more complete and accurate classification outcomes.
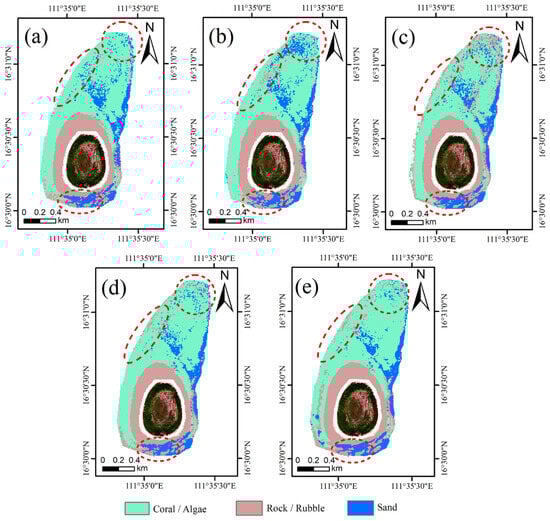
Figure 10.
Substrate classification results for Robert Island. (a) 18 February 2024, (b) 4 March 2024, (c) 9 March 2024, (d) multitemporal fusion results, (e) validation data. The red dashed circles represent the area with obvious differences.
4.3.2. Quantitative Evaluation
The quantitative evaluation results for Robert Island are shown in Table 7. The classification results for single-temporal images are derived from feature training based on data captured at specific time points. If the extracted features are incomplete or inaccurate, the resulting classifications will inevitably be unreliable. As a result, single-temporal approaches exhibit variable accuracy and are prone to randomness and bias, yielding relatively low overall classification performance. After multitemporal fusion, all the accuracy indices markedly improved, with OA and Kappa being significantly higher than those of single-temporal classification. From the confusion matrix of substrate classification on Robert Island (Figure 11), it can be seen that the accuracy of each category is further improved after multitemporal fusion, and the cross ratio is reduced, indicating that multitemporal fusion can effectively improve the accuracy and discrimination of substrate classification. These enhancements collectively improve the accuracy, consistency, and stability of substrate mapping on Robert Island. Moreover, multitemporal fusion captures the spectral responses and topographic distributions of substrates more comprehensively, further validating the effectiveness and reliability of the proposed method for substrate classification.
Table 7.
Substrate classification accuracy on Robert Island. Results in bold are the best.
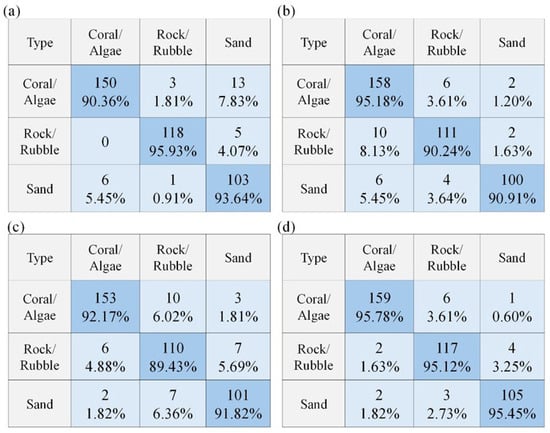
Figure 11.
Confusion matrix for substrate classification in Robert Island. (a) 18 February 2024, (b) 4 March 2024, (c) 9 March 2024, (d) multitemporal fusion results.
4.4. Comparative Analysis of Different Training Models
To assess the effectiveness of the shallow-water substrate classification method, which is based on the fusion of multitemporal remote sensing images using a random forest model, it is compared with four mainstream classification algorithms: the backpropagation algorithm (BP) [4], the naive Bayes model (NB) [40], the maximum likelihood classifier (MLC) [22], and K-Means [41]. Among these, BP, NB, and MLC represent traditional supervised classification methods, whereas K-means is a traditional unsupervised classification method. In this study, both qualitative and quantitative evaluations of the classification results of these models across the different study areas were conducted.
4.4.1. Qualitative Evaluation of the Substrate Classification Results
In this study, the performance of different classification models on substrate classification results was evaluated (Figure 12). In the central region of Key Biscayne, elevated chlorophyll concentrations from seagrass complicate spectral characteristics, reduce water transparency, and obscure intrinsic substrate features. These effects hinder the BP model from converging to optimal parameters, introduce parameter bias in the MLC model, and exacerbate spectral overlap issues for the NB. K-Means clustering is also disrupted, leading to unstable results. On Dongdao Island, correctly identifying coral-sand mixed zones remains challenging. BP produces significant misclassifications, NB severely overestimates the extent of sand in the southern region, MLC fails to delineate boundaries between sand and coral reefs across the study area, and K-Means presents pronounced confusion between the two classes. In the deep-water of Robert Island, optical signal attenuation and abrupt topographic changes further complicate classification. BP, NB, and MLC struggle to distinguish rock around islands and reefs, with a limited capacity to capture finer details in other regions. K-Means, an unsupervised algorithm, results in a significant decline in classification performance.
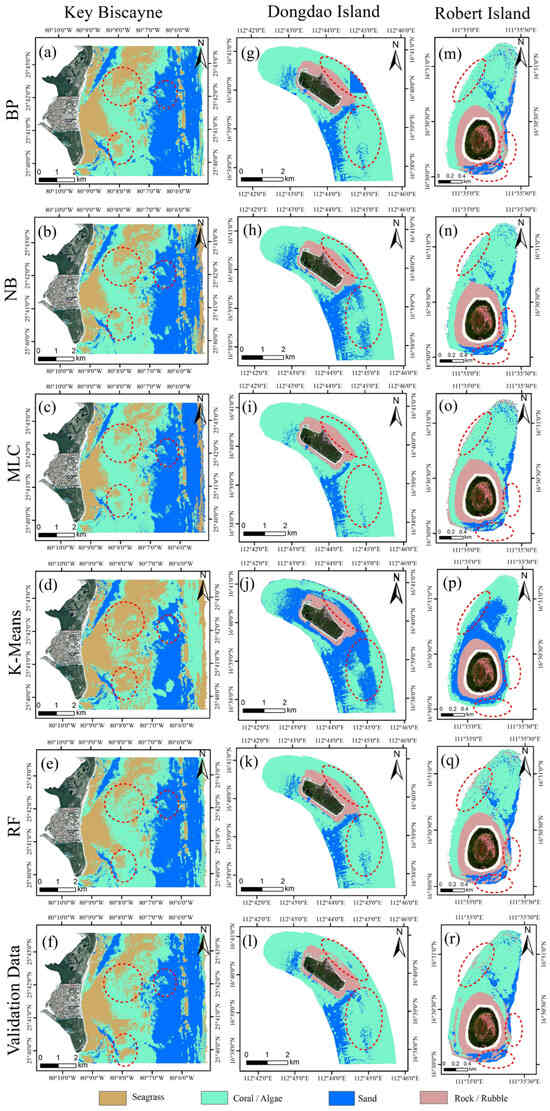
Figure 12.
Substrate classification results for different training models. (a–f) Key Biscayne, (g–l) Dongdao Island, and (m–r) Robert Island. The red dashed circles represent the area with obvious differences.
Overall, different classification models exhibit varying levels of performance across the study areas. Among them, supervised algorithms (BP, NB, MLC) consistently outperform the unsupervised algorithm (K-Means). However, none of these supervised algorithms achieve optimal performance across all the study areas. In contrast, the RF model proposed in this study leverages an ensemble learning framework that integrates multiple decision trees to improve both classification accuracy and stability, thereby reducing the risk of overfitting. Its robust feature mining capability enables it to capture subtle feature variations between different substrates, rendering it well suited for fine recognition of substrate boundaries. Moreover, compared with BP, NB, and MLC, the collaborative voting mechanism among decision trees increases the adaptability of RF to complex environments, ensuring greater classification robustness. Consequently, across all the study areas, the RF model consistently delivers higher accuracy and stability than the other classification methods do.
4.4.2. Quantitative Evaluation of Substrate Classification Results
To objectively evaluate the performance of different classification models, in this study, quantitative assessments of the RF, BP, NB, MLC and K-Means methods were conducted across multiple study areas, with the results summarized in Table 8. Although supervised algorithms (BP, NB, and MLC) demonstrate superior performance across indices compared with K-Means, they exhibit notable limitations, including higher rates of misclassification and omission, a tendency toward accuracy deviation, a weak ability to capture fine-scale details, and limited precision in classification outcomes. K-Means, lacking prior knowledge guidance, shows substantially lower evaluation metrics, highlighting the inherent limitations of unsupervised methods in terms of accuracy and stability for substrate classification tasks.
Table 8.
Accuracies of different training models in different study areas. Results in bold are the best.
Overall, BP, NB, and MLC fail to achieve optimal classification accuracy in any of the study areas. Analysis of the classification indices indicated that the RF model consistently maintained high performance across all five accuracy indices for substrate classification in the three study areas, demonstrating both strong accuracy and stability. The RF model attains the highest overall classification accuracy across various substrate types, with fewer false positives and more reliable predictions. Its high recall and F1-score indicate effective capture of true substrate samples, minimizing missed detections. Moreover, the kappa coefficient of the RF model is substantially greater than those of the other algorithms, further highlighting the reliability and consistency of its classification results. Quantitative evaluations reveal marked differences in classification performance among the models, objectively confirming the accuracy and robustness of the proposed method in addressing complex substrate environments.
However, compared to these traditional algorithms, the random forest model used in the proposed method exhibits notable performance limitations in computational efficiency and complexity. As an ensemble learning approach, the random forest model requires constructing multiple decision trees and fusing their voting results to achieve classification, resulting in substantial computational resource consumption during the training phase. When processing large-scale remote sensing image datasets, the training time of the model is considerably longer than that of traditional algorithms, with higher demands on hardware computing power. Meanwhile, the combinatorial optimization of the model’s key hyperparameters such as the number of decision trees, maximum tree depth and node splitting criteria requires repeated iterative validation, increasing practical application costs and leading to inherently high computational complexity. In the future, algorithm optimization will be carried out, exploring parallel computing frameworks or lightweight model structures to improve computational efficiency while maintaining accuracy advantages.
5. Conclusions
This study proposes a shallow-water substrate classification method based on the fusion of multitemporal remote sensing images using random forest model, which compensate for the insufficient consideration of features and solve the problem of low accuracy in single-temporal image classification. The core innovation of this study lies in three aspects: employing adaptive weighted fusion to derive optimal water depth data, using median fusion to generate the best images, developing and formulating equations for calculating bottom reflectance in the blue and green bands and incorporating bottom reflectance into the set of key features of the random forest model. Experiments were carried out in three different shallow-water study areas. For different substrates, the proposed method has a classification accuracy of over 90.34%, with significantly fewer misclassified pixels than a single temporal image, and a maximum misclassification rate of less than 8.13%, verifying its excellent performance in accuracy and misclassification control. Compared with the four mainstream classification algorithms, the RF model used in the proposed method demonstrates superior detail preservation ability and strong adaptability to diverse complex shallow-water environments. Both the overall accuracy and the F1 score of the proposed method exceed 0.94, with the kappa coefficient surpassing 0.90, significantly improving the accuracy and stability of substrate classification in each study area. However, the random forest model used in the proposed method has lower computational efficiency and higher computational complexity, which is the inevitable cost paid by the model to improve classification accuracy. In the future, algorithm optimization will be carried out, exploring parallel computing frameworks or lightweight model structures to improve computational efficiency while maintaining accuracy advantages. Overall, the proposed method provides a novel solution for obtaining comprehensive and accurate substrate information using remote sensing images in complex environments without in situ data.
Author Contributions
Conceptualization, Z.D. and Z.L.; methodology, Z.L. and Z.D.; software, Z.L. and Y.F.; validation, Z.L., Y.F. and Y.Z.; formal analysis, Z.L., Y.L., Y.Z. and C.J.; investigation, Z.L., Y.F., Y.C. and C.J.; resources, Z.D., Y.F., Y.L. and Y.C.; data curation, Y.C.; writing—original draft preparation, Z.L.; writing—review and editing, Z.D., Y.F.,Y.L., Y.C. and Y.Z.; visualization, Z.L. and Z.D.; supervision, Y.L.; project administration, Y.L.; funding acquisition, Z.D. All authors have read and agreed to the published version of the manuscript.
Funding
This work was supported in part by the Key Laboratory of Ocean Space Resource Management Technology, Ministry of Natural Resource, P. R. China under Grant KF-2025-105, in part by the Basic Scientific Fund for National Public Research Institutes of China under Grant 2025Q03, in part by the National Natural Science Foundation of China under Grant 42404056, in part by the National Key Research and Development Program of China under Grant 2024YFB3909700, in part by the Shandong Provincial Natural Science Foundation under Grant ZR2025MS651 and ZR2023QD113, in part by the Key Laboratory of Ocean Geomatics, Ministry of Natural Resources, P. R. China under Grant 2024B01, and in part by the Technology Innovation Center for South China Sea Remote Sensing, Surveying and Mapping Collaborative Application, Ministry of Natural Resources, P. R. China under Grant RSSMCA-2024-B005.
Data Availability Statement
The original contributions presented in this study are included in the article. Further inquiries can be directed to the corresponding author.
Acknowledgments
We would like to express appreciation to the Allen Coral Atlas for distributing the substrate classification validation dataset, and the European Space Agency (ESA) for distributing the Sentinel-2 imagery. More importantly, we give sincere thanks to the anonymous reviewers and members of the editorial team for their comments and contributions.
Conflicts of Interest
The authors declare no conflicts of interest.
References
- Zheng, H.-b.; Yan, P.; Chen, J.; Wang, Y.-l. Seabed substrate classification in the northern South China Sea using inversion method. Appl. Ocean Res. 2013, 39, 131–136. [Google Scholar] [CrossRef]
- Anderson, J.T.; Van, H.D.; Rudy, K.; Reid, D.G.; Yvan, S. Acoustic seabed classification: Current practice and future directions. ICES J. Mar. Sci. 2008, 65, 1004–1011. [Google Scholar] [CrossRef]
- Purnawan, S.; Manik, H.M.; Hestirianoto, T.; Amri, K.; Kang, M. Seabed classification of coral reef environments using 200 kHz single-beam echosounder and machine learning techniques. Egypt. J. Aquat. Res. 2025, 51, 341–351. [Google Scholar] [CrossRef]
- Ji, X.; Yang, B.; Tang, Q. Acoustic seabed classification based on multibeam echosounder backscatter data using the PSO-BP-AdaBoost algorithm: A case study from Jiaozhou Bay, China. IEEE J. Ocean. Eng. 2021, 46, 509–519. [Google Scholar] [CrossRef]
- Barbagelata, A.; Richardson, M.; Miaschi, B.; Muzi, E.; Guerrini, P.; Troiano, L.; Akal, T. ISSAMS: An in situ substrate acoustic measurement system. In Shear Waves in Marine Substrates; Hovem, J.M., Richardson, M.D., Stoll, R.D., Eds.; Springer: Dordrecht, The Netherlands, 1991; pp. 305–312. [Google Scholar] [CrossRef]
- Mogg, A.O.M.; Attard, K.M.; Stahl, H.; Brand, T.; Turnewitsch, R.; Sayer, M.D.J. The influence of coring method on the preservation of sedimentary and biogeochemical features when sampling soft-bottom, shallow coastal environments. Limnol. Oceanogr. Methods 2017, 15, 905–915. [Google Scholar] [CrossRef]
- Misiuk, B.; Brown, C.J. Benthic habitat mapping: A review of three decades of mapping biological patterns on the seafloor. Estuar. Coast. Shelf Sci. 2024, 296, 108599. [Google Scholar] [CrossRef]
- Moncada, C.; Ellrott, A.; de Beer, D.; Amann, R.; Knittel, K. The Ellrott grab: A small, lightweight sediment sampler for collecting undisturbed sandy sediments. Limnol. Oceanogr. Methods 2024, 22, 159–169. [Google Scholar] [CrossRef]
- Zhu, W.; Ye, L.; Qiu, Z.; Luan, K.; He, N.; Wei, Z.; Yang, F.; Yue, Z.; Zhao, S.; Yang, F. Research of the dual-band log-linear analysis model based on physics for bathymetry without in-situ depth data in the South China Sea. Remote Sens. 2021, 13, 4331. [Google Scholar] [CrossRef]
- Ashphaq, M.; Srivastava, P.K.; Mitra, D. Review of near-shore satellite derived bathymetry: Classification and account of five decades of coastal bathymetry research. J. Ocean Eng. Sci. 2021, 6, 340–359. [Google Scholar] [CrossRef]
- Hamel, M.A.; Andréfouët, S. Using very high resolution remote sensing for the management of coral reef fisheries: Review and perspectives. Mar. Pollut. Bull. 2010, 60, 1397–1405. [Google Scholar] [CrossRef] [PubMed]
- Hedley, J.D.; Roelfsema, C.M.; Chollett, I.; Harborne, A.R.; Heron, S.F.; Weeks, S.; Skirving, W.J.; Strong, A.E.; Eakin, C.M.; Christensen, T.R.L.; et al. Remote sensing of coral reefs for monitoring and management: A review. Remote Sens. 2016, 8, 118. [Google Scholar] [CrossRef]
- Roelfsema, C.; Kovacs, E.; Ortiz, J.-C.; Wolff, N.; Callaghan, D.; Wettle, M.; Ronan, M.; Hamylton, S.; Phinn, S. Coral reef habitat mapping: A combination of object-based image analysis and ecological modelling. Remote Sens. Environ. 2018, 208, 27–41. [Google Scholar] [CrossRef]
- Montereale Gavazzi, G.; Kapasakali, D.A.; Kerchof, F.; Deleu, S.; Degraer, S.; Van Lancker, V. Subtidal natural hard substrate quantitative habitat mapping: Interlinking underwater acoustics and optical imagery with machine learning. Remote Sens. 2021, 13, 4608. [Google Scholar] [CrossRef]
- Menandro, P.S.; Misiuk, B.; Brown, C.J.; Bastos, A.C. Multispectral multibeam backscatter response of heterogeneous rhodolith beds. Sci. Rep. 2023, 13, 20220. [Google Scholar] [CrossRef]
- Wan, J.; Qin, Z.; Cui, X.; Yasir, M.; Ma, B. Seafloor habitat mapping by combining multiple features from optic and acoustic data: A case study from Ganquan Island, South China Sea. IEEE J.-Stars 2023, 16, 7248–7263. [Google Scholar] [CrossRef]
- Ji, X.; Yang, B.; Wei, Z.; Wang, M.; Tang, Q.; Xu, W.; Wang, Y.; Zhang, J.; Zhang, L. Benthic habitat sediments mapping in coral reef area using amalgamation of multi-source and multi-modal remote sensing data. Remote Sens. Environ. 2024, 304, 114032. [Google Scholar] [CrossRef]
- Evagorou, E.; Hasiotis, T.; Petsimeris, I.T.; Monioudi, I.N.; Andreadis, O.P.; Chatzipavlis, A.; Christofi, D.; Kountouri, J.; Stylianou, N.; Mettas, C.; et al. A holistic high-resolution remote sensing approach for mapping coastal geomorphology and marine habitats. Remote Sens. 2025, 17, 1437. [Google Scholar] [CrossRef]
- Zhang, K.; Li, Q.; Zhu, H.; Yang, F.; Wu, Z. Acoustic deep-sea seafloor characterization accounting for heterogeneity effect. IEEE Trans. Geosci. Remote Sens. 2020, 58, 3034–3042. [Google Scholar] [CrossRef]
- Traganos, D.; Aggarwal, B.; Poursanidis, D.; Topouzelis, K.; Chrysoulakis, N.; Reinartz, P. Towards Global-scale seagrass mapping and monitoring using Sentinel-2 on Google Earth Engine: The case study of the Aegean and Ionian Seas. Remote Sens. 2018, 10, 1227. [Google Scholar] [CrossRef]
- Topouzelis, K.; Makri, D.; Stoupas, N.; Papakonstantinou, A.; Katsanevakis, S. Seagrass mapping in Greek territorial waters using Landsat-8 satellite images. Int. J. Appl. Earth Obs. 2018, 67, 98–113. [Google Scholar] [CrossRef]
- Pragunanti, T.; Nababan, B.; Madduppa, H.; Kushardono, D. Accuracy assessment of several classification algorithms with and without hue saturation intensity input features on object analyses on benthic habitat mapping in the Pajenekang Island Waters, South Sulawesi. IOP Conf. Ser. Earth Environ. Sci. 2020, 429, 012044. [Google Scholar] [CrossRef]
- Setiawan, K.; Winarso, G.; Ibrahim, A.; Purwanto, A.; Parsa, I. Comparative analysis of classification methods for mapping shallow water habitats using Spot-7 satellite imagery in Nusa Lembongan Island, Bali. Int. J. Remote Sens. Earth Sci. 2022, 19, 10–20. [Google Scholar] [CrossRef]
- Liu, Y.; Zhou, Y.; Yang, X. Bathymetry derivation and slope-assisted benthic mapping using optical satellite imagery in combination with ICESat-2. Int. J. Appl. Earth Obs. 2024, 127, 103700. [Google Scholar] [CrossRef]
- Chen, B.; Yang, Y.; Lin, M.; Zou, B.; Chen, S.; Huang, E.; Xu, W.; Tian, Y. Satellite retrieval of bottom reflectance from high-spatial-resolution multispectral imagery in shallow coral reef waters. Int. J. Appl. Earth Obs. 2025, 139, 104483. [Google Scholar] [CrossRef]
- Chen, H.; Cheng, L.; Zhang, K. Bathymetry-guided multi-source remote sensing image domain adaptive coral reef benthic habitat classification. GIScience Remote Sens. 2025, 62, 2471193. [Google Scholar] [CrossRef]
- Purkis, S.J. Remote Sensing Tropical Coral Reefs: The View from Above. Annu. Rev. Mar. Sci. 2018, 10, 149–168. [Google Scholar] [CrossRef] [PubMed]
- Wu, L.; Chen, Y.; Le, Y.; Qian, Y.; Zhang, D.; Wang, L. A high-precision fusion bathymetry of multi-channel waveform curvature for bathymetric LiDAR systems. Int. J. Appl. Earth Obs. 2024, 128, 103770. [Google Scholar] [CrossRef]
- Yin, Z.; Wu, P.; Li, X.; Hao, Z.; Ma, X.; Fan, R.; Liu, C.; Ling, F. Super-resolution water body mapping with a feature collaborative CNN model by fusing Sentinel-1 and Sentinel-2 images. Int. J. Appl. Earth Obs. 2024, 134, 104176. [Google Scholar] [CrossRef]
- Wei, J.; Wang, M.; Lee, Z.; Briceo, H.O.; Luis, K. Shallow water bathymetry with multi-spectral satellite ocean color sensors: Leveraging temporal variation in image data. Remote Sens. Environ. 2020, 250, 112035. [Google Scholar] [CrossRef]
- Serge, A.; Maële, B.; Stéphane, G.; Antoine, G. Evaluation of the Allen Coral Atlas benthic habitat map product for New Caledonia using representative habitat observations from a multi-species fishery assessment. Coral Reefs 2024, 43, 523–540. [Google Scholar] [CrossRef]
- Zhou, G.; Su, S.; Xu, J.; Tian, Z.; Cao, Q. Bathymetry retrieval from spaceborne multispectral subsurface reflectance. IEEE J.-Stars 2023, 16, 2547–2558. [Google Scholar] [CrossRef]
- Chen, B.; Yang, Y.; Xu, D.; Huang, E. A dual band algorithm for shallow water depth retrieval from high spatial resolution imagery with no ground truth. ISPRS J. Photogramm. 2019, 151, 1–13. [Google Scholar] [CrossRef]
- He, C.; Jiang, Q.; Wang, P. An improved physics-based dual-band model for satellite-derived bathymetry using SuperDove imagery. Remote Sens. 2024, 16, 3801. [Google Scholar] [CrossRef]
- Zhong, J.; Sun, J.; Lai, Z. ICESat-2 and multispectral images based coral reefs geomorphic zone mapping using a deep learning approach. IEEE J.-Stars 2024, 17, 6085–6098. [Google Scholar] [CrossRef]
- Zuo, X.; Teng, J.; Su, F.; Duan, Z.; Yu, K. Multimodel combination bathymetry inversion approach based on geomorphic segmentation in coral reef habitats using ICESat-2 and multispectral satellite images. IEEE J.-Stars 2025, 18, 3267–3280. [Google Scholar] [CrossRef]
- Breiman, L. Random Forests. Mach. Learn. 2001, 45, 5–32. [Google Scholar] [CrossRef]
- Ierodiaconou, D.; Schimel, A.C.G.; Kennedy, D.; Monk, J.; Gaylard, G.; Young, M.; Diesing, M.; Rattray, A. Combining pixel and object based image analysis of ultra-high resolution multibeam bathymetry and backscatter for habitat mapping in shallow marine waters. Mar. Geophys. Res. 2018, 39, 271–288. [Google Scholar] [CrossRef]
- Belgiu, M.; Drăguţ, L. Random forest in remote sensing: A review of applications and future directions. ISPRS J. Photogramm. 2016, 114, 24–31. [Google Scholar] [CrossRef]
- Meister, M.; Qu, J.J. Quantifying seagrass density using Sentinel-2 data and machine learning. Remote Sens. 2024, 16, 1165. [Google Scholar] [CrossRef]
- Asner, G.P.; Martin, R.E.; Mascaro, J. Coral reef atoll assessment in the South China Sea using Planet Dove satellites. Remote Sens. Ecol. Conserv. 2017, 3, 57–65. [Google Scholar] [CrossRef]
Disclaimer/Publisher’s Note: The statements, opinions and data contained in all publications are solely those of the individual author(s) and contributor(s) and not of MDPI and/or the editor(s). MDPI and/or the editor(s) disclaim responsibility for any injury to people or property resulting from any ideas, methods, instructions or products referred to in the content. |
© 2025 by the authors. Licensee MDPI, Basel, Switzerland. This article is an open access article distributed under the terms and conditions of the Creative Commons Attribution (CC BY) license (https://creativecommons.org/licenses/by/4.0/).