Abstract
Based on the field survey and reference data of the sea area of the Zhongjieshan Islands from 2021 to 2022, the Ecopath model was used to analyze the energy flow structure of the marine ecosystem of the sea area of the Zhongjieshan Islands; the energy structure of the marine ecosystem was divided into 21 functional groups, and its nutrient structure, energy flow, and total system characteristics were analyzed. The results show that the credibility of the model is 0.414, which is at a medium level. The trophic level of each functional group of the ecosystem in the sea area of Zhongjieshan Islands was 1–3.48, the energy flow structure of the system was mainly concentrated in the first five grades, and the trophic level was relatively simple, with the average energy transfer efficiency of the system being 8.11%, the energy flow range being 2.81–13.04%, the energy transfer efficiency of the primary producers of the system being 7.25%, and the energy conversion efficiency of the system debris being 9.12%. The total system throughput was 2125.96 t·km−2; The analysis of the overall characteristics of the ecosystem showed that the system connectance index and the system omnivory index were 0.45 and 0.24, respectively, while the Finn’s cycling index was 8.24, the Finn’s mean path length of the system was 2.72, and the total primary production/total respiration was 1.71. In this study, the marine ecosystem model of the sea area of the Zhongjieshan Islands was studied to understand the trophic structure and ecosystem status of the sea area, which is conducive to the sustainable utilization and scientific management of fishery resources in the sea area.
1. Introduction
The Zhongjieshan Islands (30°06′~30°13′ N, 122°36′~122°48′ E) are located in the eastern part of the Zhoushan Archipelago, which is the central area of the Zhoushan fishing ground [1]. Due to the influence of the Changjiang River and Qiantangjiang River Diluted Water, the Yellow Sea Cold Water Mass, the Taiwan Warm Current, and the East China Sea Coastal Current, the food resources are abundant, and it is a place for the growth, feeding, and reproduction of the main economic fish in the East China Sea [2]. In recent years, due to the interference of human activities and high fishing pressure, the biological habitat in the sea area of the Zhongjieshan Islands has been destroyed, and the fishery resources have declined.
In order to protect and restore the ecological environment and fishery resources of the sea area of the Zhongjieshan Islands [3], management authorities have established several key protected areas, including the national-level marine protection area of te Zhejiang Putuo Zhongjieshan Islands, the national-level marine ranch demonstration area of the Putuo Zhongjieshan Islands, the fishery resource enhancement and release protection area of the Zhoushan Fishing Ground, and the spawning ground protection area of the Zhoushan Fishing Ground. Additionally, ongoing efforts have been made in constructing artificial reefs and releasing cultivated fish. There are already signs of population recovery for the economically important species in this marine area, achieving both favorable ecological and economic benefits.
Research on the status of resources in the sea area around the Zhongjieshan Islands has predominantly focused on individual species distribution or community characteristics, including studies on fish [1], shrimp and crab species [4], zooplankton [5,6], as well as the relationships between their community structures and environmental factors [7]. However, studies on the trophic structure and energy flow of the ecosystem around the sea area of the Zhongjieshan Islands have yet to be conducted. Investigating the structure, function, and characteristics of the ecosystem in this area will help to understand the material cycling and energy flow characteristics of the system, as well as its basic features. This understanding is crucial for the scientific and effective management of the system, which will benefit the conservation and sustainable use of fishery resources in these waters.
Ecopath model is a balance model based on the principle of nutrition dynamics. It describes energy flow and determines the ecological parameters by constructing an ecosystem model [8]. The Ecopath model was originally created by Polovina [9] in 1984. After gradual development, it was applied to a variety of ecosystems to analyze their stability and maturity characteristics so as to achieve the comparison between different ecosystems [10]. It can also determine the ecological capacity of a species. In China, the Ecopath model has been widely used in lakes [11], bays [12,13,14,15], and offshore areas [16,17,18,19]. Based on the previous survey data of fishery resources and ecological environment, this study constructs the Ecopath ecosystem energy flow model in the sea area of the Zhongjieshan Islands so as to analyze the energy flow structure and overall characteristics of the ecosystem, provide the basis for the fishery management of the sea area, as well as provide a scientific reference for the construction of marine ranching.
2. Material and Methods
2.1. Data Sources
In the spring (April), summer (July), and autumn (October) of 2021, and winter (January) of 2022, a survey of the fishery resources and ecological environment was conducted in the sea area of the Zhongjieshan Islands. A total of 18 survey stations were set up (Figure 1). Data collection and sample analysis were carried out by the Marine Survey Specification (GB/T 12763.6-2007) [20] and Marine Fishery Resources Survey Specification (SC/T 9403-2012) [21].
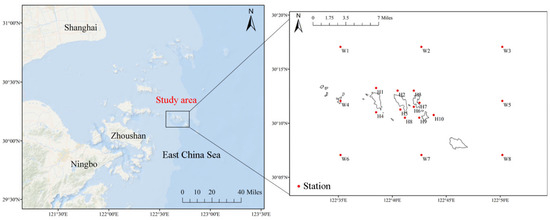
Figure 1.
Station diagram of surveys in sea area of Zhongjieshan Islands. Notes: Stations H1–H10 are in the Special Marine Protected Area of the Zhongjieshan Islands. Stations W1–W8 are in the outer waters of the protected area.
2.2. Division of Functional Groups
According to the biological characteristics, feeding characteristics, habitat environment, economic value, and biomass, these species were divided into 21 functional groups (Table 1). Among them, Larimichthys crocea and Sepiella maindroni are the main fishery resources in the sea area of the Zhongjieshan Islands, and they are important to the fisheries in the local area. In this study, they were divided into separate functional groups. Harpadon nehereus is the most dominant species and the highest biomass species in this survey, and it was also divided into a separate functional group. Other functional groups include phytoplankton, zooplankton, macroalgae, pelagic planktonic food fish, pelagic planktonic food fish, pelagic mixed food fish, demersal mixed food fish, demersal nekton food fish, demersal invertebrate food fish, cephalopods, crabs, shrimps, stomatopods, benthic mollusks, other benthic organisms, polychaetes, echinoderms, and detritus. These functional groups can cover the main flow processes of ecosystem energy flow in the sea area of the Zhongjieshan Islands.

Table 1.
Functional groups and their main species composition in the Ecopath model of the ecosystem in the sea area of Zhongjieshan Islands.
2.3. Calculation Parameters
According to the definition of the Ecopath model, the ecosystem is divided into a series of ecologically interrelated functional groups [22,23], which basically cover the nutritional structure and energy flow of the entire ecosystem [24]. According to the first law of thermodynamics, the Ecopath model assumes that the energy input and output of each functional group are balanced, and the linear equation is as follows:
where Bi is the biomass of Group I [22], (P/B)i is the ratio of production to biomass of Group I [22], EEi is the ecotrophic efficiency of I [22], Bj is the biomass of predator j, (Q/B)j is the ratio of consumption to biomass of Group j [22], DCij is the proportion of prey j in the diet of predator I [22], and EXi is the export of I [22]. In the Ecopath model, any three of the four parameters, Bi, (P/B)i, (Q/B)j, and EEi, can be used as parameter inputs, and the remaining unknowns can be calculated by the model [25].
2.4. Source of Functional Group Parameters
In the Ecopath model, the flow of energy is represented by the wet mass (t·km−2) in the system [24]. The biomass parameters of each functional group of the model were derived from the sampling survey of fishery resources and ecological environment in the sea area of the Zhongjieshan Islands. The P/B value of fish is equal to the instantaneous total mortality rate Z [26], Z = M + F, where M is the natural mortality coefficient, F is the fishing mortality coefficient, and M is estimated by Pauly’s empirical formula [27]. The Q/B value of fish is calculated according to the multiple regression model of the caudal fin shape ratio [28,29]. Regarding the functional groups for which the P/B and Q/B values are difficult to determine, this study mainly refers to the similar functional groups in the models of Sanmen Bay [13], Yangtze Estuary [30], and the East China Sea [31] with similar latitudes and ecosystem characteristics. The DC data of the food composition matrix were derived from the stomach content analysis of samples collected during the survey [32], the stomach content analysis of samples from adjacent sea areas [33,34,35,36,37,38,39], and the Fishbase database [40]. Ecotrophic efficiency (EE) is defined as the proportion of energy contributed by the production of a functional group to to the energy produced by the entire ecosystem [41]. It is calculated by the model. The catch is based on fishery production monitoring data.
2.5. Model Debugging
The balance principle of the Ecopath model is to make the input and output of the ecosystem equal [22]. After input of the known parameters into the model, the EE is usually greater than 1 [23]. Since the production of a functional group is greater than the consumption, the EE value should be between 0 and 1. To obtain the reasonable values of other parameters of the ecosystem, the ratio of production to biomass, the ratio of consumption to biomass, and the food composition of each functional group should be adjusted to make the model in a balanced state [25].
The Pedigree index is used to evaluate the overall quality of the input parameters of the model. The Pedigree index varies from 0 to 1. The higher the Pedigree index, the higher the accuracy of the parameters [22].
In this study, a PEREBAL pre-test was used to test the biomass (B), the ratio of production to biomass (P/B), the ratio of consumption to biomass (Q/B), and the ratio of production to consumption (P/Q) before model equilibrium to check the consistency of the model [8]. According to the principles of mass conservation and thermodynamic conservation, the Ecopath model after pre-test was adjusted through a series of logical constraints to achieve ecological and thermodynamic equilibrium [8].
2.6. Ecosystem Index
The ecotrophic efficiency (EE) is a measure of what is not “other mortality” [22]; it is the part of the production that is either passed up the trophic foodweb or exported. Ecotrophic efficiency is difficult to measure directly; it varies between 0 and l and can be expected to approach l for most groups. EE has no unit, and entry into the model of EE is optional [42,43]. Mixed trophic impact (MTI) reflects the effect of biomass changes in functional groups on other functional groups [44,45]. Ecosystem maturity is represented by Finn’s cycle index (FCI) [44], connectance index (CI) [45], and system omnivory index (SOI) [46]. The connectance index (CI) and the system omnivory index (SOI) are indicators that reflect the complexity of the ecosystem functional group association [47]. The values of each parameter are output by the Ecopath software (6.6.8).
3. Results
3.1. PREBAL Pre-Test
The consistency of B, P/B, Q/B, and P/Q (the ratio of P/B and Q/B) in the sea area of the Zhongjieshan Islands was checked by the PREBAL pre-test. (Figure 2) The order of the functional groups is arranged from a high trophic level to a low trophic level. From the diagram, it can be seen that the highest biomass in the sea area of the Zhongjieshan Archipelago is the seaweed functional group. The highest P/B value was in the phytoplankton functional group, followed by the zooplankton functional group. The highest Q/B value was in the zooplankton functional group. The highest P/Q value was in the middle and lower mixed feeding fish functional groups.
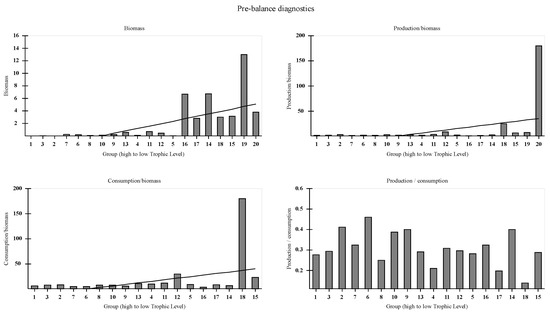
Figure 2.
PREBAL pre-test trend chart of the sea area of the Zhongjieshan Islands.
3.2. Nutrient Structure and Energy Flow Conversion Efficiency Between Trophic Levels
According to the estimation of the model, the trophic level of the ecosystem function group in the sea area of the Zhongjieshan Islands ranged from 1 to 3.48 (Table 2), among which the highest trophic level of Larimichthys crocea was 3.48, and the trophic level of Sepiella maindroni was 3.45. The trophic level of fish was 2.42–3.48, the trophic level of shrimp and crab was 2.65–2.67, and the trophic level of cephalopod was 3.10.
Table 2.
Output parameters from Ecopath model of the ecosystem of the sea area of Zhongjieshan Islands.
The energy flow between the trophic levels of the ecosystem in the sea area of the Zhongjieshan Islands is shown in Figure 3, and the energy flow of the system is mainly concentrated in the first five trophic levels. The total primary production of the system is 782.4 t·km−2·a−1, of which 406.1 t·km−2·a−1 is transferred to the second trophic level, and 273.9 t·km−2·a−1 is transferred to the second trophic level. The total energy flowing into the detritus reached 599.4 t·km−2·a−1, most of which came from the primary producers at 376.3 t·km−2·a−1.
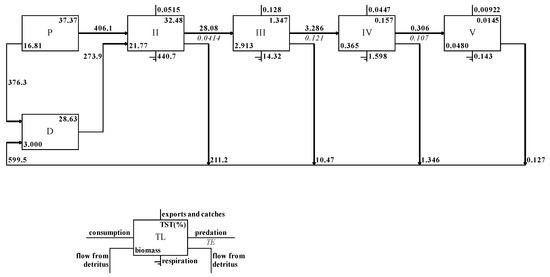
Figure 3.
Energy flow between trophic levels of the marine ecosystem in the sea area of Zhongjieshan Islands. P: Primary producer; D: Detritus; TL: Trophic level; TST: Ratio of each integrated nutrient level to the tolal system flow; TE: Transfer efficiency.
3.3. Energy Transfer Efficiency
It can be seen from Table 3 that the total average energy conversion efficiency of the ecosystem in the sea area of the Zhongjieshan Islands is 8.11%. From the second trophic level to the fifth trophic level, the total energy conversion efficiency of the energy provided by the producer phytoplankton and macroalgae between the trophic levels was 2.81%, 13.04%, 10.4%, and 11.49%, respectively. The conversion efficiency of energy provided by the detritus among the different trophic levels was 6.1%, 11.46%, 10.86%, and 11.23%, respectively. The conversion efficiency of total energy flow from the first trophic level to the second trophic level is 4.13%, and the conversion efficiency from the second trophic level to the third trophic level is 12.11%. The average nutrient conversion efficiency of the grazing food chain based on phytoplankton and macroalgae was 7.25%, and the average nutrient conversion efficiency of the detritus food chain was 9.12%.
Table 3.
Nutritional conversion efficiency between trophic levels of the sea area of ecosystem of Zhongjieshan Islands.
3.4. Food Contact and Mixed Nutrition Effects Between Functional Groups
The material flow diagram of the ecosystem in the sea area of the Zhongjieshan Islands shows that the functional groups within the ecosystem are closely related (Figure 4). Benthic mollusks, polychaetes, and echinoderms play an important role in the whole ecosystem. They are the bridge between the primary producers and the high-trophic consumers. The nutrient flow of the ecosystem in the sea area of the Zhongjieshan Islands is based on detritus and grazing.
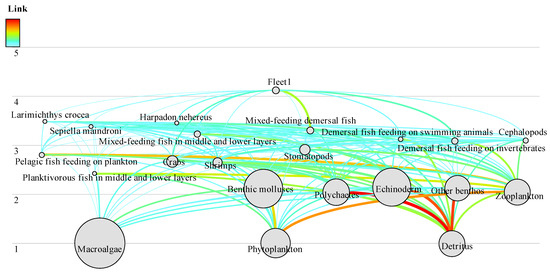
Figure 4.
Ecopath flow diagram in the sea area of Zhongjieshan Islands.
The food chain of the marine ecosystem in the sea area of the Zhongjieshan Islands is mainly composed of the following three pathways: (1) benthic producers (phytoplankton and seaweeds) → benthic invertebrates (crustaceans and molluscs) → demersal invertebrates (2) producers (phytoplankton) → echinoderms (3) producers (phytoplankton and seaweeds) → polychaetes → pelagic mixed fishes.
The mixed trophic relationships among the functional groups of the marine ecosystem in the sea area of the Zhongjieshan Islands are shown in Figure 5. Phytoplankton, macroalgae, and detritus are the main nutrient sources in the sea area of the Zhongjieshan Islands, and the increase in their biomass has a positive impact on the other functional groups. Detritus had a positive effect on polychaetes, echinoderms, and other benthic organisms, and phytoplankton had a positive effect on benthic mollusks and zooplankton. The trophic level of Larimichthys crocea was high, which was affected by the predator–prey relationship, and had a negative impact on the leading fish. Sepiella maindroni had a negative impact on the bottom mixed feeding fish. Other benthic organisms had a negative impact on the polychaete functional group. Shrimp had a negative effect on the functional group of the Stomatopoda.
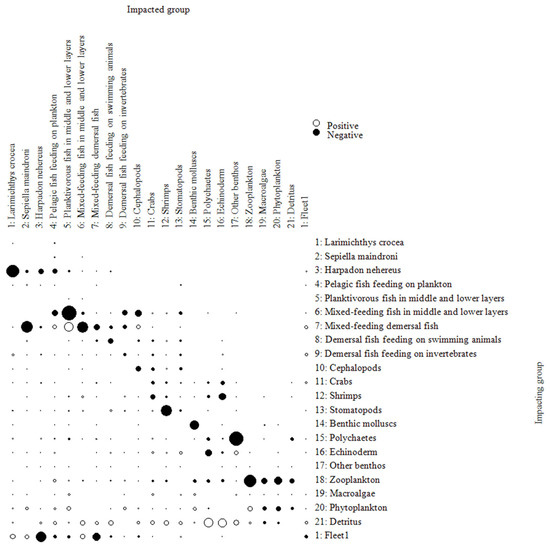
Figure 5.
Mixed trophic impact analysis of functional groups in the Ecopath model of the ecosystem in the sea area of Zhongjieshan Islands.
3.5. Overall Characteristic Parameters of the System
The ecosystem characteristics in the sea area of the Zhongjieshan Islands are shown in Table 4. At present, the total ecosystem flow in the sea area of the Zhongjieshan Islands has reached 2125.96 t/(km2·a), of which 34.9% comes from the total ecosystem consumption, 743.93 t/(km2·a), 15.3% comes from the total output, 325.82 t/(km2·a), 21.4% comes from the total respiration, 456.74 t/(km2·a), and the remaining 28.1% flows to debris, 599.46 t/(km2·a). The net primary productivity and total biomass were 782.4 t/(km2·a) and 41.91 t/(km2·a), respectively. Total primary production/total respiration (TPP/TR), total primary production/total biomass (TPP/TB), and net ecosystem production represent ecosystem maturity. The connectivity index and the omnivorous index of the ecosystem food web in the sea area of the Zhongjieshan Islands were 0.45 and 0.24, respectively. Finn’s cycling index was 8.24, and Finn’s mean path length of the system was 2.72.
Table 4.
Comparison of general characteristic parameters in the waters of Zhongjieshan Island ecosystem with other bay ecosystems.
Compared to the other typical ecosystems in the domestic areas such as Sanmen Bay, Haizhou Bay, Beibu Gulf, and Daya Bay, the ecosystem in the sea area of the Zhongjieshan Islands has the highest connectance index, which is greater than that of the mature ecosystems. The sum of all consumption (SC) in the sea area of the Zhongjieshan Islands’ ecosystem is 743.93 t·km−2, which is higher than that of Sanmen Bay and Haizhou Bay but lower than that of Beibu Gulf and Daya Bay. The system omnivory index for the marine ecosystems in the sea area of the Zhongjieshan Islands is 0.24, which is higher than that of Sanmen Bay, Haizhou Bay, and Daya Bay but lower than that of Beibu Gulf. This indicates that the marine ecosystem of the sea area of Zhongjieshan Islands is in an immature state, with a relatively simple nutritional structure and lower resilience to external disturbances.
4. Discussion
4.1. Quality Evaluation of the Capacity Model
The Pedigree index is used to evaluate the credibility of the model itself. Morissette analyzed more than 150 models and found that the index ranged from 0.16 to 0.68 [48]. In this study, the Pedigree index of the marine ecosystem in the sea area of the Zhongjieshan Islands was 0.416, which was at a medium level. In the process of generating parameters, the feeding composition, the ratio of production to biomass, and the ratio of consumption to biomass of all fish were difficult to obtain. Therefore, most of the values refer to the research data of the adjacent sea area [13], and the reference data have a certain influence on the credibility of the model [49]. In future model research, more experimental data should be obtained and more samples should be collected to reflect the real ecological community structure more objectively and accurately [50].
4.2. Ecosystem Trophic Level and Conversion Efficiency
The nutrient conversion efficiency of most fish in the sea area of the Zhongjieshan Island, determining the nutrient structure, energy flow, and energy conversion efficiency of the ecosystem, and the structure and overall characteristics of the ecosystem can be analyzed on the basis of the available data. The nutrient structure in the ecosystem reflects the basic energy flow of the ecosystem [25,51]. The energy flow of the ecosystem in the sea area of the Zhongjieshan Islands is mainly concentrated in the first five trophic levels, of which the energy flowing to the first trophic level accounts for 65.9% of the total flow, and the energy flowing to the second trophic level accounts for 32.4% of the total flow. It shows that the energy flow efficiency of the first and second trophic levels is high, and the energy flow is mainly between the first trophic level and the second trophic level. The total conversion efficiency of the ecosystem in the sea area of Zhongjieshan Islands is 8.112%, which is lower than 10% of Lindeman’s [52] and the adjacent ecosystems, such as 13% of the Sanmen Bay [13] and 9.3% of the Yangtze Estuary [30], indicating that a large amount of primary productivity cannot enter a higher level of nutrient flow [53].
Most of the fish in the sea area of the Zhongjieshan Islands have a high nutrient conversion efficiency, such as Larimichthys crocea and the cephalopod Sepiella. The nutrient conversion efficiency of shrimp is also high. Shrimp is an important food species in the sea area of the Zhongjieshan Islands. Larimichthys crocea and Sepiella maindroni feed on a large amount of shrimp. In addition, the nutrient conversion efficiency of crabs is low, indicating that more crab production is not used by higher trophic levels but directly flows into debris after death. This may be due to the low biomass of crab-eating functional groups, such as demersal-eating fish. Compared with other ecosystems, the nutrient conversion efficiency of zooplankton and organic debris in the ecosystem of the sea area of the Zhongjieshan Islands was higher. This may be caused by the large amounts of zooplankton and organic debris consumed by fish in the sea area of the Zhongjieshan Islands.
4.3. Ecosystem Characteristics of Zhongjieshan Islands Sea Area
It is possible to effectively describe the characteristics and energy flow of ecosystems by comparing them with ecosystems with the same latitude or similar characteristics [42]. The total flow of ecosystem in the sea area of the Zhongjieshan Islands is 2125.96 t/(km2·a), which is lower than in the adjacent sea area of Sanmen Bay [13] (6407.44 t/(km2·a)), Yangtze River Estuary (4191.228 t/(km2·a) [30], and Xiangshan Port [52] (2226.605 t/(km2·a). Total primary productivity/total respiration (TPP/TR) represents the maturity of the system [44]. In a mature ecosystem, there is no overproduction recycling problem, the total production and total respiration are comparable, TPP/TR is close to 1, and NSP is close to 0. When the total production exceeds the total respiration, TPP/TR is greater than 1, indicating that the ecosystem is unstable [54,55]. The TPP/TR of the sea area of Zhongjieshan Islands ecosystem is 1.71, indicating that the sea area of the Zhongjieshan Islands’ ecosystem is in an immature state and is greatly disturbed. The TPP/TB value of the system is high, which is 18.67, indicating that the system is in the early stage of development. At the same time, the TPP/TB value is higher than 1, which shows a more dynamic development of the system [53]. The TPP/TB value of the ecosystem in the sea area of the Zhongjieshan Islands is much greater than 1, so the vitality of the ecosystem in the sea area of the Zhongjieshan Islands is high. The difference between the total primary production and total respiration of the system is the net production of the system. The closer the value is to 0, the more mature the system is [22]. The net production of the ecosystem in the sea area of the Zhongjieshan Islands is 325.82, which is much larger than 0, indicating that the system is in the early stages of development. The proportion of material recycling in the FCI ecosystem is an indicator of ecosystem stability. The higher the FCI, the better the stability of the ecosystem [45]. The FCI of the ecosystem in the sea area of the Zhongjieshan Islands is 8.24%, which is higher than in the adjacent Sanmen Bay and the Yangtze Estuary, indicating that the stability of the sea area of the Zhongjieshan Islands was low. SOI and CI are related to the complexity of the food web [56]. SOI and CI in the sea area of the Zhongjieshan Islands are relatively low, which is similar to other immature ecosystems such as Sanmen Bay [13] and Yangtze Estuary [30], indicating that the food web structure of the ecosystem in the sea area of the Zhongjieshan Islands is simple and the stability of the ecosystem is low.
5. Conclusions
In this study, the Ecopath model was employed to analyze the energy flow structure of the marine ecosystem in the sea area of the Zhongjieshan Islands. It was found that the Pedigree index of the Ecopath model in this case was 0.416, which was at a moderate level. The overall conversion efficiency of the marine ecosystem in the sea area of Zhongjieshan Islands was 8.11%, which was not at a high level. The TPP/TR ratio in this system was relatively high, indicating that the ecosystem was in an unstable state, with the energy flow structure primarily concentrated in the top five trophic levels, suggesting a relatively simple trophic structure. This study can contribute data for the research of the marine ecosystem in the sea area of the Zhongjieshan Islands and may provide a basis for ecosystem management.
Author Contributions
Conceptualization, Y.Q.; Methodology, Y.Q.; Software, Y.Q.; Validation, Y.Q.; Investigation, Z.W., J.L., Y.Z. (Yazhou Zhang), Z.L., Q.D. and Y.J.; Resources, J.L., K.X., Y.Z. (Yazhou Zhang), Z.L. and Q.D.; Data curation, Y.Q., Z.W., J.L., K.X., Y.Z. (Yazhou Zhang), Z.L., Q.D. and Q.Z.; Writing – original draft, Y.Q.; Writing – review & editing, Z.W. and Y.Z. (Yongdong Zhou); Supervision, Y.Z. (Yongdong Zhou); Project administration, Y.Z. (Yongdong Zhou); Funding acquisition, Y.Z. (Yongdong Zhou). All authors have read and agreed to the published version of the manuscript.
Funding
This research was funded by National Key R&D Program “Blue granary scientific and technological innovation” Key special topics: 2020YFD0900804, 2019YFD0901204; Fishery Resources Investigation Project of Zhejiang Provincial Department of Agriculture and Rural Affairs: HYS-CZ-202314; Key R&D Program of Zhejiang Province: 2020C02004; Key R&D Program of Zhejiang Province: 2019C02056; Zhejiang Provincial Public Welfare Technology Application Research Project: LGN21C190005.
Institutional Review Board Statement
Not applicable.
Informed Consent Statement
Not applicable.
Data Availability Statement
The original contributions presented in the study are included in the article. Further inquiries can be directed to the corresponding author.
Acknowledgments
We would like to thank Wang Bo, the captain of the fishing vessel ZHEPUYU 68712, and the colleagues who carried out the field investigations for the samples and data. We are also sincerely grateful to the peer reviewer for their feedback on the manuscript.
Conflicts of Interest
The authors declare no conflict of interest.
References
- Liang, J.; Wang, W.; Xu, H.; Zhou, Y.; Xu, K.; Zhang, H.; Lu, K. Diel and seasonal variation in fish communities in the Zhongjieshan marine island reef reserve. Fish. Res. 2020, 227, 105549. [Google Scholar] [CrossRef]
- Cai, L.; Tang, R.; Yan, X.; Zhou, Y.; Jiang, J.; Yu, M. The spatial-temporal consistency of chlorophyll-a and fishery resources in the water of the Zhoushan archipelago revealed by high resolution remote sensing. Front. Mar. Sci. 2022, 9, 1022375. [Google Scholar] [CrossRef]
- Jin, J.; Quan, Y. Assessment of marine ranching ecological development using DPSIR-TOPSIS and obstacle degree analysis: A case study of Zhoushan. Ocean. Coast. Manag. 2023, 244, 106821. [Google Scholar] [CrossRef]
- Xu, K.; Zhang, H.; Xie, H.; Liang, J.; Zhang, L.; Zhu, W. Resource density and community diversity of crustaceans in the waters of Zhongjieshan Islands. Mar. Fish. 2012, 34, 308–315. [Google Scholar] [CrossRef]
- Li, Z.; Jiang, R.; Chen, F.; Lu, Z. The Annual Characteristics of Phytoplankton Communities in Zhongjieshan Islands Sea Area. J. Zhejiang Ocean. Univ. (Nat. Sci.) 2016, 35, 299–309. [Google Scholar]
- Zhang, Y. Zooplankton Community Characters and Relationship with Environmental Factors in the Special Marine Reserve of Zhongjieshan Archipelago. Maters’ Thesis, Zhejiang Ocean University, Zhoushan, China, 2014. [Google Scholar]
- Zhang, H.; Wang, Y.; Liang, J.; He, Z.; Zhou, Y. Seasonal Variations of the Biological Characteristics andAbundance Density of Collichthys lucidus in Zhongjieshanslands Marine Protected Area. J. Zhejiang Ocean. Univ. (Nat. Sci.) 2015, 34, 407–410. [Google Scholar]
- Heymans, J.J.; Coll, M.; Link, J.S.; Mackinson, S.; Steenbeek, J.; Walters, C.; Christensen, V. Best practice in Ecopath with Ecosim food-web models for ecosystem-based management. Ecol. Model. 2016, 331, 173–184. [Google Scholar] [CrossRef]
- Polovina, J.J. The ECOPATH model and its application to French Frigate Shoals. Coral Reefs 1984, 3, 1–11. [Google Scholar] [CrossRef]
- Srithong, N.; Jensen, K.R.; Jarernpornnipat, A. Application of the ecopath model for evaluation of ecological structure and function for fisheries management: A case study from fisheries in coastal Andaman Sea, Thailand. Reg. Stud. Mar. Sci. 2021, 47, 101972. [Google Scholar] [CrossRef]
- Li, Y.-K.; Liu, N.-S.; Wang, H.; Gong, Y. Analysis on the ecosystem structure and function of Lake Taihu based on Ecopath model. Chin. J. Appl. Ecol. 2014, 25, 2033–2040. (In Chinese) [Google Scholar]
- Lin, Q.; Li, X.-S.; Li, Z.-Y.; Ji, X.-S. Ecological carrying capacity of Chinese shrimp stock enhancement in Laizhou Bay of East China based on Ecopath model. Chin. J. Appl. Ecol. 2013, 24, 1131–1140. (In Chinese) [Google Scholar]
- Kong, Y.-F.; Yin, C.-J.; Wang, L.-L.; Liu, Y.; Lin, L.; Kang, B. Ecosystem structure and function of Sanmen Bay based on Ecopath model. Chin. J. Appl. Ecol. 2022, 33, 829–836. (In Chinese) [Google Scholar] [CrossRef]
- Huang, M.; Xu, S.; Liu, Y.; Xiao, Y.; Wang, T.; Li, C. Assessment of ecological carrying capacity of Sparus macrocephalus in Daya Bay based on an ecopath model. J. Fish. Sci. Chin. 2019, 26, 1–13. (In Chinese) [Google Scholar] [CrossRef]
- Ren, X.-Y.; Liu, Y.; Xu, B.-D.; Zhang, C.L.; Ren, Y.P.; Cheng, Y.; Xue, Y. Ecosystem structure in the Haizhou Bay and adjacent waters based on Ecopath model. Haiyang Xuebao 2020, 42, 101–109. (In Chinese) [Google Scholar] [CrossRef]
- Chen, Z.-Z.; Qiu, Y.-S.; Jia, X.-P.; Huang, Z.R.; Wang, Y.Z. Structure and function of Beibu Gulf ecosystem based on Ecopath model. J. Fish. Sci. Chin. 2008, 15, 460–468. (In Chinese) [Google Scholar]
- Wu, Z.-X.; Zhang, X.-M.; Zhang, L.; Tong, F.; Liu, H.-J. Structure and function of Lidao artificial reef ecosystem in Rongcheng of Shandong Province, East China: An evaluation based on Ecopath model. Chin. J. Appl. Ecol. 2012, 23, 2878–2886. (In Chinese) [Google Scholar] [CrossRef]
- Hong, X.-F.; Chen, Z.-Z.; Zhang, J.; Jiang, Y.E.; Gong, Y.Y.; Cai, Y.C.; Yang, Y.T. Analysis of ecological carrying capacity of reef organisms in Qilianyu Islands based on Ecopath model. J. Troph. Oceanogr. 2022, 41, 15–27. (In Chinese) [Google Scholar]
- Chen, Z.-Z.; Qiu, Y.-S. Assessment of the food-web structure, energy flows, and system attribute of northern South China Sea ecosystem. Acta Eco 2010, 30, 4855–4865. (In Chinese) [Google Scholar]
- GB/T 12763.6-2007; General Administration of Quality Supervision, Inspection and Quarantine of the People’s Republic of China, Standardization Administration of the People’s Republic of China. Specifications for Oceanographic Survey—Part 6: Marine Biological Survey. Standards Press of China: Beijing, China, 2007; 159p.
- SC/T 9403-2012; Ministry of Agriculture and Rural Affairs of the People’s Republic of China. Technical Specification for Marine Fishery Resources Survey. China Agriculture Press: Beijing, China, 2012; 31p.
- Christensen, V.; Pauly, D. Ecopath ii—A software for balancing steady-state ecosystem models and calculating network characteristics. Ecol. Model. 1992, 61, 169–185. [Google Scholar] [CrossRef]
- Christensen, V.; Walters, C.J. Ecopath with Ecosim: Methods, capabilities and limitations. Ecol. Model. 2004, 172, 109–139. [Google Scholar] [CrossRef]
- Pauly, D. Fish population dynamics in tropical waters: A manual for use with programmable calculators. ICLARM Stud. Rev. 1984, 8, 1–17. [Google Scholar]
- Christensen, V.; Walters, C.J.; Pauly, D. Ecopath with Ecosim: A User’s Guide; Fisheries Centre, University of British Columbia: Vancouver, BC, Canada, 2005; Volume 12, p. 154. [Google Scholar]
- Gulland, J.J.A. The Fish Resources of the Ocean; Fishing News (Books) Ltd.: Surrey, UK, 1971; 255p. [Google Scholar]
- Pauly, D. On the interrelationships between natural mortality, growth parameters, and mean environmental temperature in 175 fish stocks. ICES J. Mar. Sci. 1980, 39, 175–192. [Google Scholar] [CrossRef]
- Palomares, M.L.D.; Pauly, D. Predicting food consumption of fish populations as functions of mortality, food type, morphometrics, temperature and salinity. Mar. Freshw. Res. 1998, 49, 447–453. [Google Scholar] [CrossRef]
- Palomares, M.L.D.; Pauly, D. A multiple regression model for predicting the food consumption of marine fish populations. Aust. J. Mar. Freshw. Res. 1989, 40, 259–273. [Google Scholar] [CrossRef]
- Lin, Q.; Jin, X.-S.; Guo, X.W.; Zhang, B. Study on the structure and energy flow of the Yangtze River estuary and adjacent waters ecosystem based on Ecopath model. J. Hydroecol. 2009, 30, 28–36. (In Chinese) [Google Scholar]
- Li, Y.-K.; Yu, N.; Chen, L.-Q.; Chen, Y.; Feng, D.X. Ecological modeling on structure and functioning of southern East China Sea ecosystem. Prog. Fish. Sci. 2010, 31, 30–39. (In Chinese) [Google Scholar]
- Liu, M.-Z.; Yang, F.; Jiang, R.-J.; Yin, R.; Wang, J.; Xiao, Y.; Ling, T.; Zhu, S.-L. Trophic niche and potential carbon source of three reef-associated fishes of Zhongjieshan Islands. Chin. J. Appl. Ecol. 2023, 34, 1130–1136. [Google Scholar]
- Yang, F.; Liu, M.-Z.; Jiang, R.-J.; Yin, R.; Li, X.; Shen, J.; Shan, X.; Xu, H. Study on the feeding ecology of Larimichthys crocea in the Ma’an Archipelago based on biomarker and stomach content analysis. J. Fish. Sci. Chin. 2023, 30, 247–258. (In Chinese) [Google Scholar]
- Wang, J. Feeding Ecology of Four Commercial Fishes in Zhoushan Islands. Master’s Thesis, Zhejiang Ocean University, Zhoushan, China, 2022. (In Chinese). [Google Scholar]
- Zhang, Q.-H.; Cheng, J.-H.; Xu, H.-X.; Shen, X.-Q.; Yu, G.-P.; Zheng, Y.-J. The fishery Resources and Sustainable Utilization in the East China Sea and Southern Yellow Sea; Fudan University Press: Shanghai, China, 2007; 633p. (In Chinese) [Google Scholar]
- Li, D.; Li, S.-H.; Xu, J.-T.; Tang, J.; Wu, L.; Yang, G.; Yu, W. Feeding habits of Coilia nasus in the waters near Yangtze Estuary. Chin. J. Ecol. 2024, 43, 930–936. (In Chinese) [Google Scholar]
- Dou, S.-Z.; Yang, J.-M. Feeding habit and seasonal variation in food contentof Cynoglossus semilaevis (Günther). Acta Ecol. 1992, 12, 368–376. (In Chinese) [Google Scholar]
- Zhang, Z.-P.; Xue, J.-L.; Wang, M.-Q.; Liu, H.; Shi, Q.; Song, J.; Zhao, W. Trophic niches of three common carnivorous mollusca in artificial reef area. Haiyang Tongbao 2022, 41, 588–592. (In Chinese) [Google Scholar]
- Wang, C.-Q.; Tang, J.-H.; Xiong, Y.; Wang, Y.P.; Shi, J.J.; Yan, X. Feeding habits of Miichthys miiuy in Jiangsu costal waters. J. Zhejiang. Ocean Univ. (Nat. Sci. Ed.) 2020, 39, 372–378. (In Chinese) [Google Scholar]
- Froese, D.; Pauly, R. (Eds.) FishBase [EB/OL] (2023-06) [2023-09-27]. Available online: http://www.fishbase.org (accessed on 1 July 2023).
- Ivlev, V.S. Experimental Ecology of the Feeding of Fishes; Yale University Press: New Haven, CT, USA, 1961; 302p. [Google Scholar]
- Power, M.E.; Tilman, D.; Estes, J.A.; Menge, B.A.; Bond, W.J.; Mills, L.S.; Daily, G.; Castilla, J.C.; Lubchenco, J.; Paine, R.T. Challenges in the quest for keystones. Bioscience 1996, 46, 609–620. [Google Scholar] [CrossRef]
- Hannon, B. The structure of ecosystems. J. Theor. Biol. 1973, 41, 535–546. [Google Scholar] [CrossRef] [PubMed]
- Finn, J.T. Measures of ecosystem structure and function derived /from analysis of flows. J. Theor. Biol. 1976, 56, 363–380. [Google Scholar] [CrossRef]
- Ulanowicz, R.E. Growth and Development: Ecosystem Phenomenology; Springer: New York, NY, USA, 1986. [Google Scholar]
- Pauly, D.; Soriano-Bartz, M.L.; Palomares, M.L.D. Improved construction, parametrization and interpretation of steady-state ecosystem models. In Trophic Models of Aquatic Ecosystems. ICLARM Conference Proceedings; Christensen, V., Pauly, D., Eds.; International Center for Living Aquatic Resources Management: Makati, Philippines; International Council for the Exploration of the Sea; Danish International Development Agency: Copenhagen, Denmark, 1993; Volume 26, pp. 1–13. [Google Scholar]
- Odum, E.P. The strategy of ecosystem development. Science 1969, 164, 262–270. [Google Scholar] [CrossRef]
- Morissette, L. Complexity, Cost and Quality of Ecosystem Models and Their Impact on Resilience: A Comparative Analysis, with Emphasis on Marine Mammals and the Gulf of St. Lawrence. Ph.D. Thesis, University of British Columbia, Vancouver, BC, Canada, 2007. [Google Scholar]
- Coll, M.; Akoglu, E.; Arreguín-Sánchez, F.; Fulton, E.A.; Gascuel, D.; Heymans, J.J.; Libralato, S.; Mackinson, S.; Palomera, I.; Piroddi, C.; et al. Modelling dynamic ecosystems: Venturing beyond boundaries with the Ecopath approach. Rev. Fish. Biol. Fish. 2015, 25, 413–424. [Google Scholar] [CrossRef]
- Yahya, B.M.; Couce, L.; Yahya, S.A.; Castro, J.J. Exploring the ecosystem structure of Zanzibar archipelago, trophic flows and fisheries interaction by using a mass balance modelling approach. Reg. Stud. Mar. Sci. 2024, 78, 103802. [Google Scholar] [CrossRef]
- Yang, L.-L.; Jiang, Y.-Z.; Yuan, X.-W.; Lin, N.; Liu, Z.; Li, S. Ecological carrying capacity of typical enhancement species in Xiangshan Bay. Mar. Fish. 2016, 38, 273–282. (In Chinese) [Google Scholar]
- Lindeman, R.L. The trophic-dynamic aspect of ecology. Ecology 1942, 23, 399–418. [Google Scholar] [CrossRef]
- Hsiao, P.Y.; Lan, K.W.; Lee, W.H.; Liang, T.Y.; Liao, C.H.; Su, N.J. Impacts of El Niño–Southern Oscillation (ENSO) Events on Trophodynamic Structure and Function in Taiwan Bank Marine Ecosystem. Diversity 2024, 16, 572. [Google Scholar] [CrossRef]
- Christensen, V. Ecosystem maturity towards quantification. Ecol. Model. 1995, 77, 3–32. [Google Scholar] [CrossRef]
- Odum, E.P. Fundamental of Ecology; Saunders: Philadelphia, PA, USA, 1971. [Google Scholar]
- Christensen, V. A model of trophic interactions in the North Sea in 1981, the Year of the Stomach. Dana 1995, 11, 1–28. [Google Scholar]
Disclaimer/Publisher’s Note: The statements, opinions and data contained in all publications are solely those of the individual author(s) and contributor(s) and not of MDPI and/or the editor(s). MDPI and/or the editor(s) disclaim responsibility for any injury to people or property resulting from any ideas, methods, instructions or products referred to in the content. |
© 2024 by the authors. Licensee MDPI, Basel, Switzerland. This article is an open access article distributed under the terms and conditions of the Creative Commons Attribution (CC BY) license (https://creativecommons.org/licenses/by/4.0/).