Article

Transaction Mechanism Based on Two-Dimensional Energy and Reliability Pricing for Energy Prosumers

1
Department of Electrical and Electronic Engineering, Hanseo University, Chungcheongnam-do 31962, Korea
2
Department of Electrical Engineering, Gachon University, Gyeonggi-do 13120, Korea
*
Author to whom correspondence should be addressed.
Appl. Sci. 2019, 9(7), 1343; https://doi.org/10.3390/app9071343
Submission received: 15 February 2019 / Revised: 26 March 2019 / Accepted: 26 March 2019 / Published: 30 March 2019

Abstract

:
Prosumers, users that consume and produce energy, increase the diversity of energy system operations as distributed sources. However, they can reduce energy system reliability by increasing uncertainty. This study presents a novel transaction mechanism based on dynamic pricing for enhancing energy system reliability. The proposed dynamic energy-reliability pricing-based transaction mechanism (ERT) increases the controllability of prosumer uncertainties by a two-dimensional pricing mechanism based on time and reliability status, as compared to conventional time-based one-dimensional energy prices. Under the proposed ERT, utilities and prosumers exchange information about the utility price and the prosumer’s intent in order to ensure that demand is met. A two-way information infrastructure built for prosumer energy trading is used for this task. The utility enhances system reliability using this information, and the prosumer increases revenue through pricing selection. The practical implementation of the proposed ERT is described for both utilities and prosumers. A case study using practical renewable generation data revealed that the proposed ERT improves not only the reliability factor of the utility but also prosumer revenue as compared to a conventional energy-based dynamic pricing case. It is also shown that an economical optimum point that maximizes prosumer net revenue exists when electrical energy storage (EES) is applied to enhance performance. Increasing to the EES capacity provided room for uncertainty management, net revenue is improved, but the economic burden by the EES cost is increased. Under the proposed ERT, the optimal point results in greater EES capacity and higher net revenue enhancement than the conventional case.

1. Introduction

Along with the development of the smart grid, more and more distributed generation has been deployed in power systems. This often includes renewable energy sources due to their availability, applicability, and environmentally friendly nature [1]. With distributed renewable generation, traditional passive consumers, such as households and small businesses, are now participating as producers in the electricity market [2]. These newly introduced users are called prosumers, as they both share surplus energy generated domestically as well as consume energy from the energy utility [3].
The presence of prosumers is expected to bring some benefits. These include: (1) a modular and tailored energy service to specific end uses, which can vary in quality; (2) grid diversification, by encouraging the large amount of distributed generation deployed to complement decentralized storage options; and (3) efficient wholesale market operations, with minimal transmission congestion and constraints [4]. However, an increase in renewable sources and decentralization can cause reliability problems, introducing multiple unknowns and risks that must be addressed and managed in grid operation [5].
In order to address the reliability problem, a direct approach based on control, or a soft or indirect approach based on pricing, can be used. The direct approach is hardware-centric. To solve the grid operation issues, additional equipment, such as smart inverters [6], static synchronous compensators (STACOM) [7], and/or electric energy storage (EES) [8,9], can be deployed. The grid operation structures are improved to enable cooperation with the distributed resources via the introduction of advanced distribution network operating systems [10]. Applying this direct approach is effective in terms of operations. However, there are additional investment and regulatory problems. Alternatively, the soft/indirect approach pursues a similar operation effect statistically by providing additional signals to participants. This approach requires more sophisticated technologies, and it lessens the direct investment of utilities necessary to operate the grid.
A pricing-based approach is a typical mechanism for indirect control [11]. It is a demand-side management mechanism that improves grid reliability by indirectly controlling the prosumer’s energy usage to the price factor, such as demand charges and energy charges [12]. However, conventional pricing that consists of demand charges and energy charges usually has limitations in considering load or generation uncertainties [13]. Under conventional pricing systems, distributed renewable generators have limited responsibility and limited rewards for their uncertainties, as the pricing is determined regardless of generation uncertainty [14].
Dynamic pricing, such as real-time pricing (RTP) [15] or time-of-use (TOU) pricing [16], can lead generators to produce electricity at higher-price times. However, this method cannot help to decrease generation uncertainty. From the viewpoint of utilities that operate grids, generation uncertainty is important in operational planning. Here, uncertainty can be represented as generation predictability. As such, a more advanced pricing method has been introduced to improve generation predictability by assigning the responsibility of prediction to generators and by instituting a penalty and reward system for their commitments. Even in this advanced pricing system, utilities have limited information for generation prediction, because even though prosumers commit their generation amount, they do not have information about the uncertainty of their generation amount. Prosumers with renewable generation capabilities may try to keep their commitments to avoid or reduce penalties [17]. The utilities, however, are unaware of the situation and intend to honor prosumers’ generation commitments, and thus can only estimate the amount of the generation based on historical statistical information. The exact same issue occurs in load estimation. It means that an information-driven transaction is required in active prosumer environments [18].
In this study, a novel transaction mechanism based on dynamic pricing is proposed to pursue improved utility grid operation. The basic concept of the proposed mechanism increases each benefit of utility and prosumers by exchanging more information. For this purpose, it is described as the proposed mechanism and the operation sequence. As a first step, the utilities can announce multiple uncertainty pricing bands beforehand that may vary depending on time, and the prosumers can select a reliability band appropriate for their situation. In the proposed mechanism, prosumers commit both the amount of generation along with the uncertainty of that amount. Thus, utilities have access to more detailed information about generation uncertainties than under the current system. A case study shows that, under the proposed mechanism, prosumers achieve more revenue and grid reliability is improved for utility compared to the conventional pricing case. This is because both utilities and prosumers have an opportunity to maximize their benefits via additional information about uncertainty. In addition, by performance characteristic and economic sensitivity analysis, it is discussed that the proposed mechanism is adaptively worked and has an economically optimal point related to resource characteristics. This mechanism is described from the generation point of view, but it works in the same way for demand.
The rest of this paper is organized as follows. Section 2 describes the proposed dynamic-pricing-based transaction mechanism and compares it to conventional energy-based dynamic pricing. Section 3 discusses how to implement the proposed mechanism in energy systems. Section 4 demonstrates a measurement study using real wind generation data applied to the proposed dynamic pricing mechanism. Section 5 concludes the paper.

2. Dynamic Energy-Reliability Pricing-Based Transaction Mechanism

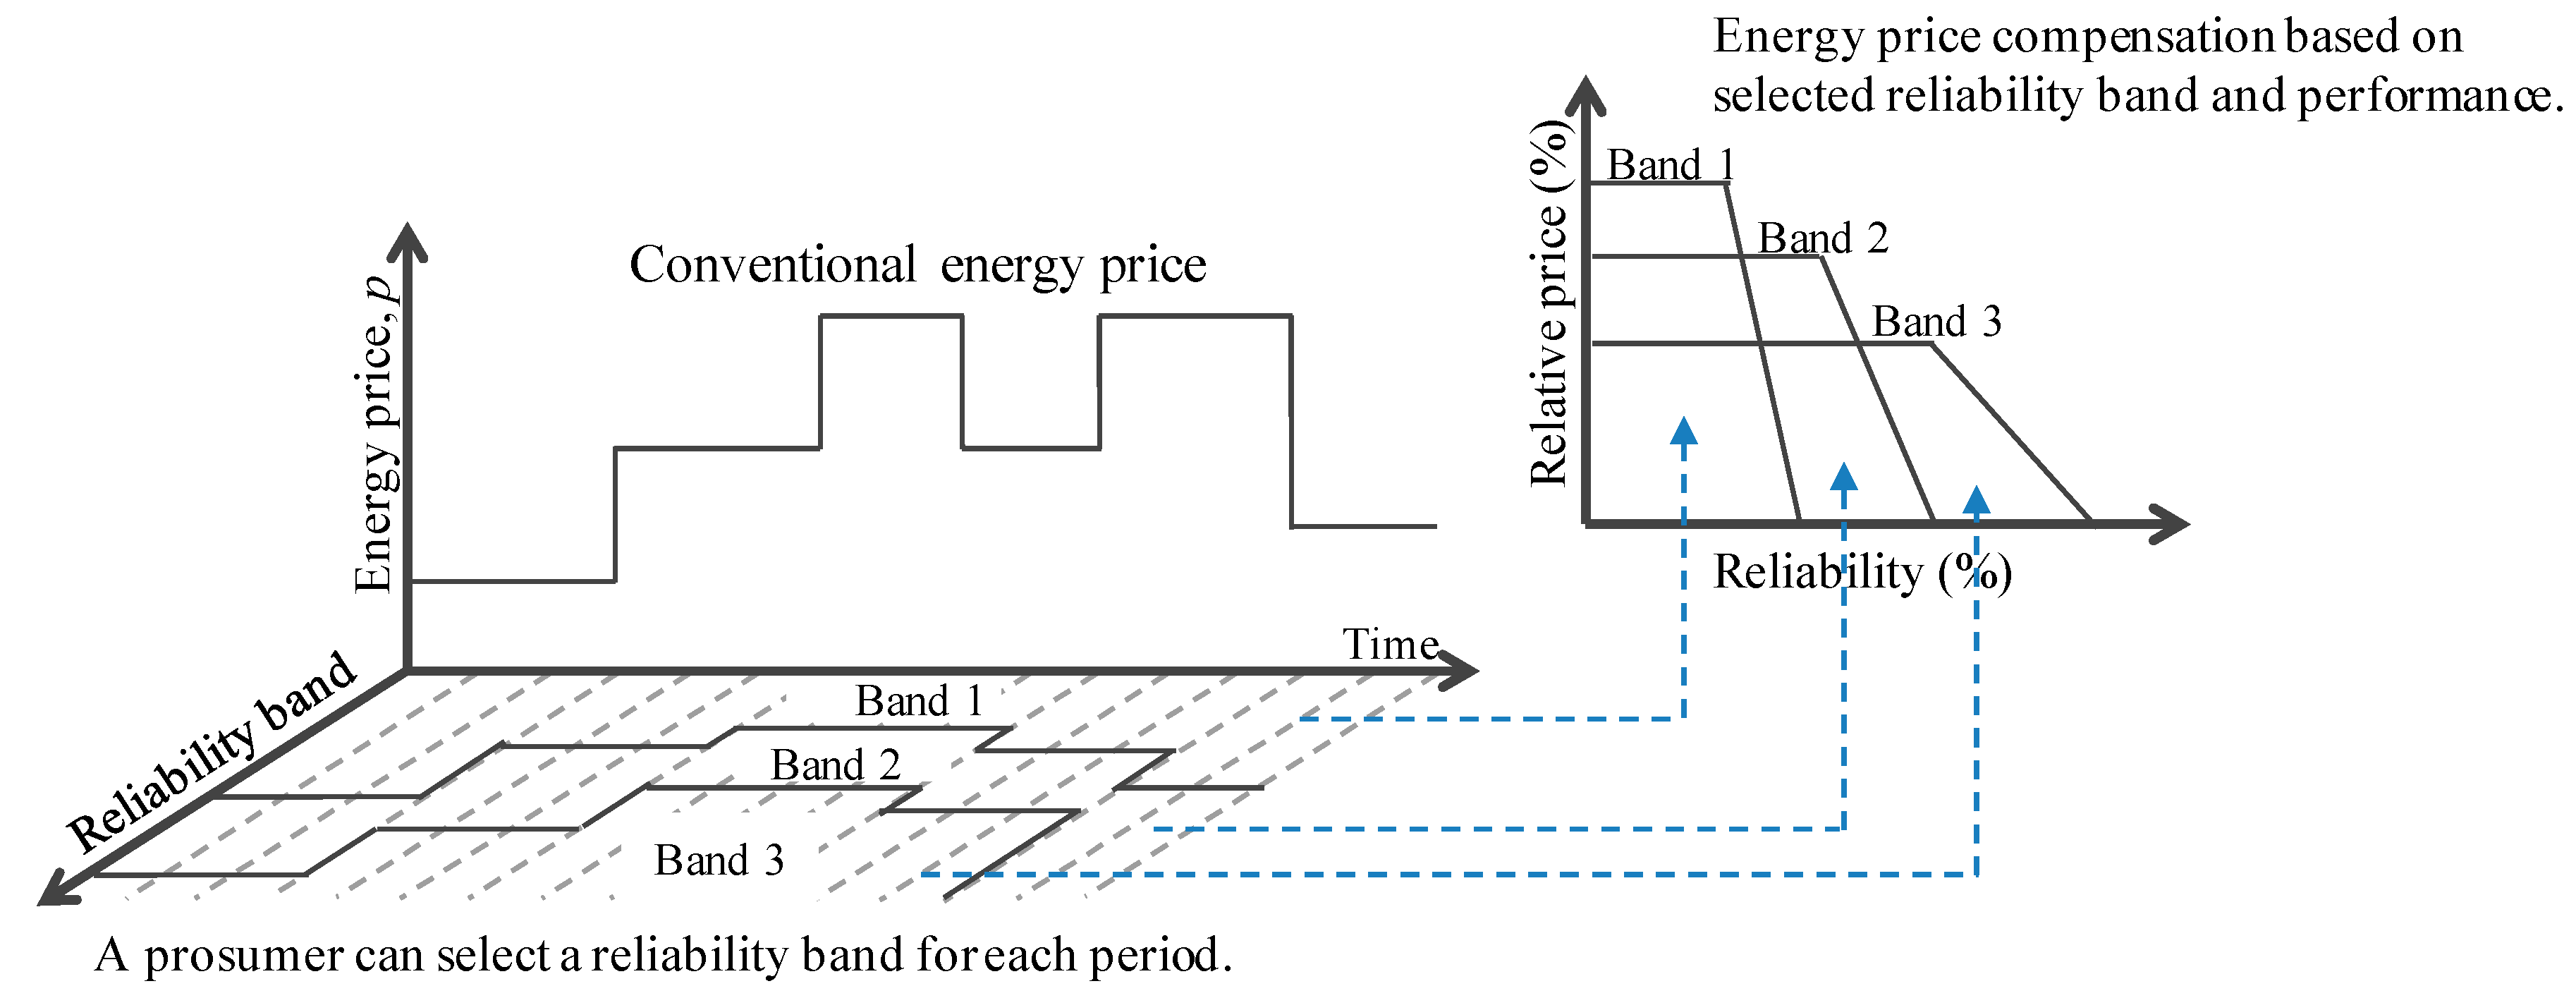
2.1. Energy-Reliability Pricing-Based Transaction Mechanism

A conventional energy-based dynamic price is announced by a utility or retailer, and consumers can control their demand considering the publicly announced price. The utility provides price information in one-way communication, and a consumer responds with their energy usage for each time period t . Here, the information is the only price on time, so the information can be considered one-dimensional. The conventional pricing is expressed as
P C o n v = { p 1 C , , p t C , , p T C } ,
where T is the operation time period.
Under the proposed dynamic energy-reliability pricing-based transaction mechanism (ERT), however, the utility announces reliability bands on time as well as price on time to prosumers, as shown in Figure 1. A prosumer responds to the utility with their expected demand and selected reliability band. The utility can announce the reliability price for each band for each time. Therefore, the communication is two-way. The proposed ERT is two-dimensional, since both the energy price and reliability price are included, as follows:
P E R T = { α 1 p 1 E , , α t p t E , , α T p T E } ,
where α t is a relative price in the range of [0, 1], as shown in Figure 1. The relative price is a multivariable function according to reliability γ t ( 0 ,   1 ] and band selection indicator β i , t { 0 , 1 } ,
α t ( β i , t , γ t ) = i B β i , t f i ( γ t ) ,
where B is a band set, e.g., three band (Band 1, Band 2, Band 3) in Figure 1.
A comparison between the conventional pricing mechanism and the proposed ERT is summarized in Table 1.
Energy usage intentions are indirectly controlled in conventional price-based systems using unit prices for specific times. Under the ERT, additional information is used to understand prosumers’ intention regarding energy usage, and uncertainty is managed differently than in conventional price-based systems.

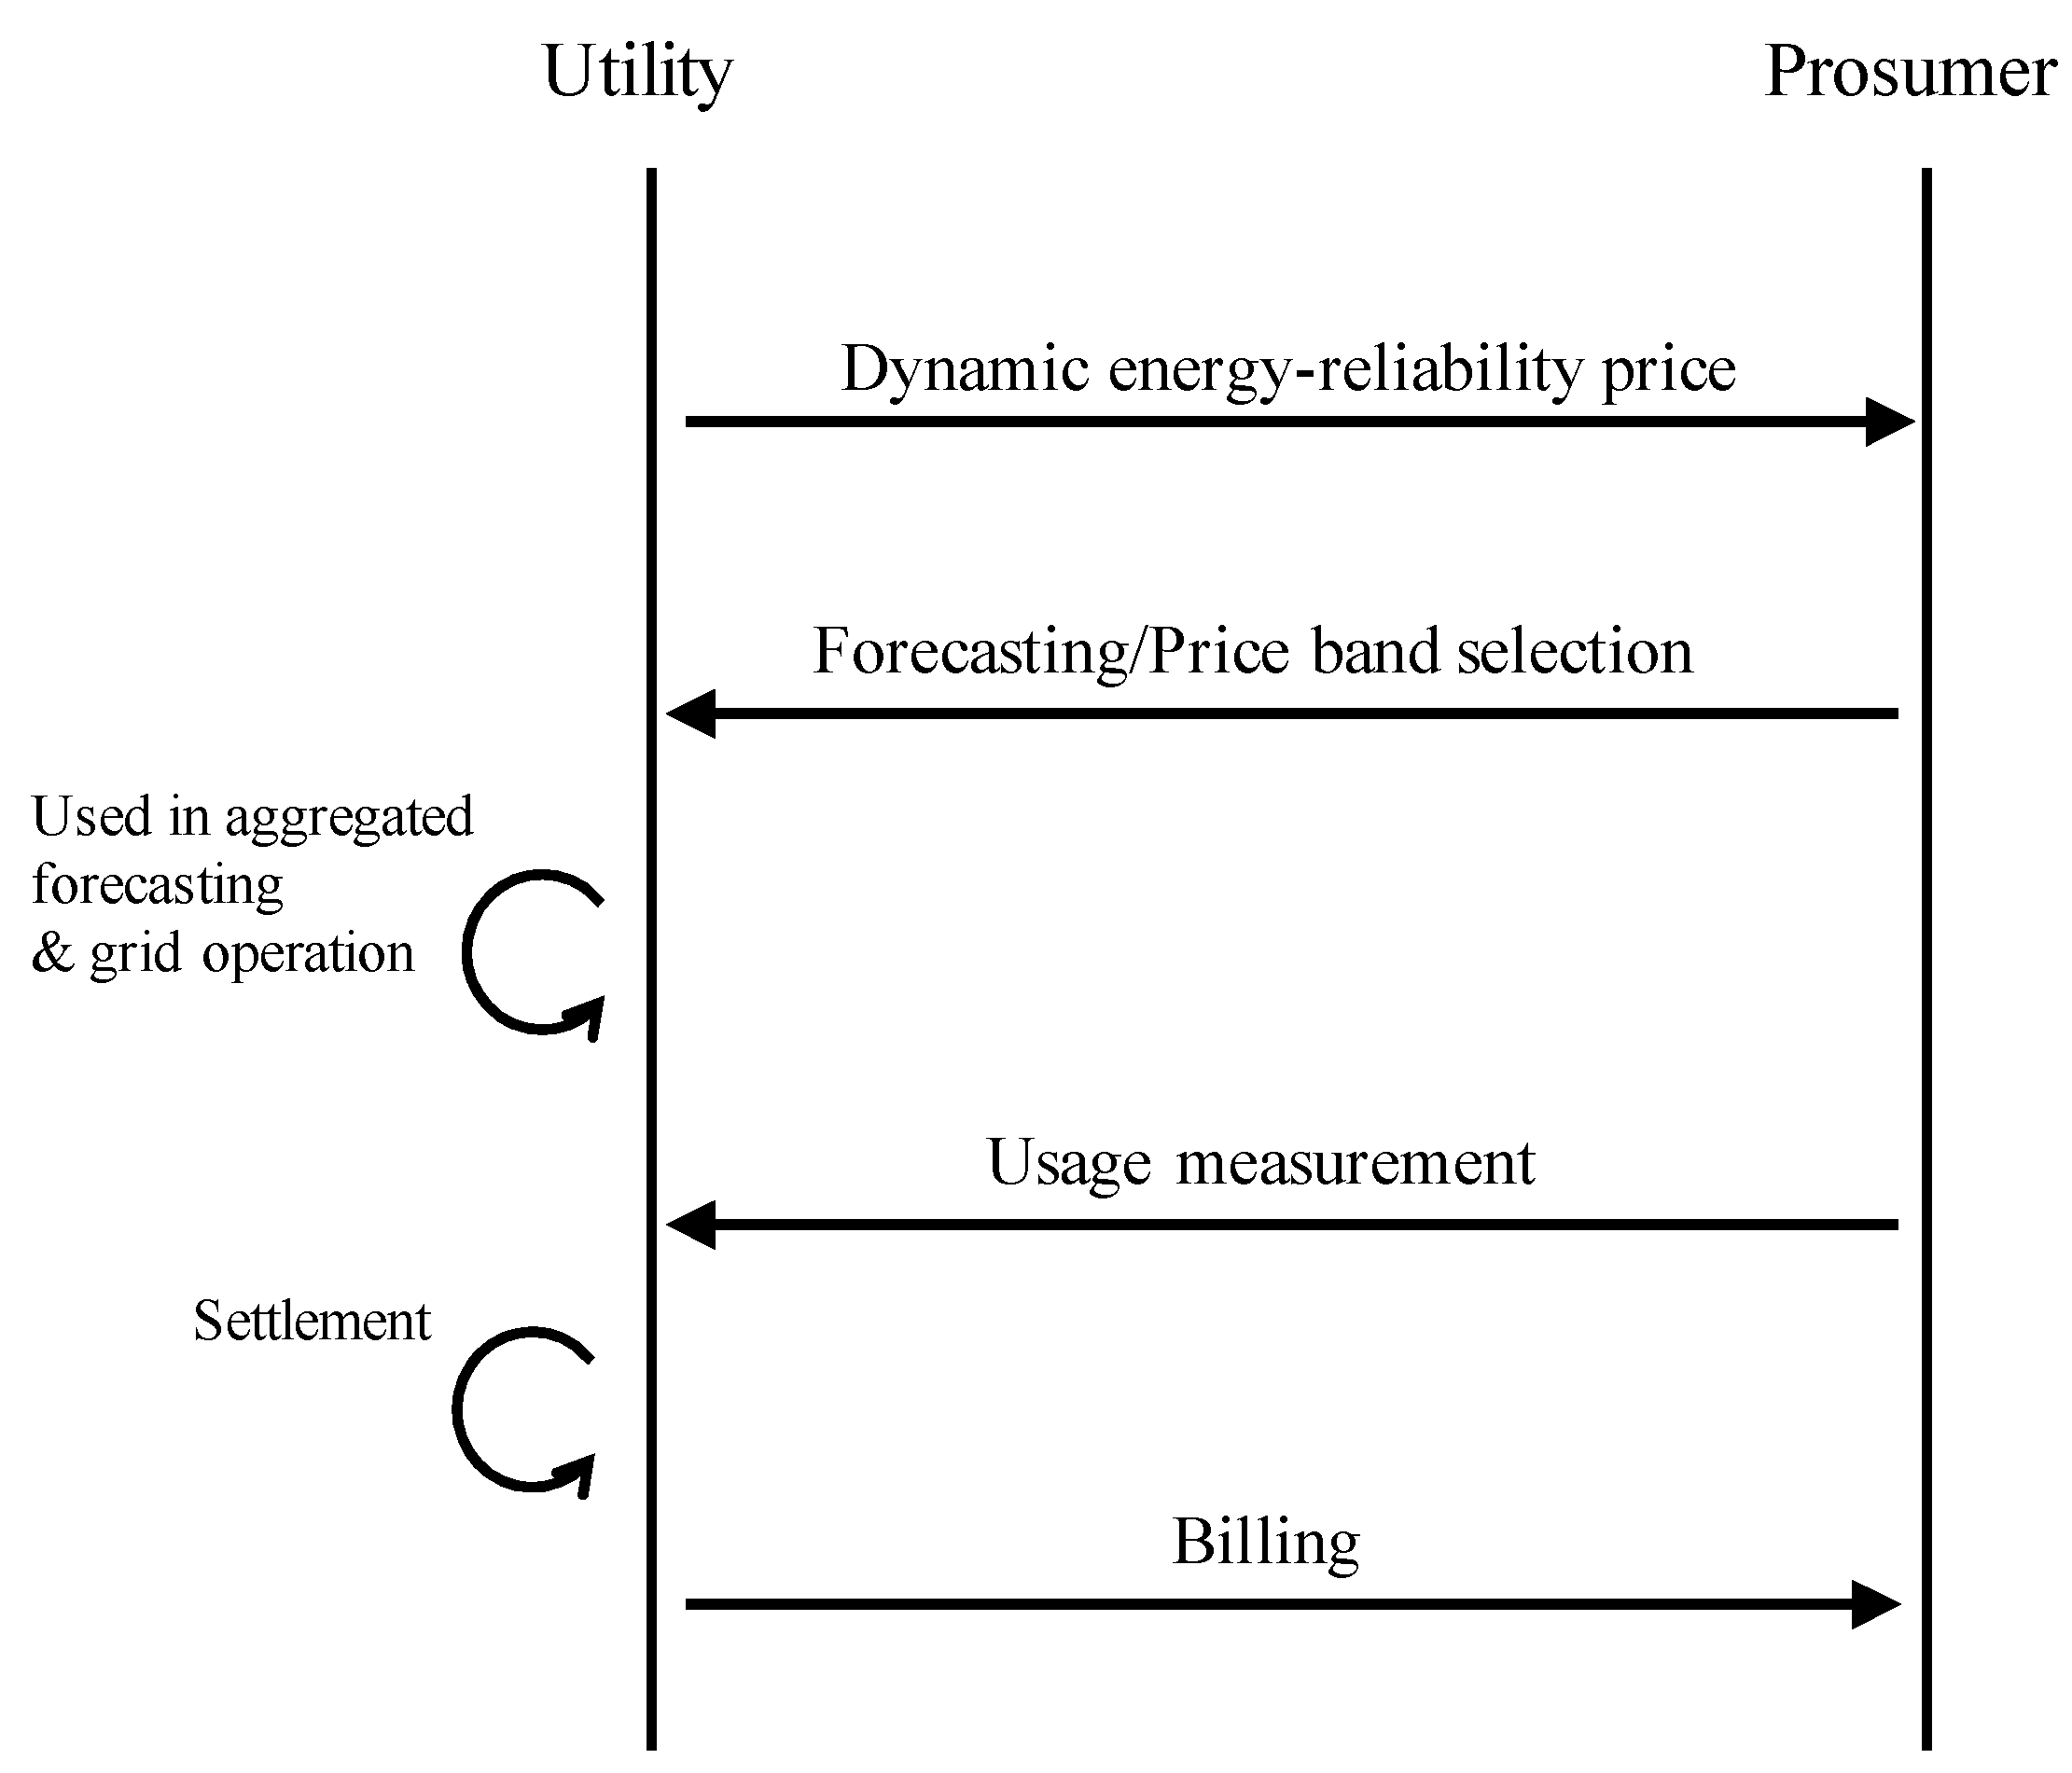
2.2. ERT Operation Procedure

Figure 2 shows the operation sequence of the proposed ERT mechanism.
(Step 1.
ERT announcement) First, a utility or retailer announces the ERT, P E R T , which consists of energy prices and corresponding reliability bands. Basically, the energy price would similarly change over time but should be differently rewarded depending on the quality of a prosumer’s resources.
(Step 2.
Reliability forecasting and band selection) Under the ERT, prosumers should forecast their energy consumption or production, E ^ = { e ^ 1 , , e ^ t , e ^ T } ; this is an essential contribution from the prosumer. In addition, they need to forecast the uncertainty of their energy forecast γ ^ = { γ ^ 1 , , γ ^ t , γ ^ T } . When a prosumer understands their own resource characteristics, they can select the most appropriate reliability band or strategically change their operation plans to maximize their expected benefit by deducing potential risks, as follows:
β i * , t = arg max i B α t ( β i , t , γ ^ t ) p t e ^ t , t T .
Prosumers can even decide to invest in additional infrastructures, such as EES, to increase their forecast accuracy and to reduce their uncertainty. Once a prosumer forecasts their energy usage and uncertainty considering their resource characteristics and operation plan, the forecast and selected uncertainty level-based band are sent to the utility.
(Step 3.
Settlement and billing) The utility aggregates the individual prosumer forecasts and commitments, incorporating this information into its own forecasts and grid operation plans. The basic assumption here is that, by obtaining prosumers’ forecast and band selection information, a utility can increase its own forecasting accuracy regarding both amount and uncertainty. Even if the utility’s forecast based on this information includes errors, it can minimize its financial risk by penalizing prosumers for inaccurate forecasting. Based on a prosumers’ band price selection, the utility or prosumer can perform settlement based on the prosumer’s energy usage. Then, billing occurs as usual,
Energy bill = t T α t ( β i * , t , γ t ) p t e t .

3. ERT Implementation Issues

To apply the ERT, various methodologies can be considered for a dynamic energy-reliability price on the utility side and forecasting and band selection on the prosumer side. It is structured according to the operating purpose of the system and the resource characteristics that the players (utility and prosumer) have. This section presents ERT implementation issues from both the utility and prosumer sides and provides basic guidance for applying the ERT.

3.1. Utility Side

When applying the proposed ERT, the grid utility announces not only the energy price but also the reliability price and band for each operational time horizon. The energy price is determined by cost-balancing of the utility and prosumer, as under the existing pricing concept. The reliability price and band are decided considering utility requirements and prosumer characteristics.

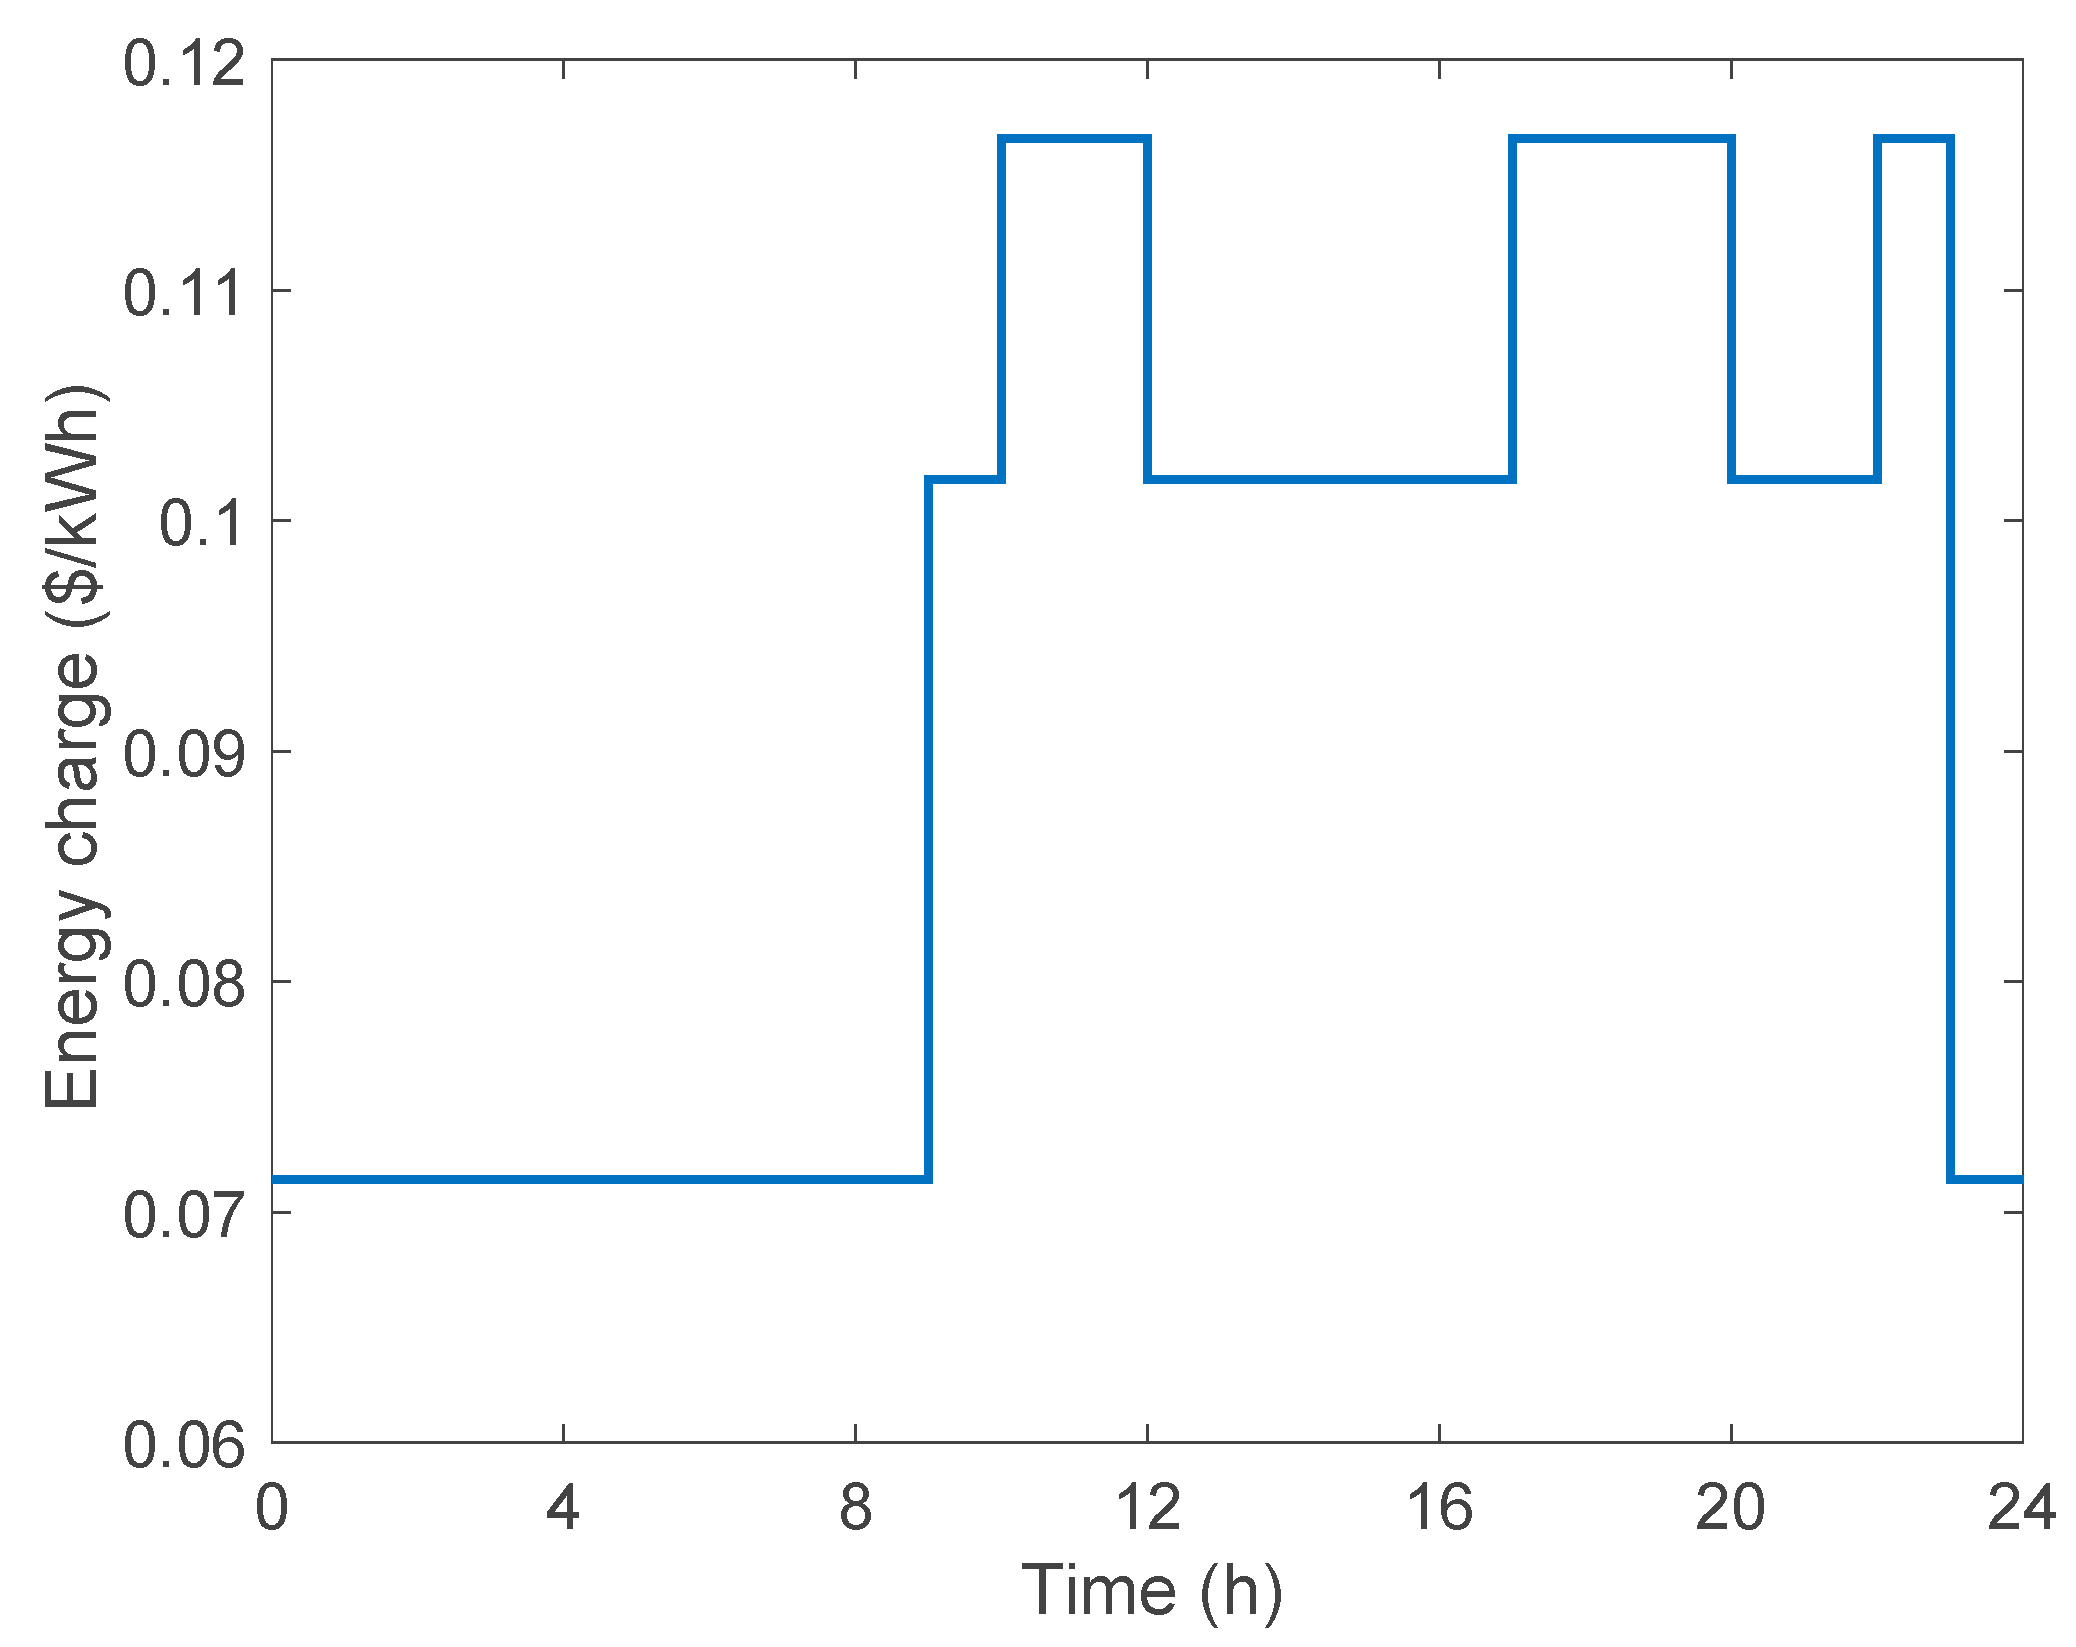
3.1.1. Energy Price Design

The basic principle involved in a price is to achieve a balance between the utility’s income from grid operation and the prosumers’ benefit from supplying/consuming energy. The price at each time is designed considering business sustainability and economic efficiency [19]. The proposed pricing mechanism requires more information about uncertainty generated from the prosumer side. This information enhances grid reliability and reduces the operational costs associated with the risk of uncertainty. In this manner, the utility sets up a price at each time considering the grid reliability enhancement and business sustainability. Figure 3 shows a TOU pricing example of Korea Electric Power Company (KEPCO) [20]. It is designed to reflect the temporal energy demand and supply change. The value of conventional pricing can be used as a baseline control,
P t E = p t C , t T .

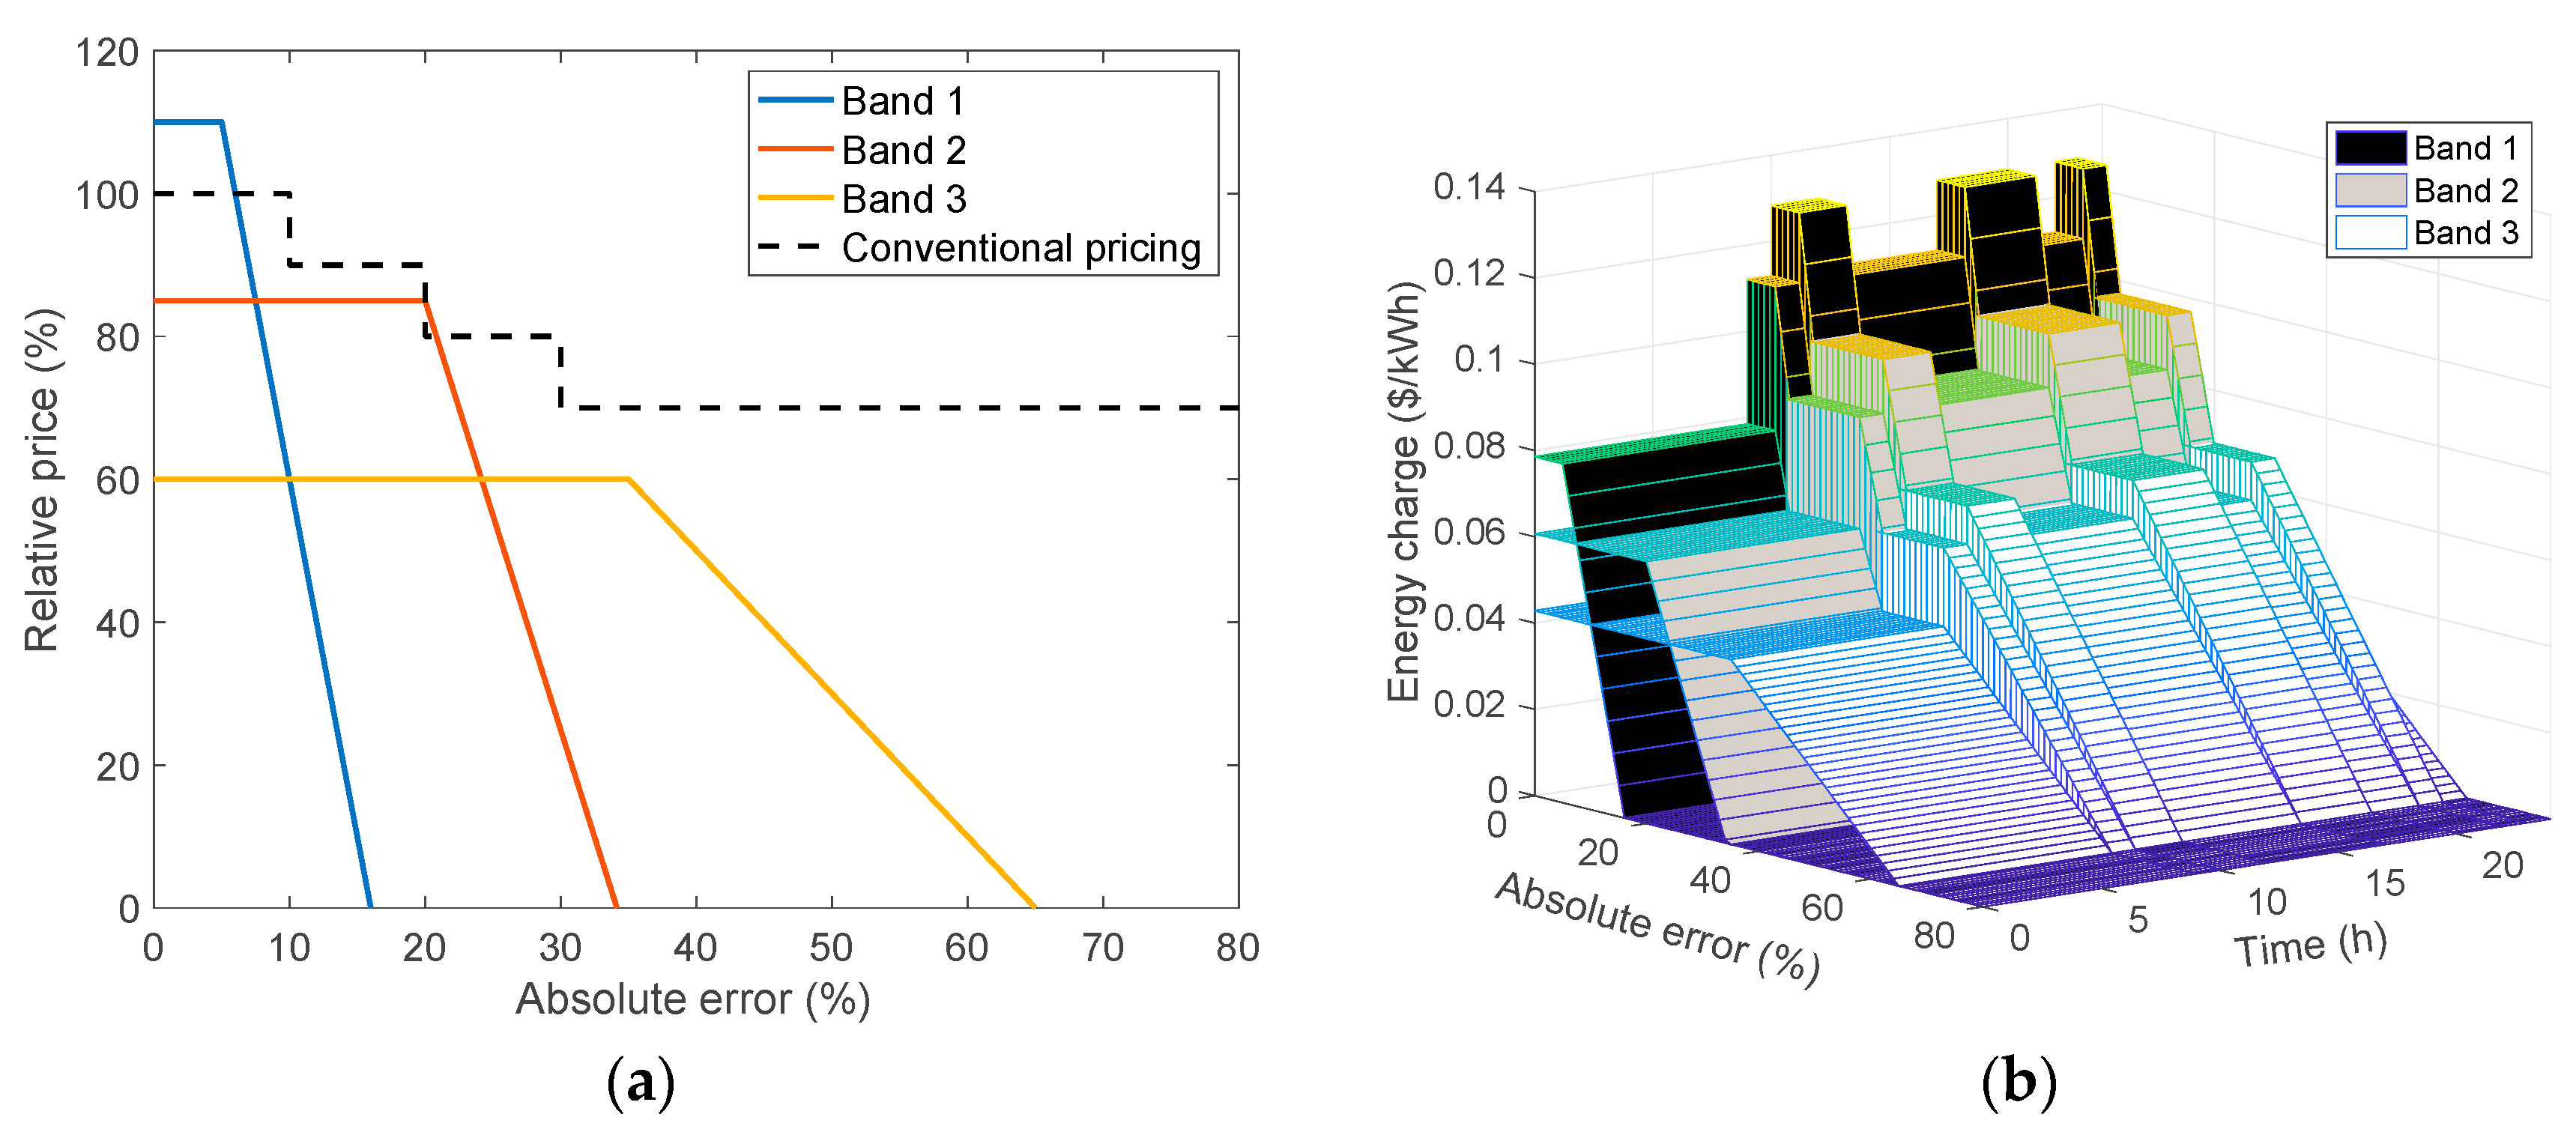
3.1.2. Reliability Band and Price Design

In the proposed ERT, the reliability band and price are adjusted according to the utility’s requirements. Basically, the reliability band is narrow and the price is set high where the utility requires high reliability. On the other hand, however, this leads to discrimination between prosumers with different characteristics.
Another way to design the reliability band and price is to consider prosumer priority in terms of the utility. Figure 4 shows the contribution of wind generation at net demand from the Bonneville Power Administration (BPA) balancing authority in 2016 [21]. Relative to contribution, the utility decides the prosumer priority, and it is used as a reference to determine the reliability band range. In Figure 4, the average contribution of wind generation is around 22%, so the priority ω t is set as 3 for 25% or more, 2 for 25–20%, and 1 for less than 20% as an example. Using the priority, the utility designs the relative price function in (3). Narrower reliability bands will be allocated to the higher priorities to effectively manage uncertainty, as follows:
f i ( γ t ) = { 1 , γ t 1 ω t , γ t + 1 , o t h e r w i s e .

3.2. Prosumer Side

Under a conventional price, prosumers passively receive an energy bill related to their usage, whereas, under the ERT, their energy bill is dynamically determined through their own operation and selection. To maximize their benefits under the ERT, a prosumer estimates their own demand and selects their own reliability band.

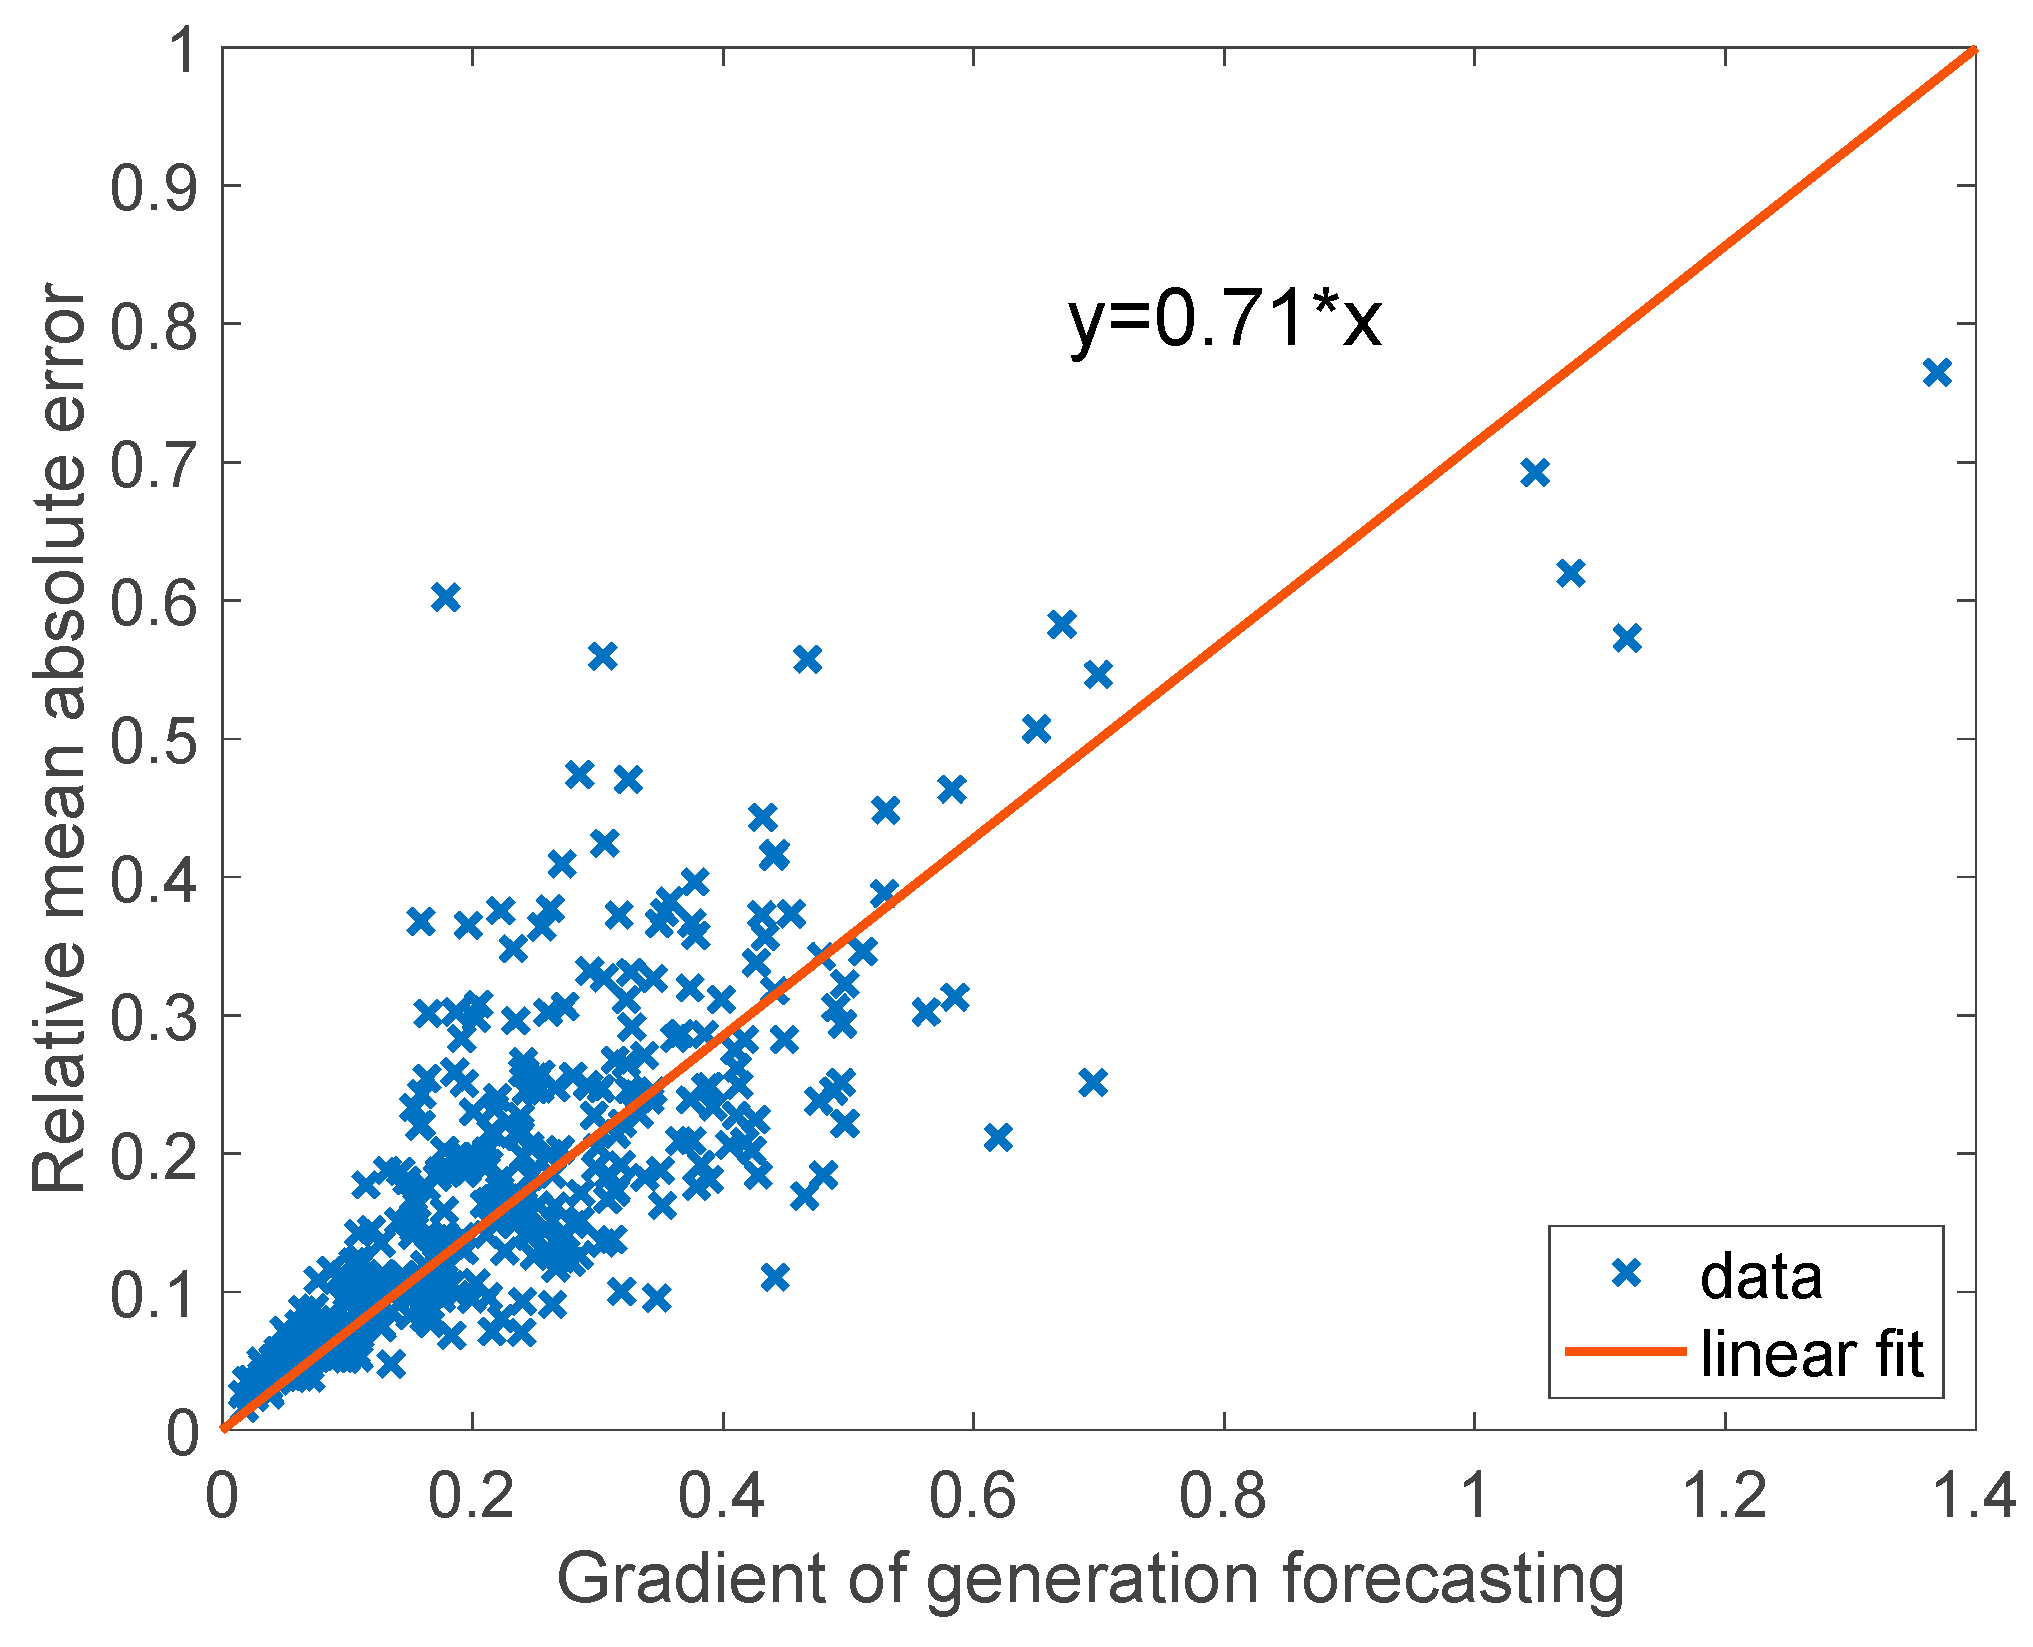
3.2.1. Demand Forecasting

The ERT suggests a different price on time and reliability status. To decide the best way to reduce an energy bill and to enhance their benefits, a prosumer should know their own situation. The basic way to estimate demand is using a conventional load forecasting method, such as the customer baseline load (CBL) [22,23] or the renewable generation forecasting method [24,25]. Another way is controlling demand using prosumer characteristics. Internally controlling the load and generation, a prosumer selects a demand to maximize their benefit. However, this requires additional operation with high risk and complexity caused by two uncertain demand sets.

3.2.2. Reliability Band Selection
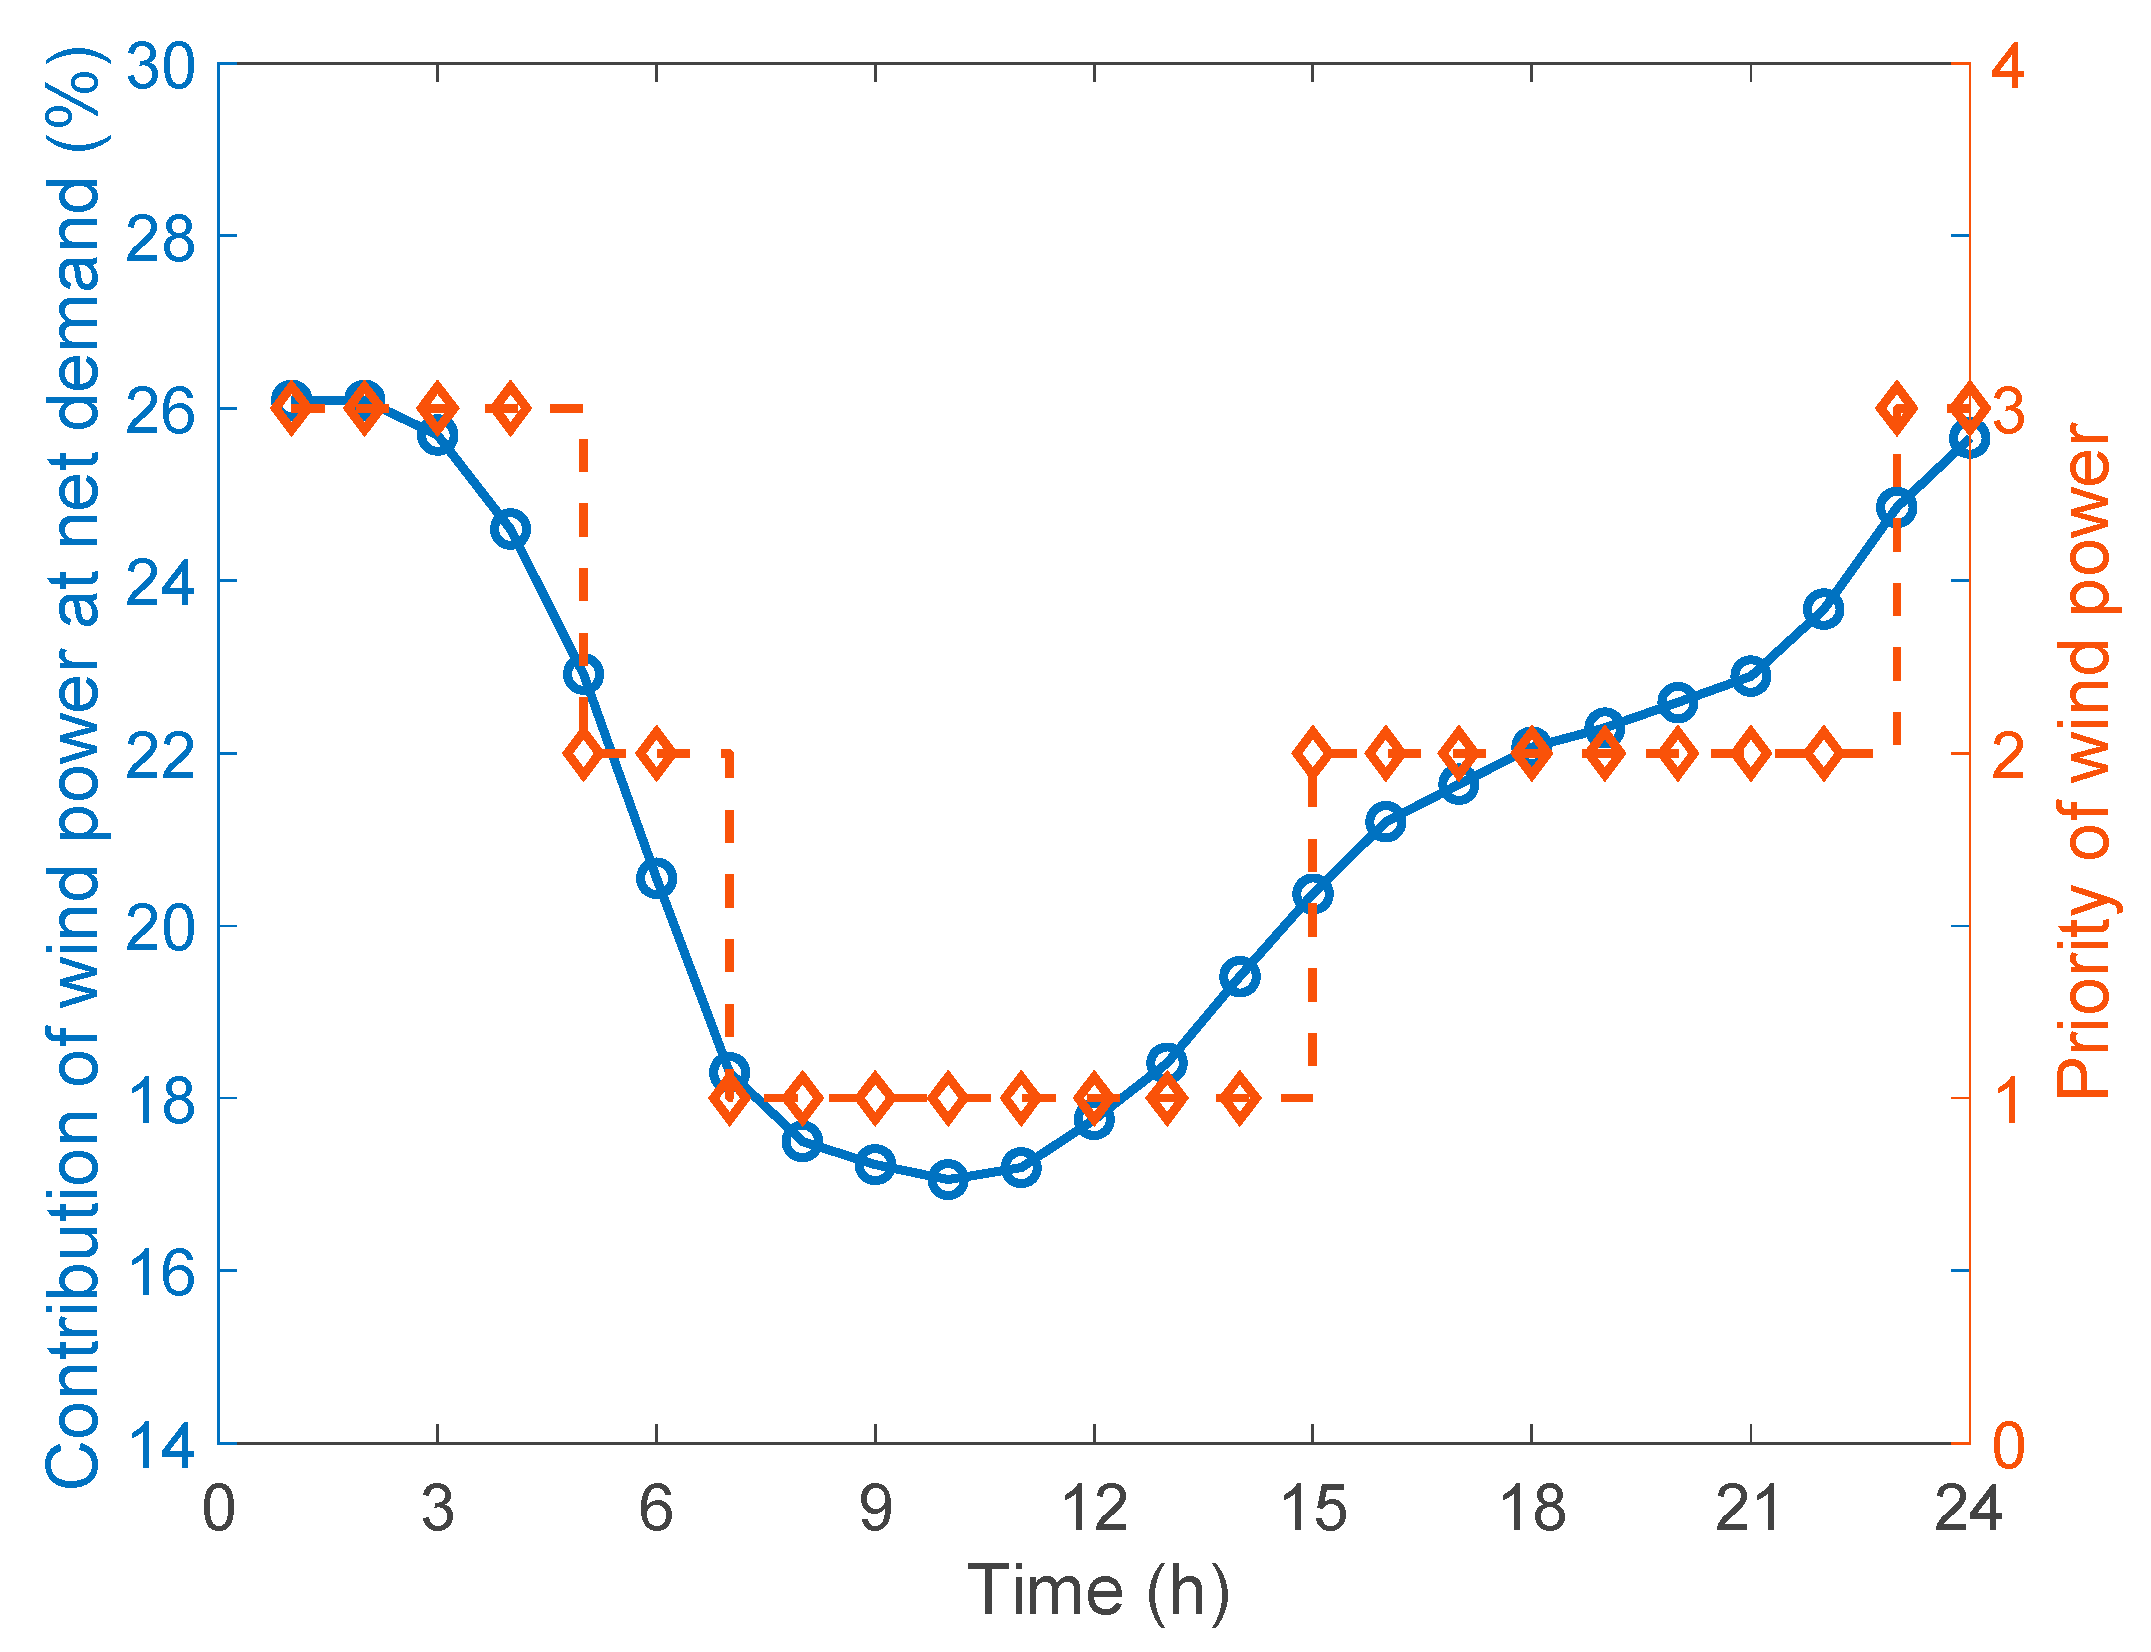
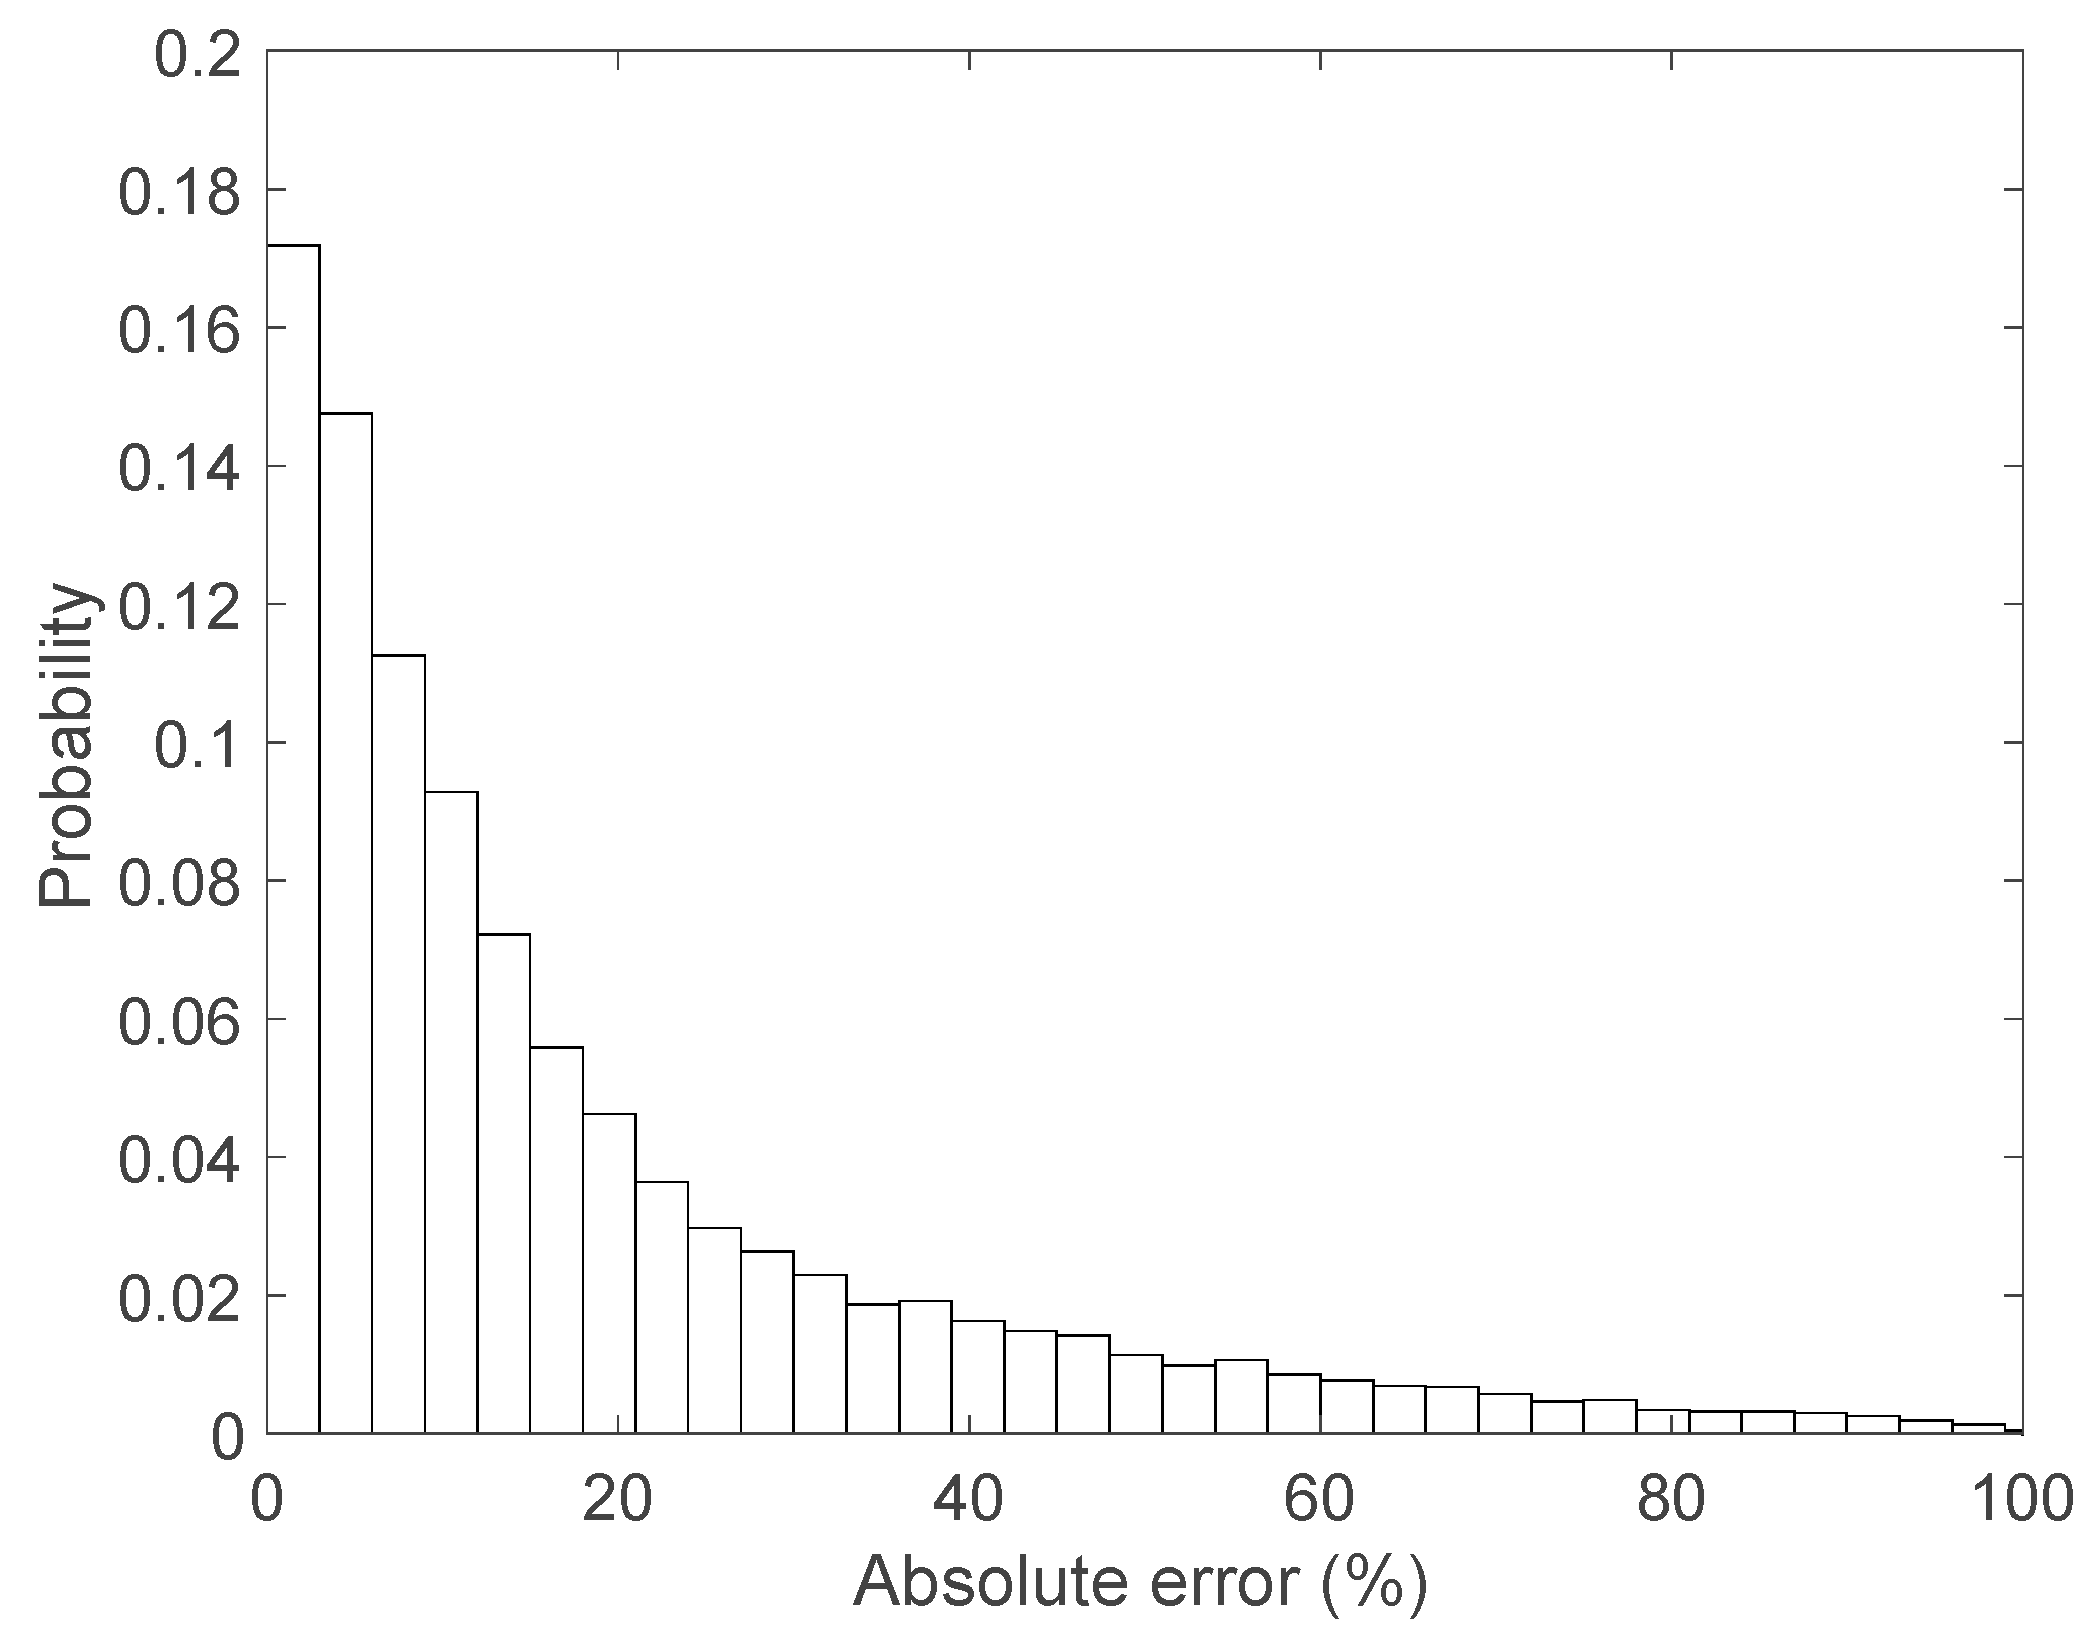
To select a reliability band, the reliability of the forecasted value at each operational time horizon is required. Conventional forecasting methods, such as CBL, do not provide the value nor provide it as a probabilistic average. The reliability of the forecasted value is related to the accuracy of the demand forecasting. Figure 5 shows the relationship between the gradient of forecasting and the accuracy of BPA’s wind generation [26,27]. Prosumers can estimate the reliability as an example method,
γ ^ t = κ | e ^ t e ^ t 1 | ,
and, substituting (8) into (4), they select the reliability band.
Similar to the internal control for demand forecasting, the reliability is also enhanced using additional control afforded by energy storage. The selection of a high-reliability band with additional control enhances potential benefits. However, this increases both the operational burden of prosumers and their costs from additional equipment (such as energy storage).

4. Case Study

In this section, the performance of the proposed ERT is evaluated compared to a conventional penalty-based dynamic pricing mechanism, and the characteristics of the proposed method are discussed.

4.1. Experimental Environment

A case study was performed where the proposed ERT was applied as the energy price when the prosumers supply the energy. Although it only focuses on the energy supply price for the prosumer as a producer, the proposed work can also be applied to the case when the prosumer purchases energy as well.
Figure 6 shows the incentive and penalty plan of conventional pricing and the ERT. The incentive and penalty band of the proposed price has a different range and slop at each band shown as lines in Figure 6a. By adjusting these bands, the utility controls the prosumer’s responsiveness. As shown in Figure 6b, the dynamic energy-reliability pricing is determined by combining the incentive-penalty band to control the reliability and the energy price on time to manage energy consumption.
To compare the performance, an energy price with a step-down penalty charge α t c ( γ t ) [28] was considered as the conventional case, expressed as conventional pricing shown as a dashed line in Figure 6a. For a fair comparison, the band of the proposed price, α t ( β i , t , γ t ) , is designed to have the same revenue as the conventional pricing case when they do not make any effort,
t T α t c ( γ t ) p t e t = t T α t ( β i , t , γ t ) p t e t .
Assuming a three-band case, the values are numerically determined in order to have the same expected revenue using the probability distribution of absolute errors as shown in Figure 7.
Under both the conventional pricing case and the proposed ERT, the prosumer (producer in this case) achieves the same annual revenue when operating the generator without management response to the energy price. The value without management was used as the reference value, and, for confirming the performance, the value was evaluated when EES was added and optimally operated to maximize prosumer revenue.
The energy supply data used comes from the BPA, United States Department of Energy [21]. The BPA controls 42 wind plant sites concentrated in the Columbia River Gorge that spans northern Oregon and southern Washington, and its total capacity in 2016 was around 4600 MW. Wind power generation data and forecasts over 360 days in 2016 were used and are presented in Figure 4, Figure 5 and Figure 7.

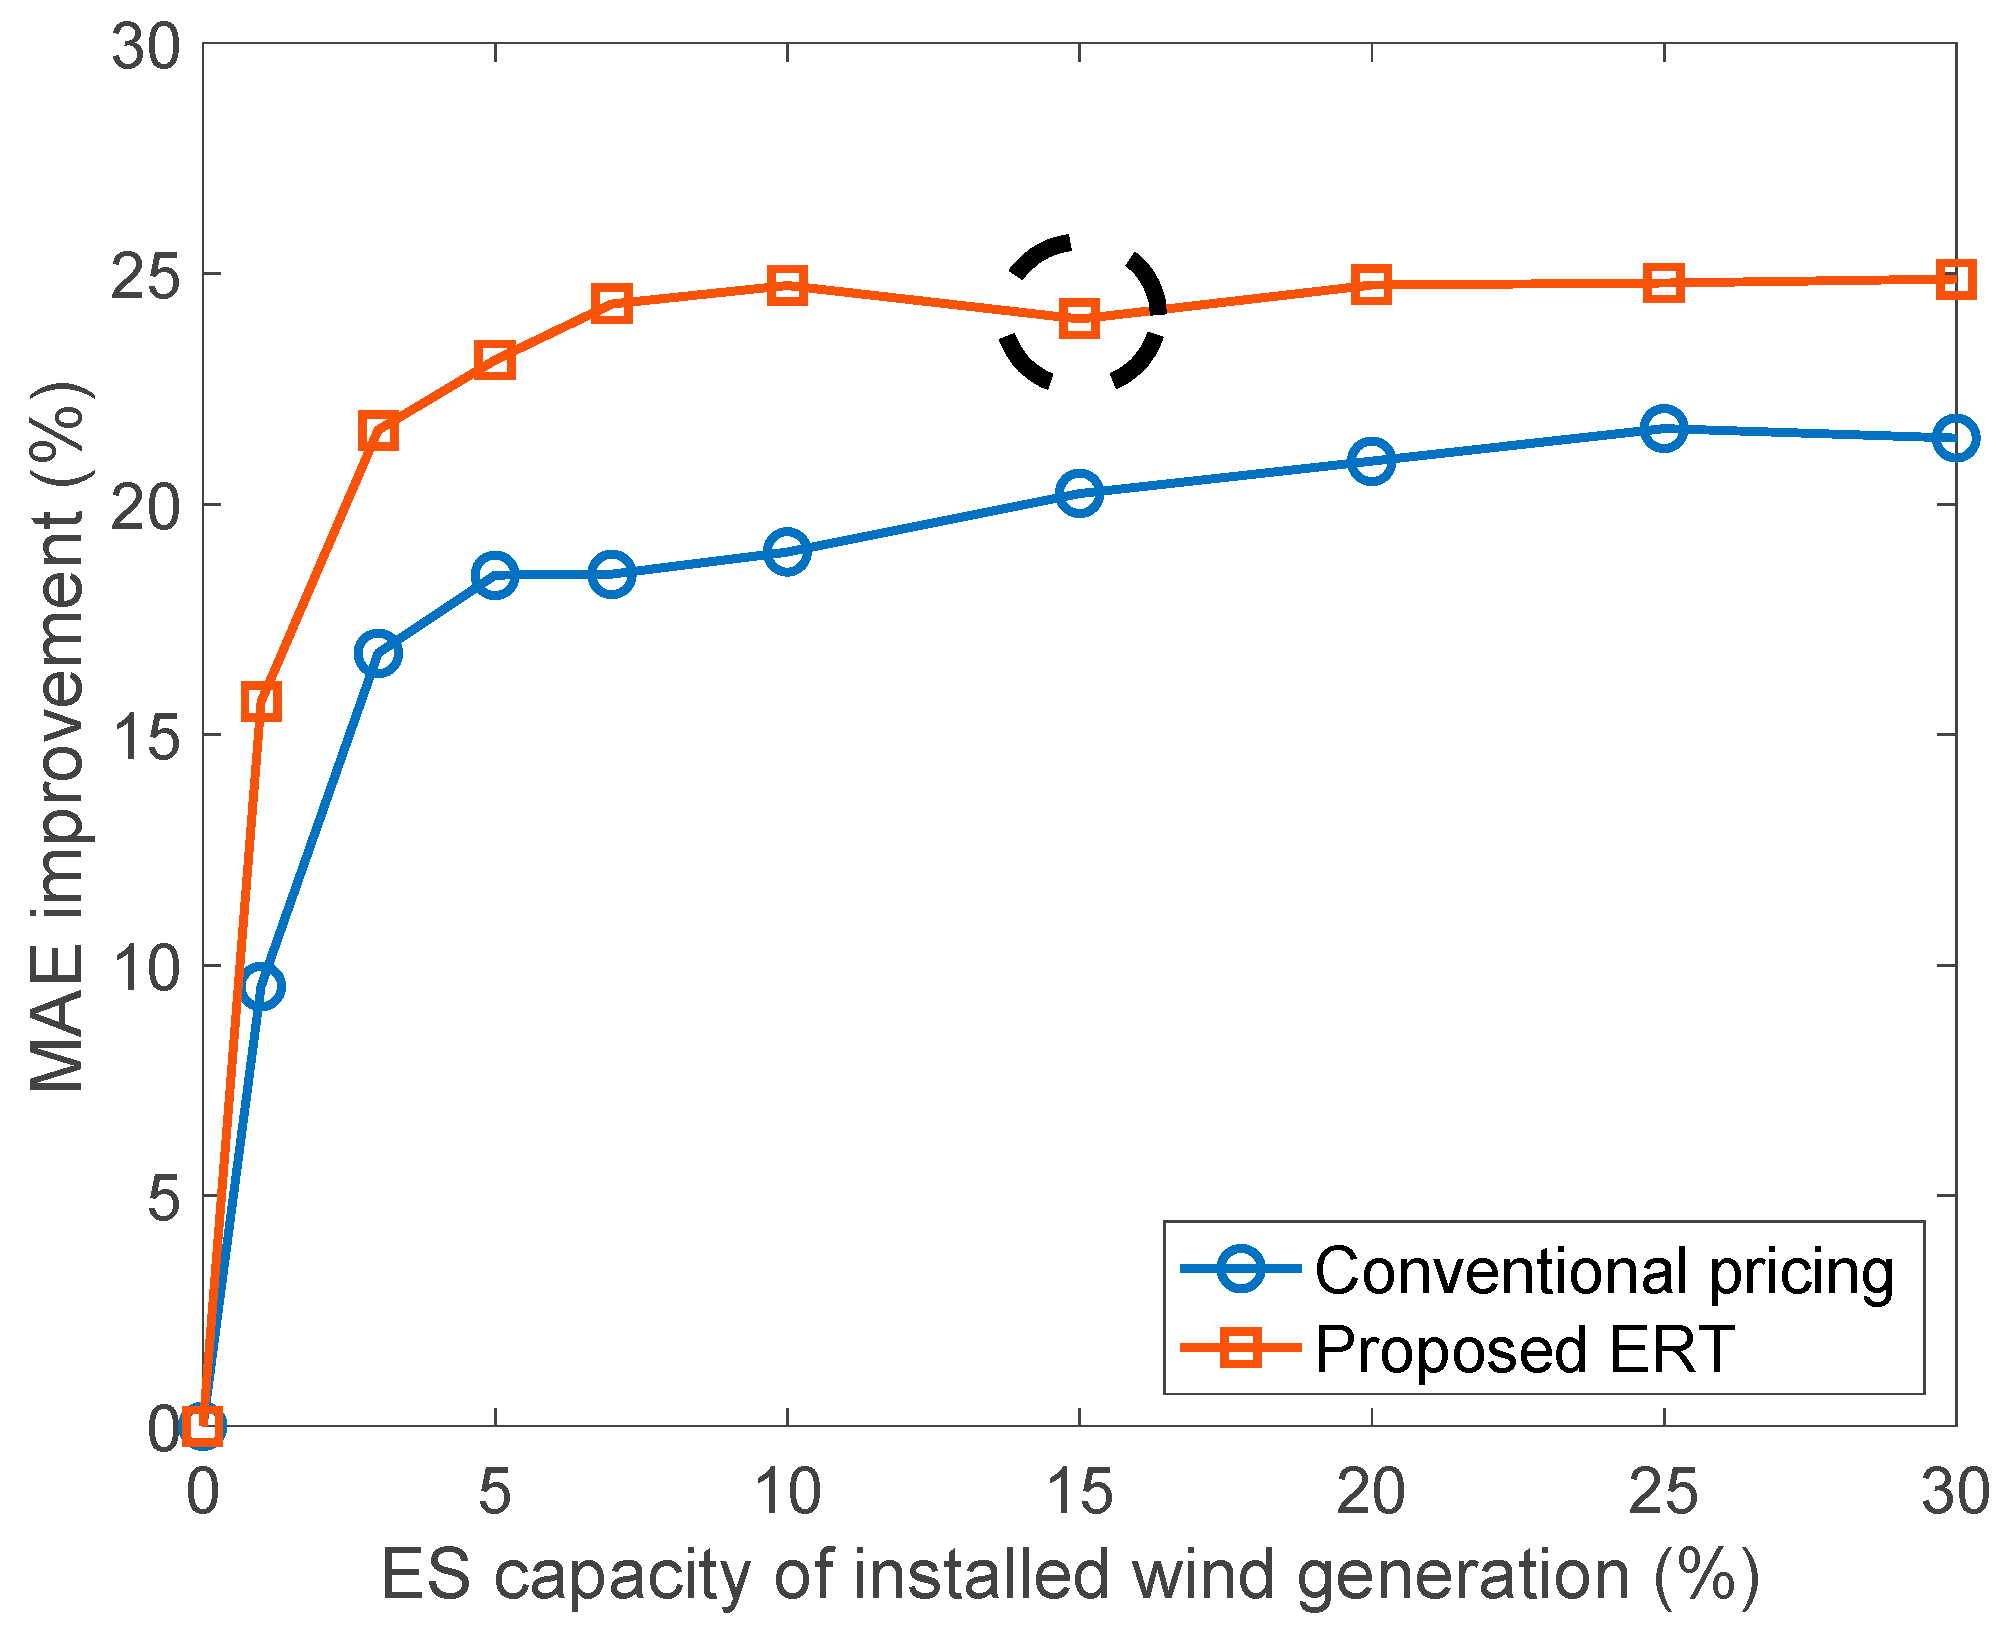
4.2. Performance Evaluation

For a transaction mechanism to work well, the benefits for both the prosumer and the utility should be preserved. The revenue for the prosumer and the reliability for the utility were considered to verify the performance of the proposed mechanism.

4.2.1. Prosumer Revenue

Figure 8 shows the revenue enhancement by the conventional pricing and the proposed ERT when the size of EES is increased to 30% of the installed generation capacity. The EES is operated to maximize prosumer revenue by reducing the error between the generated forecasting and the actual generation, so the revenue is enhanced in the dynamic prices. The revenue converges on a 4% enhancement over the conventional pricing, but the value in the proposed ERT grows continuously, up to a value three times higher than that under the conventional pricing. This shows that the proposed ERT is designed to work well in relation to prosumer dynamics, giving the prosumer greater motivation.

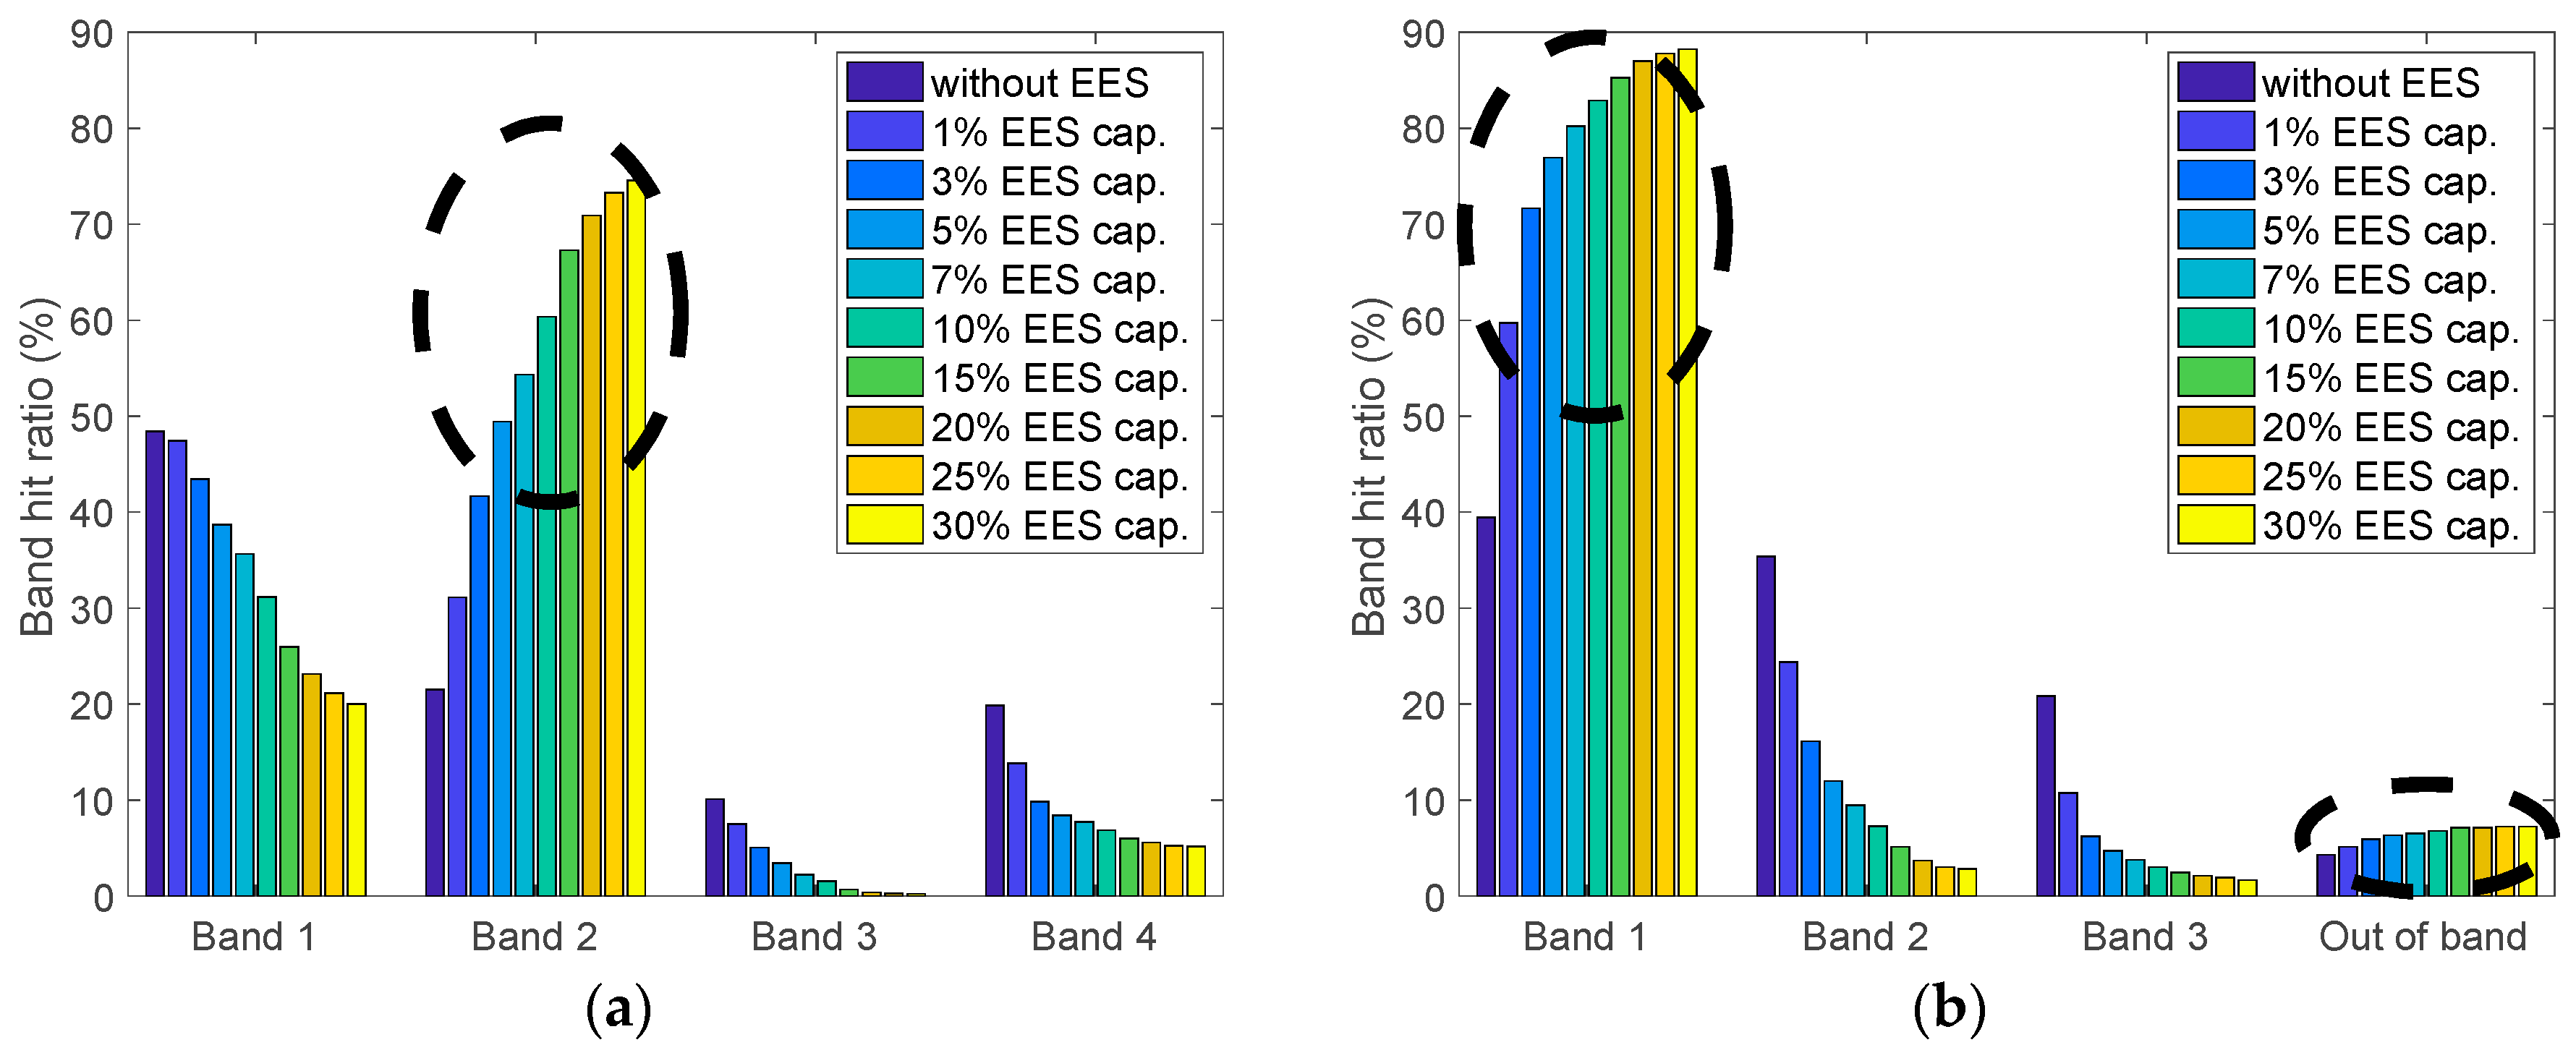
4.2.2. Grid Reliability

For utility, grid reliability can be defined as such factors as voltage stability and frequency regulation state maintenance [29]. It is required for better situational awareness and operator assistance to improve grid reliability [5]. The predictability is an important term that affects reliability. In this work, the mean absolute error (MAE) between the actual generation and its forecasting is used as a performance metric to measure predictability. In Figure 8, the MAE improves with increasing EES capacity. It is said that grid reliability improves with increasing EES capacity. Additionally, the MAE under the proposed ERT has a lower value than that under the conventional pricing mechanism. This means that the implementation of the proposed ERT effectively improves grid reliability versus the conventional pricing case. However, the MAE is not monotonically improved, as shown by the proposed ERT case with 15% EES capacity of installed generation (the point in the dashed circle in Figure 9). This is because the performance of MAE not only relates to the price but also the generation characteristics.

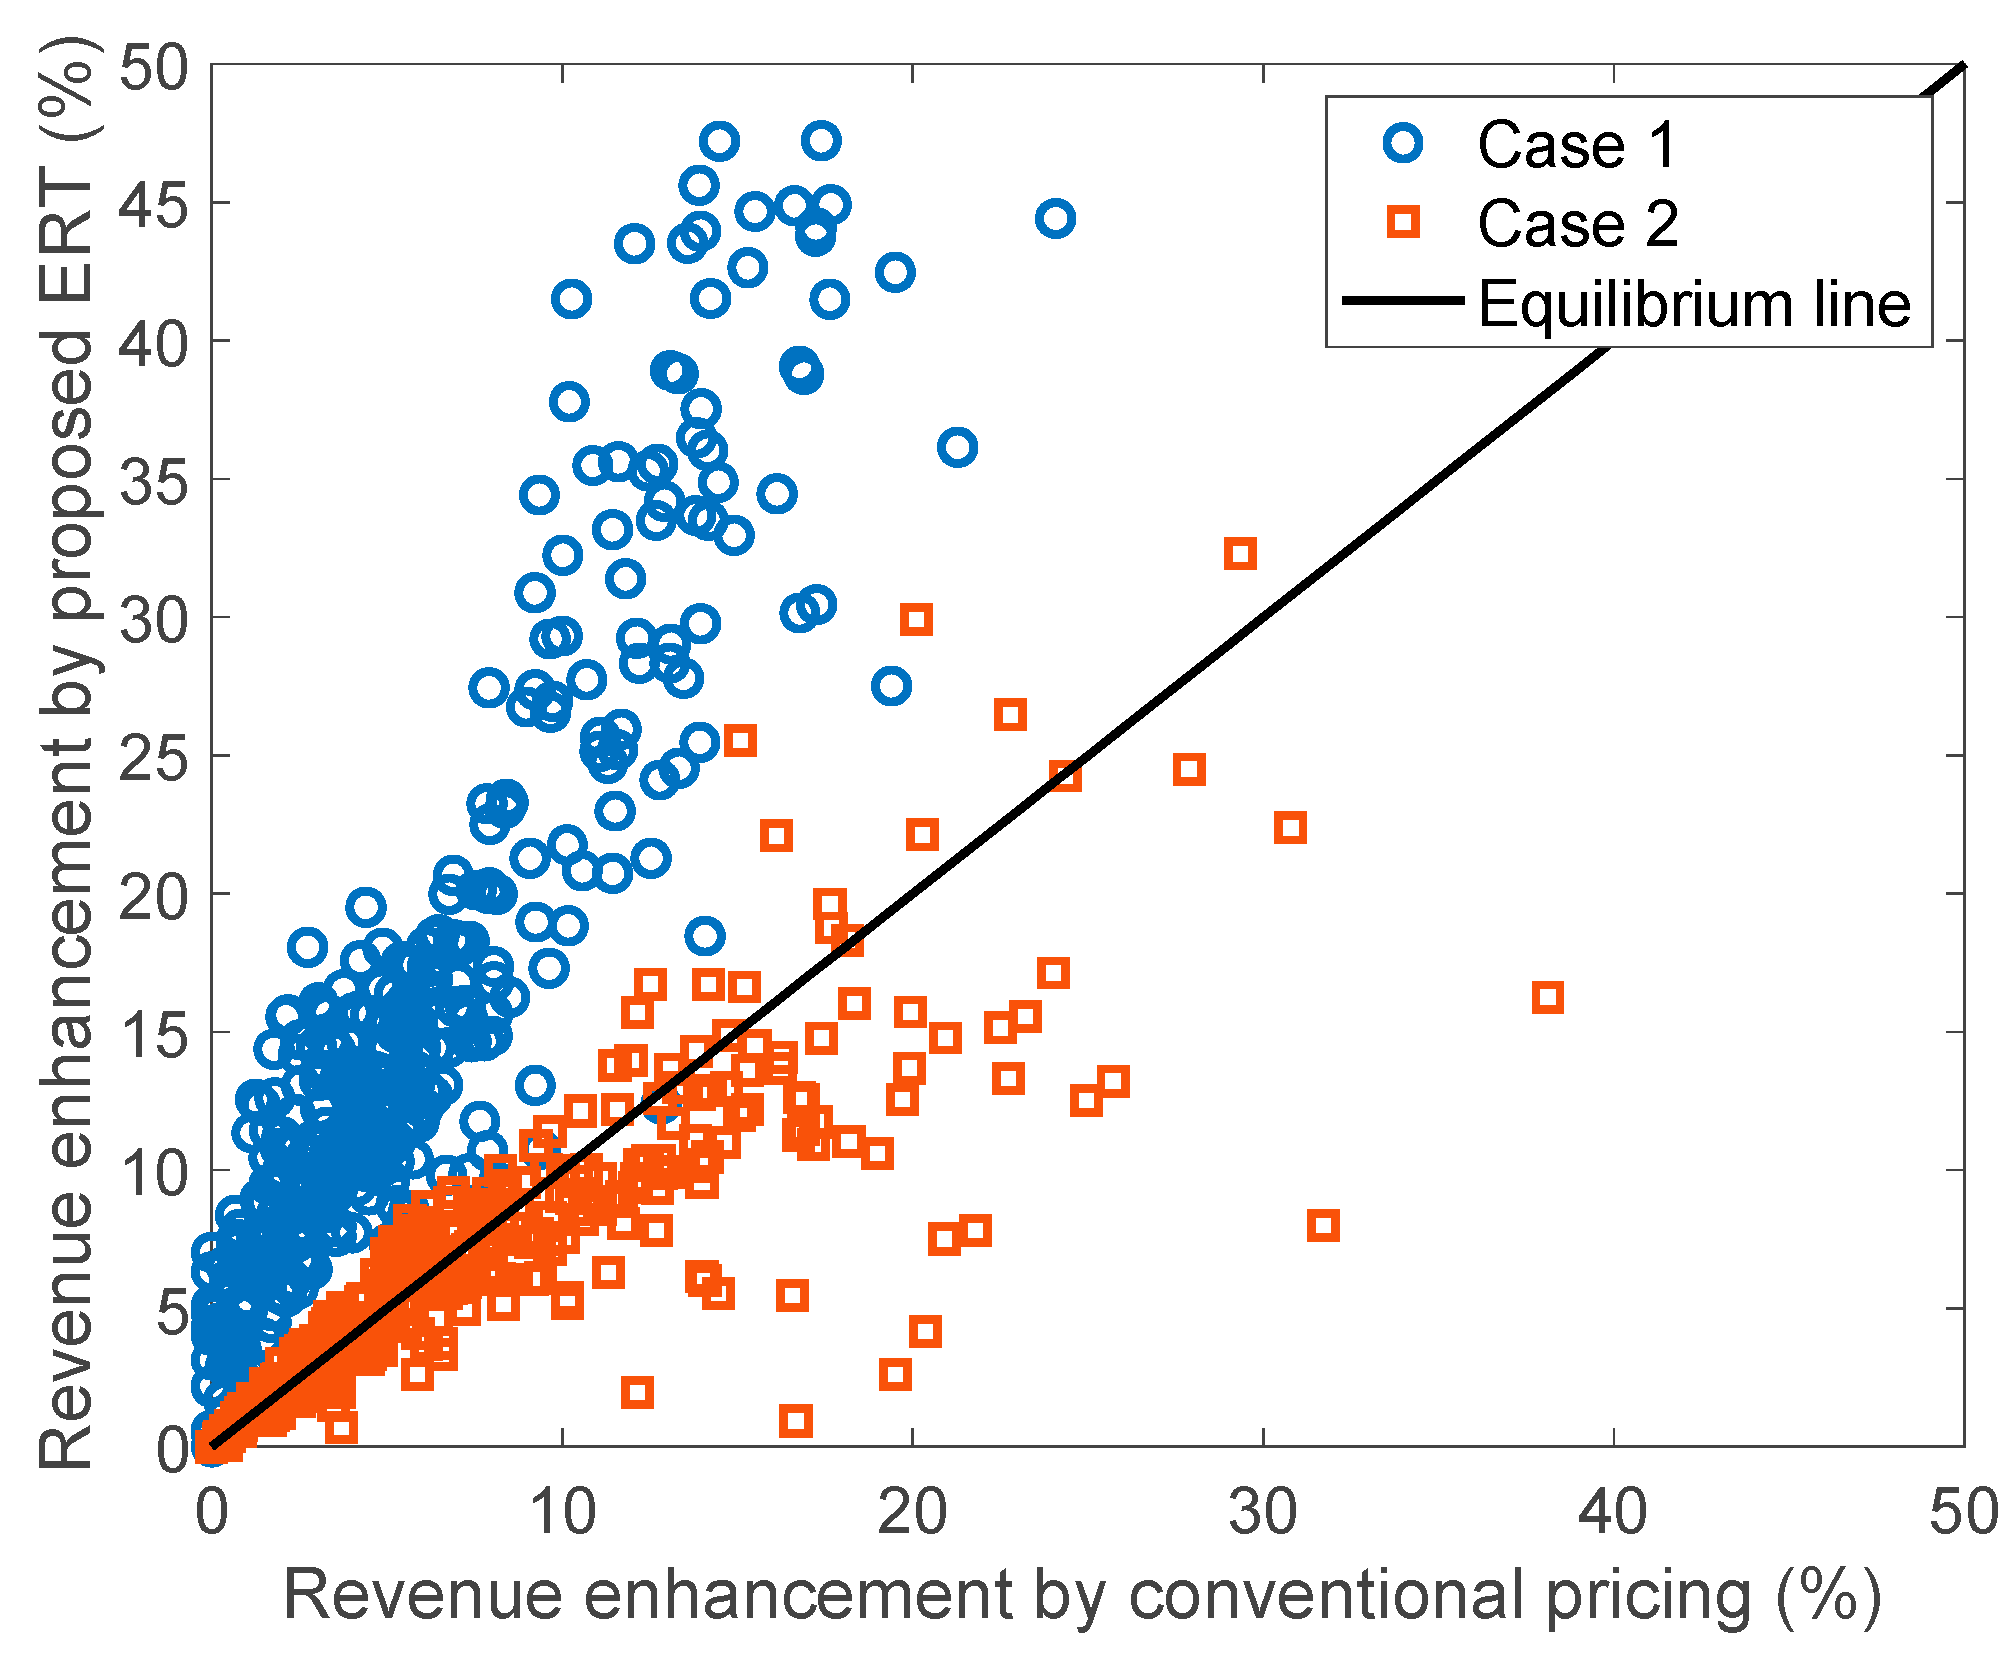
4.3. Characteristics

In the performance evaluation section, it is shown that the prosumer benefit and grid reliability with the proposed ERT is enhanced more than under the conventional pricing case. Furthermore, it is mentioned that the performance enhancement is related to the characteristics of the price and the resource. To explain that, it is shown how to change the band hit ratio under the conventional pricing case and the proposed ERT for various EES capacities. Band hit ratio means the normalized absolute error distribution at each band range as shown in Figure 6, after the EES operation to maximize the prosumer revenue under each price condition. The EES enhances the system’s ability to achieve the operational objective, i.e., the prosumer revenue maximization in this work. Therefore, the results of increasing EES capacities show the direction of achieving the purpose of the system.
In Figure 10a, as the operational room increases, such as EES capacity, the second band hit ratio grows under the conventional price. This is because the average MAE without EES is about 18%, included in the second band of the conventional price. The results show that, under the conventional price, the prosumer works to maximize their benefit by reducing their average penalty. This is because the incentive-penalty is settled according to the result of operation under the conventional pricing case. However, under the ERT, the first band hit ratio and the out-of-band ratio are increased in relation to the EES capacity in Figure 10b. This means that the prosumer in the proposed ERT achieves enhanced benefits by maximizing the incentive. In the proposed ERT, the incentive-penalty is determined according to the previously selected band and operation result. Therefore, the prosumer operates the system considering the reliability as well as the benefit, as shown in Figure 10b. From these results, it can be said that the prosumer under the conventional pricing case operates the system in the form of an average maximization criterion, and a max-max-type operation is worked by the proposed ERT.
In addition, the out-of-band ratio increases from 10% EES capacity (the sixth bar in Figure 10b) to 15% EES capacity (i.e., the seventh bar in Figure 10b is larger than the others). This is why the MAE improvement under the proposed ERT is slightly reduced as shown in Figure 9. These results show that the proposed ERT effectively works in relation to the resource characteristics and gives the prosumer more motivation to control their resources than under the conventional pricing case.

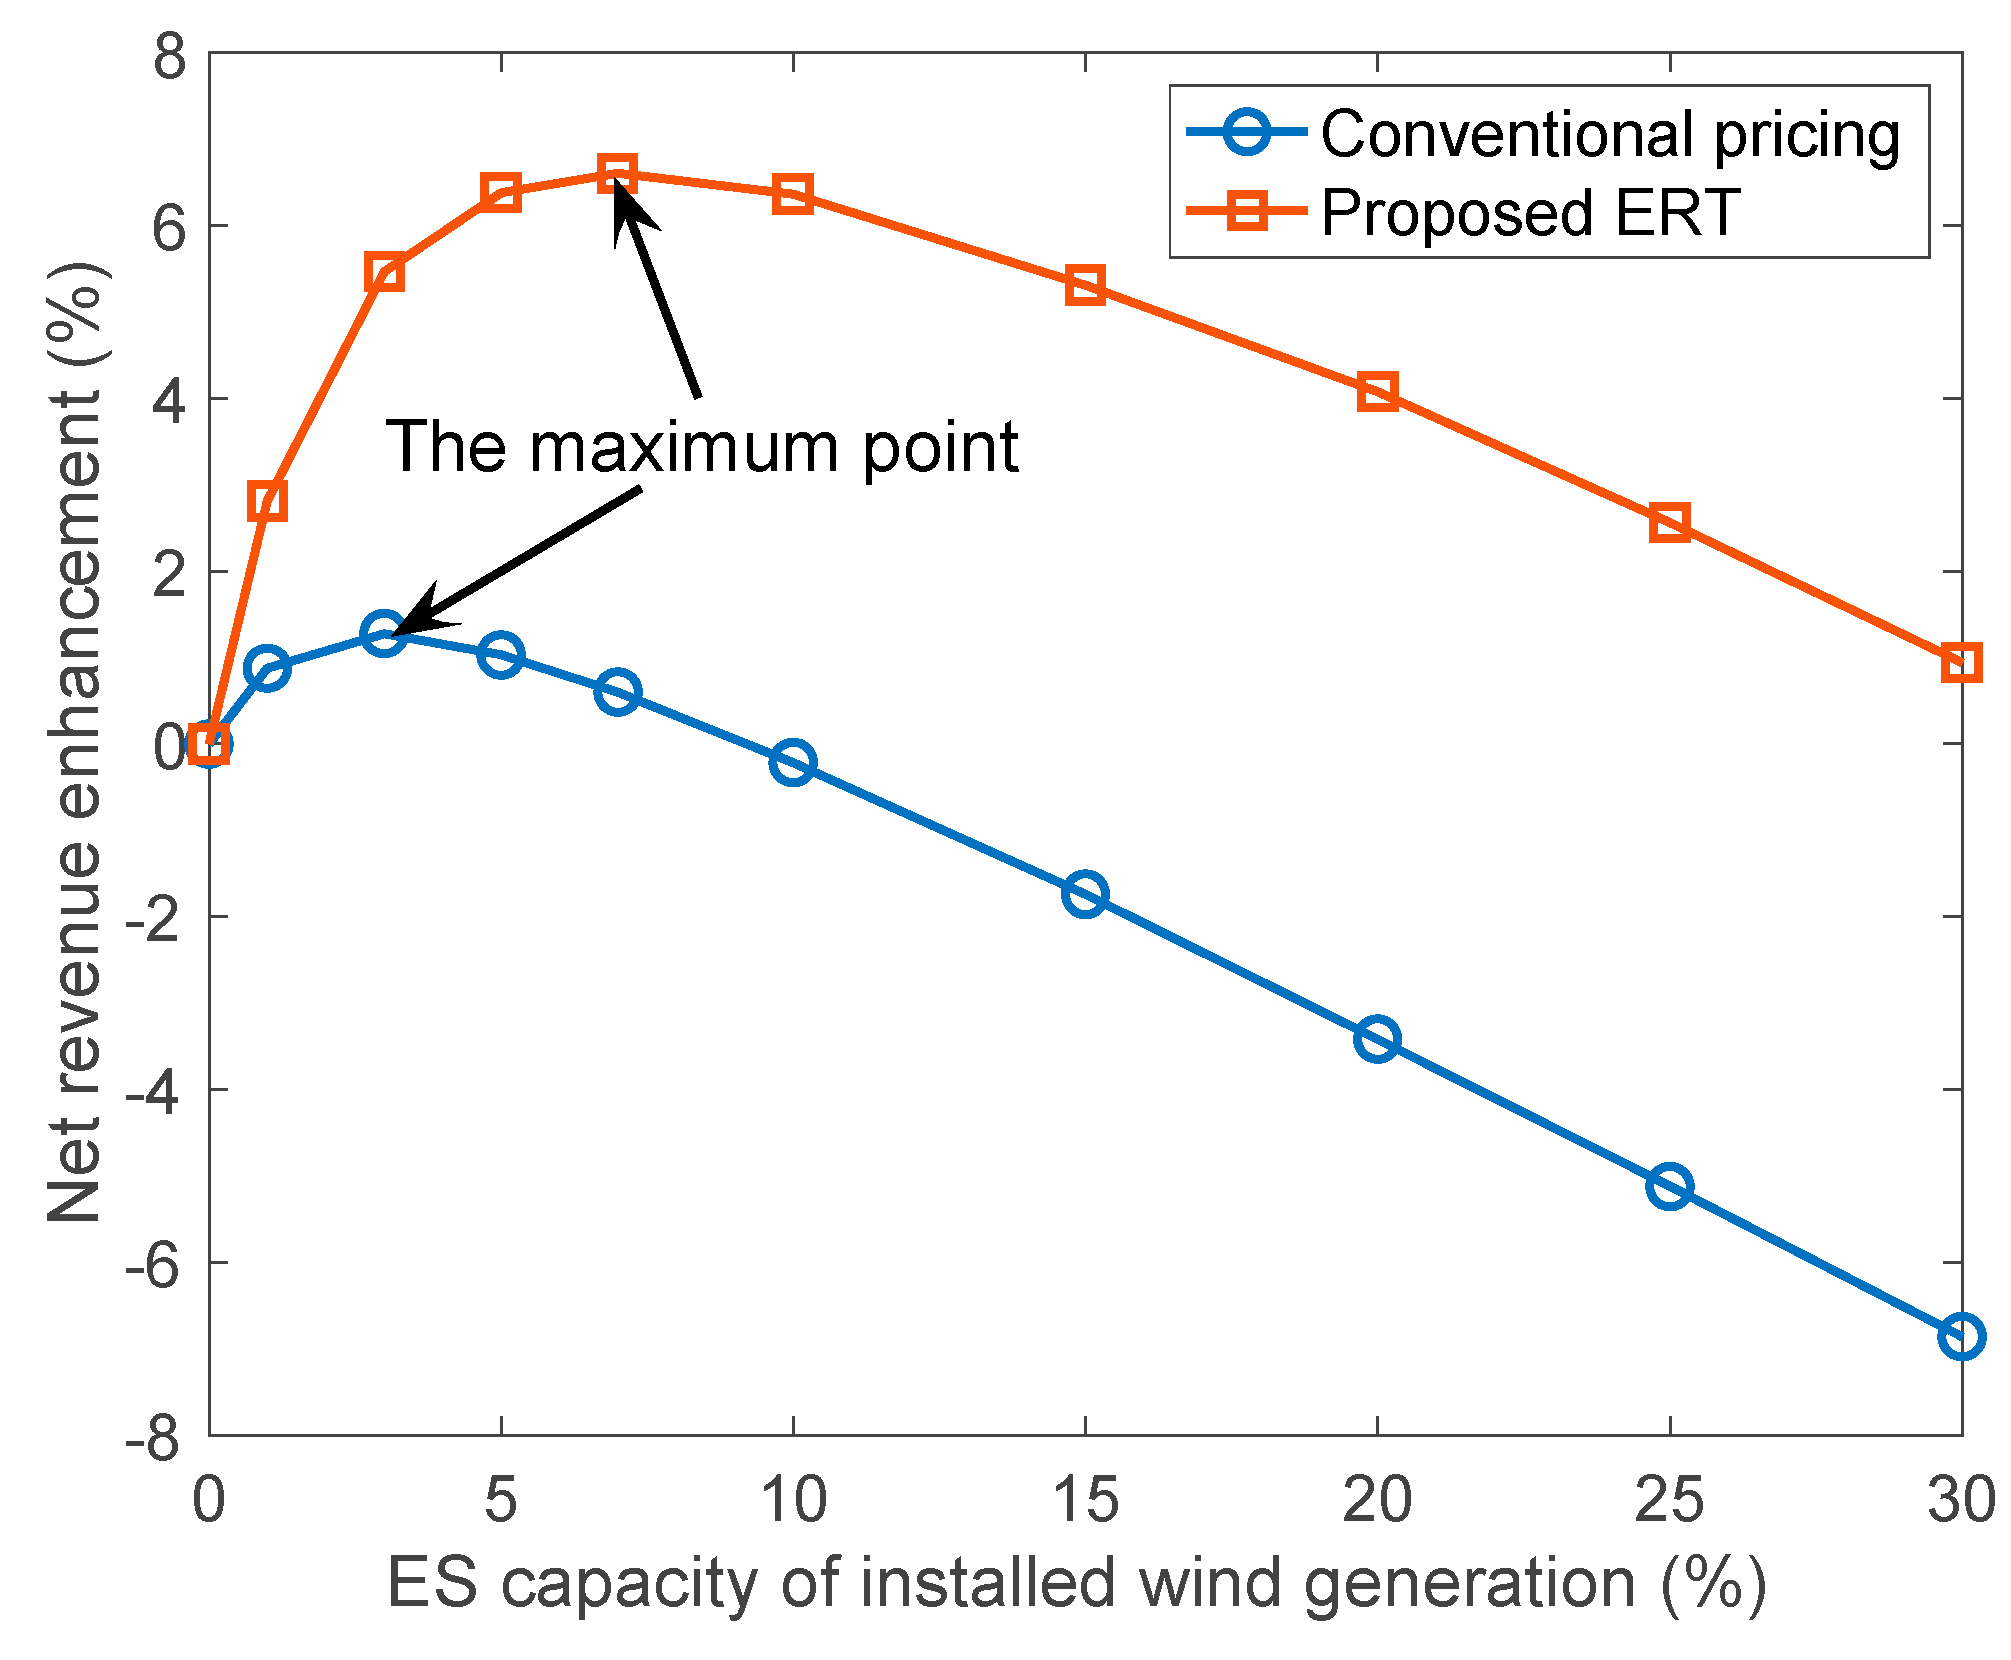
4.4. Economic Sensitivity Analysis

As shown in Figure 8 and Figure 9, the performance under the dynamic price is enhanced by increasing the EES capacity. The EES is a good solution to manage uncertainty, but increasing the EES capacity reduces the revenue by growing the EES cost. In this section, we evaluated the net revenue considering the EES cost.
The net revenue is calculated as:
Net   r e v e n u e = P W ( χ ) × A n n u a l   r e v e n u e E E S   c o s t ,
where P W ( χ ) is the current worth factor that fairly adjusts the revenue to accommodate future timeframes into the present value. Assuming the service time χ = 10 (year) of EESs, a price escalation rate re = 2.5 (%/year), and a discount rate rd = 10 (%/year), the worth factor is calculated as [30]:
P W ( χ ) = i = 1 χ ( 1 + r e ) i 0.5 ( 1 + r d ) i 0.5 .
The EES cost is constructed from the power-subsystem capacity cost and the energy-subsystem capacity cost. Based on the corresponding capacity costs of Li-ion batteries, it was estimated as $240/kW and $360/kWh, respectively [27].
Figure 11 shows the net revenue per year. Under the proposed ERT case illustrated as a solid line with square markers, the net revenue is greater than that without EES over the entire range, and the maximum net revenue enhancement achieved is about 6.6% when the EES capacity applied is 7% of installed generation. However, under the conventional price presented as a solid line with circle markers, the net revenue is greater than that without EES only when the EES capacity is less than 10% of the installed generation, and the maximum net revenue enhancement is about 1%, with 2% EES capacity of installed generation. As such, the proposed ERT is economically efficient and adaptively manages the uncertainty, and the conventional pricing is inefficient.

4.5. Other Reliability Band Design Case

The performance of the proposed ERT is highly related to the reliability band design values. The value is decided by the utility, considering how best to manage prosumer behavior. Therefore, many kinds of values could be determined.
Figure 12 shows a comparison of the revenue enhancement by the conventional pricing (Case 0) and two ERTs (Case 1 and 2) when 10% EES capacity of installed generation is used. Case 1 is the ERT discussed in previous sections, and Case 2 has the design values expressed in Table 2. Each of the 360 points in Figure 12 expresses the daily prosumer revenue enhancements.
In Case 1, the prosumer realizes more revenue than under the conventional price every day. The average prosumer revenue improvement has the same value under both the conventional pricing and the ERT in Case 2, but the prosumer revenues under the ERT in Case 2 have a higher or lower value than under the conventional price. This is because the proposed ERT varies according to the daily generation characteristics. However, in Case 2, the utility has more MAE improvement, 25.1%, versus 19.0% for the conventional system, as presented in Table 3. In addition, the MAE change also shows a similar pattern as presented in Figure 10b. These results verify that the proposed ERT is an effective way to manage grid reliability without loss of prosumer benefits.
Comparing the results of Case 1 and Case 2 in Table 3, the greater revenue enhancement case yields less MAE improvement. Revenue and MAE are the performance metrics of the prosumer and the utility, respectively. Thus, the trade-off between revenue enhancement and MAE improvement can be used as the band design strategy.

5. Discussion

The proposed ERT has both advantages and disadvantages compared to conventional price-based systems, as summarized in Table 4.
From the viewpoint of the utility or retailer, by using additional information provided by prosumers, forecasting accuracy can be improved as shown in Table 3 compared to the conventional simple pricing case. Here, the risk caused by forecasting error can be shifted from the utility or retailer to prosumers. Furthermore, by providing an additional incentive to prosumers for enhanced energy usage and uncertainty forecasting, prosumer self-investment can be promoted, deferring direct investment by the utility or retailer. However, the system becomes more complex when an ERT is implemented, and additional settlement and billing solutions are required. The grid operation risks can increase when prosumers forecast intentionally wrongfully. The utility or retailer should provide more incentives to prosumers for the proposed mechanism even though they can evade direct investment for facilities.
From the prosumer viewpoint, the proposed mechanism provides more room in selecting the means to maximize benefits. For example, when a prosumer possesses a resource with high uncertainty, the prosumer can select a low-reliability price band to minimize forecasting error. Alternatively, they can invest in energy storage to decrease uncertainty, and can then select a high-reliability price band to maximize profit as shown in Table 3. Conversely, the prosumer now has additional responsibility for forecasting and price selection, increasing system and operation complexity.
The more price differences between bands in the ERT there are, the stronger the motivation to the participating prosumers. As a result, the net revenue or profit of the prosumers and the reliability of the utility can both be increased. However, the utility would provide more incentives to prosumers. Therefore, the utility should be careful in ERT price design not to provide unnecessary incentives obtaining excessive reliability. ERT bands can be designed as the combination of the maximum price, the range of absolute error for the maximum price zone, and the shape of the declining slope. It means that various price models can be designed with the ERT.

6. Conclusions

This study investigated an ERT as a means to enhance energy system reliability. Compared to a conventional dynamic energy pricing on time only, the ERT is designed to provide a price in terms of reliability range as well as time. Using the two-way information exchange of price from the utility and prosumer situation and reliability band selection, both the utility and the prosumer are expected to have opportunities to maximize their benefits. The proposed mechanism can motivate prosumers to participate in the system reliability improvement by incentivizing or penalizing them depending on the contribution. A numerical case study using BPA data validates the effectiveness of the proposed ERT and shows that both the reliability of the utility and prosumer revenue is enhanced compared to a conventional energy-based dynamic pricing mechanism. The result shows that the prosumers’ revenue enhancement is 6.6% when the EES capacity applied is 7% of installed wind generation. It is also shown that the revenue enhancement and reliability improvement are higher under the proposed ERT than under the conventional pricing case by applying two band ERT prices. In addition, the advantages and disadvantages of the proposed ERT are discussed. This suggests guidance in adopting the proposed ERT as a transaction mechanism to enhance the energy system’s reliability. The study can be extended for appropriate or optimal price-band model design using the proposed ERT.

Author Contributions

S.-Y.S. conceptualized and designed the structure of the manuscript. E.O. performed data analysis and investigation. E.O. wrote the original draft, and S.-Y.S. reviewed and edited the manuscript. All the authors have read and approved the final manuscript.

Funding

The work of E.O. was supported by the National Research Foundation of Korea through the Korean Government (Ministry of Science and ICT) under Grant 2017R1E1A1A03070136. The work of S.-Y.S. was supported by the Korea Institute of Energy Technology Evaluation and Planning and the Ministry of Trade, Industry and Energy of the South Korea under Grant 20168530050080.

Conflicts of Interest

The authors declare no conflict of interest.

References

  1. Hossain, M.S.; Madlool, N.A.; Rahim, N.A.; Selvaraj, J.; Pandey, A.K.; Khan, A.F. Role of smart grid in renewable energy: An overview. Renew. Sustain. Energy Rev. 2016, 60, 1168–1184. [Google Scholar] [CrossRef]
  2. Cai, Y.; Huang, T.; Bompard, E.; Cao, Y.; Li, Y. Self-sustainable community of electricity prosumers in the emerging distribution system. IEEE Trans. Smart Grid 2017, 8, 2207–2216. [Google Scholar] [CrossRef]
  3. Rathnayaka, A.J.D.; Potdar, V.M.; Dillon, T.S.; Hussain, O.K.; Chang, E. A methodology to find influential prosumers in prosumer community groups. IEEE Trans. Ind. Inform. 2014, 10, 706–713. [Google Scholar] [CrossRef]
  4. Parag, Y.; Sovacool, B.K. Electricity market design for the prosumer era. Nat. Energy 2016, 1, 16032. [Google Scholar] [CrossRef] [Green Version]
  5. Moslehi, K.; Kumar, R. A reliability perspective of the smart grid. IEEE Trans. Smart Grid 2010, 1, 57–64. [Google Scholar] [CrossRef]
  6. Kamel, R.M. New inverter control for balancing standalone micro- grid phase voltages: A review on MG power quality improvement. Renew. Sustain. Energy Rev. 2016, 63, 520–532. [Google Scholar] [CrossRef]
  7. Sirjani, R.; Jordehi, A.R. Optimal placement and sizing of distribution static compensator (D-STATCOM) in electric distribution networks: A review. Renew. Sustain. Energy Rev. 2017, 77, 688–694. [Google Scholar] [CrossRef]
  8. Oh, E.; Son, S.-Y.; Hwang, H.; Park, J.-B.; Lee, K.Y. Impact of demand and price uncertainties on customer-side energy storage system operation with peak load limitation. Electr. Power Compon. Syst. 2015, 43, 1872–1881. [Google Scholar] [CrossRef]
  9. Tavakkoli, M.; Pouresmaeil, E.; Godina, R.; Vechiu, I.; Catalao, J.P.S. Optimal Management of an Energy Storage Unit in a PV-Based Microgrid Integrating Uncertainty and Risk. Appl. Sci. 2019, 9, 169. [Google Scholar] [CrossRef]
  10. Gungor, V.C.; Sahin, D.; Kocak, T.; Ergut, S.; Buccella, C.; Cecati, C.; Hancke, G.P. A survey on smart grid potential applications and communication requirements. IEEE Trans. Ind. Inform. 2013, 9, 28–42. [Google Scholar] [CrossRef]
  11. Khan, A.R.; Mahmood, A.; Safdar, A.; Khan, Z.A.; Khan, N.A. Load forecasting, dynamic pricing and DSM in smart grid: A review. Renew. Sustain. Energy Rev. 2016, 54, 1311–1322. [Google Scholar] [CrossRef]
  12. Bu, S.; Yu, F.R.; Liu, P.X. Dynamic pricing for demand-side management in the smart grid. In Proceedings of the 2011 IEEE Online Conference on Green Communications, New York, NY, USA, 26–29 September 2011. [Google Scholar]
  13. Dutta, G.; Mitra, K. A literature review on dynamic pricing of electricity. J. Oper. Res. Soc. 2017, 68, 1131–1145. [Google Scholar] [CrossRef]
  14. Simshauser, P. Distribution network prices and solar PV: Resolving rate instability and wealth transfers through demand tariffs. Energy Econ. 2016, 54, 108–122. [Google Scholar] [CrossRef]
  15. Siddiqi, S.N.; Baughman, M.L. Reliability differentiated real-time pricing of electricity. IEEE Trans. Power Syst. 1993, 8, 548–554. [Google Scholar] [CrossRef]
  16. Hamalainen, R.P.; Mantysaari, J.; Ruusunen, J.; Pineau, P.O. Cooperative consumers in a deregulated electricity market—Dynamic consumption strategies and price coordination. Energy 2000, 25, 857–875. [Google Scholar] [CrossRef]
  17. Oh, E.; Son, S.-Y. Pair Matching Strategies for Prosumer Market Under Guaranteed Minimum Trading. IEEE Access 2018, 6, 40325–40333. [Google Scholar] [CrossRef]
  18. da Silva, P.G.; Ilić, D.; Karnouskos, S. The impact of smart grid prosumer grouping on forecasting accuracy and its benefits for local electricity market trading. IEEE Trans. Smart Grid 2014, 5, 402–410. [Google Scholar] [CrossRef]
  19. Reneses, J.; Gomez, T.; Rivier, J.; Angarita, J.L. Electricity tariff design for transition economies: Application to the Libyan power system. Energy Econ. 2011, 33, 33–43. [Google Scholar] [CrossRef]
  20. Electric Rate Table; Korea Electric Power Company (KEPCO): Naju, Korea, November 2013.
  21. Wind Generation and TOTAL load in the BPA Balancing Authority. Bonneville Power Administration, U.S. Dept. of Energy. Available online: https://transmission.bpa.gov/Business/Operations/Wind/ (accessed on 12 February 2019).
  22. Mohajeryami, S.; Doostan, M.; Schwarz, P. The impact of customer baseline load (CBL) calculation methods on peak time rebate program offered to residential customers. Electr. Power Syst. Res. 2016, 137, 59–65. [Google Scholar] [CrossRef]
  23. Mohajeryami, S.; Doostan, M.; Asadinejad, A.; Schwarz, P. Error analysis of customer baseline load (CBL) calculation methods for residential customers. IEEE Trans. Ind. Appl. 2017, 53, 5–14. [Google Scholar] [CrossRef]
  24. Zhang, Y.; Wang, J.; Wang, X. Review on probabilistic forecasting of wind power generation. Renew. Sustain. Energy Rev. 2014, 32, 255–270. [Google Scholar] [CrossRef]
  25. Chitsaz, H.; Amjady, N.; Zareipour, H. Wind power forecast using wavelet neural network trained by improved clonal selection algorithm. Energy Convers. Manag. 2015, 89, 588–598. [Google Scholar] [CrossRef]
  26. Lange, M. On the uncertainty of wind power predictions—Analysis of the forecast accuracy and statistical distribution of errors. J. Sol. Energy Eng. 2005, 127, 177–184. [Google Scholar] [CrossRef]
  27. Oh, E.; Son, S.-Y. Energy-storage system sizing and operation strategies based on discrete Fourier transform for reliable wind-power generation. Renew. Energy 2018, 116, 786–794. [Google Scholar] [CrossRef]
  28. Alagappan, L.; Kahrl, F.; Bharvirkar, R. Regulatory Dimensions to Renewable Energy Forecasting, Scheduling, and Balancing in India; White Paper; National Association of Regulatory Utility Commissioners: Washington, DC, USA, March 2017. [Google Scholar]
  29. IEEE Guide for Electric Power Distribution Reliability Indices; IEEE std. 1366-2012; IEEE Std: New York, NY, USA, May 2012.
  30. Eyer, J.; Corey, G. Energy Storage for the Electricity Grid: Benefits and Market Potential Assessment Guide; Tech. Rep. SAND2010- 0815; Sandia National Laboratory: Albuquerque, NM, USA, February 2010.
Figure 1. The proposed dynamic energy reliability pricing concept.
Applsci 09 01343 g001
Figure 2. The ERT operations sequence.
Applsci 09 01343 g002
Figure 3. A time-of-use (TOU) pricing example of Korea Electric Power Company (KEPCO).
Applsci 09 01343 g003
Figure 4. Contribution of wind generation at net demand. The priority is set as 3 for 25% or more, 2 for 25–20%, and 1 for less than 20% related to the contribution as an example.
Applsci 09 01343 g004
Figure 5. The relationship between the gradient of generation forecasting and the relative mean absolute error of Bonneville Power Administration (BPA)’s wind generation.
Applsci 09 01343 g005
Figure 6. Incentive and penalty plan of a conventional pricing mechanism and the ERT. (a) Incentive-penalty plan; (b) Energy-reliability pricing.
Applsci 09 01343 g006
Figure 7. Probability distribution of absolute error for generation forecasting.
Applsci 09 01343 g007
Figure 8. Comparison of user revenue enhancement under the conventional pricing mechanism and the proposed ERT.
Applsci 09 01343 g008
Figure 9. Comparison of grid mean absolute error improvement under the conventional pricing mechanism and the proposed ERT.
Applsci 09 01343 g009
Figure 10. The change in band hit ratio under the conventional pricing mechanism and the proposed ERT with varying EES capacity. (a) Conventional price case; (b) Proposed ERT.
Applsci 09 01343 g010
Figure 11. Net revenue under the conventional pricing mechanism and the proposed ERT.
Applsci 09 01343 g011
Figure 12. Comparison of revenue enhancement under the convention pricing mechanism and proposed ERTs.
Applsci 09 01343 g012
Table 1. Comparison between the conventional pricing mechanism and the proposed dynamic energy-reliability pricing-based transaction mechanism (ERT).
CommunicationPricing
Conventional pricingOne-wayOne-dimensional
(Time)
Proposed ERTTwo-wayTwo-dimensional
(Time and reliability)
Table 2. Price design values.
Band 1Band 2Band 3Band 4
PriceRangePriceRangePriceRangePriceRange
Case 01000–109010–208020–307030-
Case 11100–5850–20600–35--
Case 21000–10850–40700–70--
Case 0 expresses the conventional pricing case.
Table 3. Price performance (%).
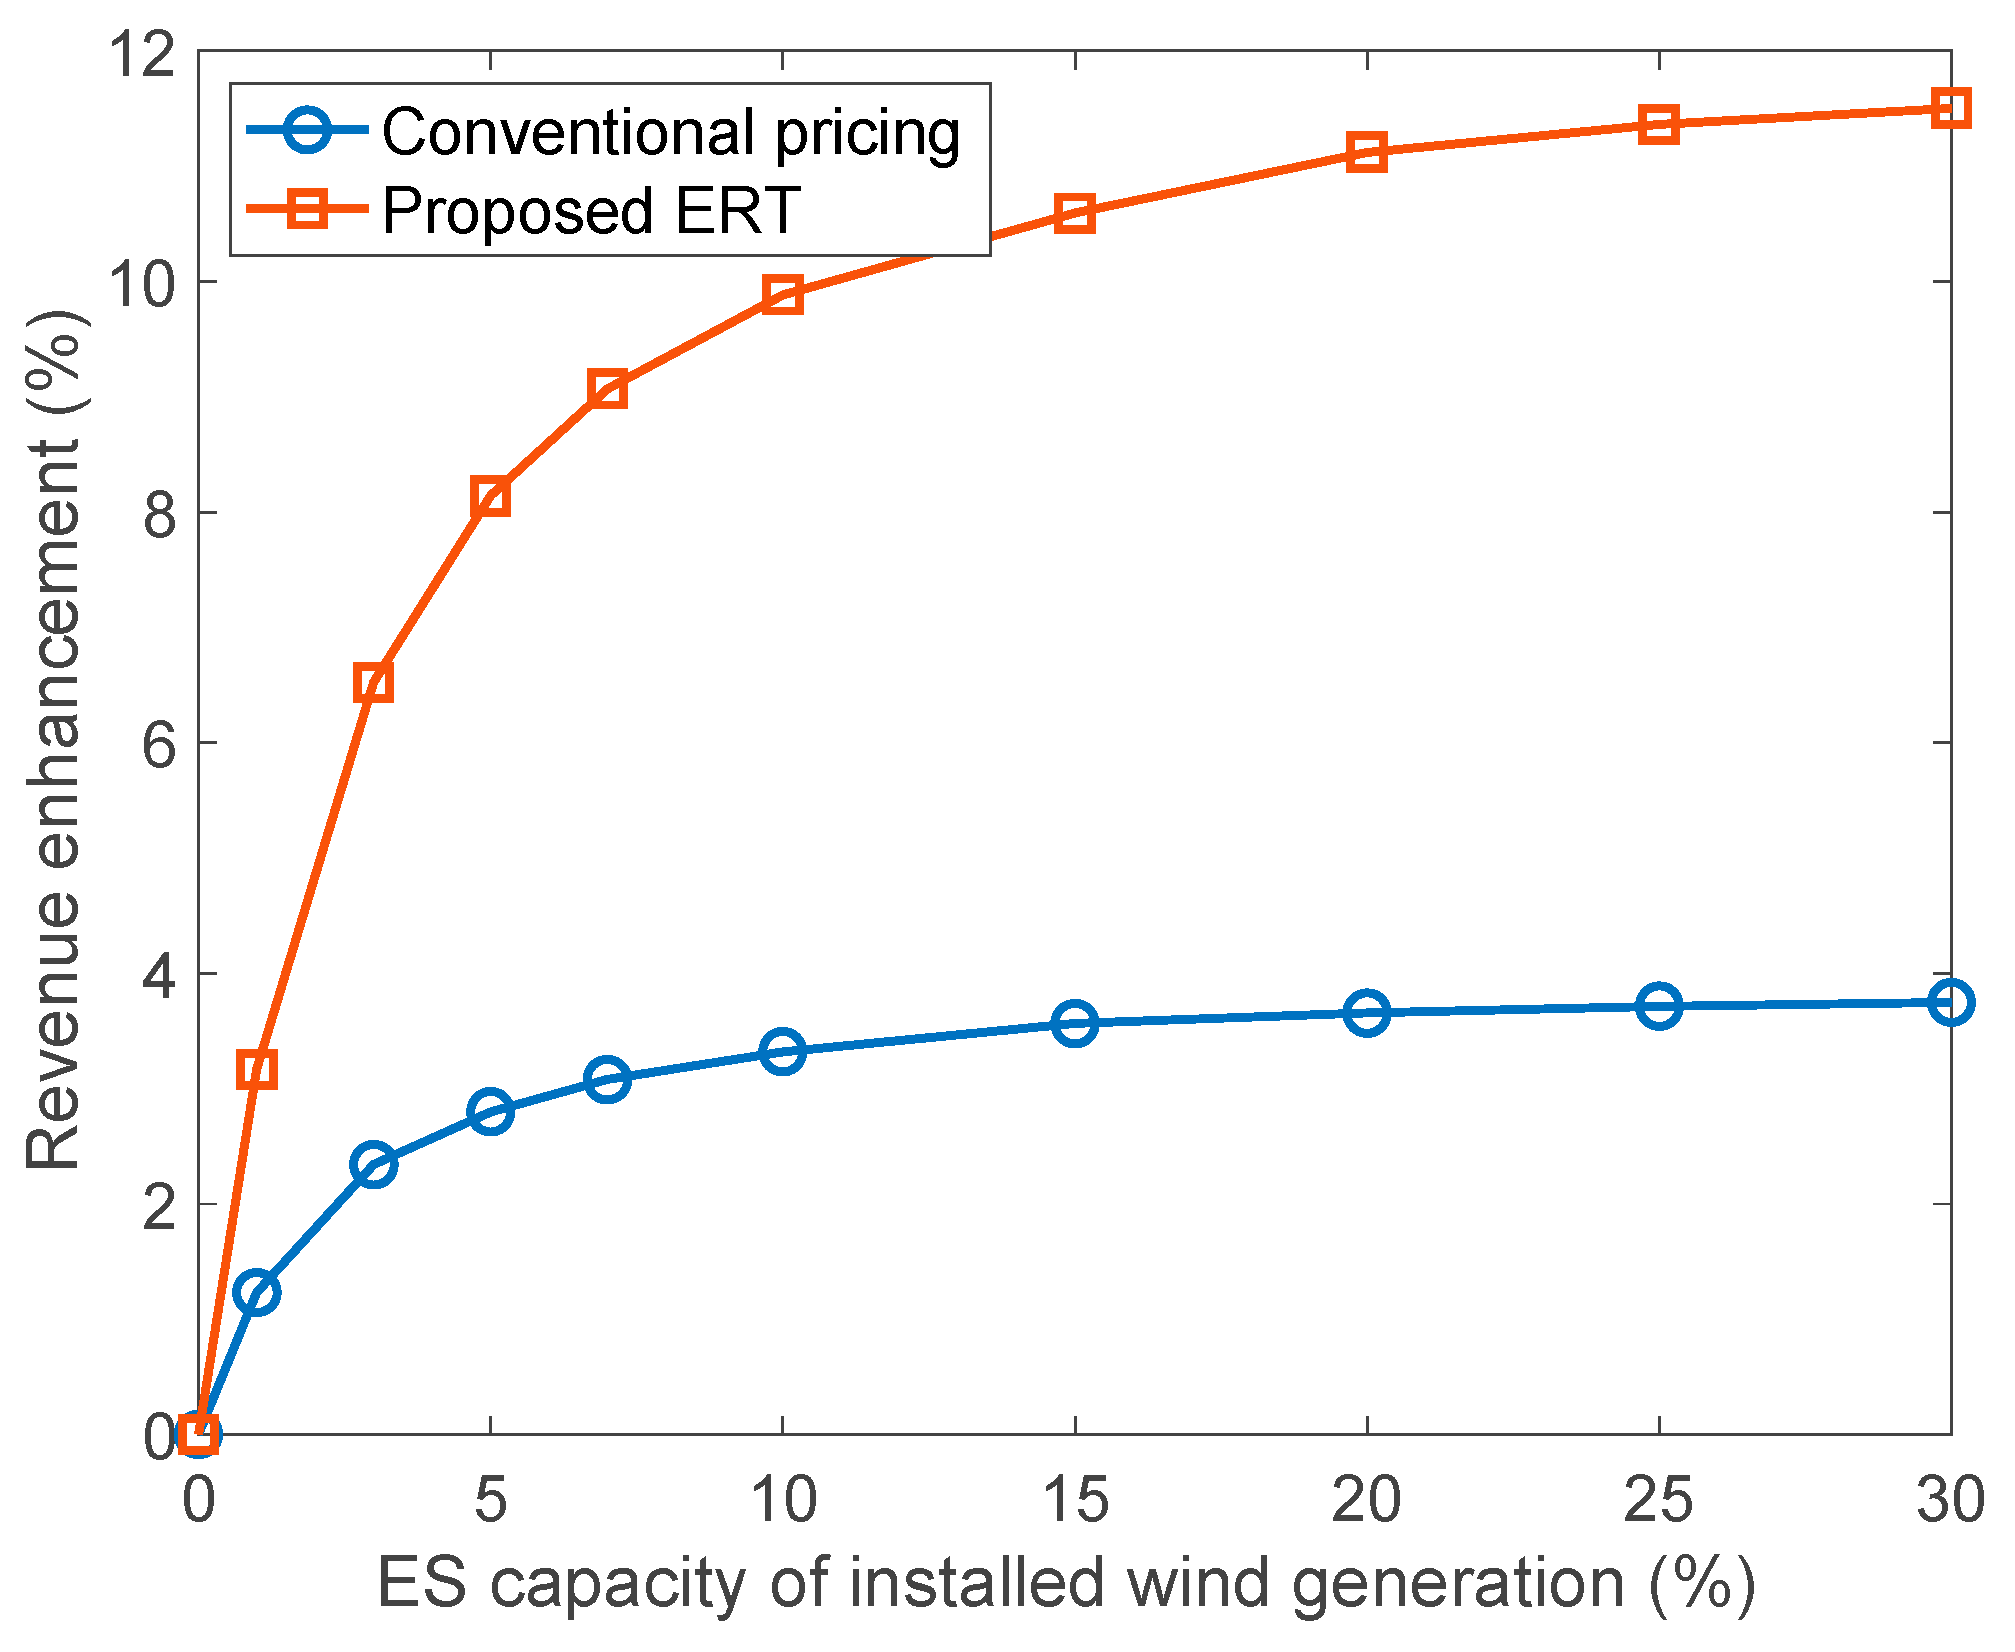
EES Capacity of Installed Generation
1%5%10%15%20%25%30%
Revenue enhancement
Case 01.22.83.33.63.73.73.7
Case 13.28.19.910.611.111.411.5
Case 21.22.93.33.53.63.63.6
MAE improvement
Case 09.518.519.020.220.921.621.6
Case 115.723.124.724.024.824.824.9
Case 215.223.725.125.926.227.627.8
Table 4. Advantages and disadvantages of the ERT.
Utility/RetailerProsumer
AdvantagesEnhanced forecasting with additional information
Promotes self-investment, deferring direct investment
Flexible investment and operation choices
Increased opportunity to maximize benefits
DisadvantagesIncrease in operational complexity
Increased grid operation risks
Increase in incentives
Increase in operational complexity
Increased risk of penalty

