A CFD Results-Based Approach to Investigating Acoustic Attenuation Performance and Pressure Loss of Car Perforated Tube Silencers

Abstract
:1. Introduction
2. Methods
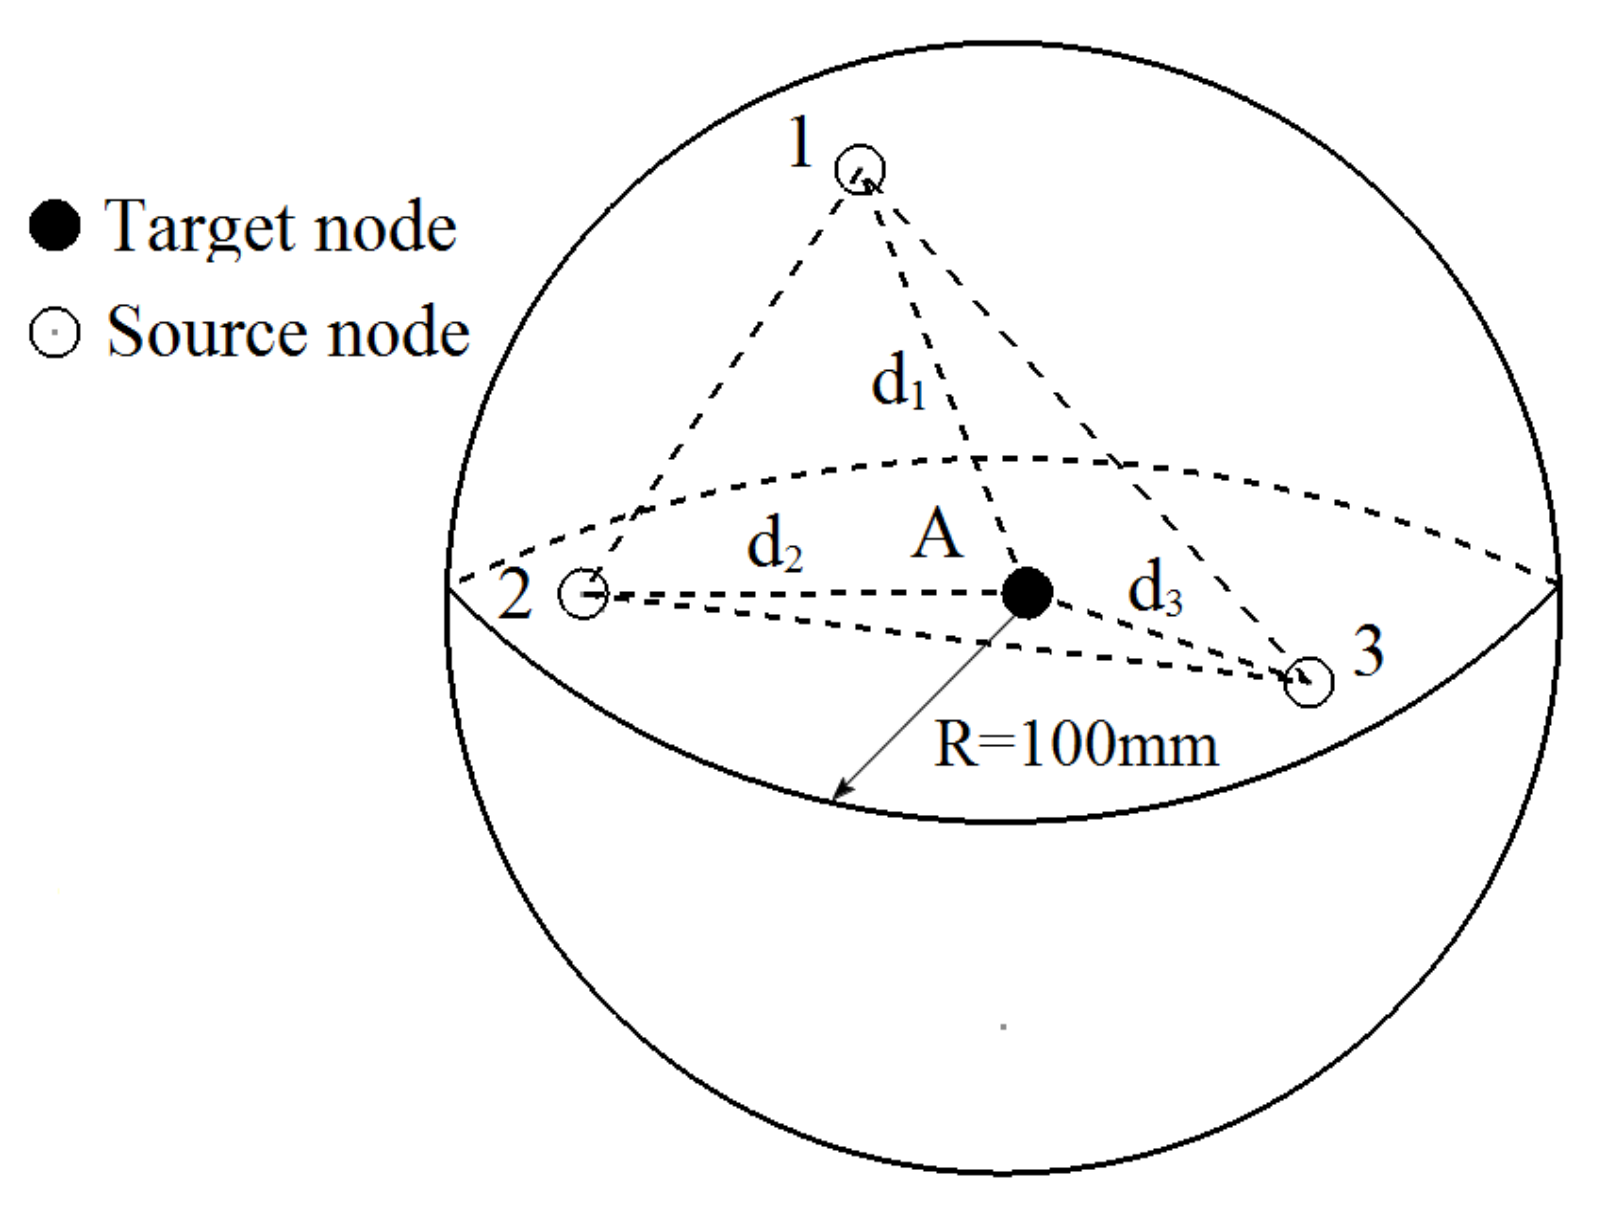
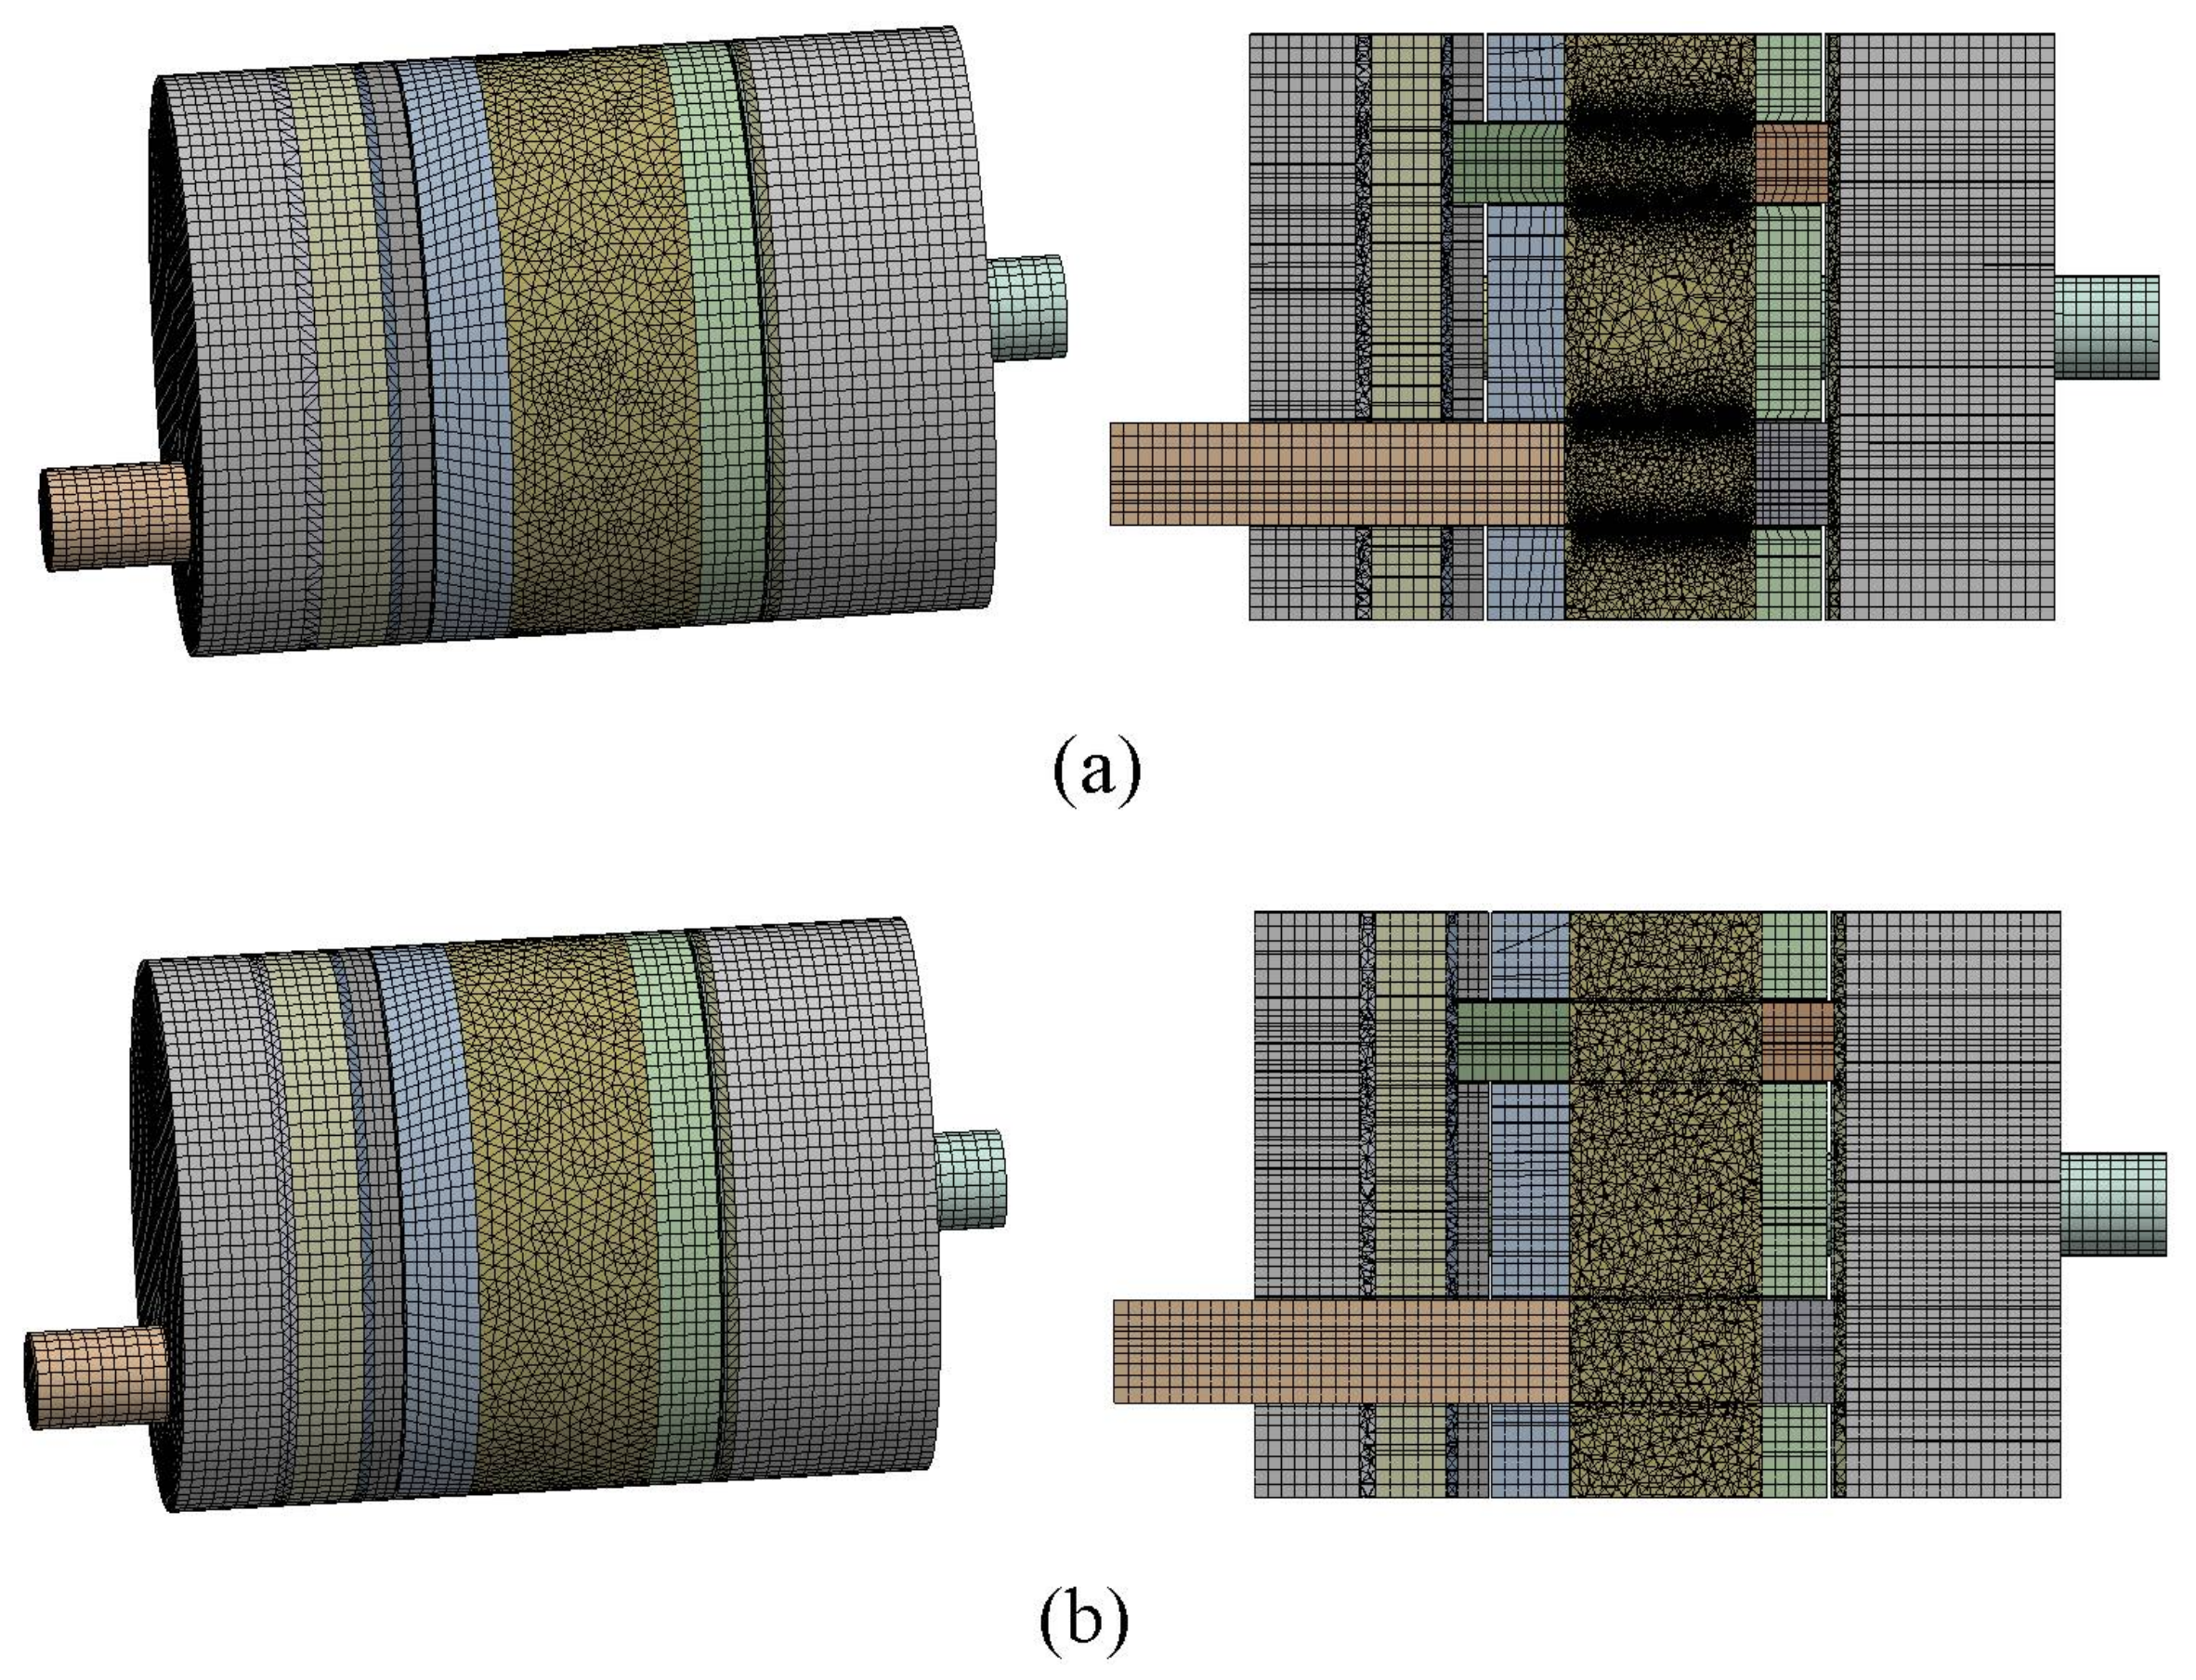
2.1. Mesh Mapping
- Number of nodes (N): The maximum number of nodes from the source mesh that are considered for mapping with one node of the target mesh.
- Maximum distance (R): Only the nodes of the source mesh that lie inside a sphere with a radius R—centered at the node of the target mesh—are taken into account.
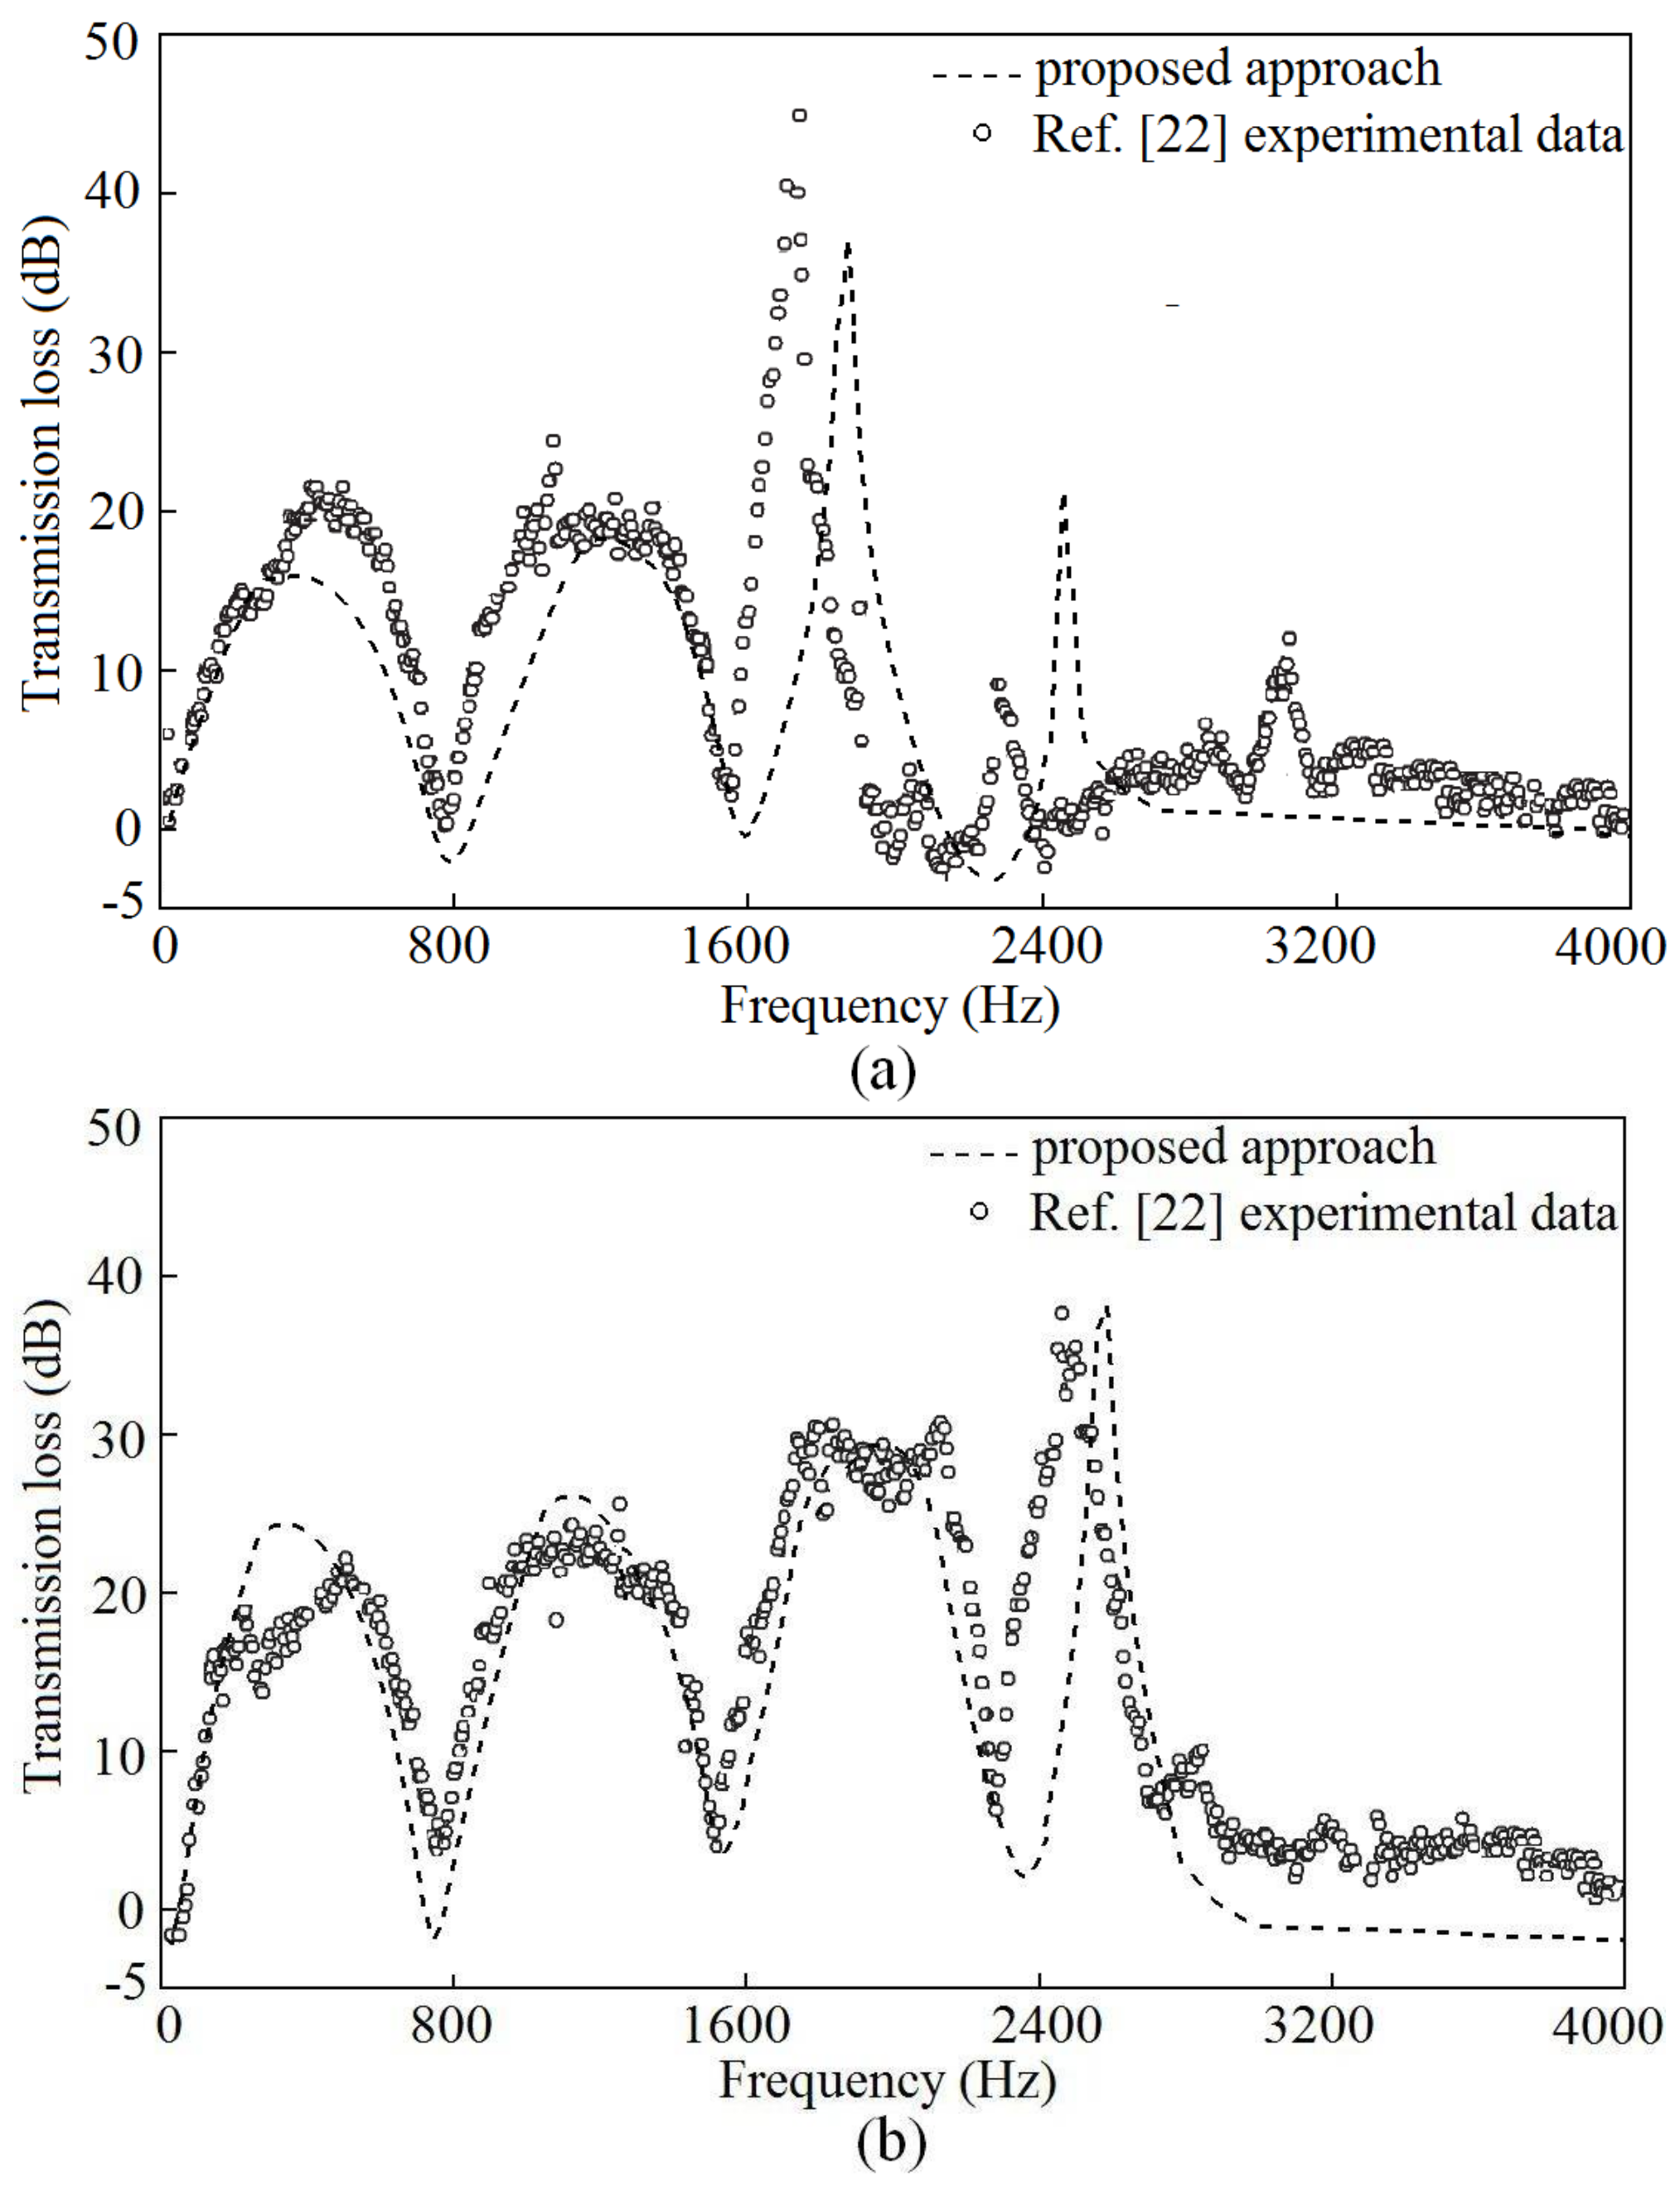
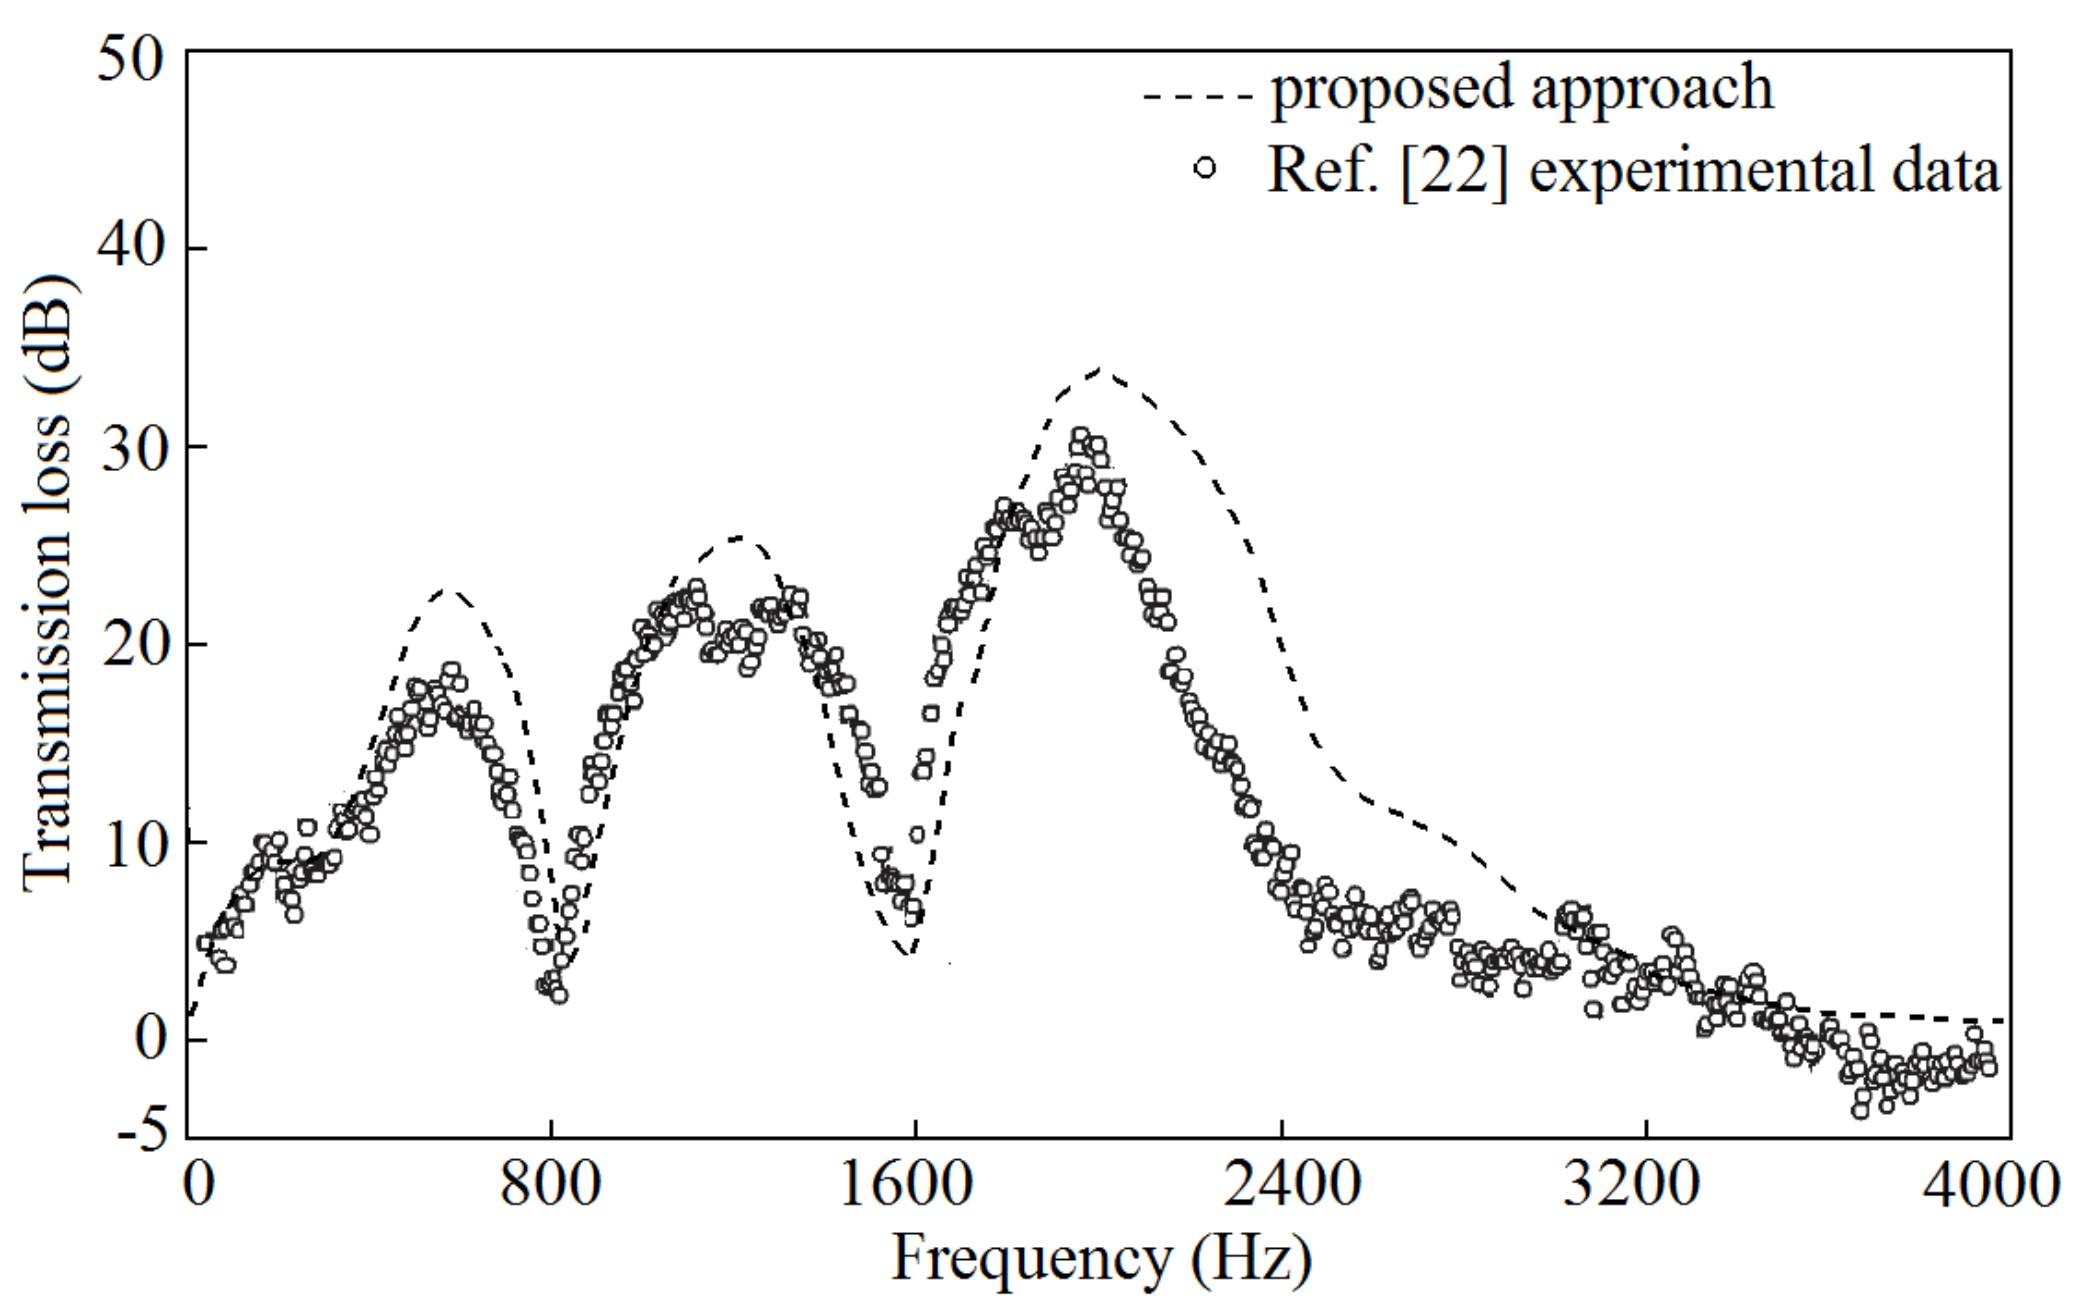
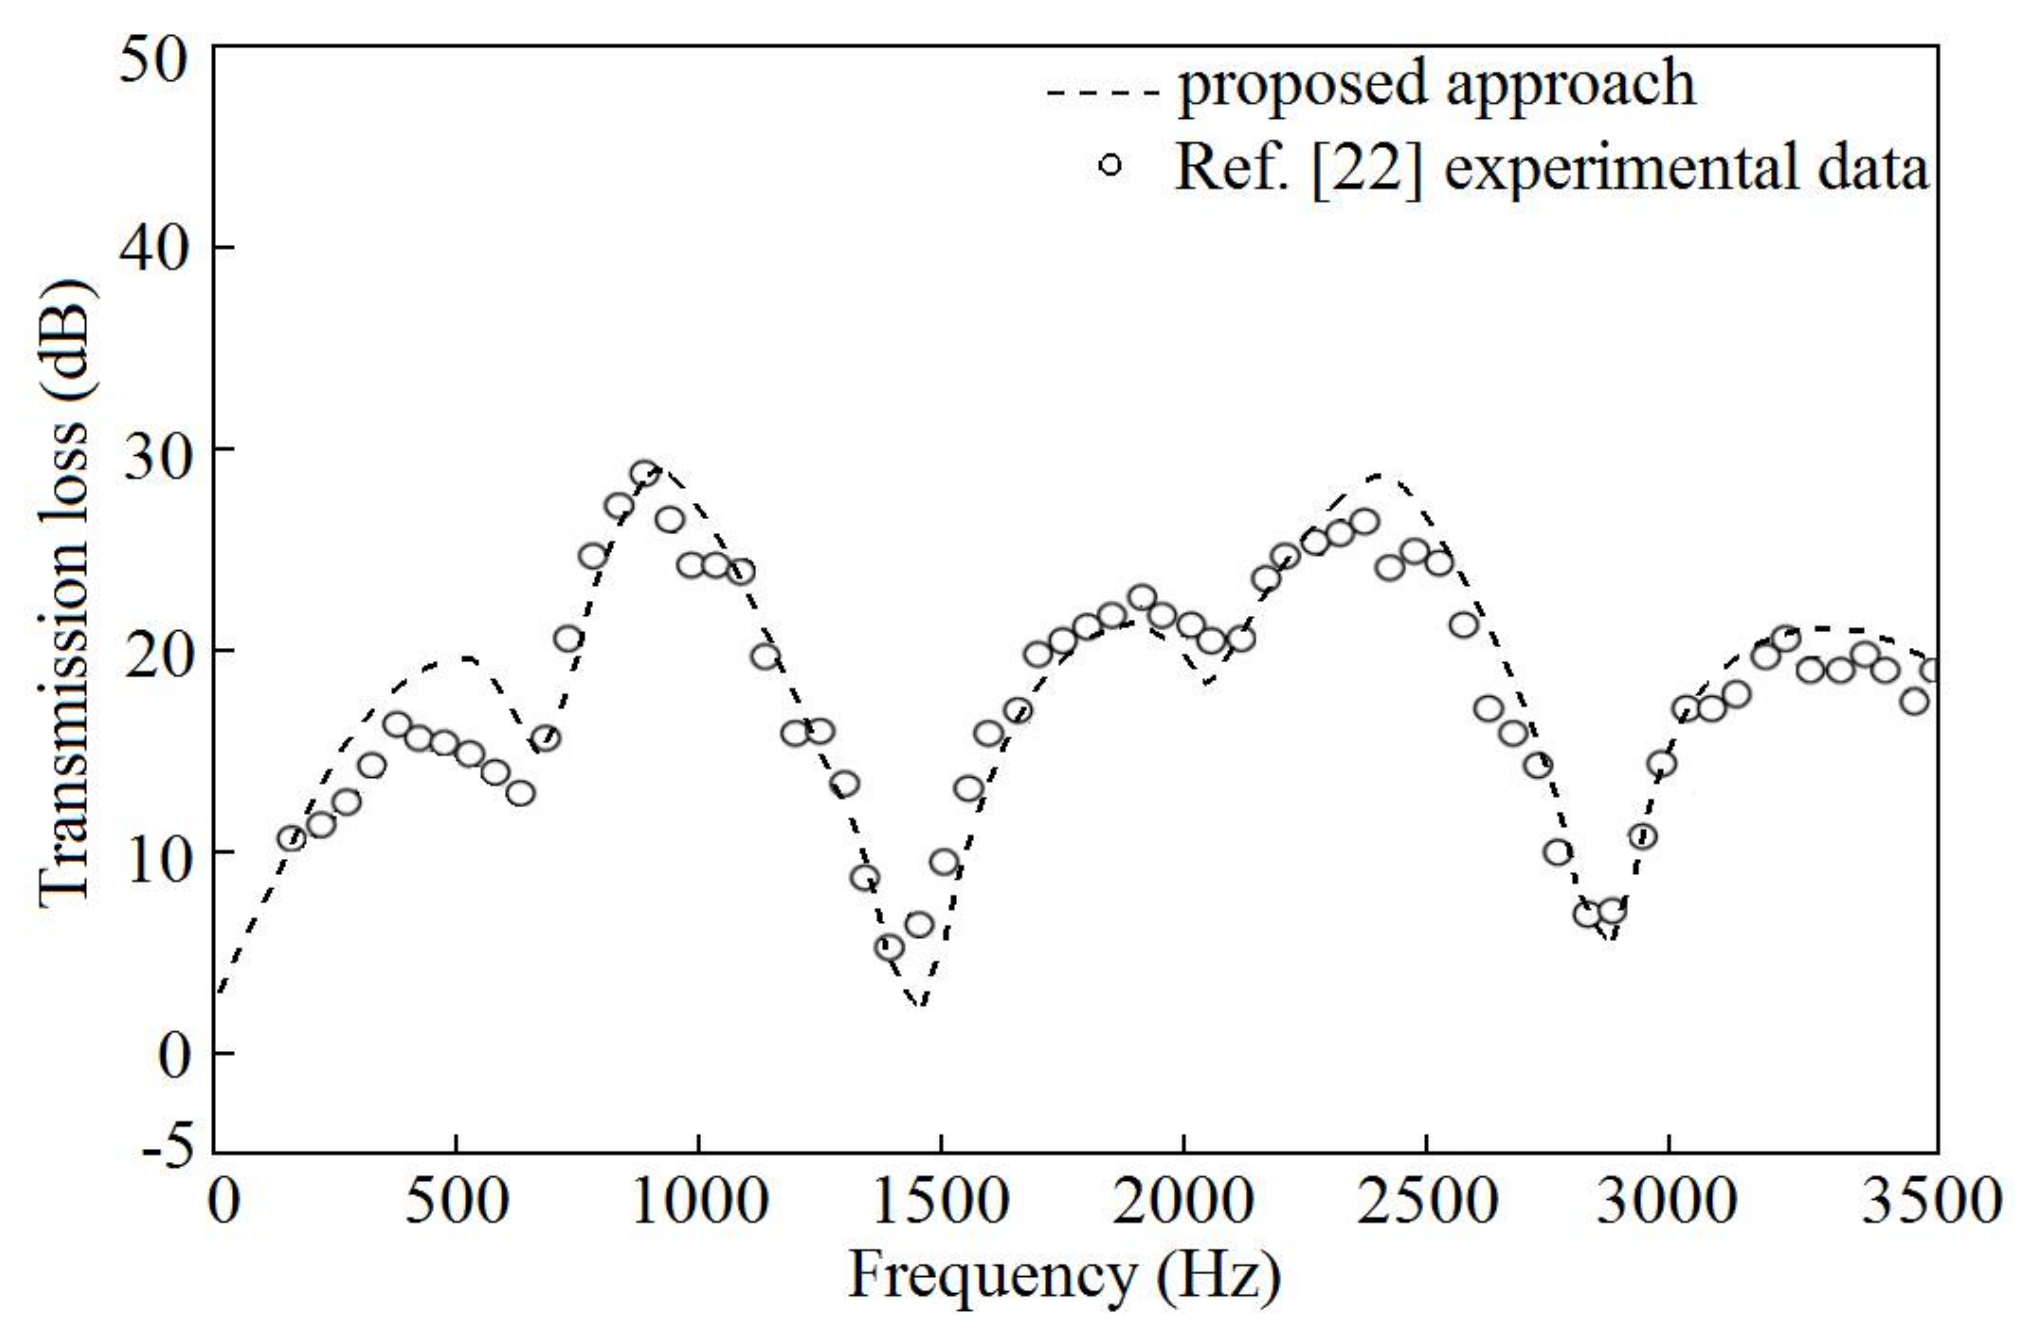
2.2. Method Validation
3. Modeling and Steady Computation Using CFD
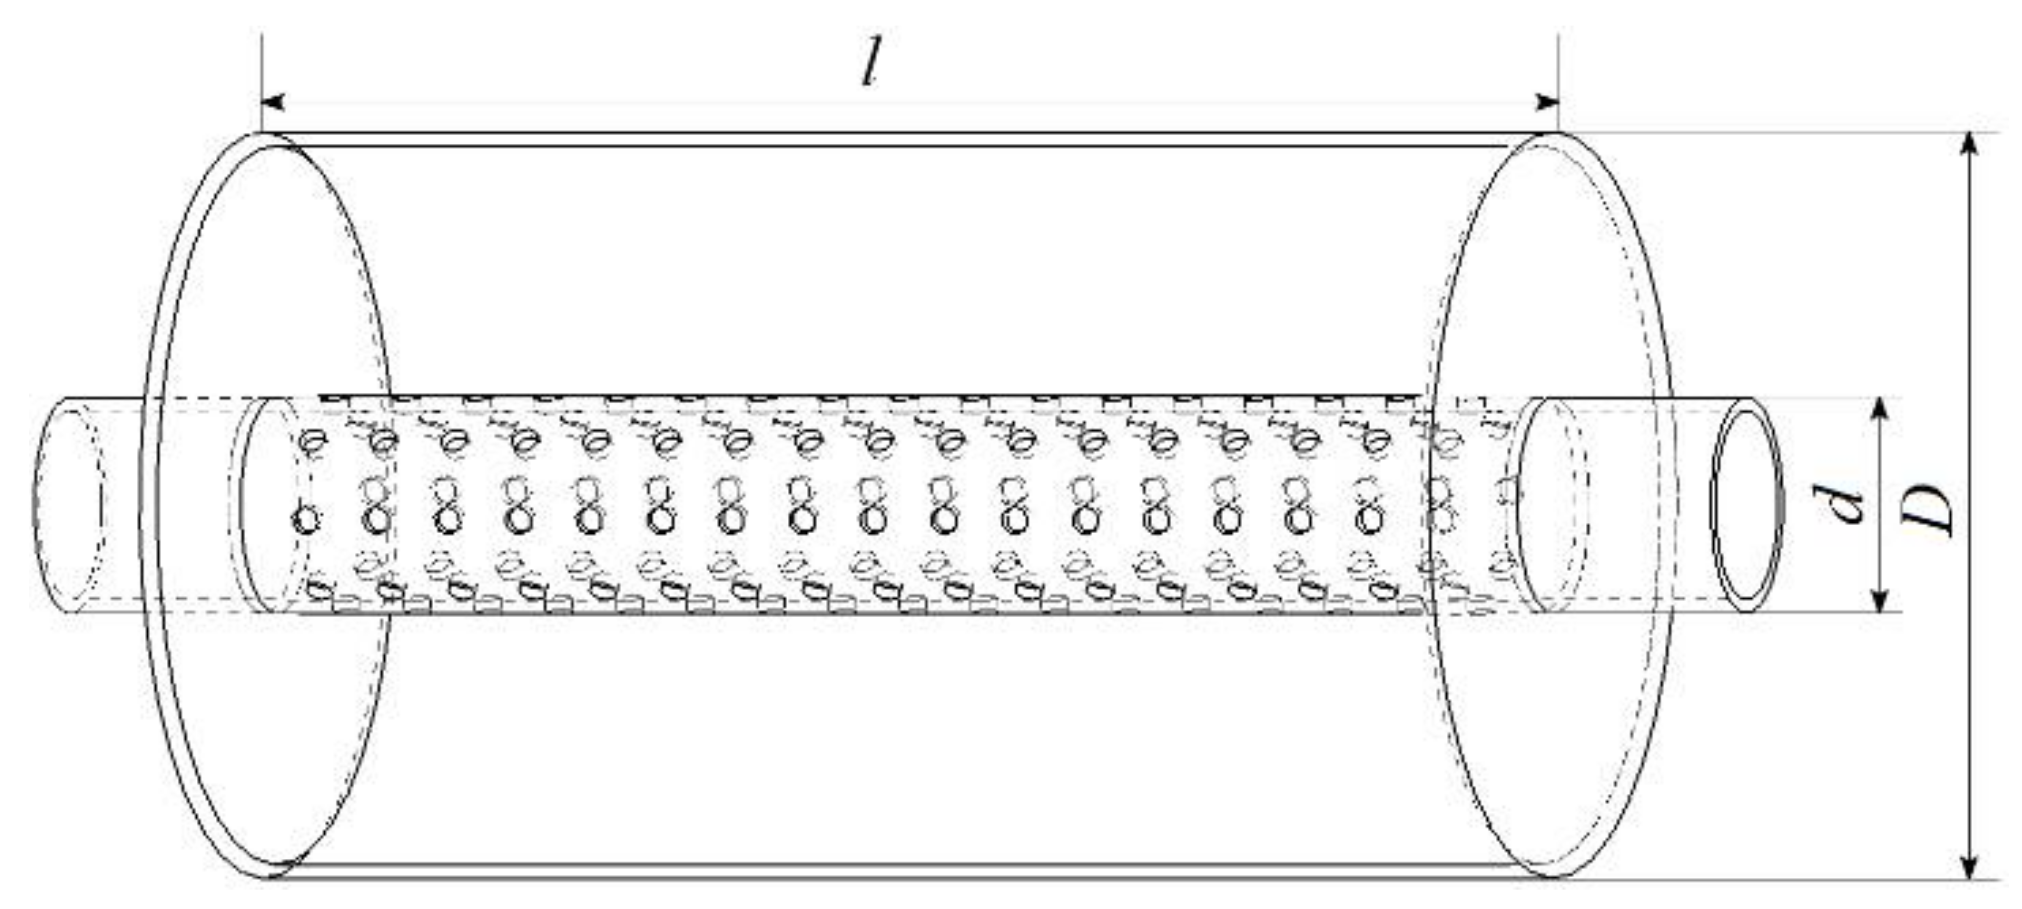
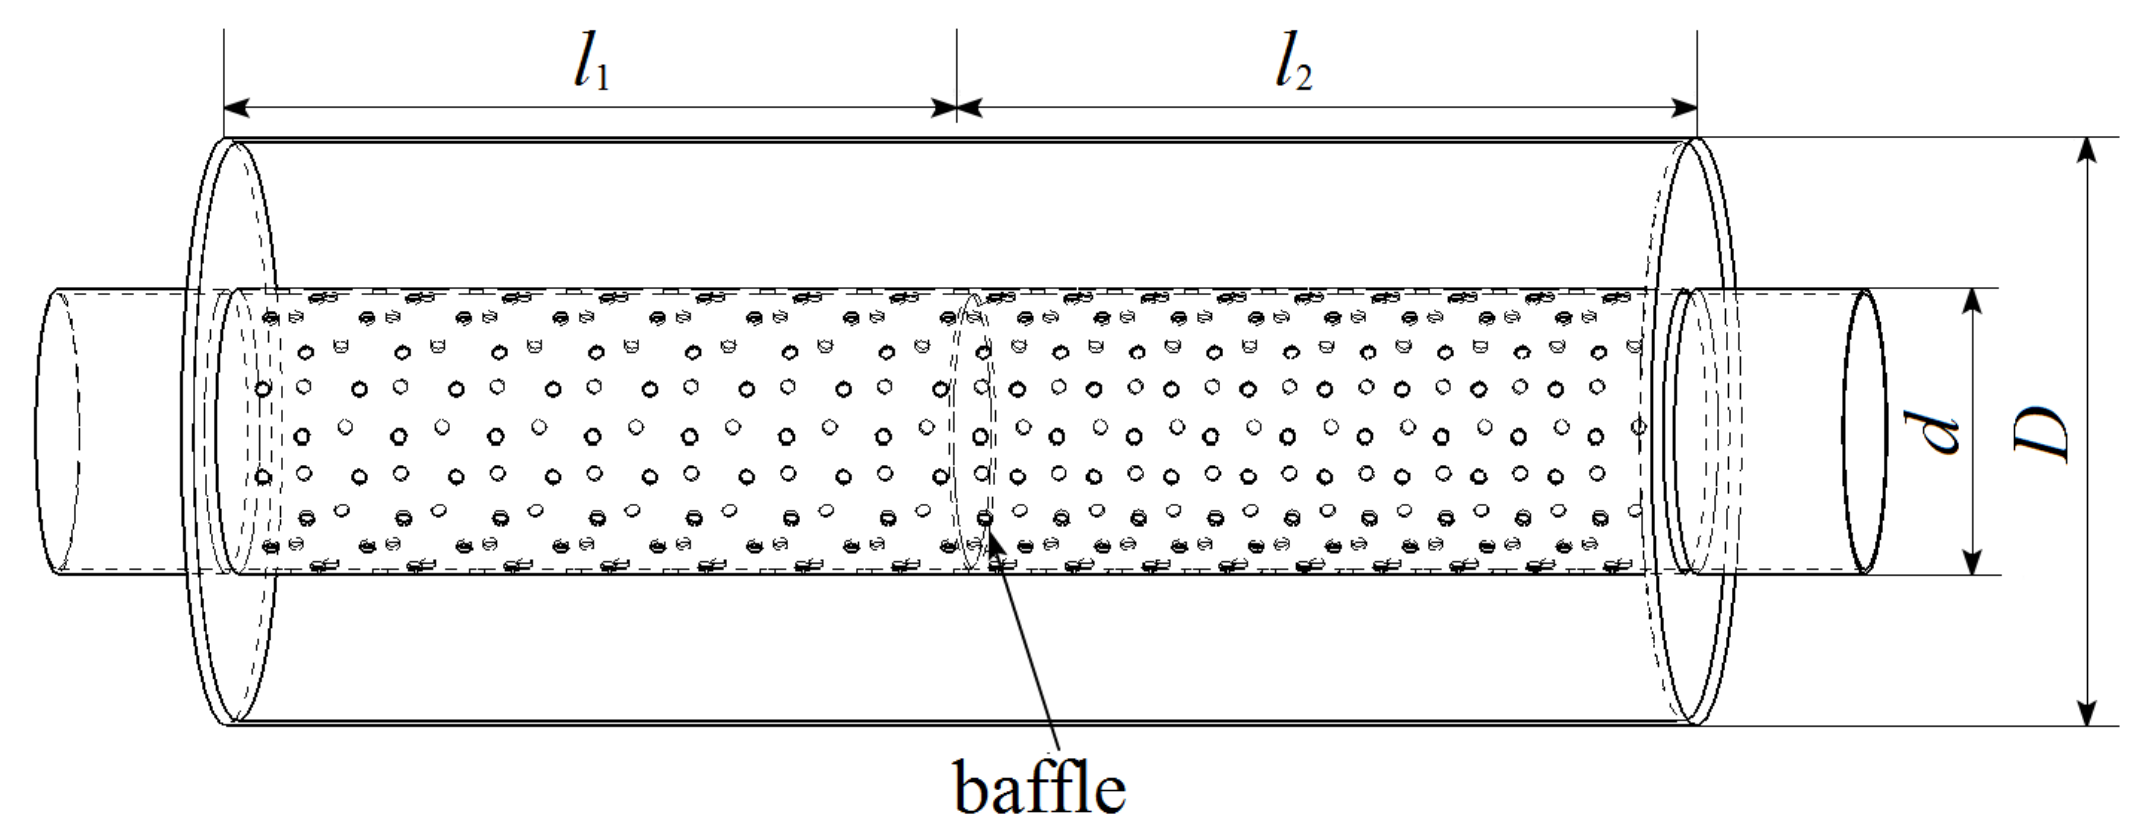
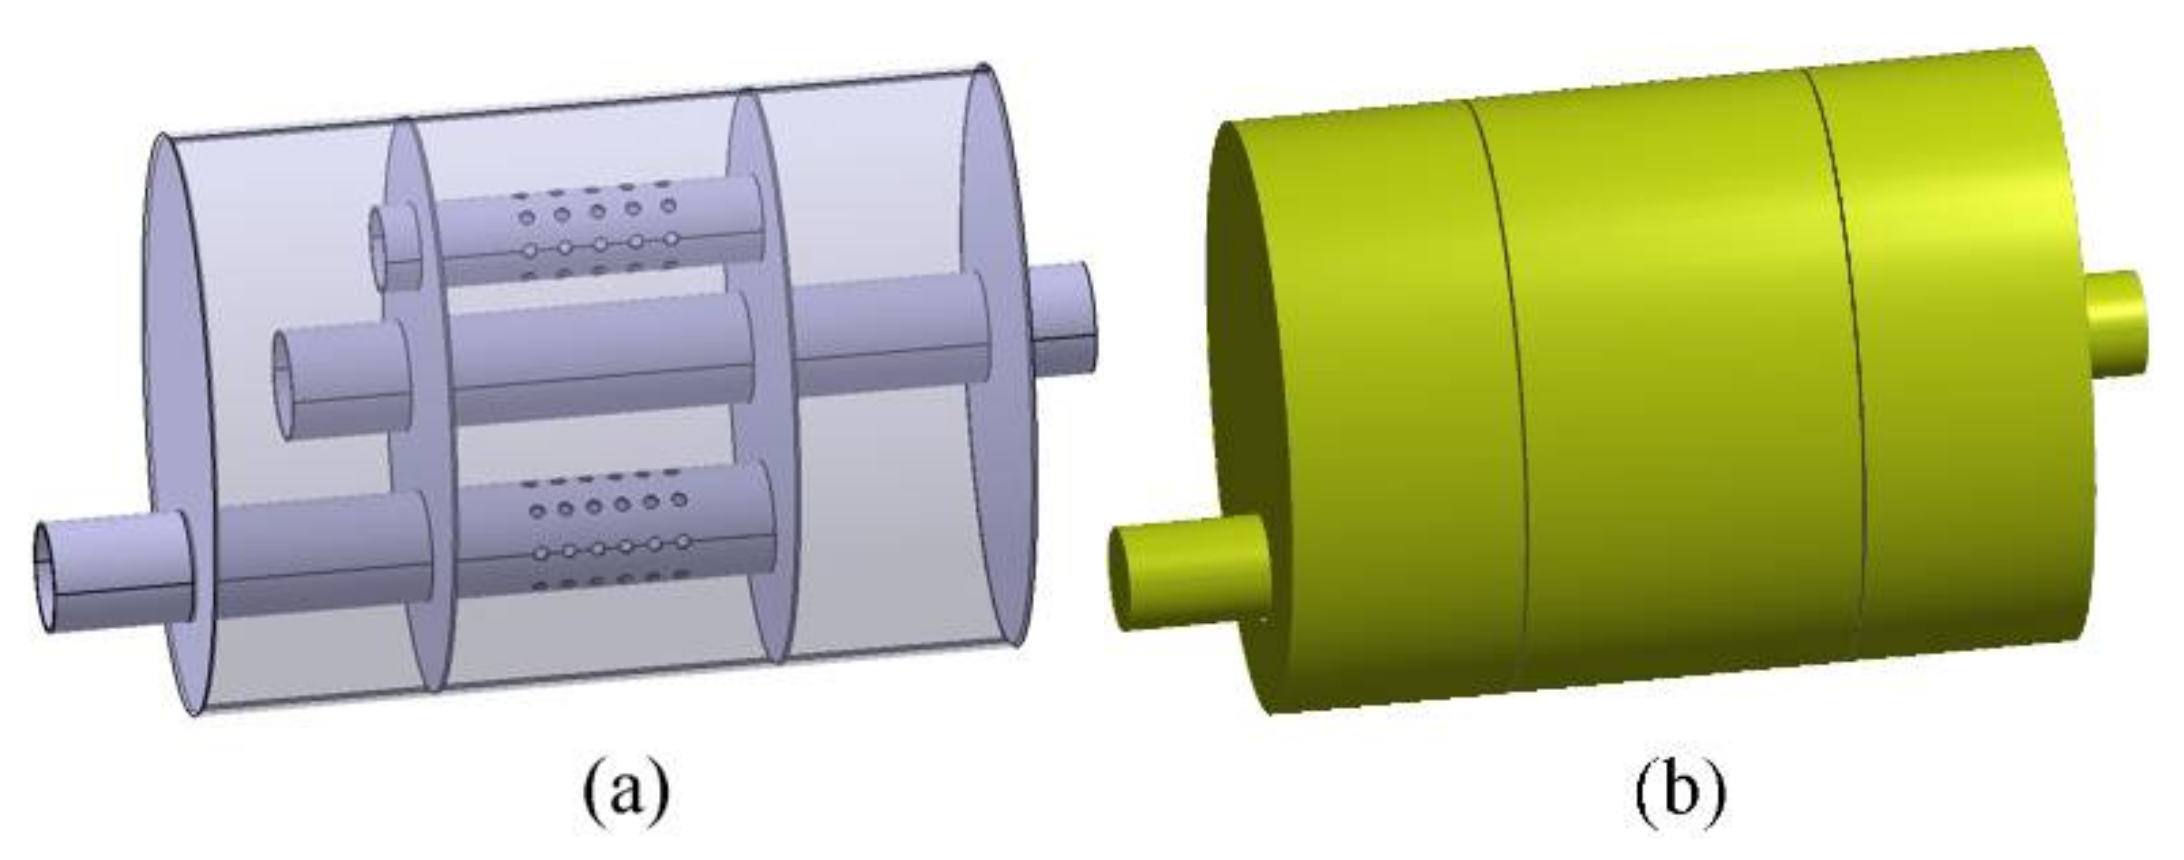
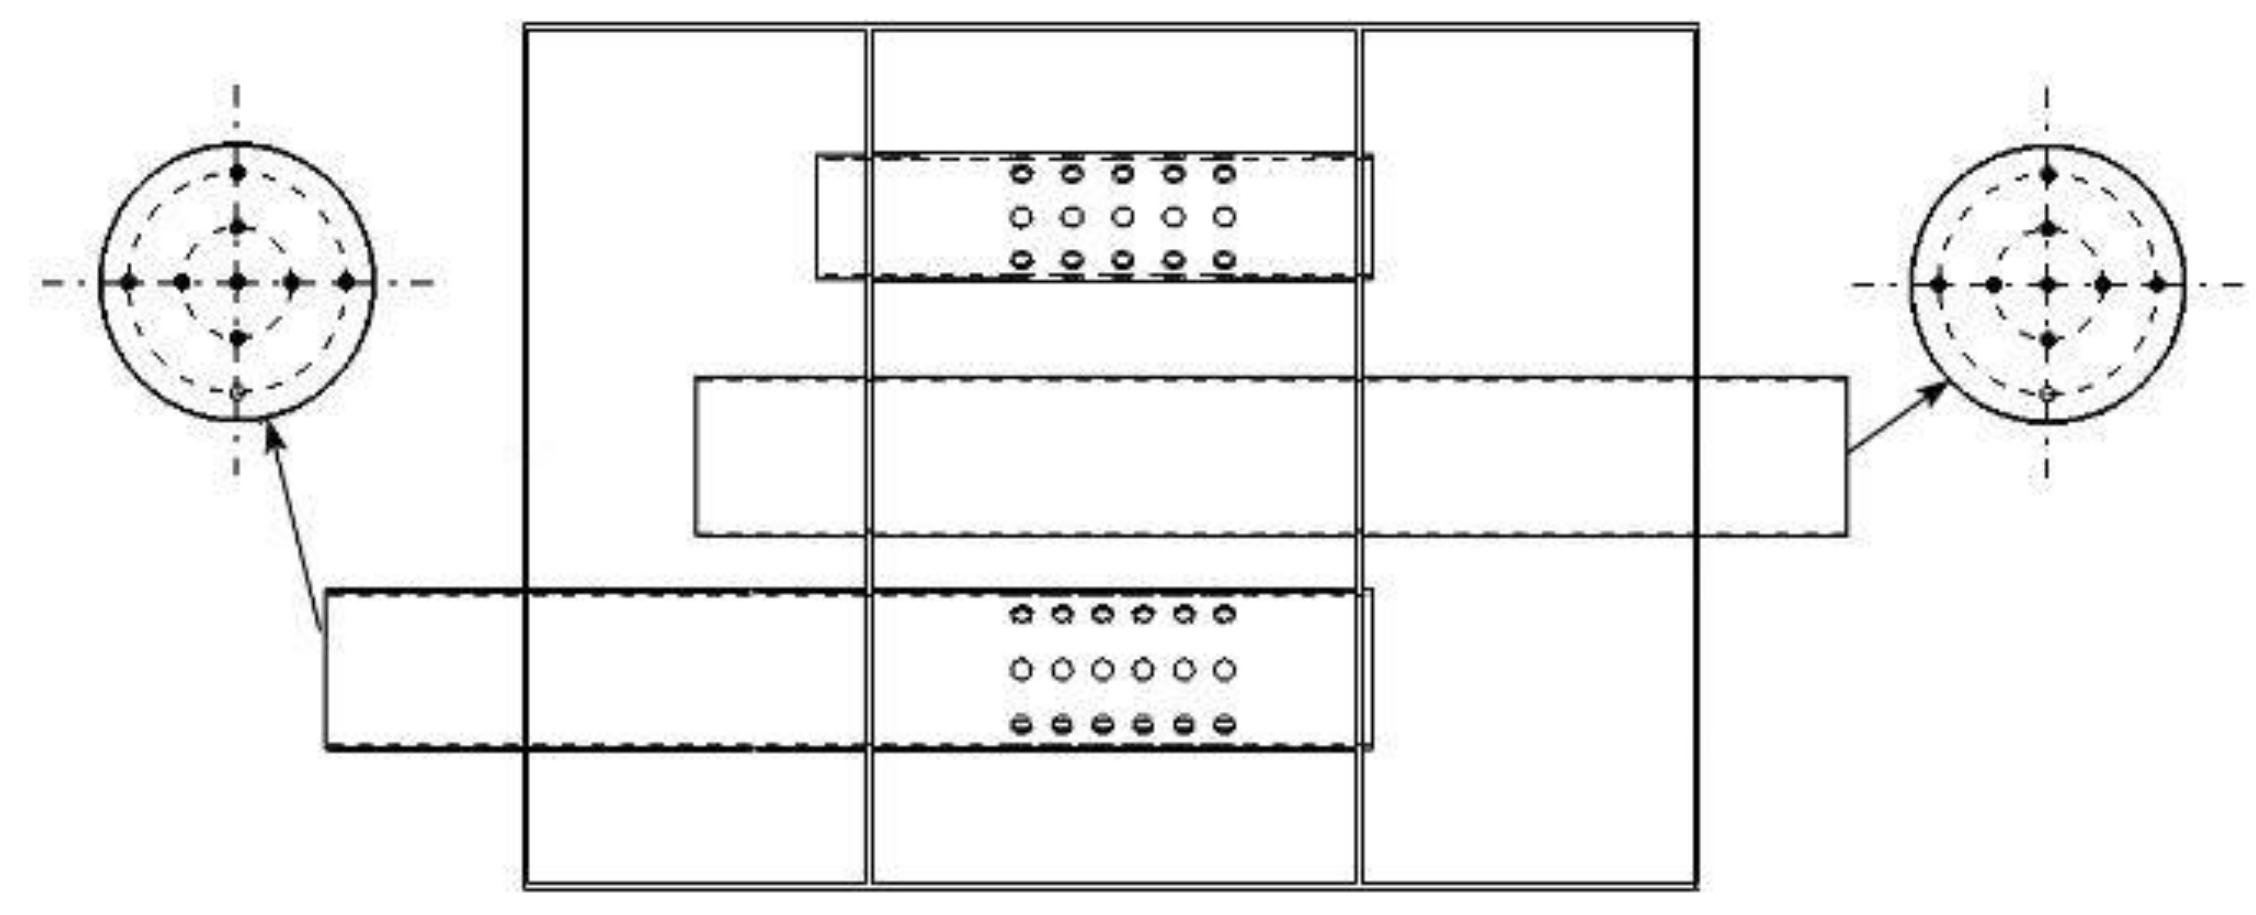
3.1. Modeling
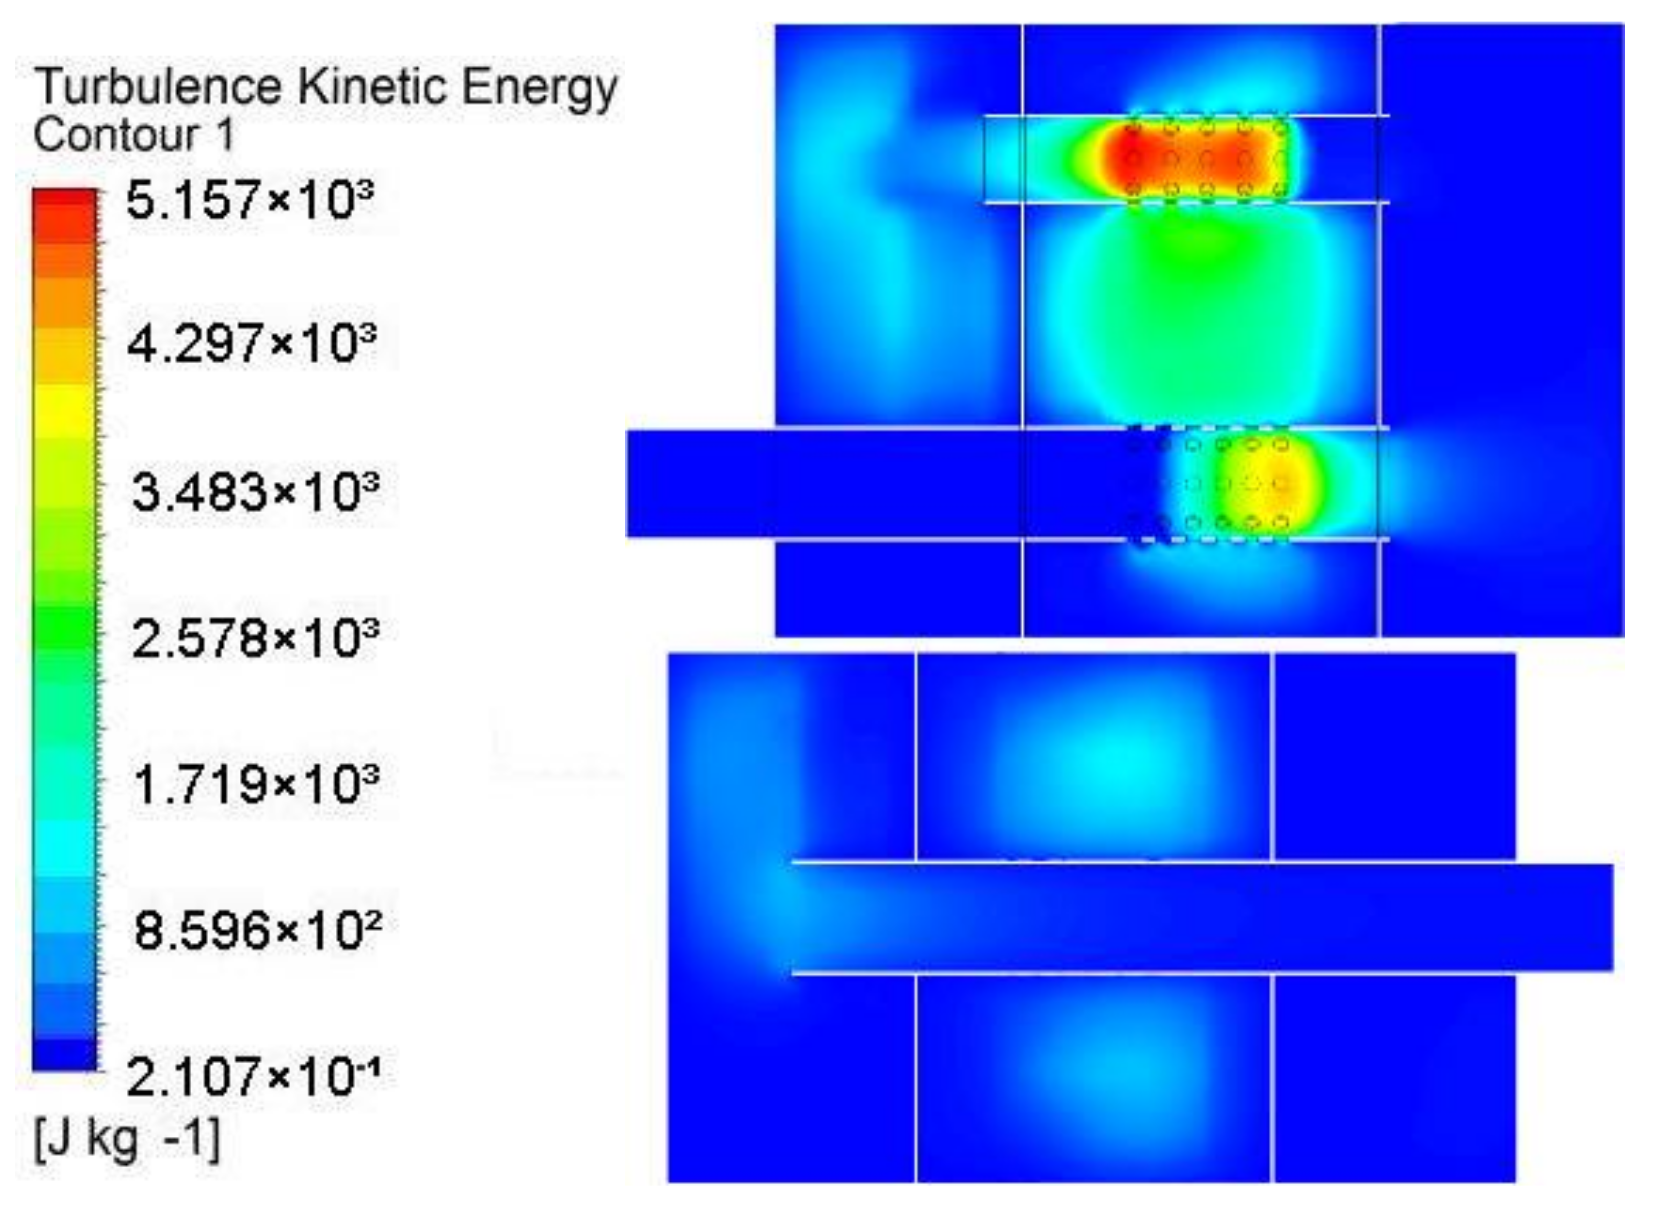
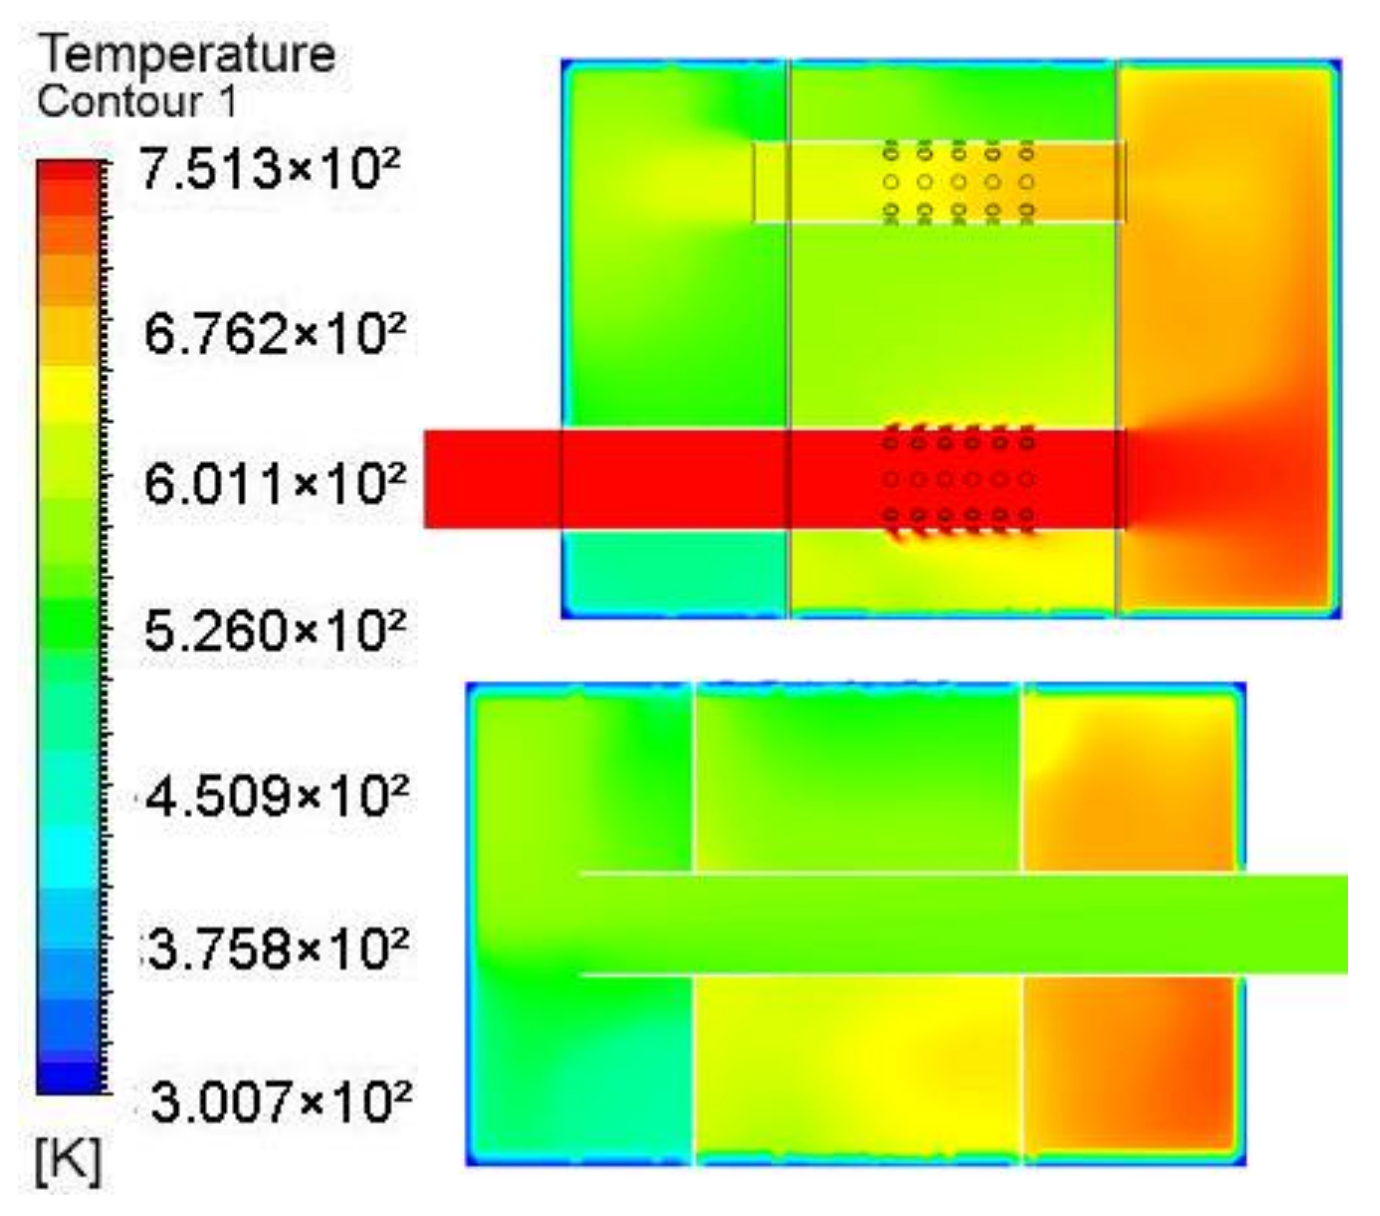
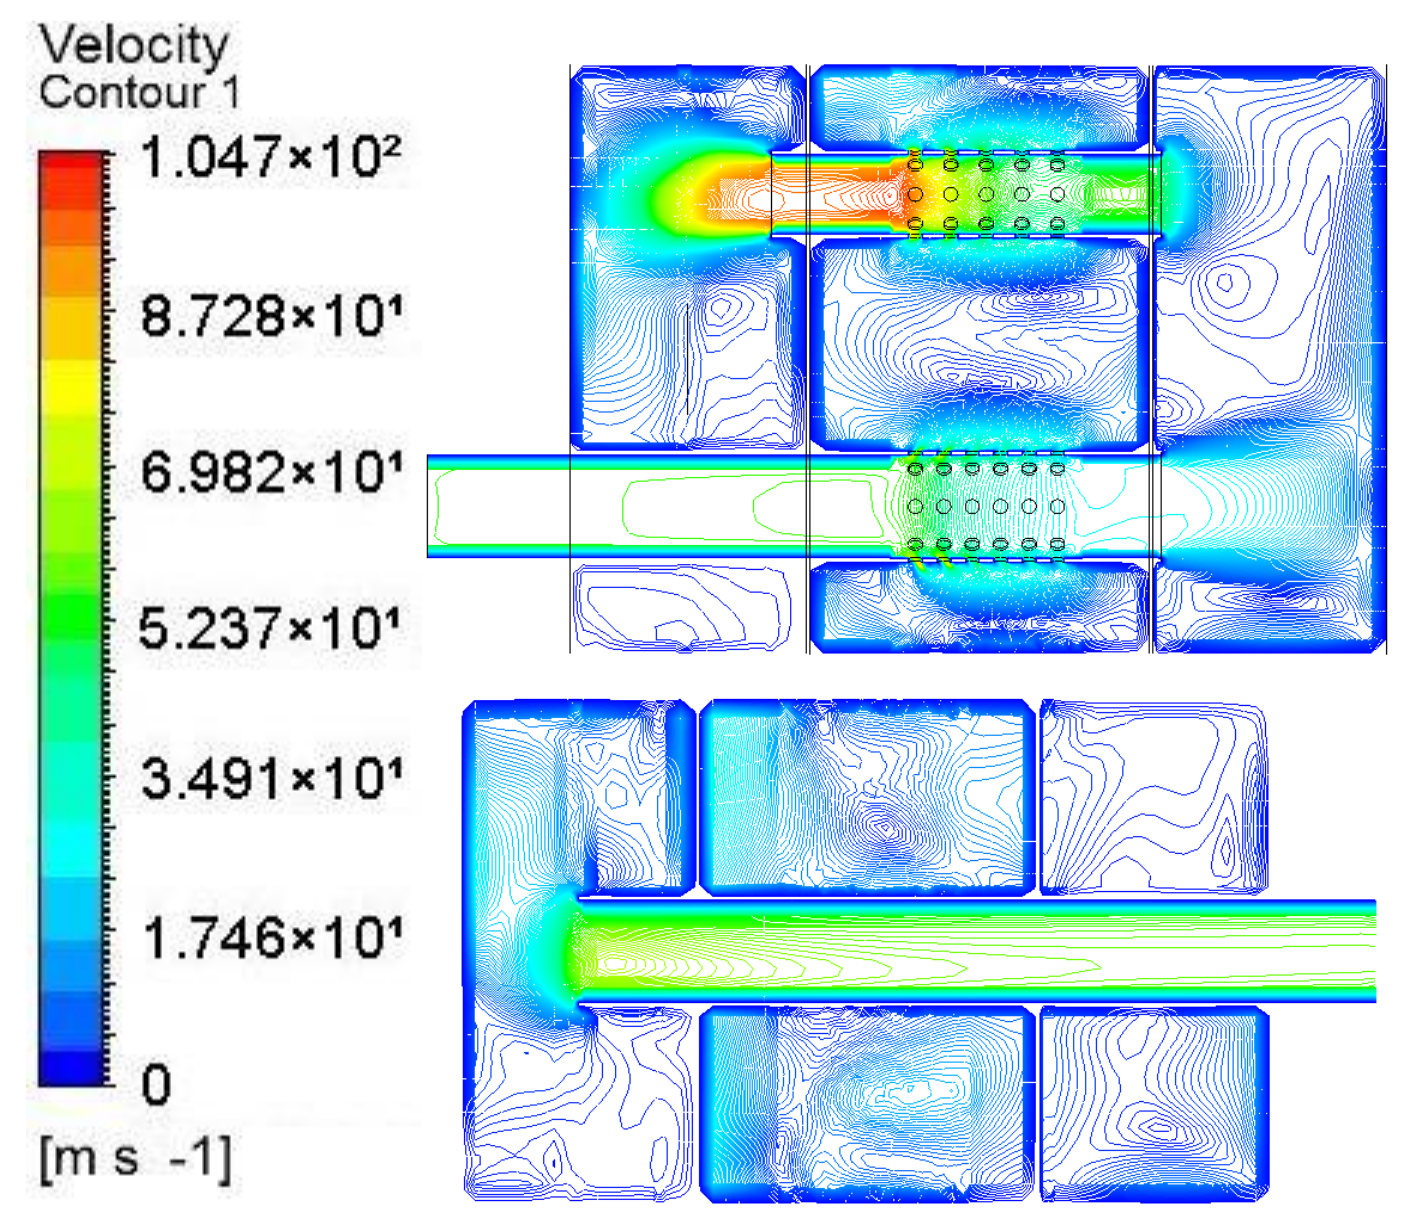
3.2. The CFD Results
3.3. Pressure Loss Calculation
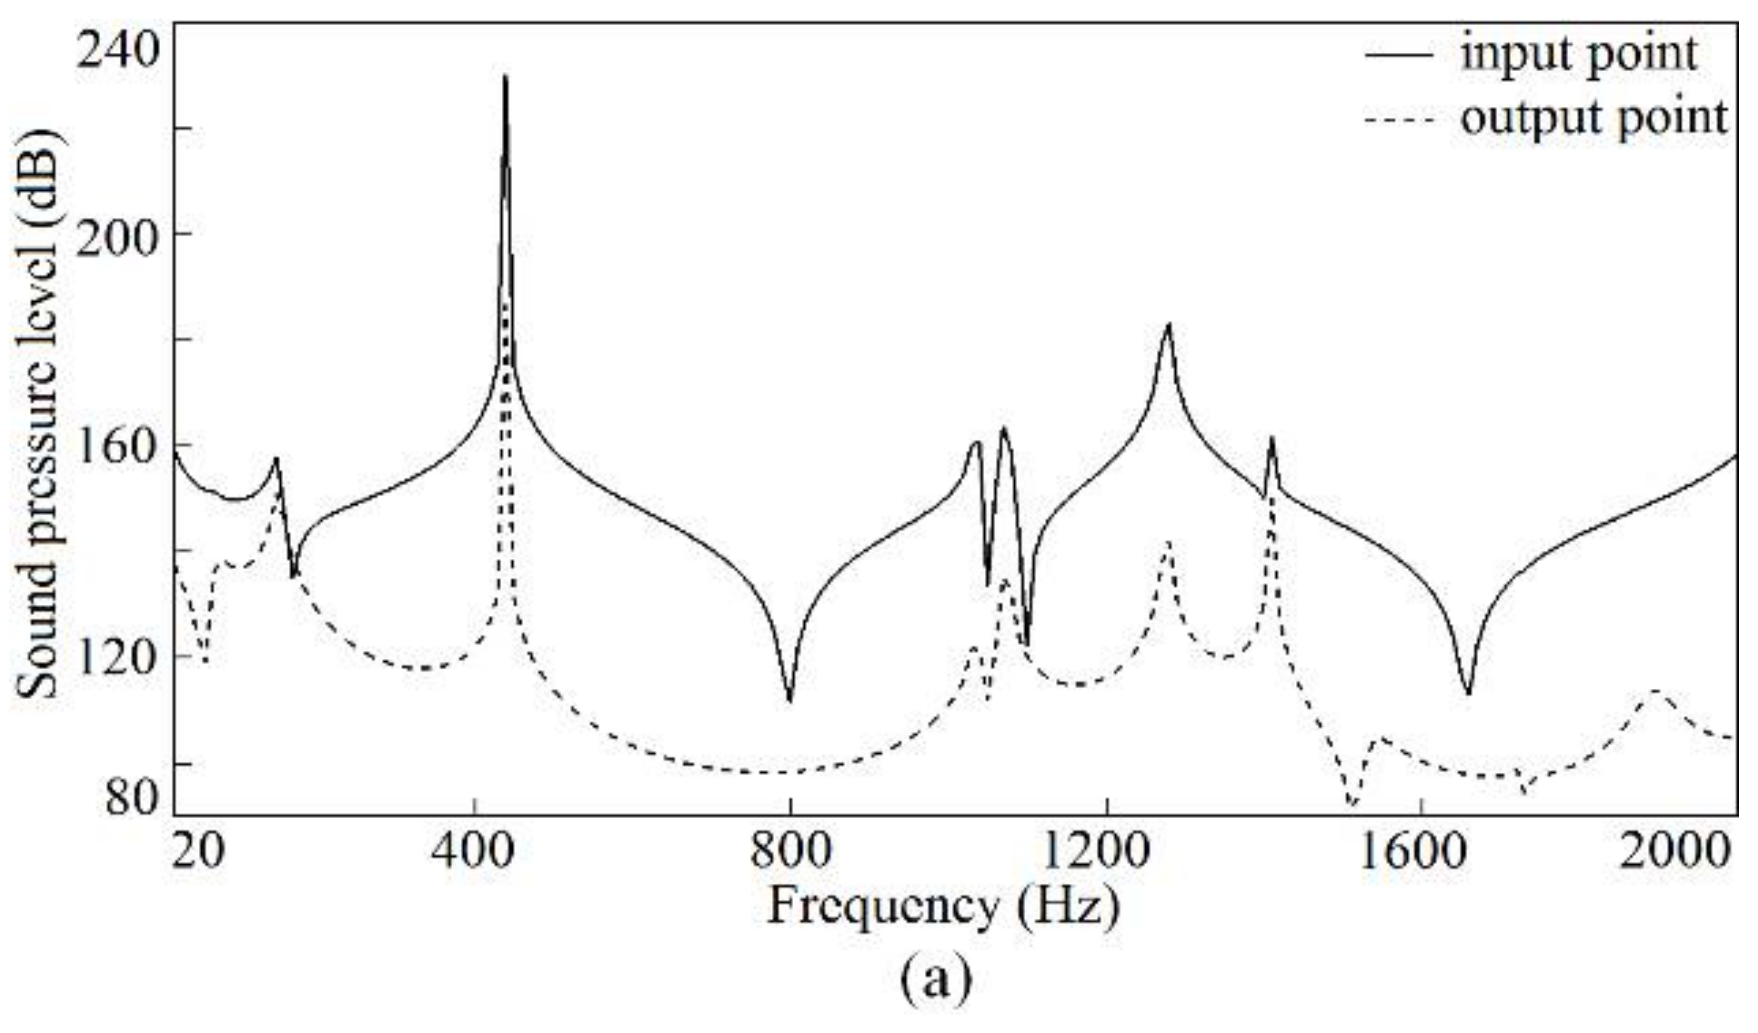
4. Sound Field
4.1. Check the Maximum Frequency Value of the Acoustic Mesh
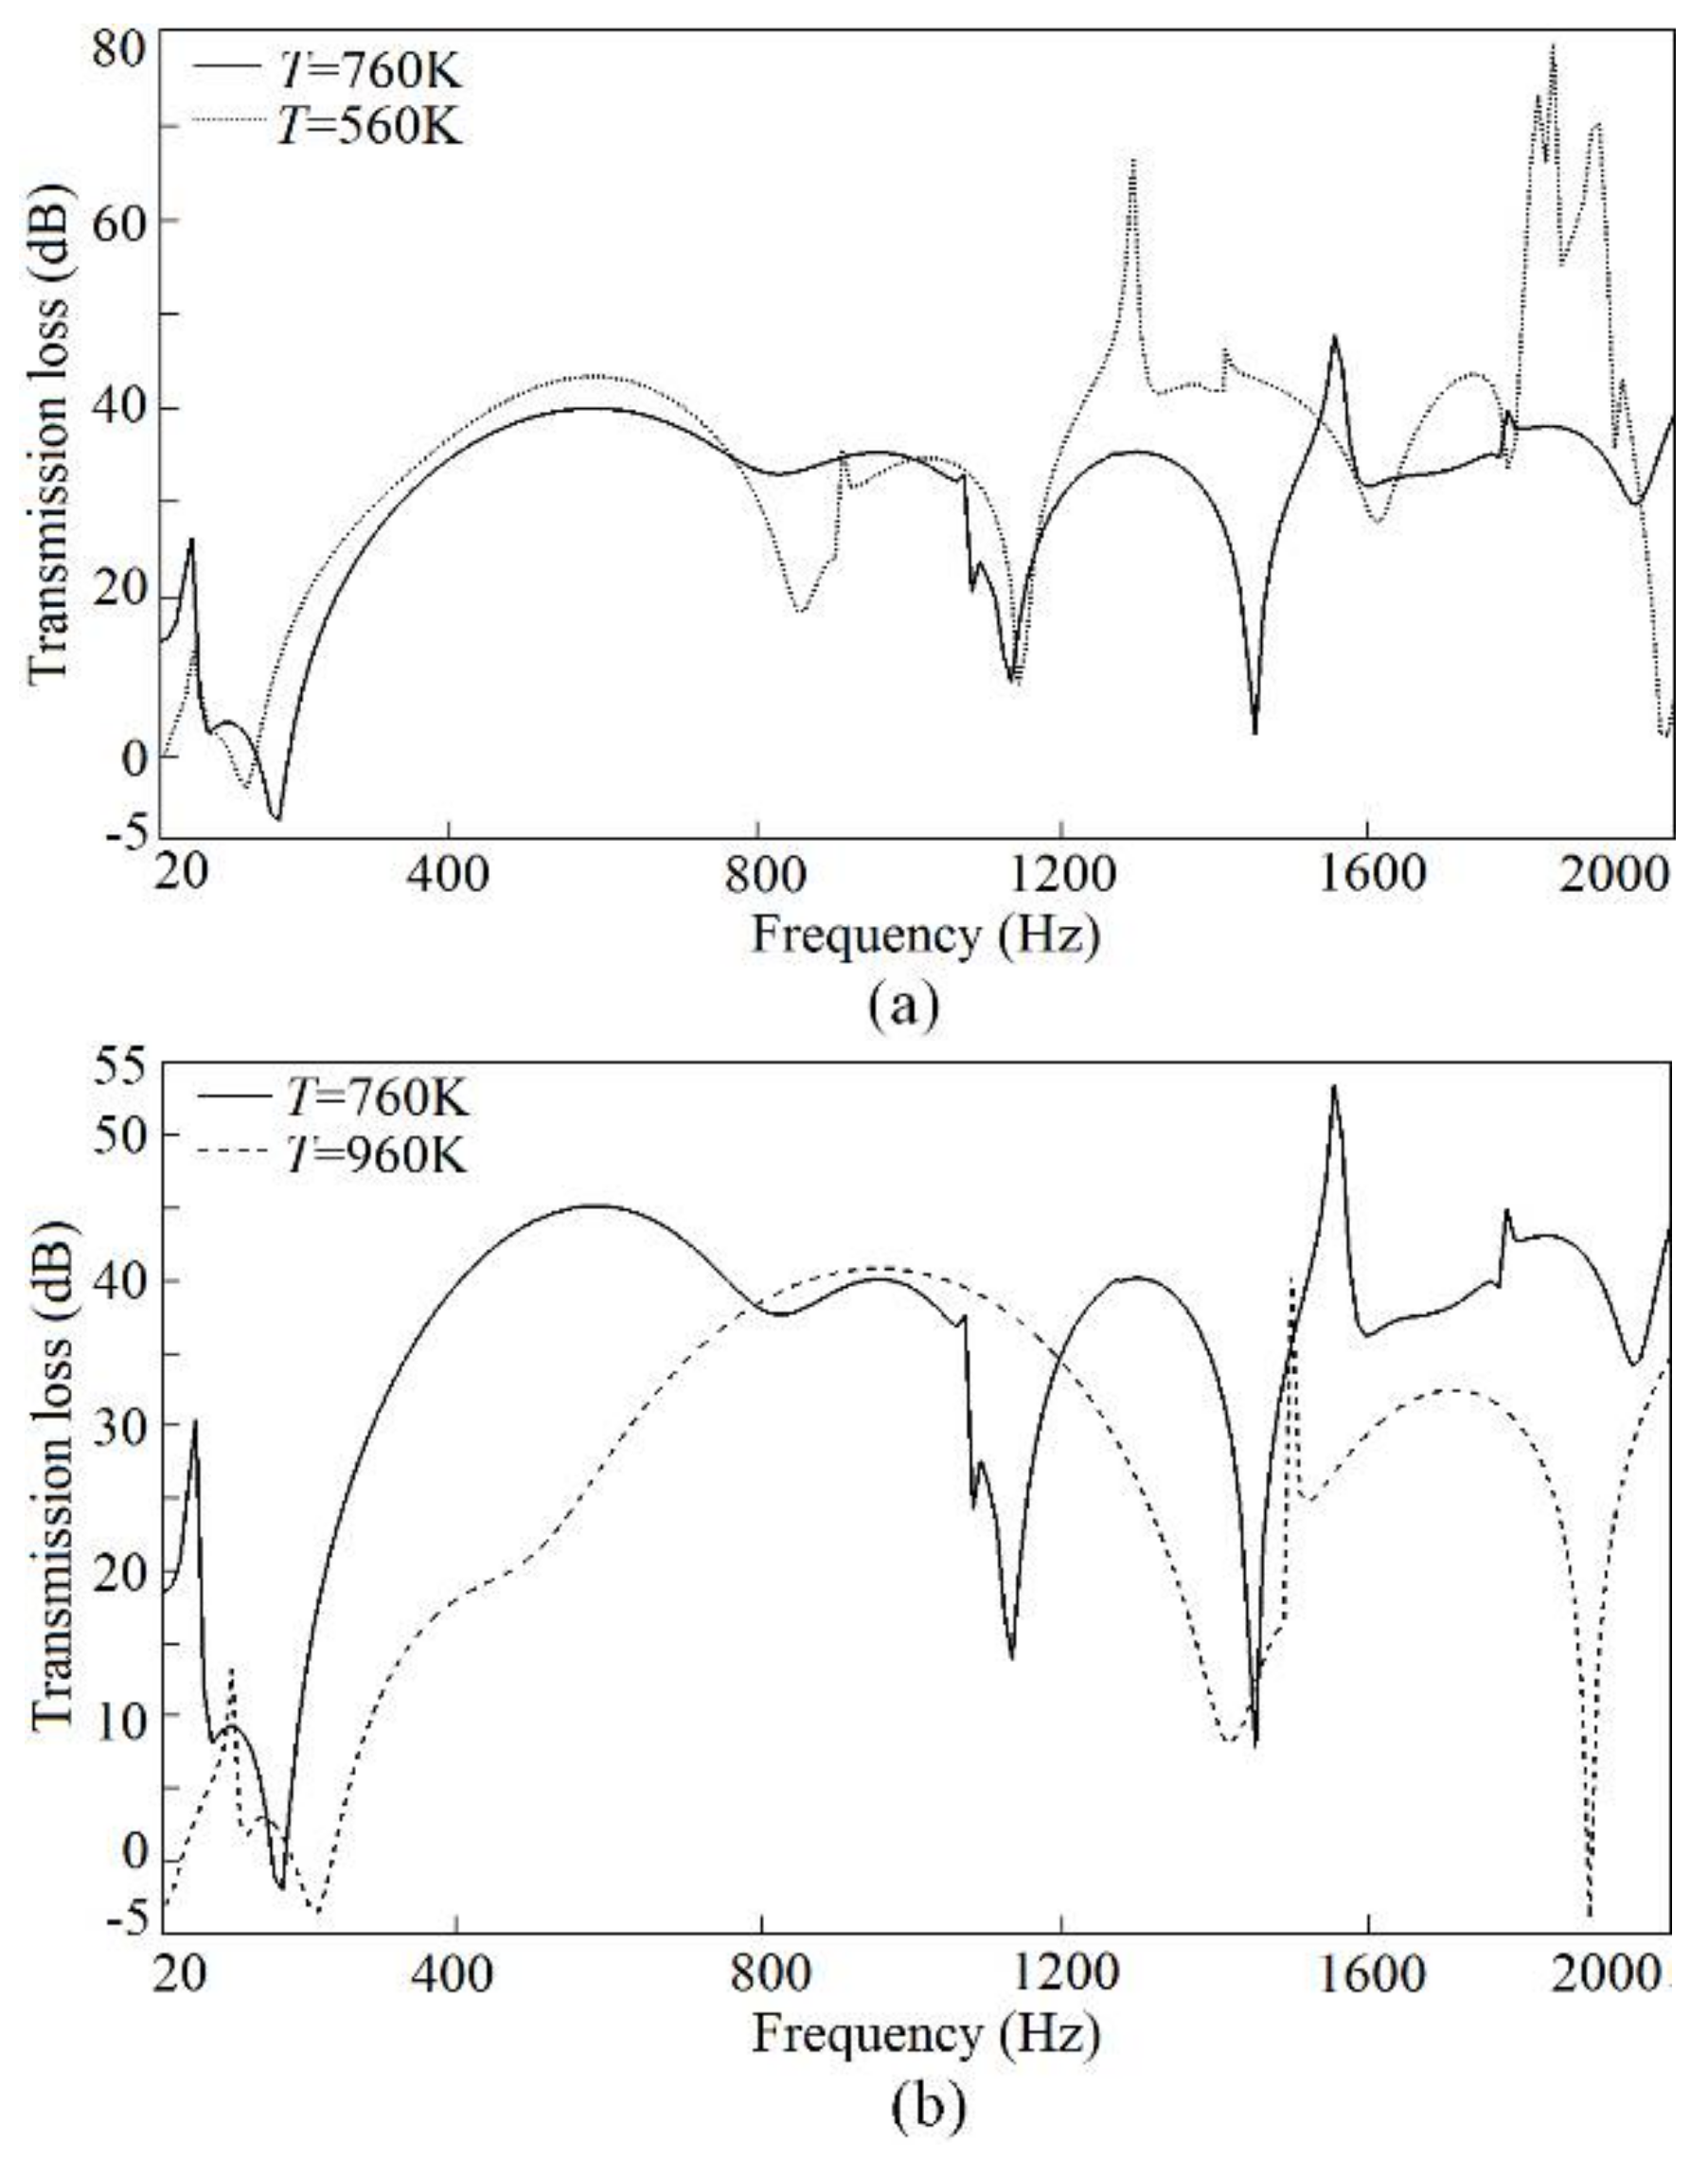
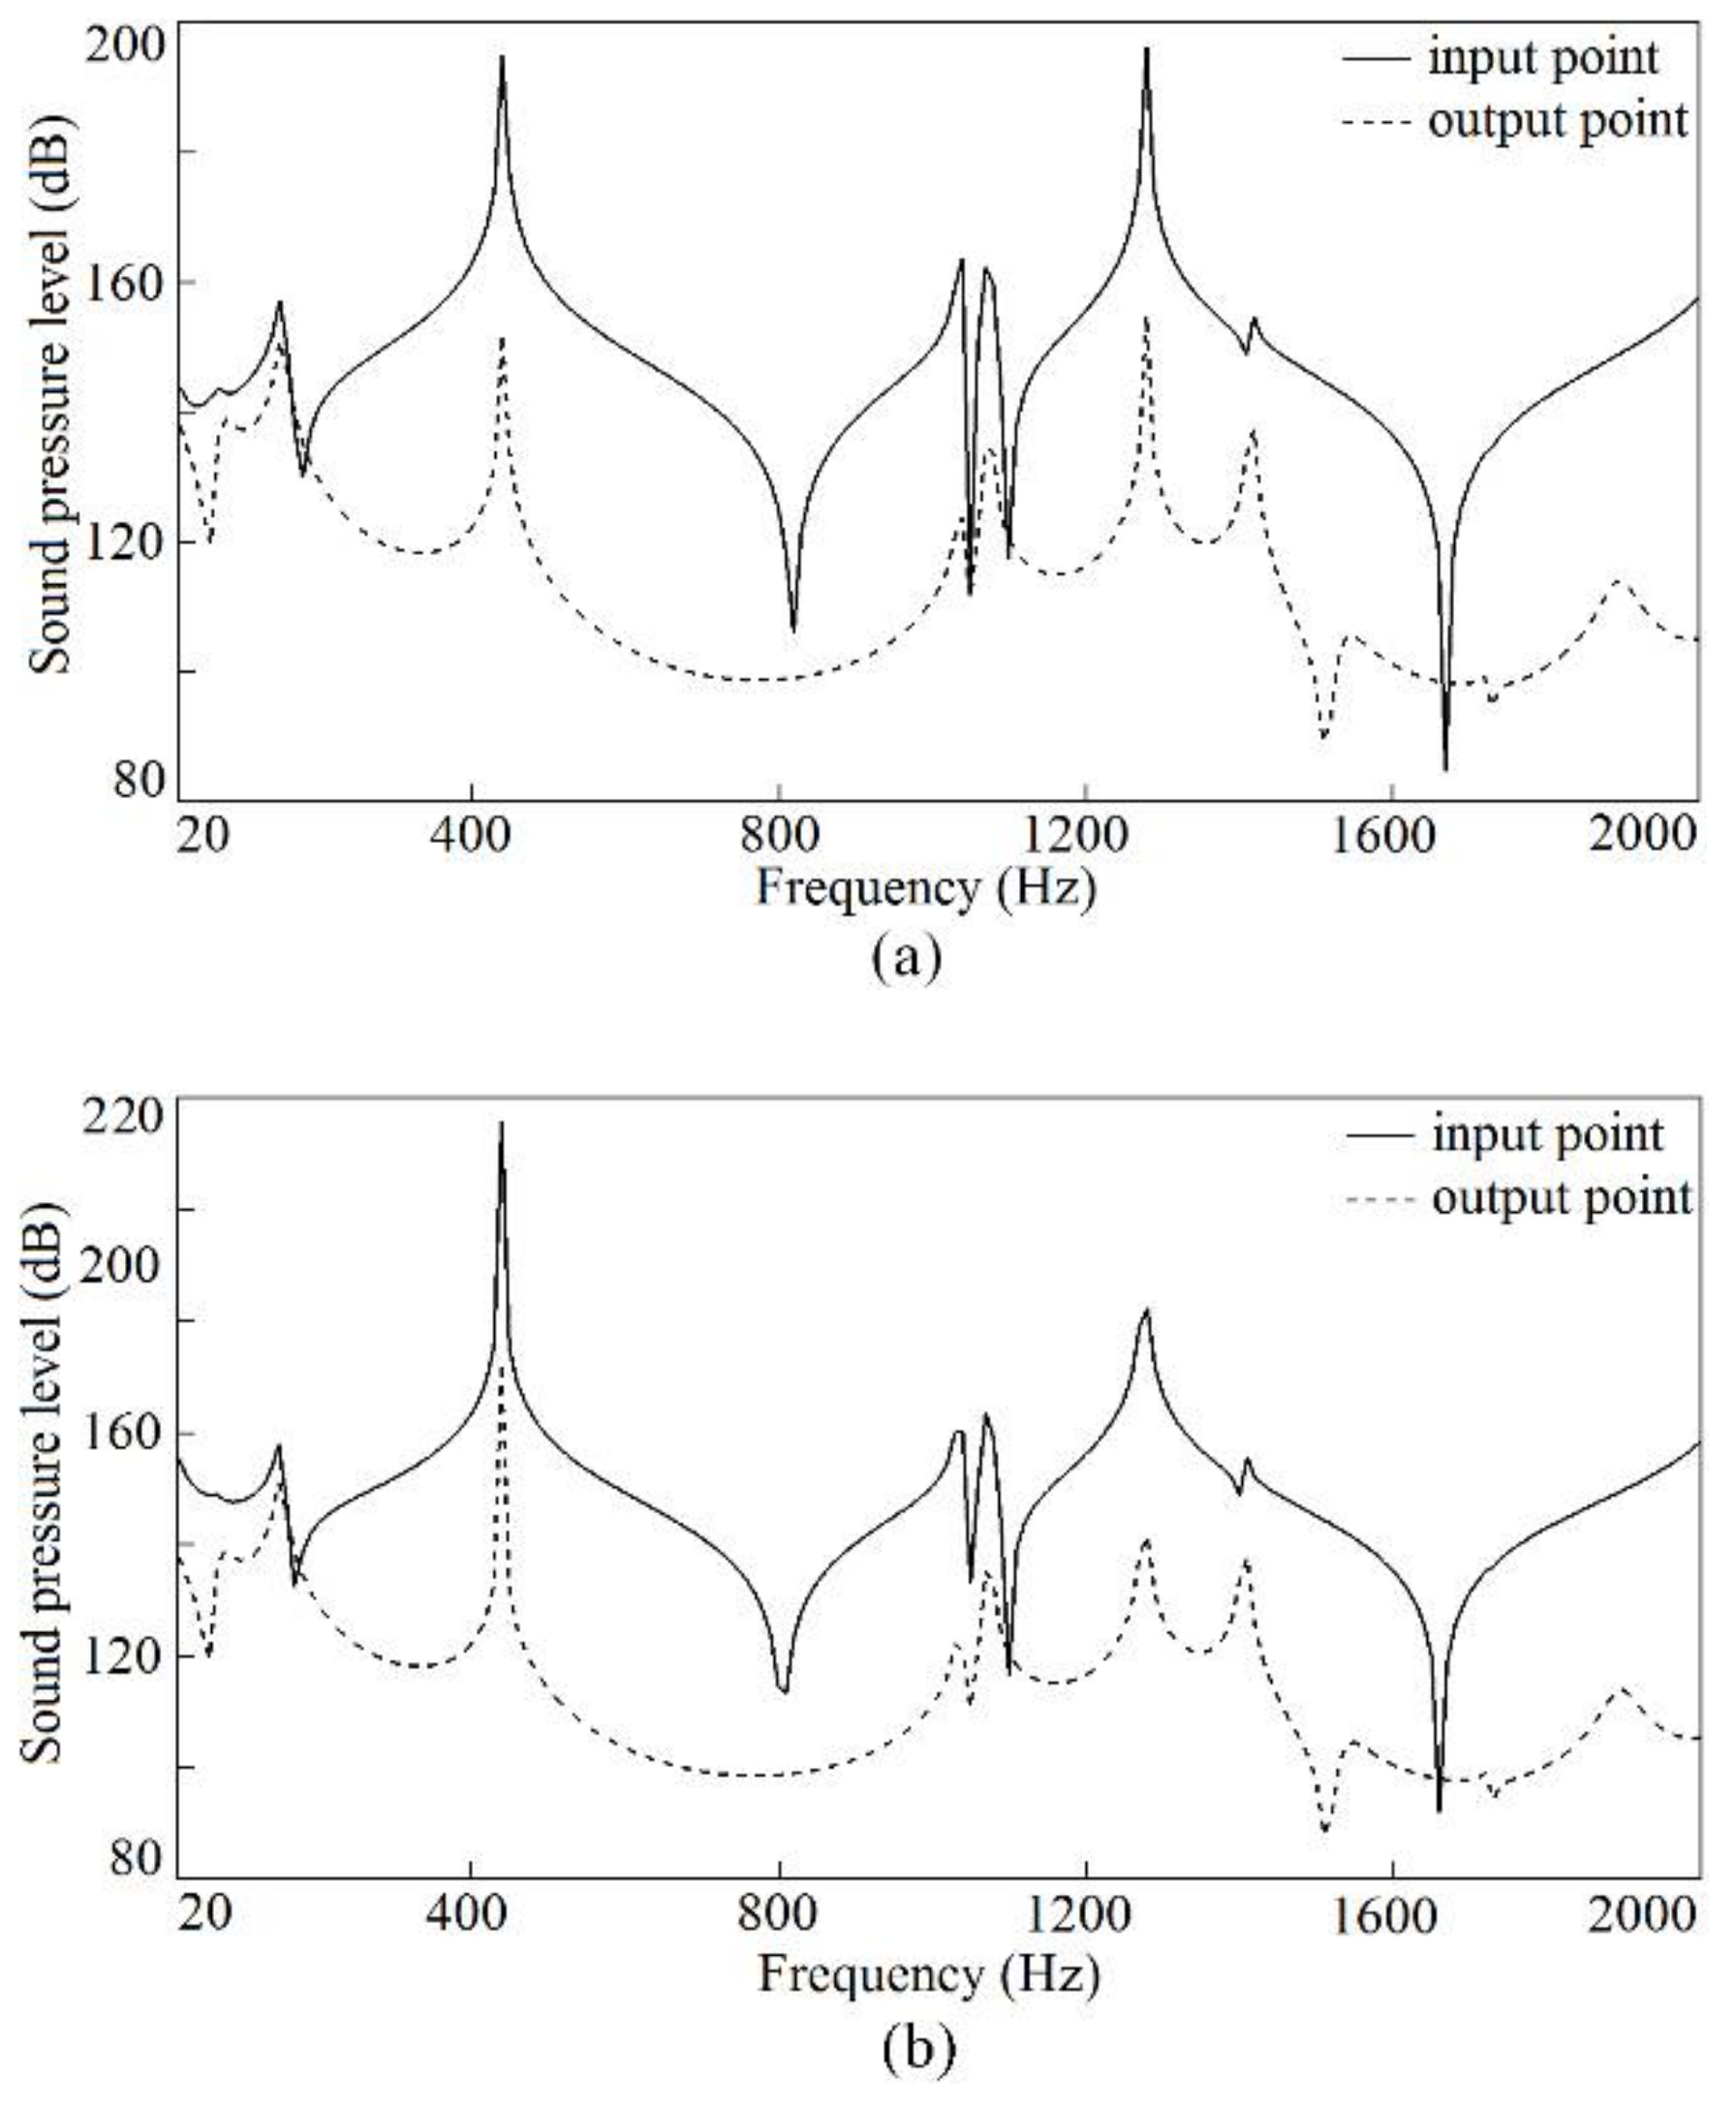
4.2. Effects of Temperature Changes on the TL of the Silencer
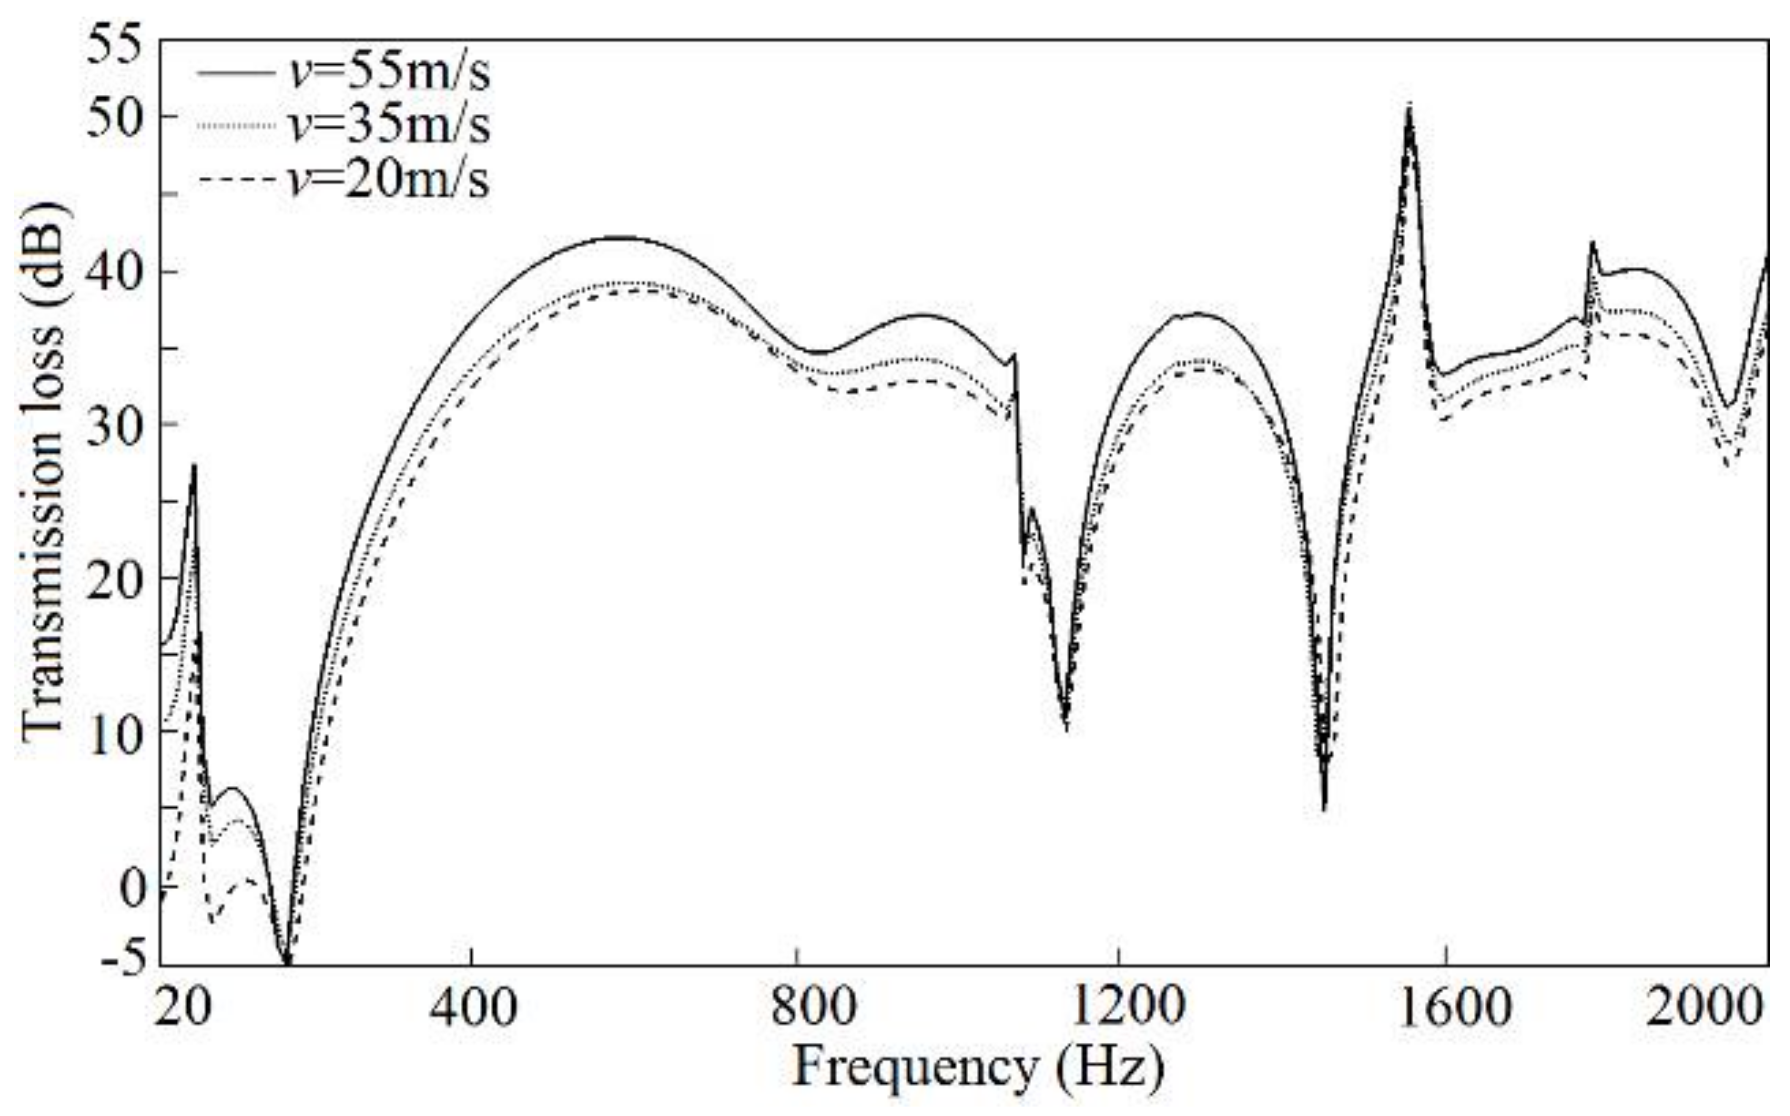
4.3. Effects of Flow Velocity Changes on the TL of the Silencer
5. Conclusions
Acknowledgments
Author Contributions
Conflicts of Interest
References
- Shrivastava, A.K.; Tewari, V.K.; Santosh, K. Effect of Exhaust Back Pressure on Noise Characteristic of Tractor Mufflers. AMA Agric. Mech. Asia 2014, 45, 79–83. [Google Scholar]
- Panigrahi, S.N.; Munjal, M.L. Backpressure Considerations in Designing of Cross Flow Perforated-element Reactive Silencers. Noise Control Eng. J. 2007, 55, 504–515. [Google Scholar] [CrossRef]
- Bouldin, B.; Vunnam, K.; Hernanz-Manrique, J.A.; Ambit-Marin, L. CFD Analysis and Full Scale Testing of a Complex Auxiliary Power Unit Intake System. In Proceedings of the ASME Turbo Exposition, Vancouver, BC, Canada, 6–10 June 2011. [Google Scholar]
- Chen, W.X.; Chong, D.T.; Yan, J.J.; Dong, S.C.; Liu, J.P. Numerical Investigation of Two-Phase Flow in Natural Gas Ejector. Heat Transf. Eng. 2014, 35, 738–745. [Google Scholar] [CrossRef]
- Middelberg, J.M.; Barber, T.J.; Byme, K.P.; Leong, S.S.; Leonadi, E. CFD Analysis of the Acoustic and Mean Flow Performance of Simple Expansion Chamber Mufflers; ASME Paper No. IMECE2004-61371; ASME: New York, NY, USA, 2004. [Google Scholar]
- Lee, S.H.; Ih, J.G. Effect of Non-Uniform Perforation in the Long Concentric Resonator on Transmission Loss and Back Pressure. J. Sound Vib. 2008, 311, 280–296. [Google Scholar] [CrossRef]
- Ren, J.W.; Jiang, Q.Y.; Wang, Z. CFD Simulation and Computation of Pressure Loss of Resistance Muffler. In Proceedings of the 4th International Conference on Manufacturing Science and Engineering, Dalian, China, 30–31 March 2013. [Google Scholar]
- Wylen, G.J.V.; Sonntag, R.E.; Borgnakke, C. Fundamentals of Classical Thermodynamics; Wiley: New York, NY, USA, 1985. [Google Scholar]
- Wang, C.N.; Tse, C.C.; Chen, S.C. Flow Induced Aerodynamic Noise Analysis of Perforated Tube Mufflers. J. Mech. 2013, 29, 224–231. [Google Scholar] [CrossRef]
- Sullivan, J.W. A Method for Modeling Perforated Tube Muffler Components: I. Theory; II. Applications. J. Acoust. Soc. Am. 1979, 66, 772–788. [Google Scholar] [CrossRef]
- Sujith, R.I. Transfer Matrix of a Uniform Duct with an Axial Mean Temperature Gradient. J. Acoust. Soc. Am. 1996, 100, 2540–2542. [Google Scholar] [CrossRef]
- Selamet, A.; Ji, Z.L. Acoustic Attenuation Performance of Circular Chambers with Single-inlet and double-outlet. J. Sound Vib. 2000, 299, 3–19. [Google Scholar] [CrossRef]
- Kim, Y.H.; Choi, J.W.; Lim, B.D. Acoustic characteristics of an expansion chamber with constant mass flow and steady temperature gradient (theory and numerical simulation). ASME J. Vib. Acoust. 1990, 112, 460–467. [Google Scholar] [CrossRef]
- Tsugi, T.; Tsuchiya, T.; Kagawa, Y. Finite Element and Boundary Element Modeling for the Acoustic Wave Transmission in Mean Flow Medium. J. Sound Vib. 2002, 255, 849–866. [Google Scholar] [CrossRef]
- Kirby, R. A Comparison between Analytic and Numerical Methods for Modelling Automotive Dissipative Silencers with Mean Flow. J. Sound Vib. 2009, 325, 565–582. [Google Scholar] [CrossRef]
- Broath, A.; Margot, X.; Gila, A. A CFD Approach to the Computation of the Acoustic Response of Exhaust Mufflers. J. Comput. Acoust. 2005, 13, 301–316. [Google Scholar] [CrossRef]
- Sanchez-Orgaz, E.M.; Denia, F.D.; Martinez-Casas, J.; Baeza, L. 3D Acoustic Modelling of Dissipative Silencers with Nonhomogeneous Properties and Mean Flow. Adv. Mech. Eng. 2014, 6, 537935. [Google Scholar] [CrossRef]
- Dong, H.L.; Deng, Z.X.; Lai, F. Analysis and Improvement of Muffler Acoustic Performance Considering Temperature Influence. J. Vib. Eng. 2009, 22, 70–75. [Google Scholar]
- LMS Virtual. Lab. LMS Virtual. Lab Online Help; LMS International N.V.: Leuven, Belgium, 2013; Volume 11. [Google Scholar]
- Guo, L.X.; Fan, W. A comparison between various numerical simulation methods for predicting the transmission loss in silencers. J. Eng. Res. 2017, 5, 163–180. [Google Scholar]
- Lee, S.H.; Ih, J.G. Empirical Model of the Acoustic Impedance of a Circular Orifice in Grazing Mean Flow. J. Acoust. Soc. Am. 2003, 114, 98–113. [Google Scholar] [CrossRef] [PubMed]
- Liu, C.; Ji, Z.L. Computational Fluid Dynamics-Based Numerical Analysis of Acoustic Attenuation and Flow Resistance Characteristics of Perforated Tube Silencers. ASME J. Vib. Acoust. 2014, 136, 21006. [Google Scholar] [CrossRef]
- ANSYS Fluent 12.1 in Workbench User’s Guide; ANSYS Worbench 12.1; ANSYS Inc.: New York, NY, USA, 2009.
- Fang, J.H.; Zhou, Y.Q.; Hu, X.D.; Lin, Z.S. Study on Aerodynamic Quality and Fluid Simulation of Expansion Mufflers. J. Syst. Simul. 2009, 21, 6399–6404. [Google Scholar]
- Pan, D.Y.; Sun, J.Q.; Fang, D.Q.; Dong, J.Y. Research and Application on Flow Characteristics of Muffler. Noise Vib. Control 1984, 5, 9–14. [Google Scholar]
- Karlsson, M.; Abomb, M. Aeroacoustics of T-Junctions—An Experimental Investigation. J. Sound Vib. 2010, 329, 1793–1808. [Google Scholar] [CrossRef]
- Zhan, F.L.; Xu, J.W. Virtual. Lab Acoustics Simulation from Entry to Master; Northwestern Polytechnical University Press: Xi’an, China, 2013. [Google Scholar]


© 2018 by the authors. Licensee MDPI, Basel, Switzerland. This article is an open access article distributed under the terms and conditions of the Creative Commons Attribution (CC BY) license (http://creativecommons.org/licenses/by/4.0/).
Share and Cite
Zhang, H.; Fan, W.; Guo, L.-X. A CFD Results-Based Approach to Investigating Acoustic Attenuation Performance and Pressure Loss of Car Perforated Tube Silencers. Appl. Sci. 2018, 8, 545. https://doi.org/10.3390/app8040545
Zhang H, Fan W, Guo L-X. A CFD Results-Based Approach to Investigating Acoustic Attenuation Performance and Pressure Loss of Car Perforated Tube Silencers. Applied Sciences. 2018; 8(4):545. https://doi.org/10.3390/app8040545
Chicago/Turabian StyleZhang, Hao, Wei Fan, and Li-Xin Guo. 2018. "A CFD Results-Based Approach to Investigating Acoustic Attenuation Performance and Pressure Loss of Car Perforated Tube Silencers" Applied Sciences 8, no. 4: 545. https://doi.org/10.3390/app8040545
APA StyleZhang, H., Fan, W., & Guo, L.-X. (2018). A CFD Results-Based Approach to Investigating Acoustic Attenuation Performance and Pressure Loss of Car Perforated Tube Silencers. Applied Sciences, 8(4), 545. https://doi.org/10.3390/app8040545