Article

Mechanical Characterisation and Modelling of Elastomeric Shockpads

1
Wolfson School of Mechanical, Electrical and Manufacturing Engineering, Loughborough University, Loughborough LE11 3TU, UK
2
School of Architecture, Building and Civil Engineering, Loughborough University, Loughborough LE11 3TU, UK
*
Author to whom correspondence should be addressed.
Appl. Sci. 2018, 8(4), 501; https://doi.org/10.3390/app8040501
Submission received: 30 January 2018 / Revised: 19 March 2018 / Accepted: 20 March 2018 / Published: 27 March 2018
(This article belongs to the Special Issue Sports Materials)

Abstract

:
Third generation artificial turf systems are comprised of a range of polymeric and elastomeric materials that exhibit non-linear and strain rate dependent behaviours under the complex loads applied from players and equipment. An elastomeric shockpad is often included beneath the carpet layer to aid in the absorption of impact forces. The purpose of this study was to characterise the behaviour of two elastomeric shockpads and find a suitable material model to represent them in finite element simulations. To characterise the behaviour of the shockpads an Advanced Artificial Athlete test device was used to gather stress-strain data from different drop heights (15, 35 and 55 mm). The experimental results from both shockpads showed a hyperelastic material response with viscoelasticity. Microfoam material models were found to describe the material behaviour of the shockpads and were calibrated using the 55 mm drop height experimental data. The material model for each shockpad was verified through finite element simulations of the Advanced Artificial Athlete impact from different drop heights (35 and 15 mm). Finite element model accuracy was assessed through the comparison of a series of key variables including shock absorption, energy restitution, vertical deformation and contact time. Both shockpad models produced results with a mean error of less than 10% compared to experimental data.

Graphical Abstract

1. Introduction

Artificial turf has become an increasingly prominent type of playing surface for many sports due to its versatility for all-year-round and multi-sport use [1]. Whilst natural turf remains the star quality for many sports, the advantages of artificial surfaces over natural pitches means their use, especially at the grassroots level, is increasing [2]. The Fédération Internationale de Football Association (FIFA) have described the latest 3G surfaces as “the best alternative to natural grass” due to their resistance to weather and ability to sustain more intensive use [3]. All these factors led the English football association to commit to an investment of £230 million for new 3G pitches by 2020 [4].
Third generation (3G) artificial surfaces contain a number of polymer materials that exhibit various strain rate and temperature dependant behaviours [
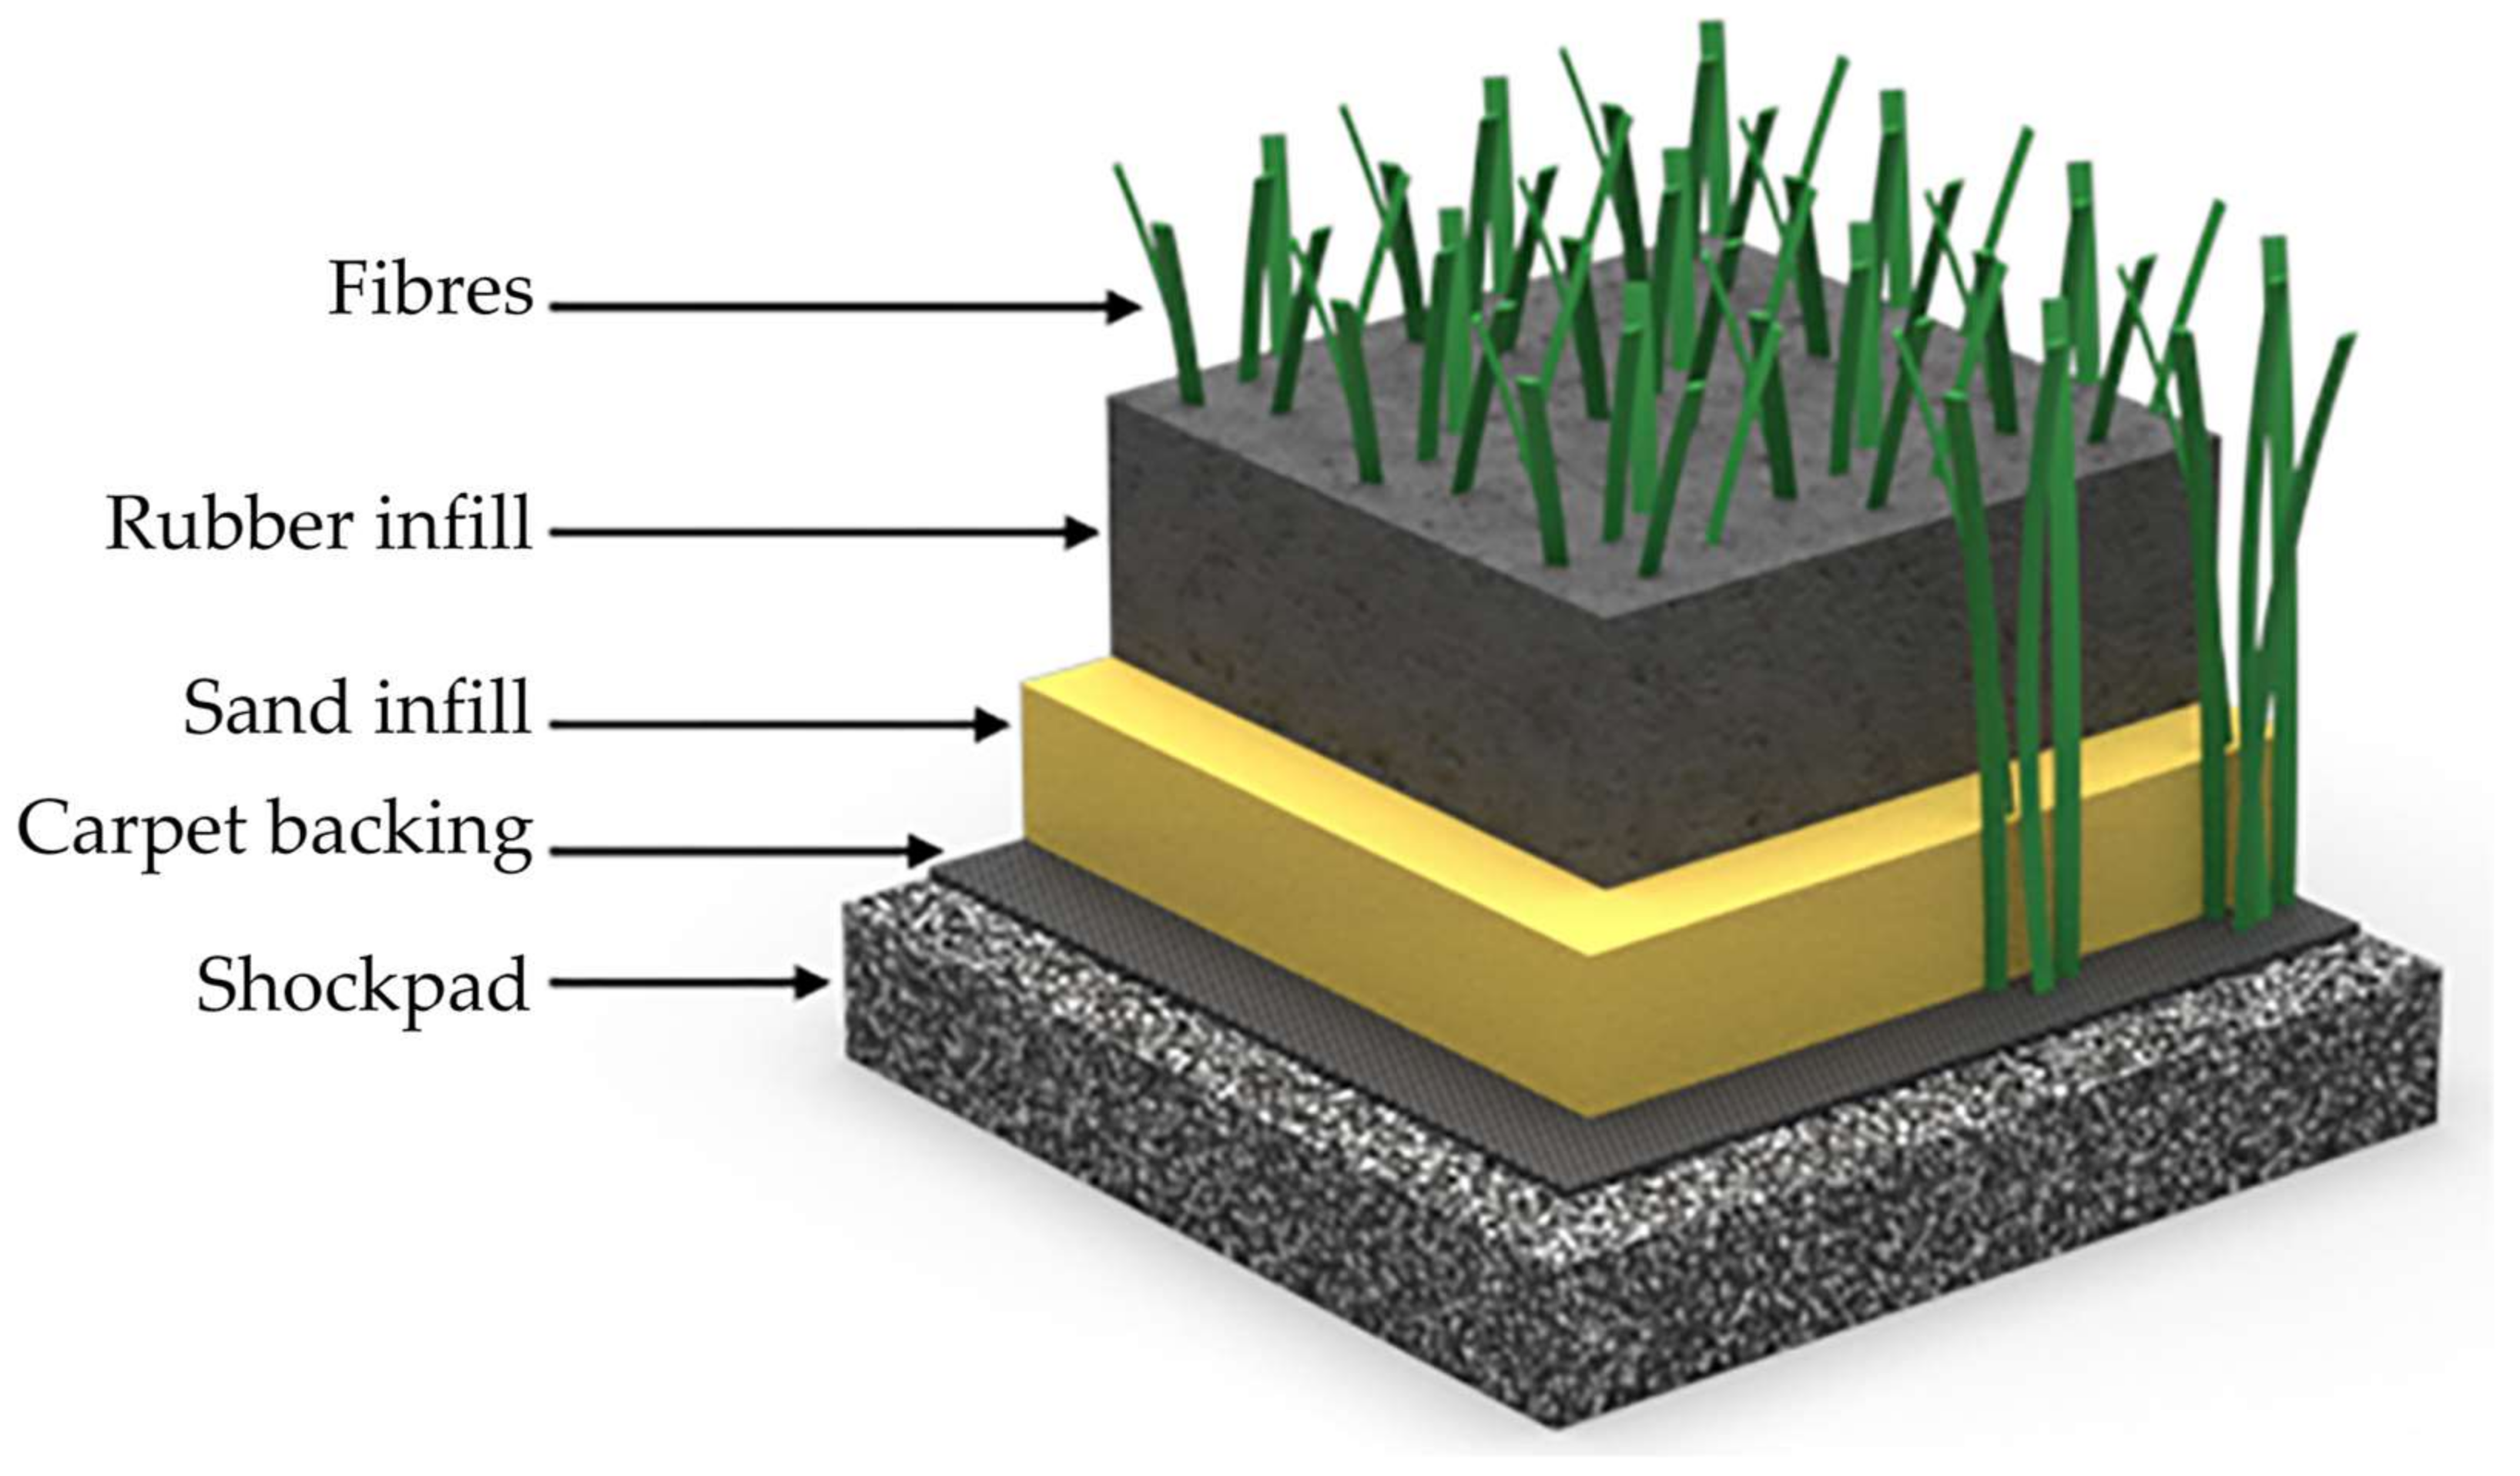
5]. The surface is constructed in a layered format [
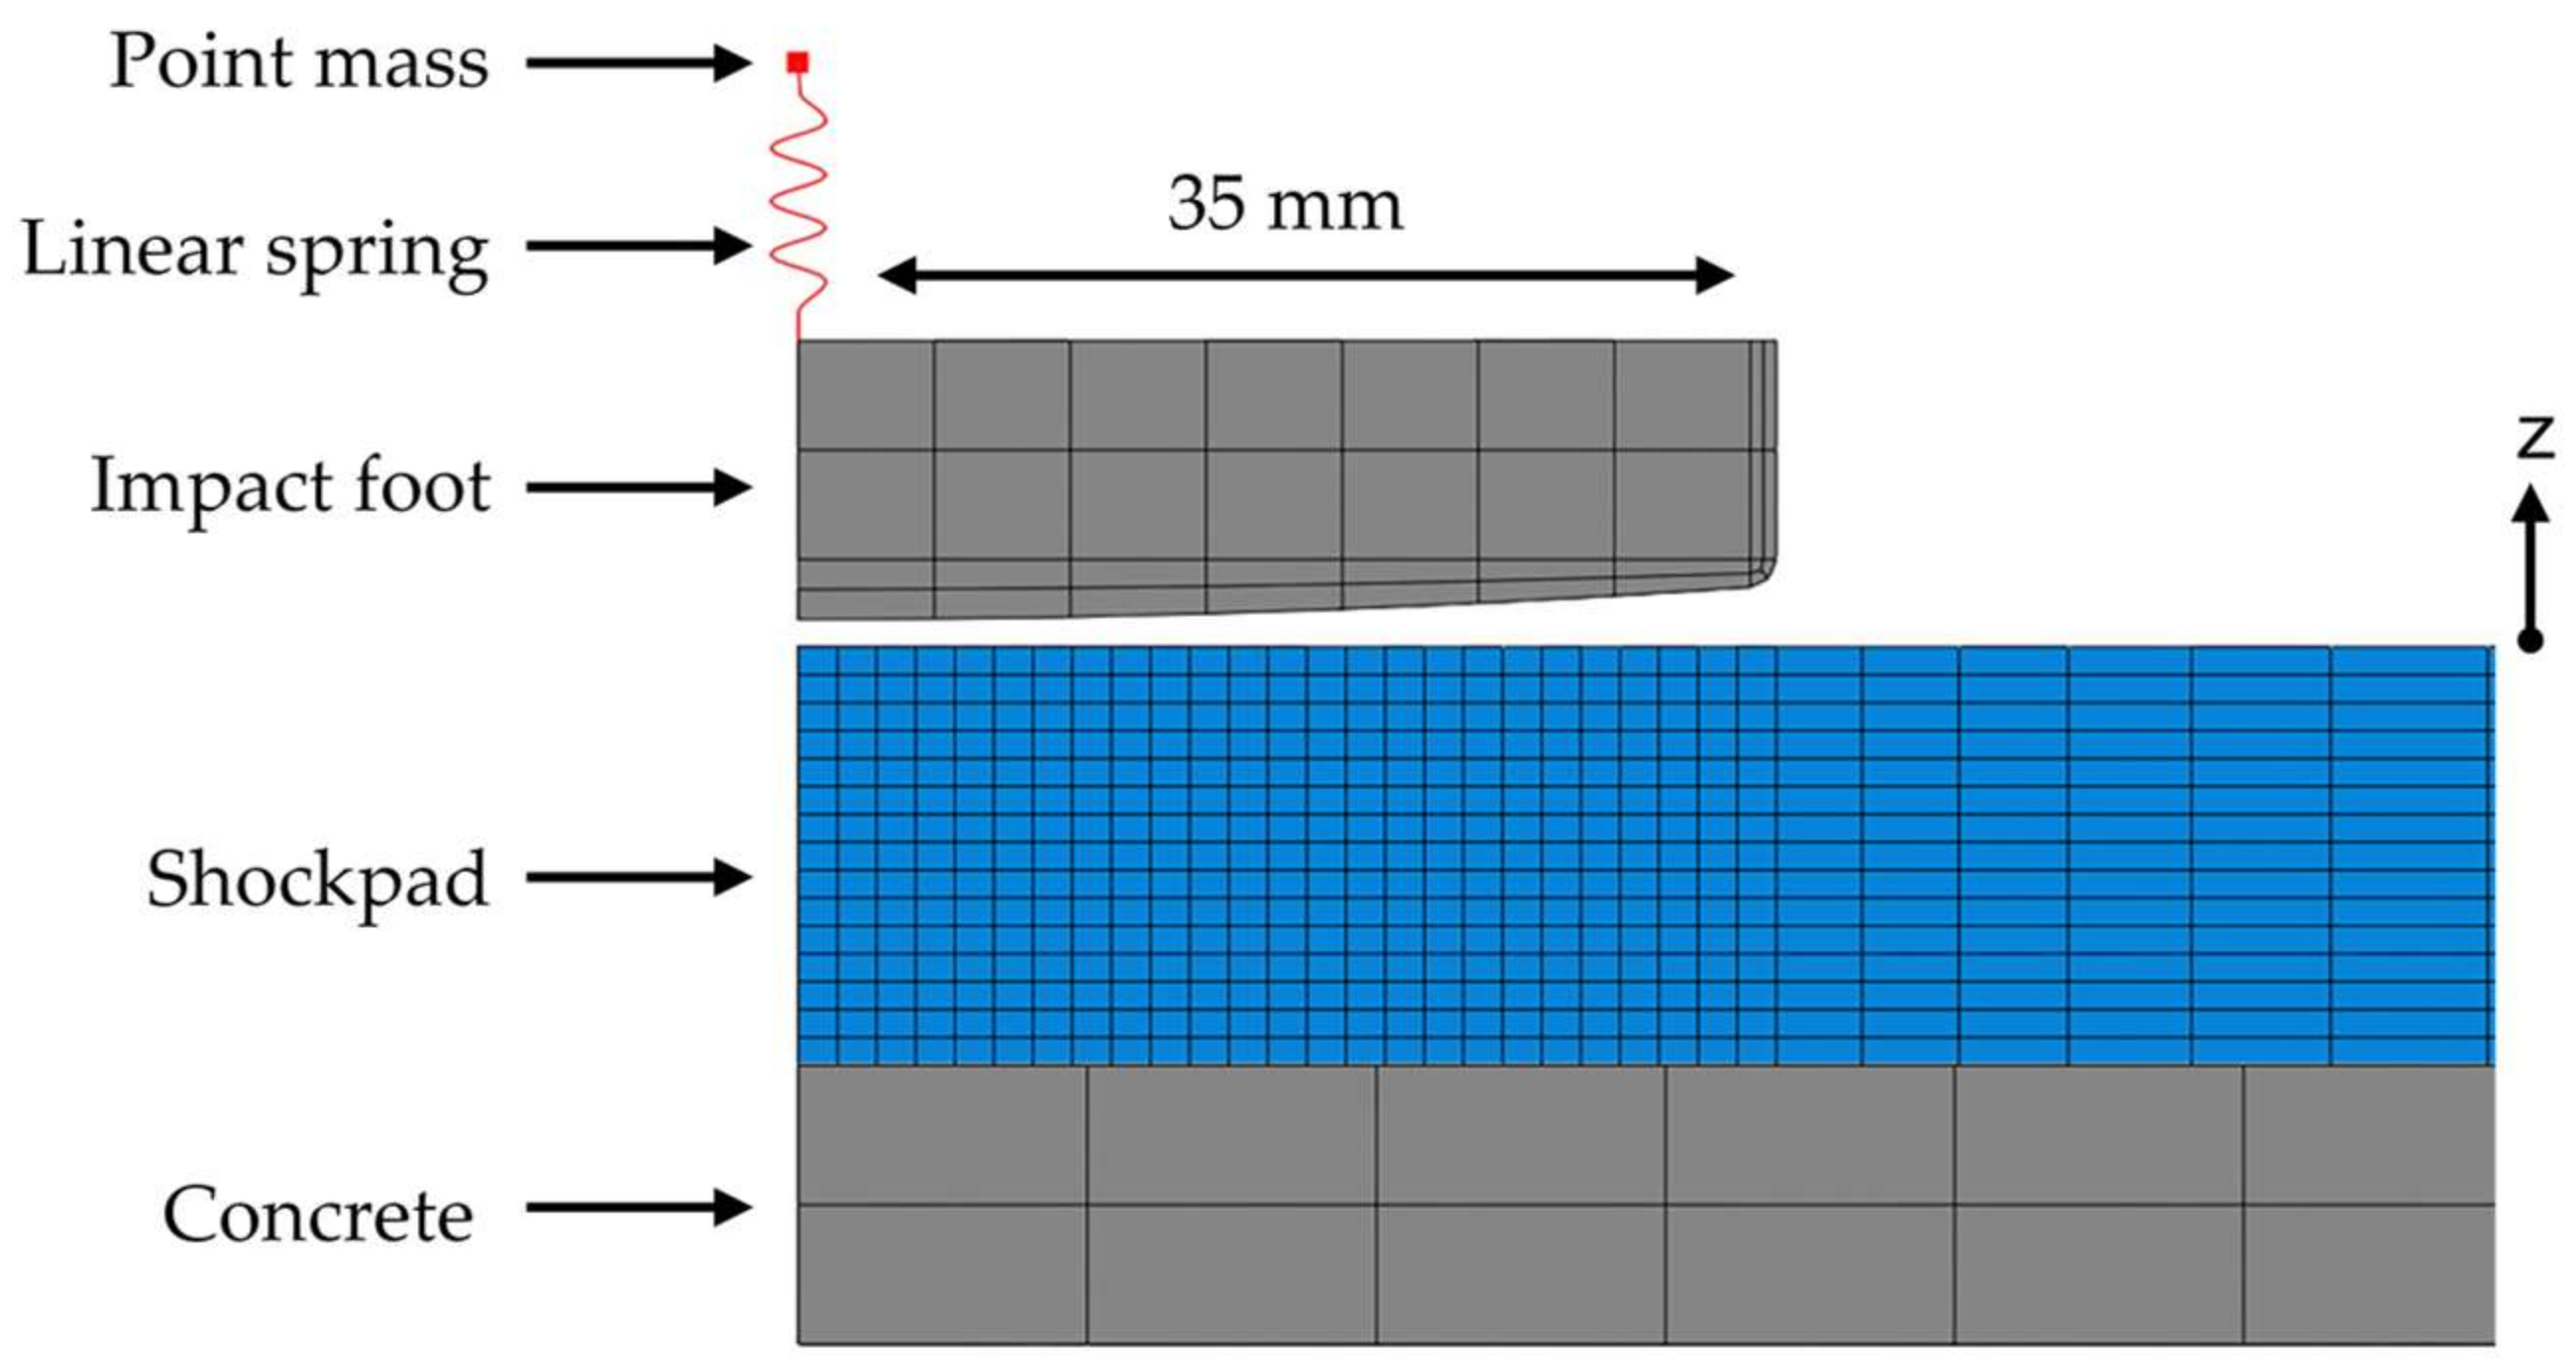
6] consisting of a lower layer of an elastomeric mat called a shockpad, used to absorb the impact forces of boot-surface interactions and thereby reduce the stress upon the athletes (Figure 1). On top of this lies the carpet consisting of a bed of polymer fibres arranged in tufts and stitched into a canvas backing. The carpet is filled with two separate infill layers: a stabilising layer to provide support to the fibres and weigh the carpet down and a performance layer to fill the carpet fibres and provide an interface for ball and player interactions. The stabilising layer is typically created using sand whilst the performance layer can consist of a variety of different polymer or organic materials however styrene butadiene rubber (SBR) granules are the most common choice.
The main design requirement of the shockpad layer is to absorb some of the impact forces applied from player interactions such as running foot strikes. They must also allow for drainage and be durable to withstand cold temperatures and repeated freeze-thaw cycles [7]. Elastomers are a popular choice as they have favourable shock absorption properties and can deform to large strains without permanent deformation. These properties result from the chemical structure of elastomers being made up of long randomly oriented molecular chains that align when stretched and restore when the load is released. The term elastomer, a combination of elastic and polymer is often used interchangeably with rubber [8]. Rubber is a popular choice of elastomer for engineering applications due to its flexibility, extensibility, resiliency and durability [9]. Shockpads are typically constructed to be cellular, a move that enhances energy absorption properties and allows drainage through the system [10]. The presence of air voids also allows larger strains to be reached under compression [11]. Elastomer foams can be found in many sports products, a common example being in sports footwear acting as shock absorbers [
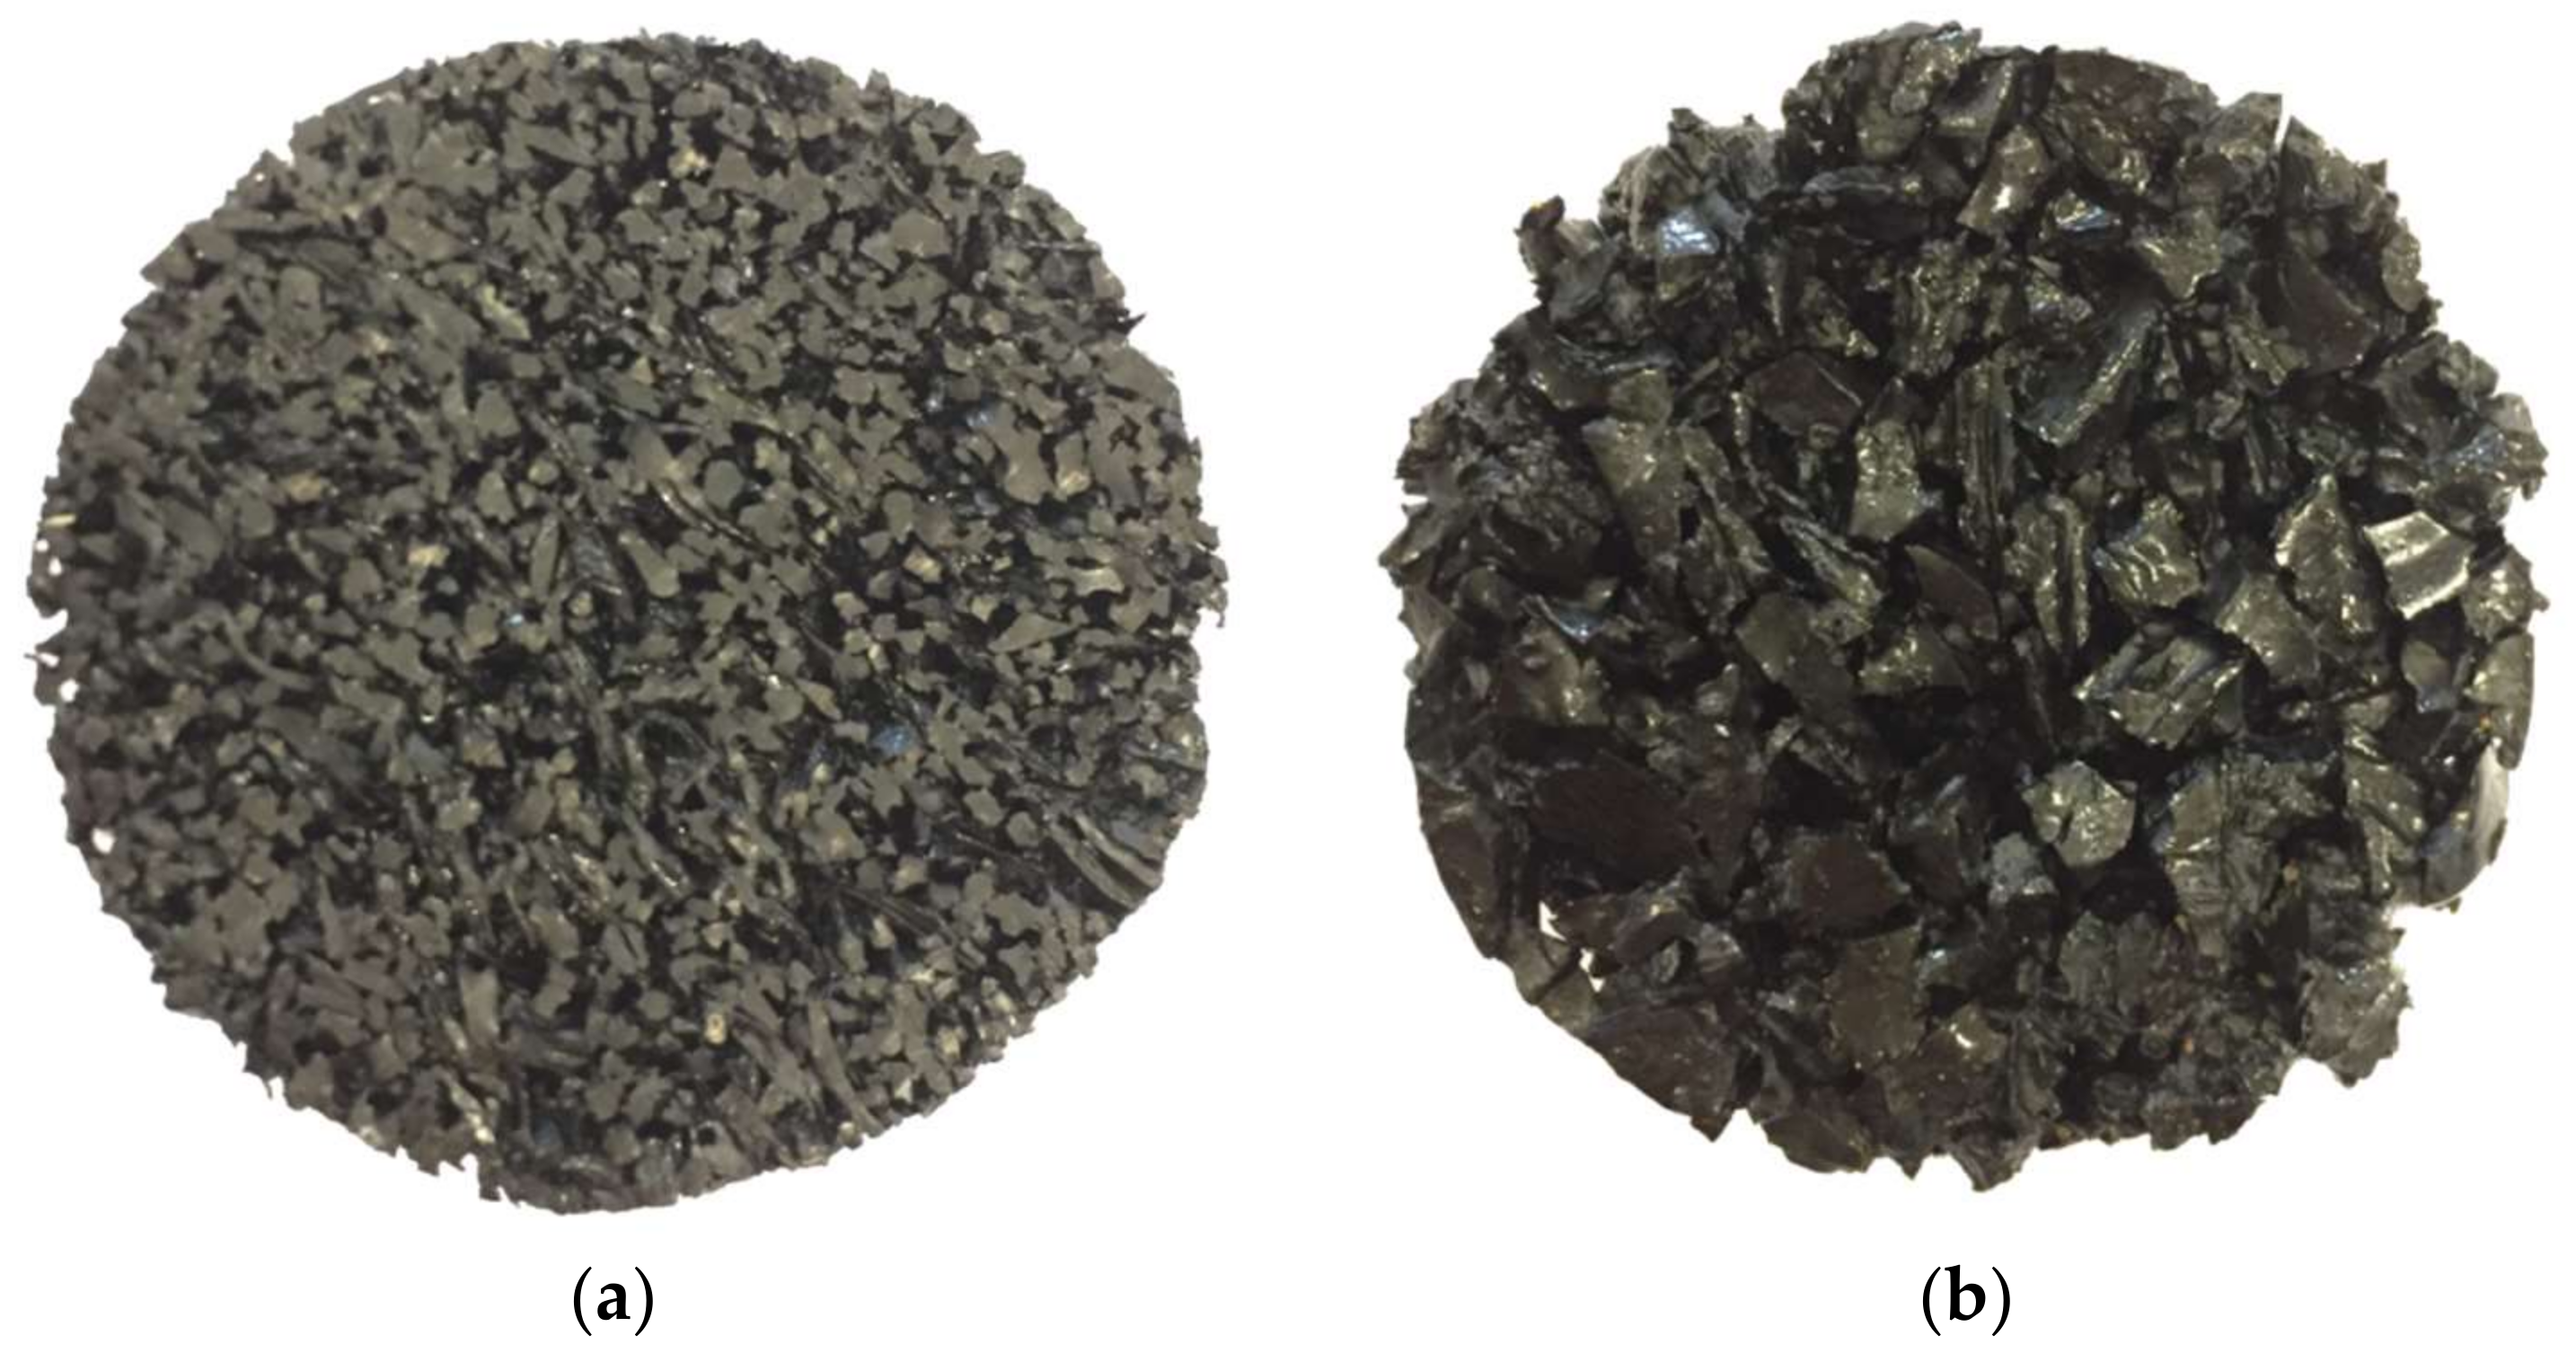
12]. A key difference between these foams however is their construction method. Whilst most elastomeric foams are formed with the use of a blowing agent, shockpads are typically formed using recycled rubber compounds bound together with adhesive with the voids in the structure formed by the spaces between solid rubber particles [6].
The behaviour of shockpads under compression has been analysed previously. Both Anderson [13] and Allgeuer et al. [14] identified three key stages: air void compression, transition and rubber compression. The air void compression phase is associated with an initial low stiffness, high deflection response. A transition phase then provides an increase in the stiffness as the void ratio is reduced and the shockpad turns into a two phase system of rubber and binder. A final phase is realised when rubber-on-rubber contact is made resulting in a substantial increase in stiffness due to the compression of the rubber.
The modelling of sports surfaces has been attempted before with examples of running tracks, vinyl flooring and rubber treadmill belts all investigated [15,16,17,18]. Anderson [13] created a mechanical model to describe the three regions in shockpad compression using a non-linear damped model consisting of a linear spring and damper in parallel, similar in nature to a hyperelastic Bergstrom-Boyce model [19]. Mehravar et al. [
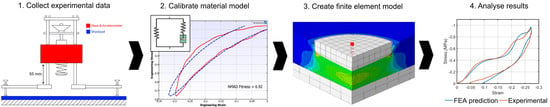
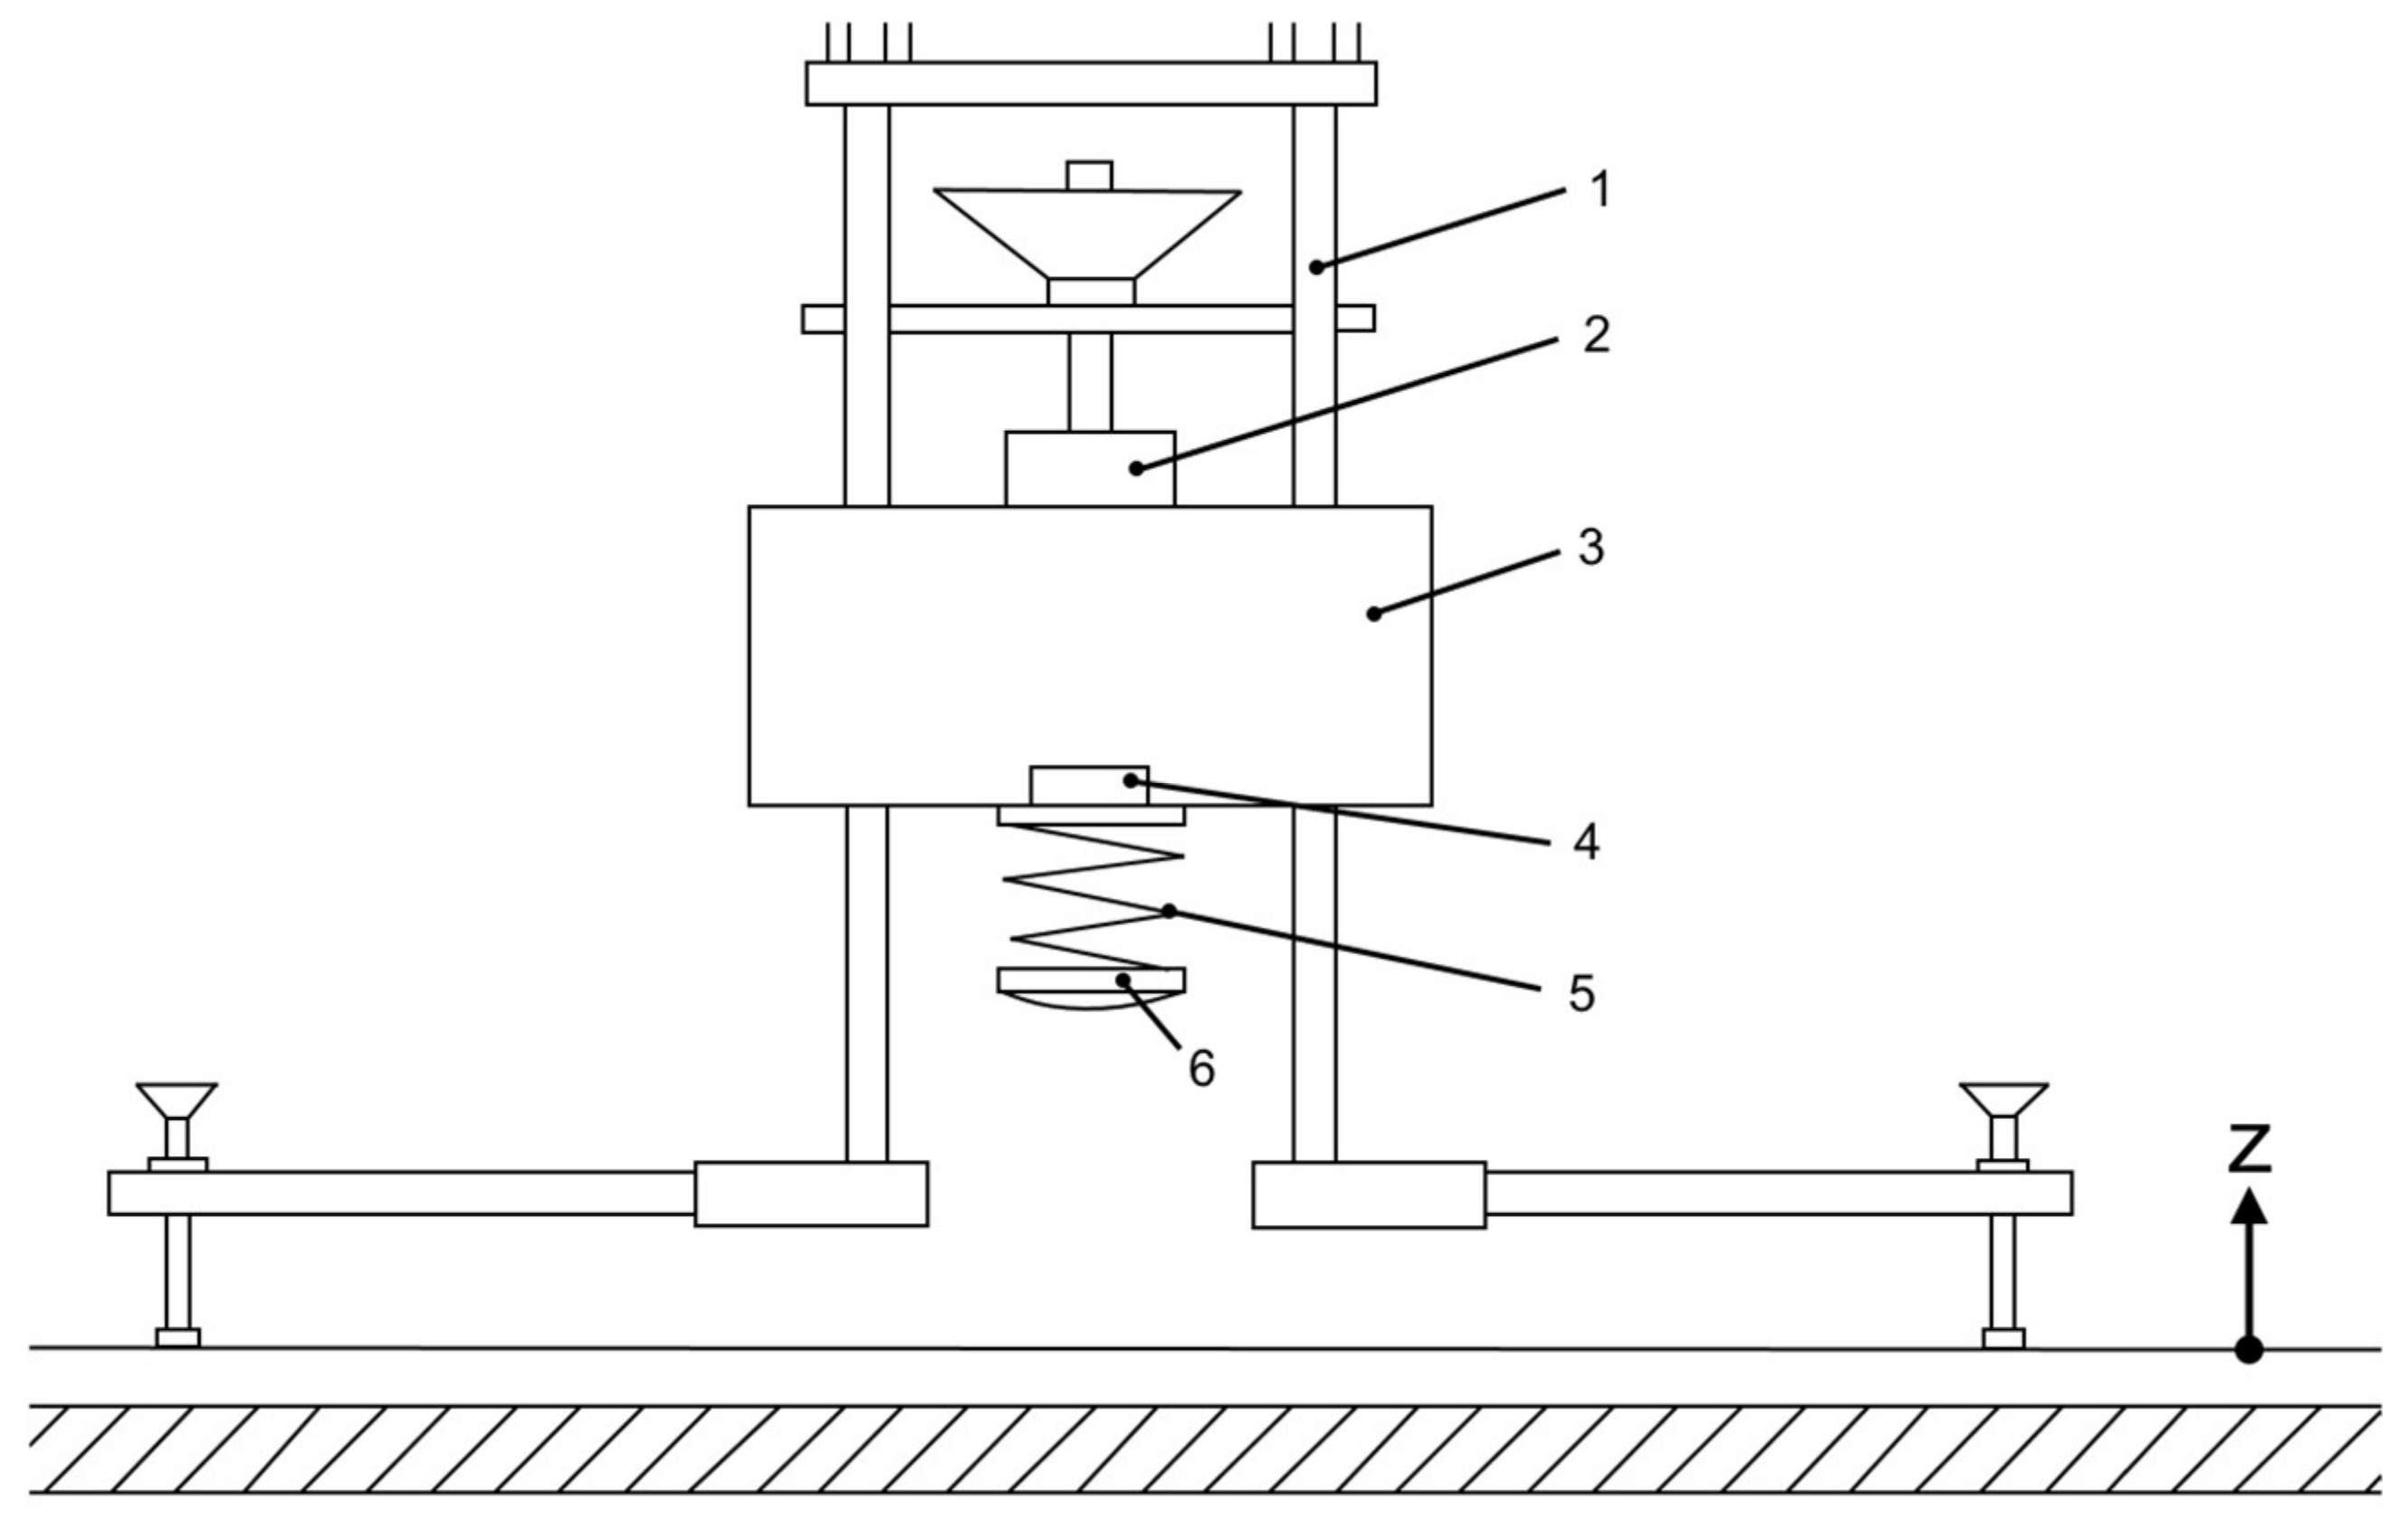
20] used a finite element (FE) model to simulate the loading of an elastomeric shockpad using an Arruda-Boyce hyperelastic material model. Compression data was used to fit the coefficients of the model and a power equation created to describe the frequency dependency of the strain energy density function. The simulation was able to accurately fit the loading response under compression for frequencies in the range 0.9–10 Hz. However, the model was restricted to describing the loading behaviour with the viscoelastic unloading response not considered. The purpose of this study was to mechanically characterise the behaviour of two elastomeric shockpads and to find suitable material models to describe both loading and unloading behaviours. The mechanical behaviour of the rubber shockpads were characterised through calculation of the stress-strain properties obtained from testing using the FIFA standard Advanced Artificial Athlete (AAA, FIFA, 2015).

2. Shockpad Characterisation

The process of developing a material model relies on understanding the behaviour of the material that is to be modelled. Calibration of a material model requires optimising model parameters against experimental data collected under similar loading conditions. As shockpads primarily deal with compressive loads, data was recorded using a AAA impact tester [21]. The AAA is a device used to measure the shock absorption, energy restitution and vertical deformation properties of a surface and thereby assess the standard of the surface [22]. Stress-strain data from a standard drop height of 55 mm was used to develop the material model and experimental data from additional drop heights (15 and 35 mm) used to validate the material model in a series of FE simulations.

2.1. Shockpad Properties

Two shockpads were chosen for analysis, one prefabricated and another that was laid in situ on Loughborough University campus. Both shockpads were FIFA quality approved and were comprised of rubber aggregate bound by polyurethane adhesive (Table 1). The prefabricated shockpad was Regupol® 6010 SP (BSW Berleburger GmbH, Berleburger [23]) designed specifically for 3G turf surfaces (Figure 2a). The in-situ shockpad was created during the construction of a 3G turf sports pitch at Loughborough University in 2014 [6] (Figure 2b). The in-situ shockpad samples used in lab testing were laid onto a 10 mm thick plywood board during the construction of the surface and were subsequently transferred to the rigid lab floor and cut to size. As the shockpads were both cellular materials, relative density was calculated. Relative density is often used as a way of expressing cellular materials with respect to the 100% dense solid [24]. It is calculated by dividing the density of the cellular material by the density of the solid. As the exact rubber density for both shockpads was not reported, a value of 1100 kg/m3 was assumed [25].

2.2. AAA Methodology

The AAA test device is designed to measure and record the shock absorption and deformation behaviour of 3G turf surfaces under human impact conditions to assess whether they are suitable for sporting use [21]. The device consists of a convex test foot mounted to a 20 kg mass via a spiral steel spring (Figure 3). A remote controlled electromagnet releases the mass from a height of 55 mm and the convex test foot with diameter 70 mm acts as an impact face with the surface. An accelerometer is attached to the base of the falling mass and records the acceleration throughout the drop, impact and rebound. Shock absorption, energy restitution and vertical deformation are all calculated from the accelerometer output for each drop.
Shockpad samples of at least 30 × 30 cm were laid beneath the impact foot and were subjected to drops from multiple heights from 55 mm down to 5 mm in 10 mm increment steps. Three drops were used for each drop height as per the FIFA test standard [21]. The different drop heights allowed the response of the shockpads under different impact energies to be examined. Raw accelerometer data was extracted from each of the test drops and processed using Matlab (Version 2017a, Mathworks, Natick, MA, USA). Velocity and displacement were calculated through integration using the trapezium rule for the duration of each drop. Shock absorption, energy restitution and vertical deformation were calculated from the first drop at each drop height using methods set out in the FIFA handbook of test methods [21] with the exception of the shock absorption which was altered to ensure the reference value for the solid floor was adjusted for each drop height. Contact time was taken as the time between the minimum vertical velocity (z-axis; Figure 3) that occurred as the impactor first contacted the surface, and the maximum vertical velocity which occurred as the impactor left the surface. The force and displacement data, obtained from the acceleration as detailed above, were converted into engineering stress and strain. Curvature of the test foot was neglected within the engineering stress calculations; a fixed cross-sectional area (of 38.5 cm2) was used throughout contact. Unloaded shockpad thickness, the average over 15 measurements (Table 1), was used to calculate the engineering strain.

2.3. AAA Experimental Results

For both shockpads the stress-strain results were highly consistent between the three drops performed from each height (Figure 4). The loading phase of the Berleburger shockpad demonstrated an undulating loading response consisting of a series of higher stiffness regions followed by a plateau in the stress. In contrast, the Holywell shockpad showed a more typical hyperelastic loading response. Both shockpads also demonstrated hysteresis during the unloading phase. The Berleburger shockpad was the stiffer of the two shockpads and had a higher maximum stress. The undulations during the loading phase in the Berleburger shockpad were not as evident for the lower drop heights, while the Holywell shockpad followed a similar loading response for all drop heights (Figure 5). As the drop height decreased the shockpads showed similar responses albeit with a lower maximum stress. At the lowest two drop heights of 5 and 15 mm the stress-strain response was not large enough to enter into a hyperelastic region and remained relatively linear. Shock absorption increased as the drop height was lowered in both shockpads. Strain levels were similar for both the shockpads due to the difference in thickness. Both shockpads remained in their elastic region and since they produced similar results for all three drops from a given height, only the first drop was used for the purpose of material modelling and simulation.

3. Finite Element Simulation of AAA

A FE model of the experimental AAA test on the shockpads was created in Abaqus CAE (Figure 6). The purpose of the model was to try and replicate the shockpad response from different height drops after calibration of a material model to a single drop height. The shockpad layer was modelled as a deformable part and was placed on top of a fixed rigid concrete block. The shockpad was meshed using 3D 8-node reduced integration elements with hourglass control (C3D8R) with an increased mesh density around the impact area. A mesh sensitivity test was completed to ensure results were not sensitive to mesh design. A tangential friction was specified between the shockpad and concrete using a penalty formulation with a friction coefficient of 0.8. This value was measured as the coefficient of sliding friction in an experimental slip test performed prior to AAA testing. The AAA was modelled as a rigid steel test foot with point mass placed directly above the centre point. The test foot and point mass were joined by a deformable spring element with a 2000 N/mm stiffness as per the experimental test [21]. All parts of the AAA were restrained to only allow translation in the z-axis. Starting conditions for the test placed the impact foot 1 mm above the shockpad top surface with an initial velocity matching those seen in the experimental tests. Acceleration, velocity and displacement of the point mass were outputted from the simulation and used to calculate the stress-strain response as well as the FIFA test outputs. Similarly, to the stress-strain calculations for the experimental data, engineering stress was based on a fixed cross-sectional area throughout contact corresponding to full test foot contact area (38.5 cm2). Due to the symmetrical nature of the problem only a quarter portion of the model was constructed to save on computing time.

Material Model Development

Development of material models to represent the behaviour of the shockpads followed a systematic approach (Figure 7). From the experimental results, it was clear that hyperelastic material models were needed to match the non-linear deformation behaviour of the shockpads (Figure 5). Hysteresis was also seen for both shockpads meaning models capable of capturing viscoelasticity must be used. Taking these factors into account, two models were selected for initial calibration. The Bergstrom-Boyce model has been successful in representing solid rubber behaviour [19], however, due to the cellular nature of the shockpads a microfoam material model was also selected. Separate models were calibrated for each of the shockpads in order to capture their unique behaviour. MCalibration software (Version 4.6, Veryst Engineering, Needham, MA, USA) was used to calibrate models from the PolyUMod material database against stress-strain data from a single AAA drop from 55 mm for each of the shockpads (Table 2). The MCalibration software provides a more extensive library of material models compared to the inbuilt Abaqus materials library and gives the user more control over the calibration. Each of the material coefficients were calibrated to the experimental data using equations including Lavenberg-Marquardt, NEWUOA and Nelder-Mead. Whilst this process fits the model to the data, the software does not understand relationships between variables often meaning further manual alterations must be done. Calibrated material models were imported into the FE simulation where the AAA drop from 55 mm was replicated and the results of the simulation subsequently compared to the experimental data. A number of variables were used as an indicator of the model accuracy, including the shock absorption, energy restitution, vertical deformation and contact time. The root mean square error (RMSE) was also calculated for the strain as the AAA impact was a stress controlled test. The model was deemed accurate if the mean error was less than 10% and no individual error was greater than 15%. If these criteria were not met the model coefficients were refined manually in MCalibration. Error was defined as the percentage difference between the experimental values and the FE simulated values with exception of the strain RMSE that was expressed as a percentage of the maximum strain. Refinement of the models was done using an intelligent trial and error approach, changing the appropriate coefficients to alter the material response based upon the results of the previous simulation. Both models calibrated well to the experimental data, however, the Bergstrom-Boyce model was unable to accurately represent the deformation response to an error lower than 15%. The microfoam material model performed much better, producing good initial results as the relative density was taken into consideration during the model calculations. This model was further refined to increase the accuracy for both shockpads before validation. Validation of the models was undertaken through the simulation of the lower drop heights of the AAA, with the results subsequently compared to the experimental data.

4. Results

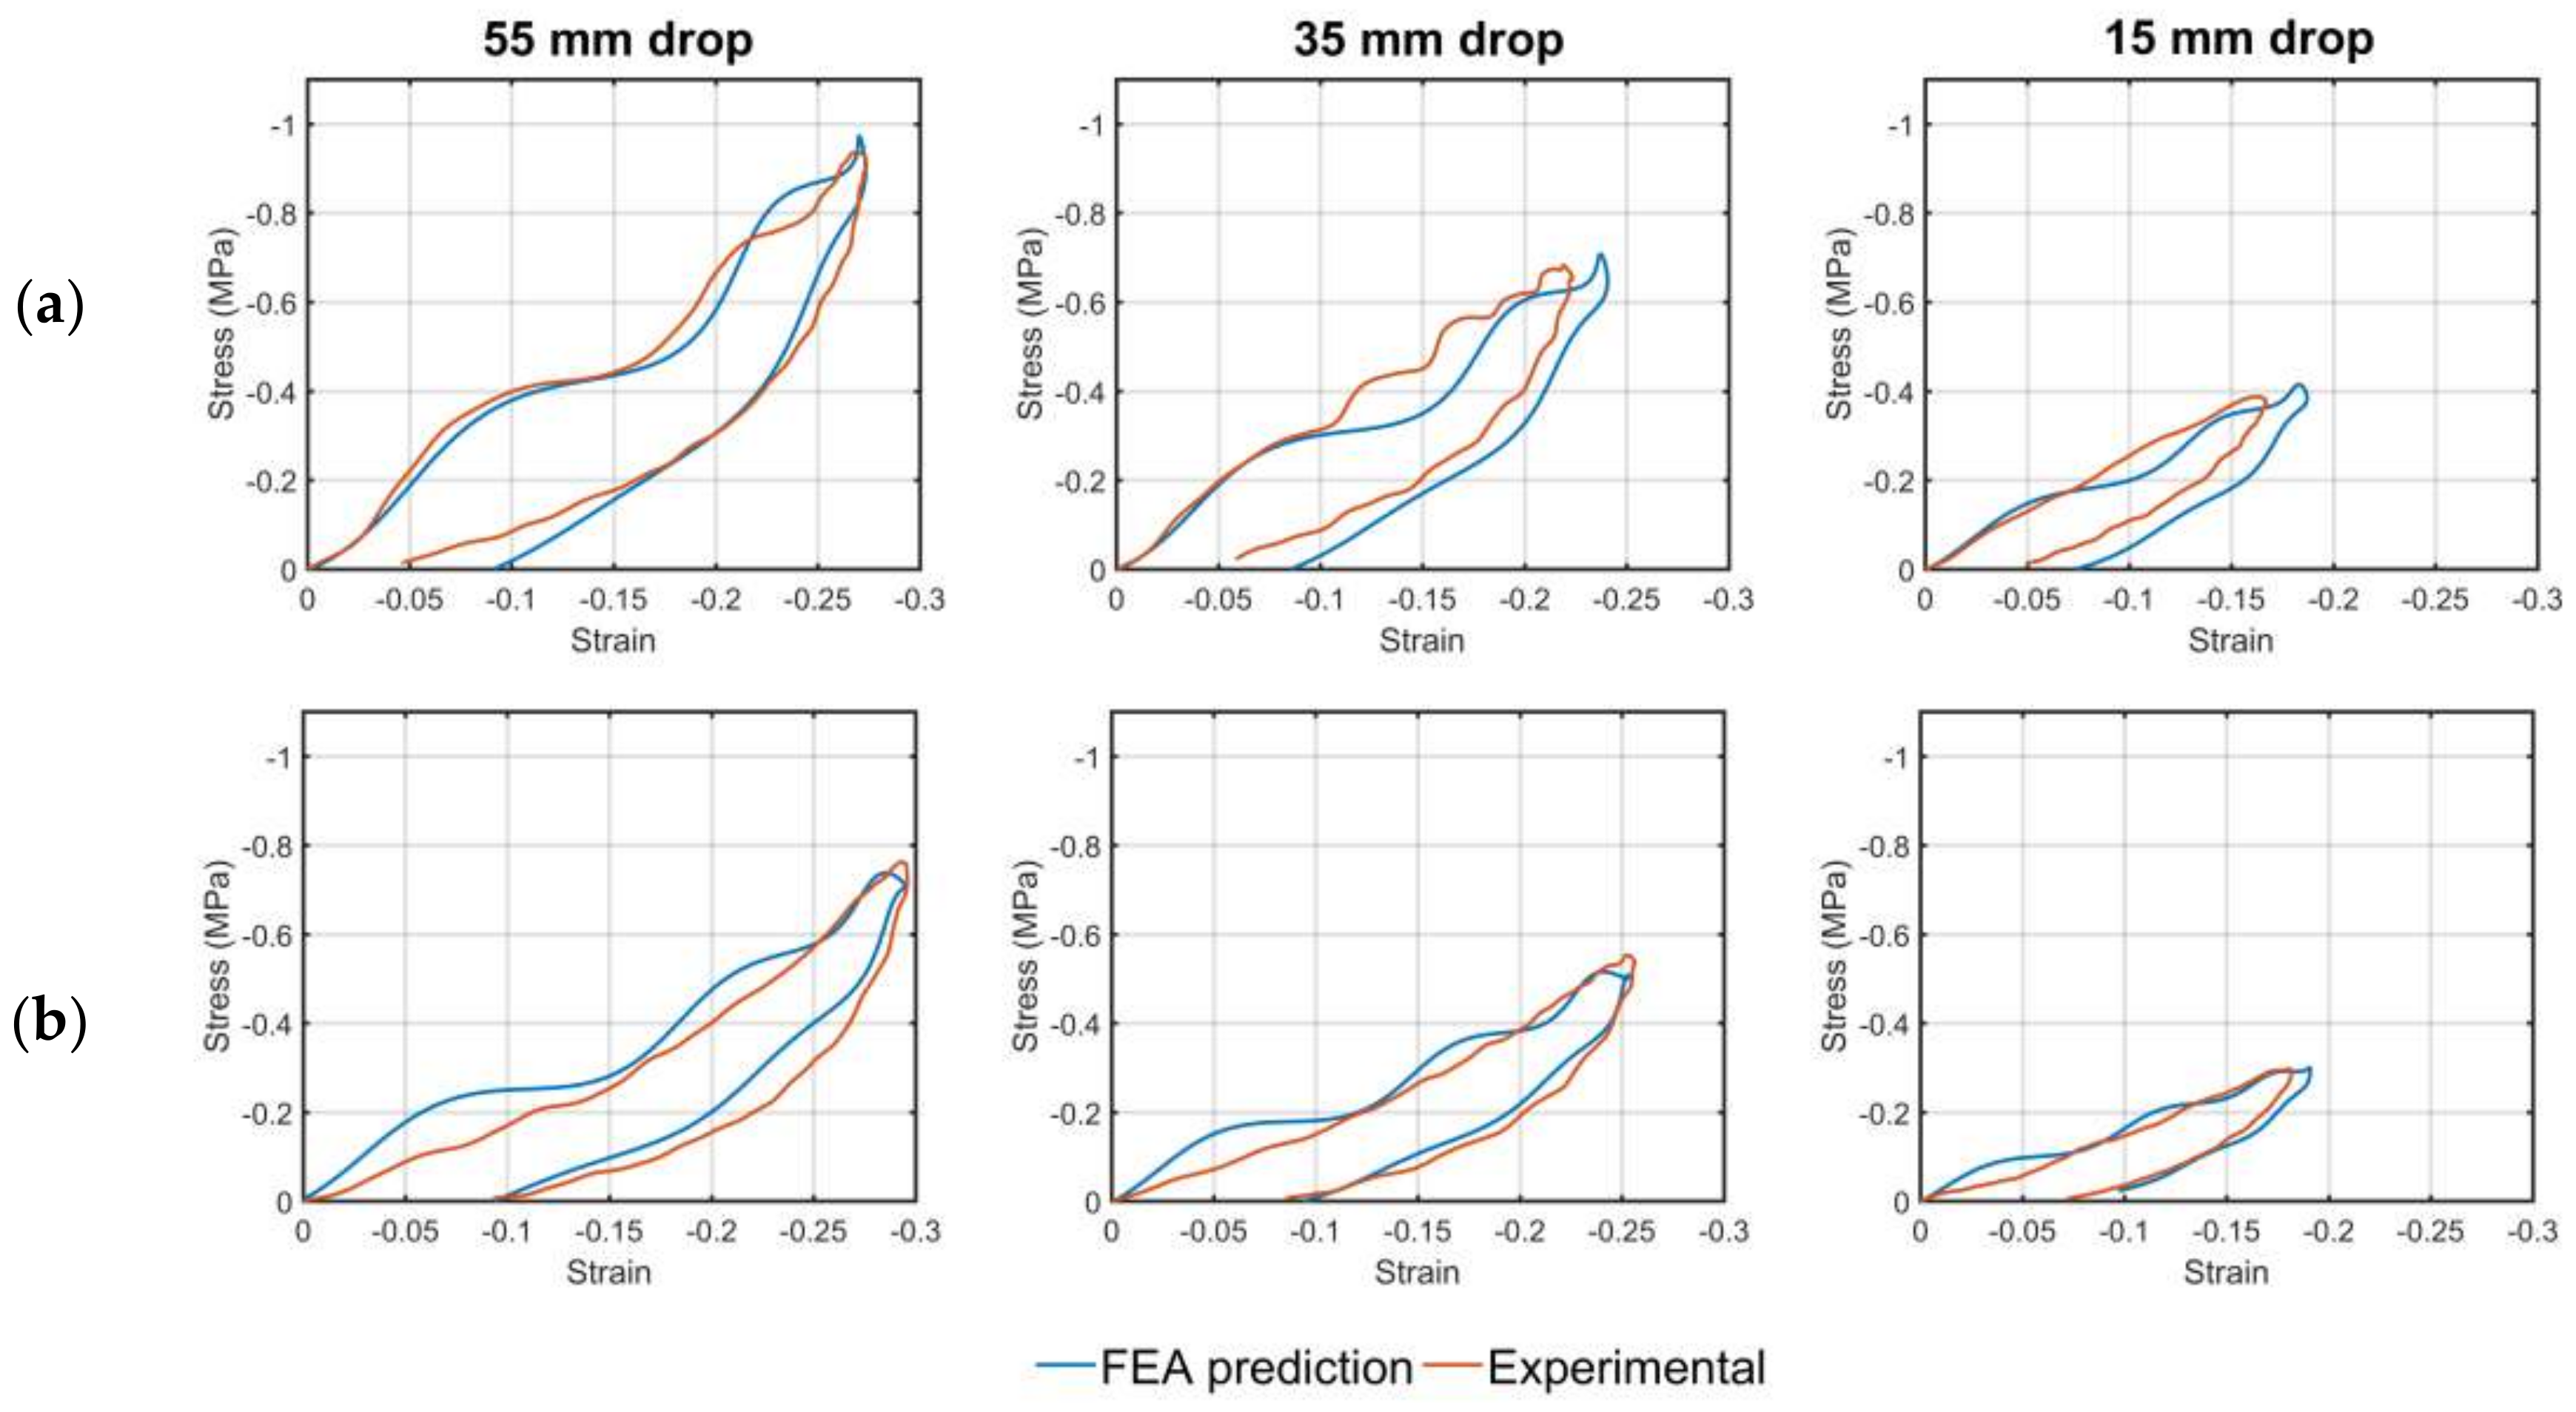
The microfoam material model showed good overall agreement with the experimental data for both the Berleburger and Holywell shockpads and all drop heights (Figure 8). The FE simulations met the accuracy criteria for both shockpads and all drop heights, except for the Berleburger 15 mm drop height where the strain RMSE was slightly above the threshold at 18% (Table 3).
The FE simulations under-estimated shock absorption for the Berleburger shockpad by a consistent 3–4% across drop heights, corresponding to an over-estimation in peak force. Agreement was better for the Holywell shockpad with the difference within 2% throughout. The FE simulations over-estimated vertical deformation for the Berleburger shockpad, by up to 0.3 mm, while agreement was again better for the Holywell shockpad with the difference being no more than 0.2 mm throughout. In all cases if shock absorption was under-estimated then vertical deformation was over-estimated and vice versa, suggesting that for both shockpads the overall loading stiffness response was better estimated than the two loading extreme measures of shock absorption and vertical deformation. The FE simulations over-estimated energy restitution by up to 8% suggesting that more energy was returned to the impactor than was observed experimentally. These differences were larger than those for shock absorption and vertical deformation which was not unexpected given that both the loading and unloading phases contributed to this variable [20]. Interestingly, for both shockpads, the difference in energy restitution decreased with decreasing drop height; from 6 to 8% for the 55 mm drop height to only 0–1% for the 15 mm drop height. This trend suggests that the loading–unloading response is accurately captured by the simulations for low strains, but less so for higher strains that reach the hyperelastic region of the stress-strain curve (Figure 5). For low strains, the compression and recovery are dominated by air voids, while for higher strains the compression and recovery includes not only air voids but also the rubber shreds/granules. This poorer performance may, therefore, represent a limitation of using a microfoam model to estimate compression and recovery of a granular/shredded rubber held together by a polyurethane binder (Table 1).
Strain RMSEs were also larger than those for shock absorption and vertical deformation, on average similar between shockpads, but showed no consistent trend with drop height. For the Berleburger shockpad the strain RMSE increased with decreasing drop height (from 6 to 18%) and appeared linked to an increasing offset in the unloading curves between the experimental data and simulation output. In contrast, for the Holywell shockpad the strain RMSE decreased with decreasing drop height (from 14% to 6%) and appeared to be linked to the simulation output exhibiting undulations during the loading phase that, as noted above, were not present in the experimental data for this shockpad, with the undulations being of greater magnitude for the higher drop heights (Figure 8).
Although some of these differences will be due to inaccuracies in the material models and FE simulations, there will also be a contribution related to uncertainties in the experimental data itself. These include: inconsistency in the shockpad thicknesses (Table 1) due to construction method and granular nature; errors introduced through numerical integration of the accelerometer data to generate the velocity and displacement data [20]; and in the use of this calculated velocity data to identify the instant of impact and impact conditions.

5. Discussion

Microfoam models provided a good fit to the experimental shockpad data, particularly for the Berleburger shockpad. Although the Holywell shockpad exhibited more traditional hyper-elastic and viscoelastic behaviour, the microfoam model performed better overall than a more traditional hyper-elastic and viscoelastic Bergstrom-Boyce model. Further work is needed to understand the reasons for the differences in loading response for the two shockpads. Using the AAA test device to experimentally capture the stress-strain behaviour of the two shockpads under high strain rates was successful in helping to define these material models. Although the predictive capabilities of the two models have not been addressed, the ability of the models to fit not only to the impact drop height on which they were based, but also to lower energy impact drop heights, has been demonstrated. In reality, shockpads are exposed to a wide range of impact energies and a model that can estimate the response over this full range through a single set of measurements is relevant in optimising the design of 3G turf surface systems.
The AAA test can be very limited in terms of output if only considering the shock absorption and vertical deformation values as standalone measures of surface characteristics. Extracting the raw data from each of the drops allowed for a deeper analysis to be completed. Calculation of the corresponding stress and strain not only provided more information about the whole material response but also a way to use the data for material model calibration. This proved key in creating material models for both shockpads as using data recorded at slower strain rates, such as in the study by Mehvarar et al. [20], did not yield a material model that could successfully be used within AAA simulations.
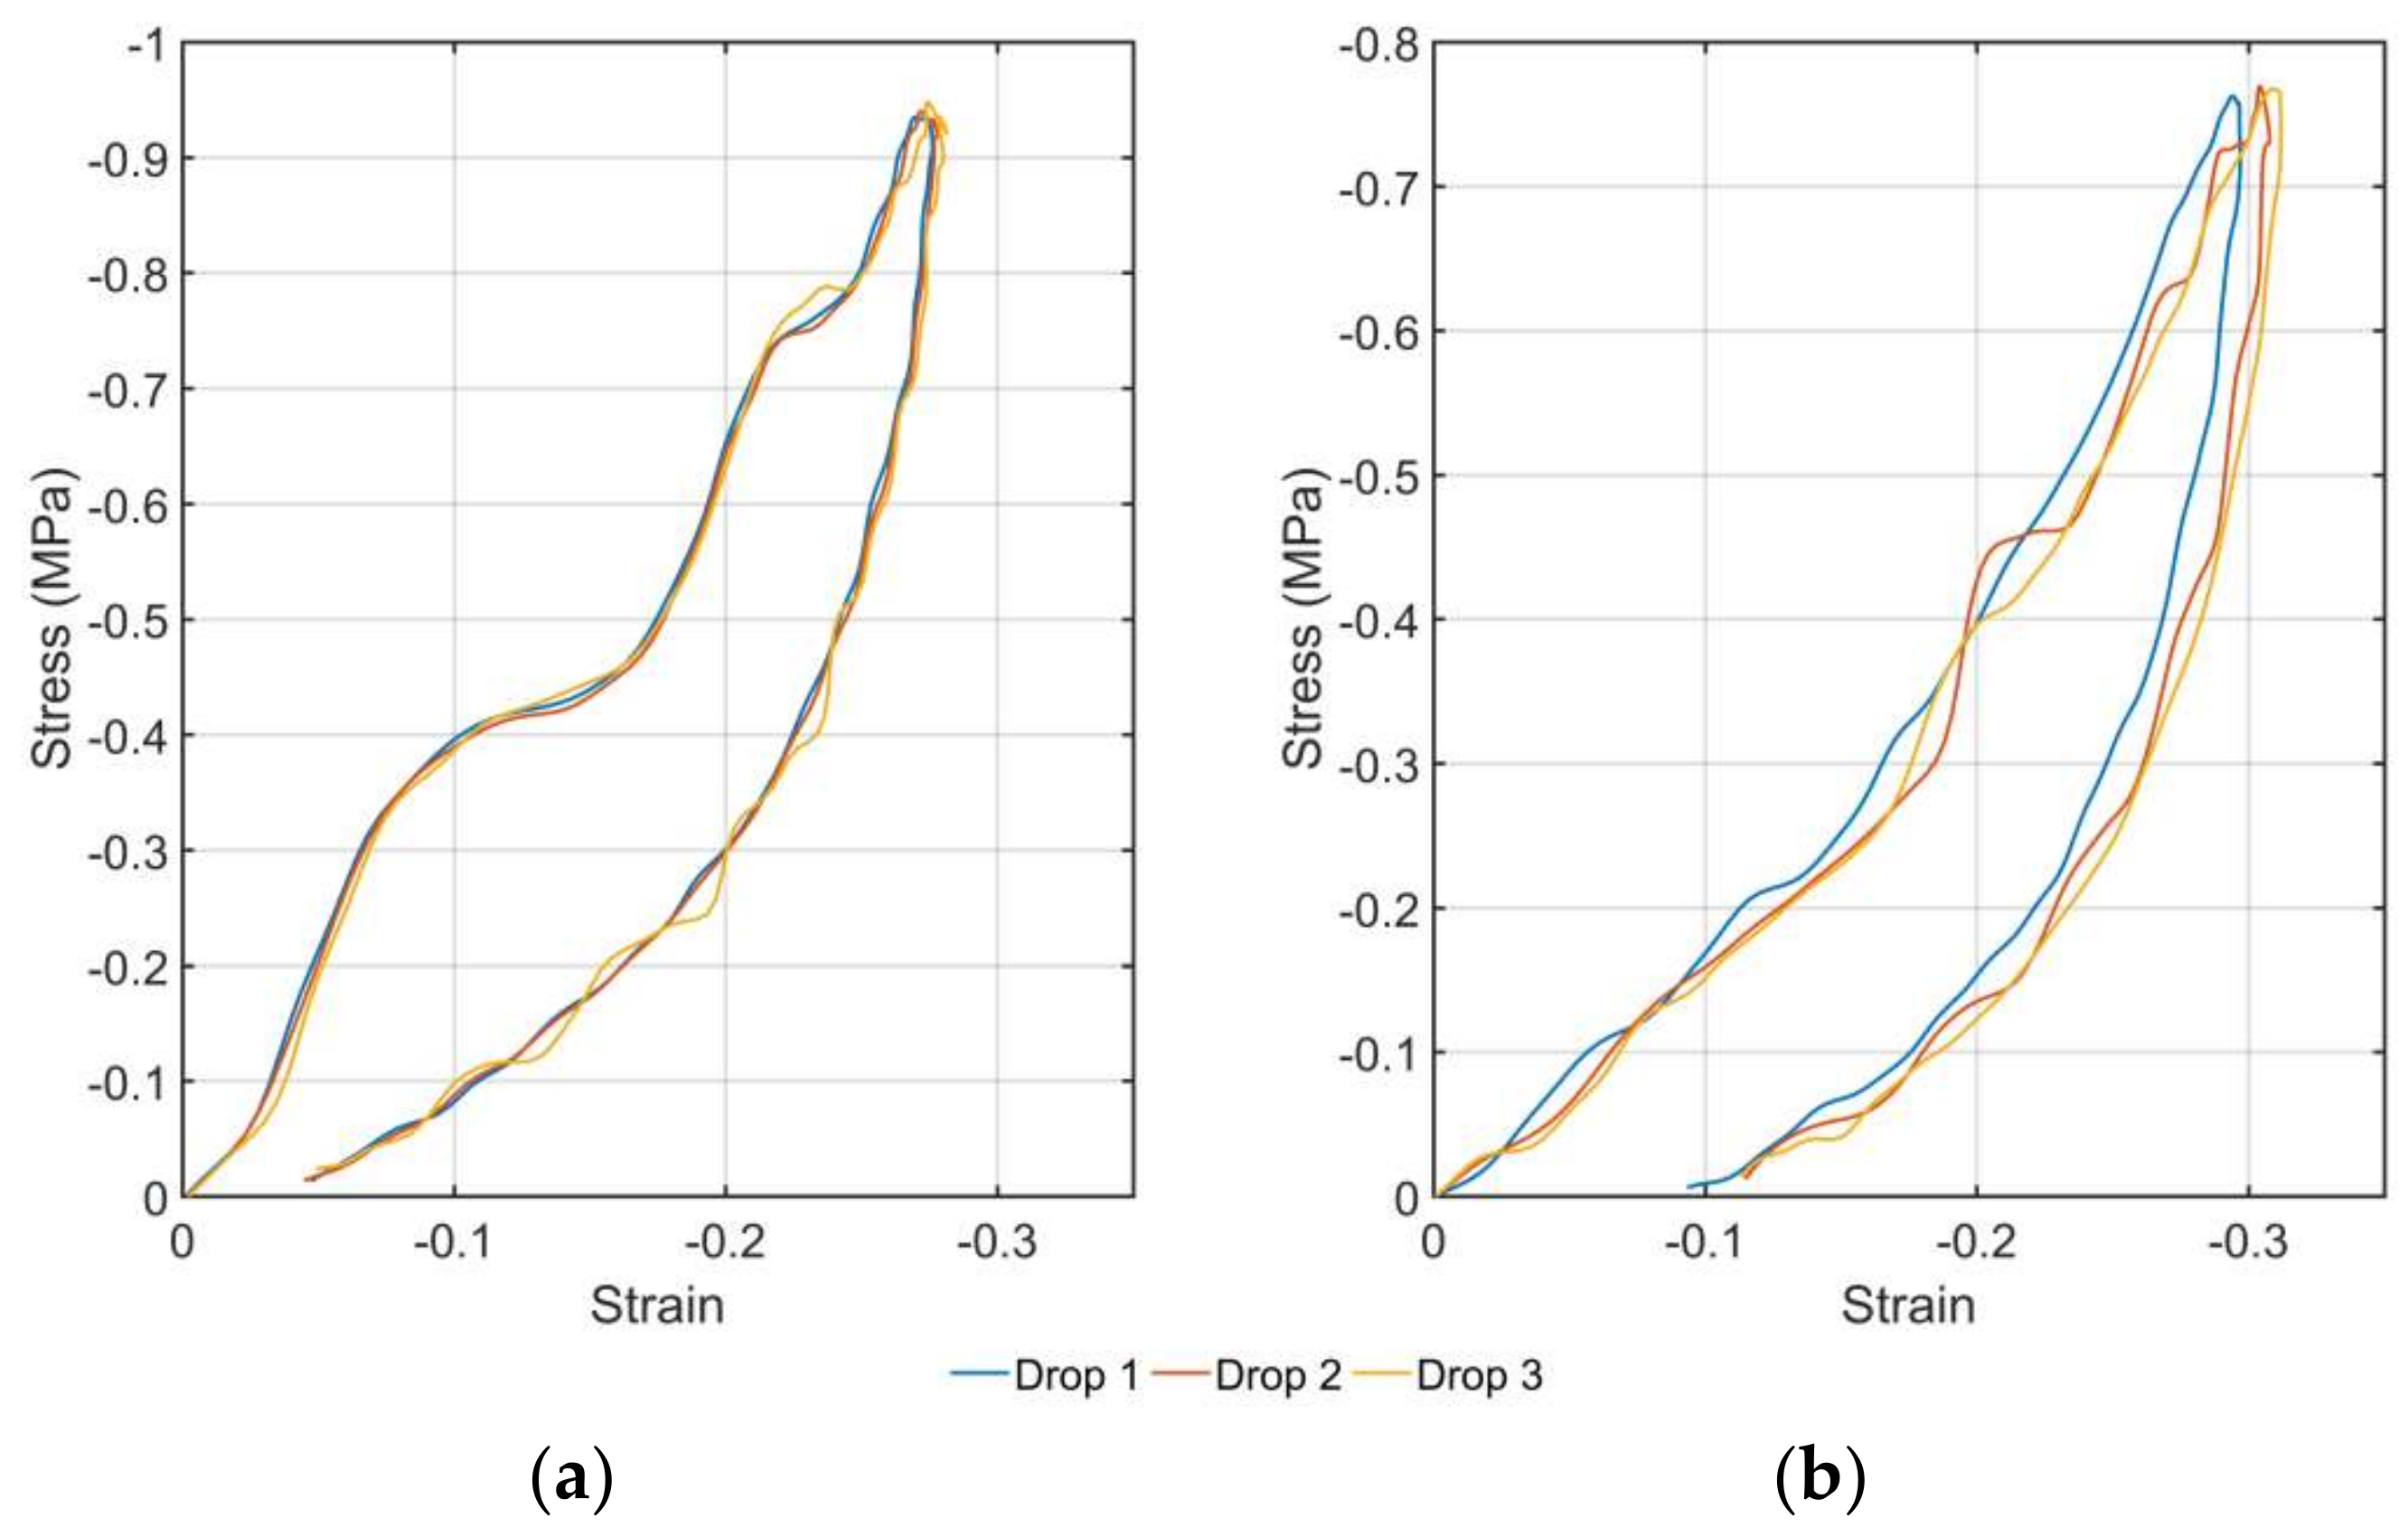
The three regions of shockpad deformation, as described in the literature [13,14], were observed in the experimental stress-strain response at higher drop heights. An initial period of low stiffness and high deflection was followed by a transition region and finally an increase in stiffness at higher strains as the air was squeezed out of the system and rubber-on-rubber contact ensued. At lower drop heights this was less evident and the response was more linear in nature as the shockpad did not experience sufficient strain to enter the second or third stages of compressive behaviour. Interestingly, the loading response for the Berleburger shockpad showed undulations in the loading curve from the AAA impact that was not seen in either the unloading, or in the Holywell shockpad.
Repeatability between drops of the same height remained high as the shockpads remained in their elastic region even at the highest drop heights. Thus, a single drop could be used to represent the shockpad response. The Berleburger shockpad was stiffer and had higher peak accelerations associated with all impacts at different heights when compared to the Holywell shockpad. This may be due to the reduced thickness of the Berleburger shockpad, resulting in the mass and impact foot having a shorter deceleration distance. The strains for each shockpad remained similar despite the difference in thickness, suggesting that thickening of the Berleburger shockpad may lead to better shock absorbing properties.
Calibration of the material models to the experimental data was a multi-step process (Figure 7). The microfoam material model proved to be the more accurate as it allowed for the cellular characteristics of the shockpads to be captured. Relative density is an important characteristic for cellular materials as it expresses the density of the cellular material in relation to the dense solid [24]. The model was able to incorporate the relative density of the shockpads and thus make a distinction between the density of the solid compared to that of the cellular material. As this value could be estimated for both the shockpads, the variable could be fixed whilst optimizing for the remaining model coefficients.
The FE simulation was deemed accurate if the mean error across all comparative measures was less than 10%, with no individual error greater than 15% (Table 3). These values were chosen for a number of reasons but principally due to the experimental values used in the error assessment also being subject to errors. There was an uncertainty associated with the shockpad thickness values due to their construction method and granular nature (standard deviation from 15 thickness measurements was 0.1 mm for the Berleburger and 0.9 mm for the Holywell; Table 1). This has the potential to influence the experimental strain calculations and the outputs from the simulation. The AAA test uses an accelerometer embedded within the 20 kg drop mass to determine the shock absorption, vertical deformation and energy restitution, and in this study the accelerometer output was also used to determine the experimental stress–strain response of the shockpad. The main errors that result from use of the accelerometer are in numerical integration of the acceleration data to determine velocity and displacement, and in determining the instant and conditions at impact. Some measures of these uncertainties can be inferred from the FIFA Quality Concept [21]. In particular, these standards only require vertical deformation to be reported to the nearest 0.5 mm, corresponding to an uncertainty of 7–20% for the experimental values in this study (Table 3). In addition, the standards specify a range for the required impact velocity of 1.02 to 1.04 m/s (for the 55 mm drop height). A sensitivity analysis conducted on the FE simulation, where the impact velocity was increased over this range, found a 1% reduction in shock absorption (corresponding to a 2% error in the FE simulation value) and no detectable change in vertical deformation, energy restitution or contact time. The second main reason for the chosen error values relates to the levels of accuracy reported in a previous study that simulated the AAA drop test onto athletic track materials [15,16]. This previous study used a less extensive error analysis than performed here, however, comparable errors of up to 8% in shock absorption were reported and deemed acceptable for the simulated response.
Validation of the material model was completed by running FE simulations for different drop heights and comparing the results to the experimental data. The results showed a good match to the stress-strain response for the lower drop heights. This result is somewhat unsurprising given that the lower drop heights tended to follow the same loading—unloading curve as the higher impacts. The energy restitution was poorly estimated for the higher drop heights due to the rebound velocity being much higher in the FE simulation than that of the experimental data. This suggests more energy needs to be taken out of the system. Attempts to further adjust the material models to allow for more energy to be absorbed caused the maximum force to drop and the vertical deformation to increase beyond the 15% error margin. Therefore, optimisation of all parameters requires a compromise to be made between making the models stiff enough to stop excessive deformation, but also compliant enough to absorb the impact forces and dissipate the impact energy.
More accurate deformation responses for the shockpads under the lower drop heights could have been achieved through calibration of the models to the stress–strain data for these drop heights. Calibration to the 55 mm drop height allowed for all three phases of shockpad response to be captured. Lower drop heights, particularly under 35 mm, were linear in nature and therefore were unlikely to be successful in estimating the shockpad response for higher drop heights. When considering the intended future application of this modelling work, i.e., to model the whole 3G turf surface system under human loading conditions, the stress at the shockpad level will be more variable than for the controlled conditions of this study. Therefore, having a model that can fit the shockpad response for a range of drop heights becomes much more desirable. While the 55 mm drop height (designed to emulate the impact of heel strike running on 3G turf) is likely to represent the maximum stress conditions the shockpad would be exposed to [26].
The FIFA test measurements of shock absorption, energy restitution and vertical deformation allow for easy evaluation of the models and comparison of the shockpad responses. However, they are reliant on only a few discrete values taken from the impact data. Using only these values it would be easy to miss any differences in the loading curves between the two shockpads. Therefore, creating a simulation capable of reproducing acceptable values only for the FIFA test criteria may not result in an accurate representation of the full shockpad response. Inclusion of strain RMSE as an assessment criterion was important in giving a measure of how well the simulation captured this full response.

6. Conclusions

The modelling of elastomeric materials is complex with limited material models at the users’ disposal. This study has shown how data taken from a non–standard material test method (the AAA; [21]) can be used to successfully calibrate microfoam material models for two shockpads. The use of a foam model over a model for solid (rubber) materials performed better in describing the behaviour of both shockpads even though one shockpad demonstrated a more traditional hyper-elastic experimental response. Results from the AAA simulation demonstrated a good fit to the experimental data across most measurement variables and all drop heights. Future work should focus on improving the accuracy of the models as well as extending their predictive capacity, for example, to estimate the effects of altering shockpad thickness.

Author Contributions

All authors were involved in conceiving and designing the study; D.C. performed the experiments and analysed the data; All authors were involved in writing the paper.

Conflicts of Interest

The authors declare no conflict of interest.

References

  1. Sport England Artificial Surfaces for Outdoor Sport: Updated Guidance for 2013. Available online: https://www.sportengland.org/facilities-planning/ (accessed on 28 January 2018).
  2. Sport England. Sport Scotland Synthetic Turf Pitch User Survey. Available online: https://sportscotland.org.uk/ (accessed on 28 January 2018).
  3. Fédération Internationale de Football Association FIFA Quality Programme for Football Turf. Available online: www.FIFA.com (accessed on 23 February 2018).
  4. Gibson, O. The Guardian Online: FA Reveals Its 2020 Vision: Football Hubs and 3G Pitches for All. Available online: https://www.theguardian.com/football (accessed on 22 June 2016).
  5. Dixon, S.; Fleming, P.; James, I.; Carre, M. The Science and Engineering of Sports Surfaces, 1st ed.; Routledge: Oxford, UK, 2015; ISBN 978-0-415-50092-0. [Google Scholar]
  6. Fleming, P.; Ferrandino, M.; Forrester, S. Artificial Turf Field-A New Build Case Study. Proc. Eng. 2016, 147, 836–841. [Google Scholar] [CrossRef]
  7. McLaren, N.; Fleming, P.; Forrester, S. Artificial grass: A conceptual model for degradation in performance. Proced. Eng. 2012, 34, 831–836. [Google Scholar] [CrossRef] [Green Version]
  8. Smith, L.P. The Language of Rubber: An Introduction to the Specification and Testing of Elastomers; Butterworth-Heinemann: London, UK, 1993; ISBN 10: 0750614137. [Google Scholar]
  9. Harper, C.A. Chapter 4: Elastomers. In Handbook of Plastics Technologies; McGraw-Hill: London, UK, 2006; ISBN 9780071460682. [Google Scholar]
  10. Mills, N. Polymer Foams Handbook Engineering and Biomechanics Applications and Design Guide; Butterworth-Heinemann: London, UK, 2007; ISBN 978-0-7506-8069-1. [Google Scholar]
  11. Kossa, A.; Berezvai, S. Visco-hyperelastic Characterization of Polymeric Foam Materials. Mater. Today Proc. 2016, 3, 1003–1008. [Google Scholar] [CrossRef]
  12. Verdejo, R.; Mills, N.J. Heel-shoe interactions and the durability of EVA foam running-shoe midsoles. J. Biomech. 2004, 37, 1379–1386. [Google Scholar] [CrossRef] [PubMed]
  13. Anderson, L. Elastomeric Shockpads for Outdoor Synthetic Sports Pitches, Ph.D. Thesis, Loughborough University, Loughborough, 2007. [Google Scholar]
  14. Allgeuer, T.; Torres, E.; Bensason, S.; Chang, A.; Martin, J. Study of shockpads as energy absorption layer in artificial turf surfaces. Sport. Technol. 2008, 1, 29–33. [Google Scholar] [CrossRef]
  15. Andena, L.; Briatico-Vangosa, F.; Ciancio, A.; Pavan, A. A finite element model for the prediction of Force Reduction of athletics tracks. In Procedia Engineering; Elsevier B.V.: Sheffield, UK, 2014; Volume 72, pp. 847–852. [Google Scholar]
  16. Andena, L.; Briatico-Vangosa, F.; Cazzoni, E.; Ciancio, A.; Mariani, S.; Pavan, A. Modeling of shock absorption in athletics track surfaces. Sport. Eng. 2015, 18, 1–10. [Google Scholar] [CrossRef] [Green Version]
  17. Farhang, B.; Araghi, F.R.; Bahmani, A.; Moztarzadeh, F.; Shafieian, M. Landing impact analysis of sport surfaces using three-dimensional finite element model. In Proceedings of the Institution of Mechanical Engineers, Part P: Journal of Sports Engineering and Technology; SAGE Publications: Thousand Oaks, CA, USA, 2015; pp. 1–6. [Google Scholar]
  18. Thomson, R.D.; Birkbeck, A.E.; Lucas, T.D. Hyperelastic modelling of nonlinear running surfaces. Sport. Eng. 2001, 4, 215–224. [Google Scholar] [CrossRef]
  19. Dal, H.; Kaliske, M. Bergström-Boyce model for nonlinear finite rubber viscoelasticity: Theoretical aspects and algorithmic treatment for the FE method. Comput. Mech. 2009, 44, 809–823. [Google Scholar] [CrossRef]
  20. Mehravar, M.; Fleming, P.; Cole, D.; Forrester, S. Mechanical Characterisation and Strain Rate Sensitivity of Rubber Shockpad in 3G Artificial turf; Association for Computational Mechanics in Engineering: Cardiff, Wales, UK, 2016; pp. 8–11. [Google Scholar]
  21. Fédération Internationale de Football Association FIFA Quality Concept for Football Turf: Handbook of Test Methods. Available online: www.FIFA.com (accessed on 23 February 2018).
  22. Fédération Internationale de Football Association FIFA Quality Programme for Football Turf—Handbook of Requirements. Available online: https://football-technology.fifa.com/en/media-tiles/football-turf-handbook-of-requirements-2015/ (accessed on 23 February 2018).
  23. BSW Berleburger Schaumstoffwerk GmbH Regupol® Elastic Shock Pads for Artificial Turf. Available online: https://www.berleburger.com/en/products/ (accessed on 10 July 2017).
  24. Solorzano, E.; Rodriguez-Perez, M.A. Part IV Cellular Materials. In Structural Materials and Processes in Transportation; John Wiley & Sons: Hoboken, NJ, USA, 2013; pp. 371–374. ISBN 9783527649846. [Google Scholar]
  25. Bijarimi, M.; Zulkafli, H.; Beg, M.D.H. Mechanical properties of industrial tyre rubber compounds. J. Appl. Sci. 2010, 10, 1345–1348. [Google Scholar] [CrossRef]
  26. Wang, X. Advanced Measurement for Sports Surface System Behaviour under Mechanical and Player Loading, Ph.D. Thesis, Loughborough University, Loughborough, UK, 2013. [Google Scholar]
Figure 1. Layered construction of 3G turf surface.
Applsci 08 00501 g001
Figure 2. Sample sections of (a) Regupol® 6010 SP shockpad manufactured by Berleburger. (b) Holywell shockpad laid in-situ on Loughborough University campus.
Applsci 08 00501 g002
Figure 3. Advanced Artificial Athlete (AAA) schematic: 1. support frame; 2. electric magnet; 3. 20 kg falling mass; 4. accelerometer; 5. linear stiffness spring; 6. 70 mm diameter test foot [21].
Applsci 08 00501 g003
Figure 4. Stress-strain curves from 3 drops at the 55 mm drop height for the (a) Berleburger shockpad and (b) Holywell shockpad.
Applsci 08 00501 g004
Figure 5. Stress-strain curves for the first drop for each drop height for (a) Berleburger and (b) Holywell shockpad.
Applsci 08 00501 g005
Figure 6. AAA FE model showing increased mesh density around impact area. The model was extruded to eight times the radius of the impact foot.
Applsci 08 00501 g006
Figure 7. Flow chart showing the steps involved in material model development.
Applsci 08 00501 g007
Figure 8. Comparison of stress-strain experimental data against FE simulation outputs across the three drop heights for (a) Berleburger and (b) Holywell shockpads.
Applsci 08 00501 g008
Table 1. Shockpad properties overview.
NameMaterialGranule Size (mm)BinderDensity (kg/m3)Thickness (mm)Relative Density
BerleburgerRubber shreds1–2Polyurethane55715.0 ± 0.10.49
HolywellRubber granules2–6Polyurethane575–60022.4 ± 0.90.54
Table 2. Optimised microfoam model coefficients for the two shockpad models. Stress outputted in Pascals.
Microfoam Model PropertiesShockpad Model Values
Parameter NameUnitDescriptionBerleburgerHolywell
EsStressYoung’s modulus when no porosity7,000,0005,500,000
alphaE-Modulus density scaling factor0.00560.0056
hE-Modulus density scaling factor2.52.5
nu0-Poisson’s ratio in the limit of 100% porosity0.050.05
nus-Poisson’s ratio in limit of no porosity0.490.2
rhor-Reduced density of the material0.50.54
lambdaL-Limiting chain stretch44
sB-Relative stiffness of network B55
p0StressInitial gas pressure inside the foam voids00
xi-Strain adjustment factor0.050.05
C-Strain exponential−0.5−0.5
tauHatStressNormalised flow resistance300,000300,000
m-Stress exponent22
Table 3. Experimental and FE simulation results from first drop of AAA for the Berleburger and Holywell shockpads.
Shockpad and Drop HeightSourceShock Absorption (%)Energy Restitution (%)Vertical Deformation (mm)Contact Time (ms)RMSE (% of Max Strain)Mean Error (%)
Berleburger
55 mm
Experimental4155−4.118.5--
FE3863−4.117.4--
Difference (%)8130667
Berleburger
35 mm
Experimental4852−3.418.7--
FE4559−3.618.3--
Difference (%)71262148
Berleburger
15 mm
Experimental5453−2.520.1--
FE5053−2.819.9--
Difference (%)80111188
Holywell
55 mm
Experimental5150−6.723.8--
FE5256−6.623.1--
Difference (%)21123147
Holywell
35 mm
Experimental5748−5.825.1--
FE5951−5.724.5--
Difference (%)362294
Holywell
15 mm
Experimental6345−4.127.1--
FE6244−4.325.6--
Difference (%)225664

