Article

A New Wind Turbine Generating System Model for Balanced and Unbalanced Distribution Systems Load Flow Analysis

1
Electronics Engineering Department, Gebze Technical University, Cumhuriyet District, 2254 St., No. 2, 41400 Gebze/Kocaeli, Turkey
2
Electrical and Electronics Engineering Department, Balıkesir University, 10145 Balıkesir, Turkey
*
Author to whom correspondence should be addressed.
Appl. Sci. 2018, 8(4), 502; https://doi.org/10.3390/app8040502
Submission received: 7 February 2018 / Revised: 17 March 2018 / Accepted: 21 March 2018 / Published: 27 March 2018

Abstract

:
Wind turbine generating systems (WTGSs), which are conventionally connected to high voltage transmission networks, have frequently been employed as distributed generation units in today’s distribution networks. In practice, the distribution networks always have unbalanced bus voltages and line currents due to uneven distribution of single or double phase loads over three phases and asymmetry of the lines, etc. Accordingly, in this study, for the load flow analysis of the distribution networks, Conventional Fixed speed Induction Generator (CFIG) based WTGS, one of the most widely used WTGS types, is modelled under unbalanced voltage conditions. The Developed model has active and reactive power expressions in terms of induction machine impedance parameters, terminal voltages and input power. The validity of the Developed model is confirmed with the experimental results obtained in a test system. The results of the slip calculation based phase-domain model (SCP Model), which was previously proposed in the literature for CFIG based WTGSs under unbalanced voltages, are also given for the comparison. Finally, the Developed model and the SCP model are implemented in the load flow analysis of the IEEE 34 bus test system with the CFIG based WTGSs and unbalanced loads. Thus, it is clearly pointed out that the results of the load flow analysis implemented with both models are very close to each other, and the Developed model is computationally more efficient than the SCP model.

1. Introduction

Environmental damage and declining reserves of fossil fuels, and the risks of the usage of nuclear energy, increases the interest shown in renewable energy sources day by day. Many countries have considered renewable energy sources to meet the energy needs in order to reduce the dependence on fossil fuels and foreign sources. These countries make medium/long-term plans to increase the share of renewable energy sources in energy production. Governments are applied incentives to steer the private investors on renewable energy sources by the scope of these plans, and, thus, the investments are made on domestic energy production. The European Union (EU) aims to achieve at least 20% of its energy needs from renewable energy sources until 2020, and this rate is intended to reach at least 27% for the year 2030 [1]. In the renewable electricity plan that has been published by the US Energy Efficiency and Renewable Energy Office, at least 30% of the energy needs of US are intended to be obtained from renewable energy sources by 2025 [2]. In the renewable energy action plan that was announced by the General Directorate of Renewable Energy of the Republic of Turkey, at least 30% of the energy needs are intended to be derived from renewable energy sources by 2023 [3].
Wind energy, an important renewable energy source, is a resource where countries can benefit from the advantages of their geographical location. Wind energy is converted into electrical energy by the wind turbine generator systems (WTGSs) [4]. WTGSs are generally formed with a propeller and a generator. When compared to synchronous generators, being smaller in size and having lower operation costs, asynchronous generators are widely preferred in small sized WTGSs. WTGSs can be classified under two main headings that are conventional fixed speed WTGSs and variable speed WTGSs [5]. Variable speed WTGSs have high installation and operating costs since they include high-tech power electronic components and control circuits. As a result of this, instead of variable speed induction generators, CFSIGs are preferred and are generally connected to low or medium voltage distribution networks directly.
Large-scale wind farms are typically connected to the high-voltage transmission system; however, small and medium-scale distributed generation units based on wind energy are placed in the distribution systems. Generally, distribution systems are structured and operated radially; thus, it is expected to be supplied from a single source. With the increasing usage of WTGSs, multiple feeding points are emerging on the distribution system. This can cause power flow in both directions (towards source or load), unlike the conventional system operation [6]. For example, in a case where the distribution network is dominated by wind energy resources, this distribution network can behave as an active network and can give feedback to the high voltage bus. As a distributed generation system, not only WTGSs, but also other renewable or non-renewable generation systems have an impact on the conventional distribution network’s voltage profile and energy losses [6,7]. It should be acknowledged that these kinds of operations can cause a number of technical difficulties and operational issues [8].
In practice, the distribution networks always have unbalanced bus voltages and line currents due to single or double phase loads, unsymmetrical line impedances, single or two phase spurs, etc. [9]. There are balanced power flow models for directly network connected CFIGs in the literature. [10,11]. The use of these models for unbalanced distribution system power flow analysis may lead to erroneous results [12]. Therefore, a symmetrical component based model of induction generators is introduced in the study of Abdel-Akher et al. [12] and Ghorashi et al. [13]. The accurate estimation of the rotor slip value is difficult and requires computationally expensive iterative methods. In addition to this, the need for a solution for complex phase currents/voltages brings extra computational complexity for power flow analysis. Therefore, in most of the unbalanced power flow analyses in the literature, asynchronous generators are modeled as balanced and fixed Active (P)-Reactive (Q) Power sources by ignoring the effect of the imbalance (Constant P, Q Model) [14,15,16]. In some studies, this simplified model has been updated by the calculation of the reactive power demand from the grid. For this purpose, the reactive power demanded from the grid brought into a function of positive sequence voltage (Vsp) and machine impedance parameters, and, thereby, this updated model has been applied to power flow analysis (Constant P, Q(Vsp) Model) [14,15,16].
Preliminary results of this paper were presented in a conference [17]. In addition to preliminary results, this study includes load flow analysis and experimental validation of the model. In this paper, for the load flow analysis of the distribution networks, CFIG based WTGSs are modelled under unbalanced voltage conditions. The Developed model has active and reactive power expressions in terms of induction machine impedance parameters, input power and terminal voltages. In the Developed model, magnitude of the positive- sequence rotor side voltage is expressed via bi-quadratic equation, which is generally used to calculate node voltages in the load flow analysis [10,11,14,18,19]. In the study of Feijôo and Villanueva [18], a slightly modified model of the Eminoglu et al. study [10] is given and the advantages of the bi-quadratic equation based models are highlighted. In addition, such models have an iterative algorithm to find the positive- and negative-sequence rotor side powers, the sum of which is equal to the wind power. Unlike the slip calculation based models, the Developed model does not require prior knowledge on the angles of sequence voltages and currents, thus it can be implemented with a lesser number of operations.
To verify the Developed model for WTGSs, a laboratory testing was carried out. An induction generator coupled with a controllable induction motor was used. Finally, both the Developed Model and the SCP Model [12] are applied by the authors to phase domain power flow analysis in a 34 bus radial distribution test system published by IEEE [20], and the results were analyzed comparatively. In addition, the complexity analysis of these two models are compared in terms of required mathematical operations. The three-phase load flow analysis of models was performed via Matlab 2012a [21] by using open source software OpenDSS (Open Distribution System Simulator) [22] program libraries. The library files of models (DLLs (Dynamic Link Library)) were created in Delphi®XE5.

2. Materials and Methods

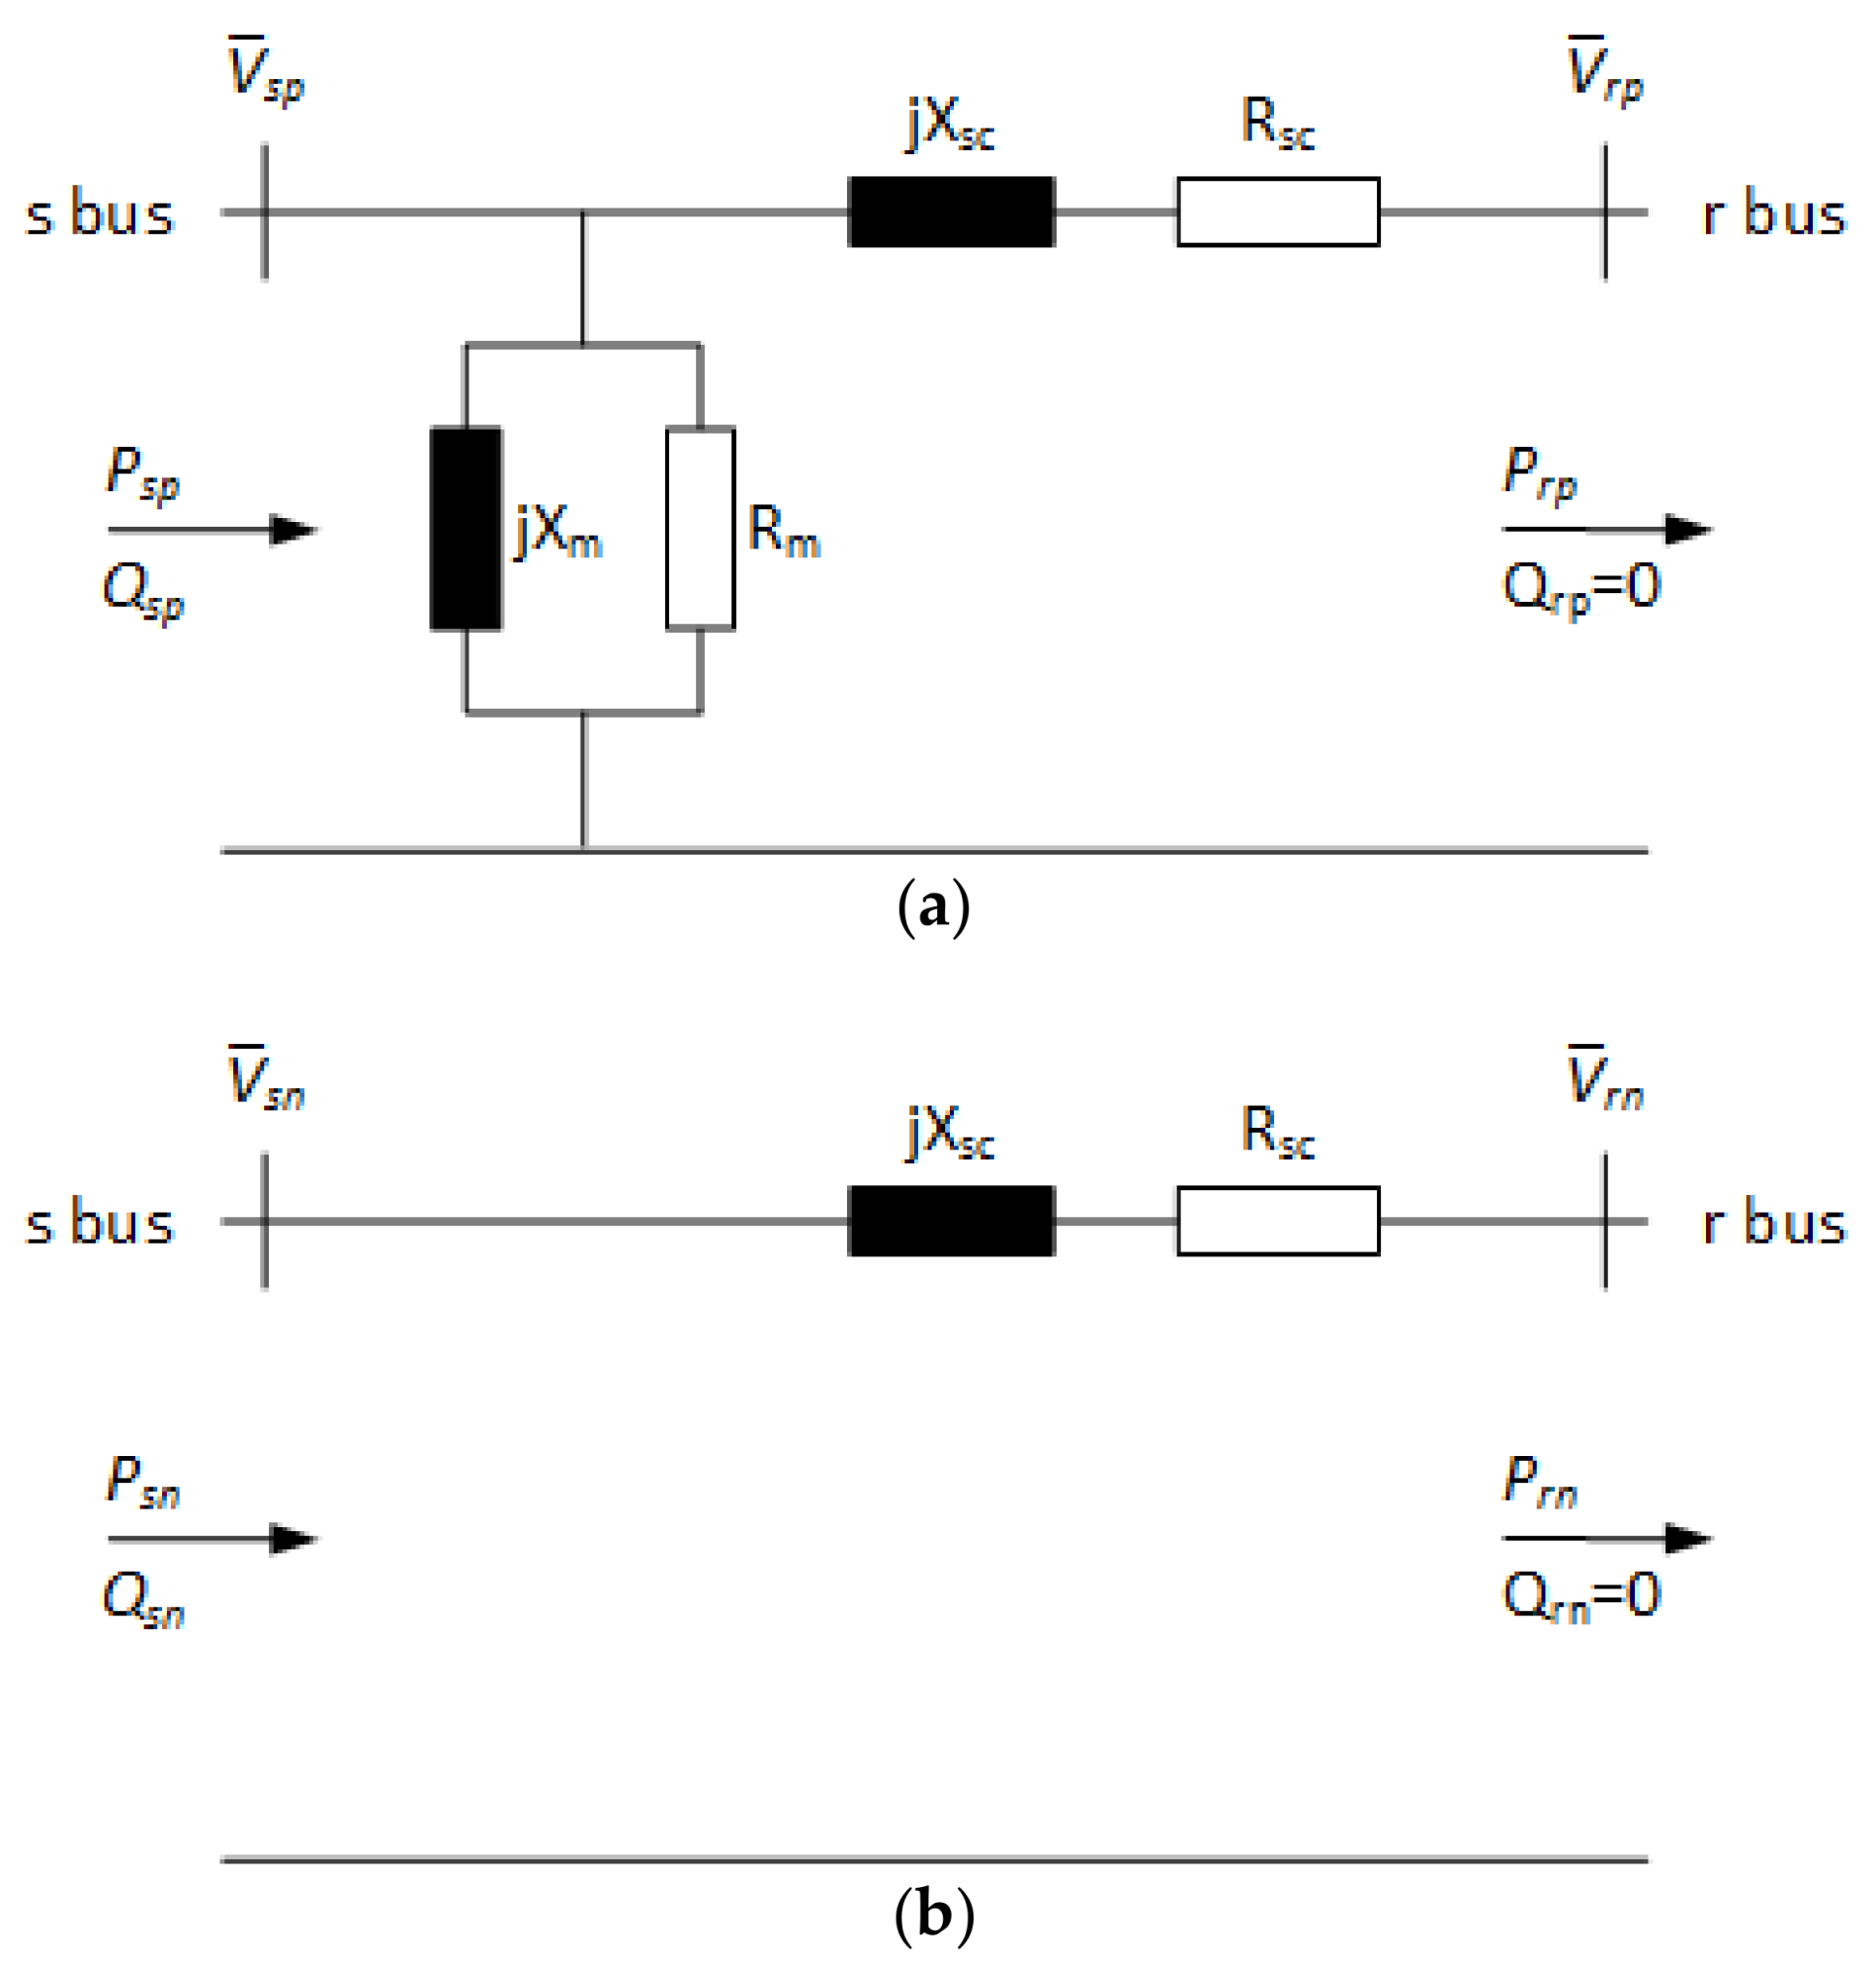
2.1. Developed Model for WTGSs

In this study, it is aimed to model the CFSIG based WTGS for unbalanced load flow analysis of distribution power systems. It has a delta configured induction generator directly connected to the bus. The mechanical input power (PT) of a WTGS can be calculated by regarding the air density (ρ), the area swept by the rotor (A), the power coefficient (CP) and wind speed (u) [12]:
P T = 1 2 · ρ · A · u 3 C P ( λ ) .
The power coefficient is subject to the tip speed ratio (λ) expressed as follows:
λ = ω R u ,
where ω and R denote the angular velocity and turbine rotor radius, respectively.
To provide the model of WTGS, firstly, the positive- and negative-sequence equivalent circuits of the induction generator shown in Figure 1 are taken into consideration.
In the same figure, Vsp, Vsn, Vrp and Vrn indicate the magnitudes of the positive- and negative-sequence voltages for the stator and referred rotor sides, respectively. For the equivalent circuits, Rsc is the short-circuit equivalent resistance, which is sum of the stator winding (Rs) and referred rotor winding resistance (Rr), and Xsc is the short circuit equivalent reactance, which is sum of the stator winding (Xs) and referred rotor winding reactance (Xr). Rm and Xm stand for the resistance and the magnetizing reactance of the core for the positive-sequence equivalent circuit. On the other hand, by looking at Ref. [13], in the negative-sequence equivalent circuit, Rm and Xm are neglected for the simplification. Psp and Psn stand for the positive- and negative-sequence active powers absorbed by the stator.
The sum of the positive- and negative-sequence rotor active powers, denoted as Prp and Prn, gives the mechanical input power of the WTGS:
P T = 3 · ( P r p + P r n ) .
It is seen from the equivalent circuits that the induction generator draws the positive- and negative-sequence reactive powers (Qsp and Qsn) from the grid. In addition, the positive- and negative-sequence reactive powers (Qrp and Qrn), which are measured at the rotor (r) bus, should be nil. While looking at the positive-sequence equivalent circuit and the bi-quadratic equation, which was used to model the CFSIG based WTGSs for balanced systems in [9], the referred rotor positive-sequence voltage’s magnitude, Vrp, can be written as
V r p = V s p 2 2 R s c P r p + ( V s p 2 2 R s c P r p ) 2 4 Z s c 2 P r p 2 2 ,
where Zsc stands for the induction generator’s short-circuit impedance:
Z s c = R s c 2 + X s c 2 .
The magnitude of the negative sequence current (Isn), which flows from r bus to s bus in the negative-sequence equivalent circuit, and negative-sequence active power at r bus (Prn) can be expressed in terms of the impedance parameters (Rr, Rsc, Xsc), the magnitudes of the rotor positive-sequence and stator negative-sequence voltages (Vrp, Vsn) and positive-sequence active power at r bus (Prp):
I s n = I r n = V s n ( ( R s c R r · V r p 2 2 · V r p 2 + P r p · R r ) 2 + X s c 2 ) ,
P r n = I r n 2 · R r · V r p 2 2 V r p 2 + P r p R r .
The positive- and negative-sequence active powers at s bus can be expressed as in Equations (8) and (9):
P s p = P r p + ( P r p V r p ) 2 R s c + V s p 2 R m ,
P s n = P r n + I s n 2 R s c .
Hence, the total active power at s bus can be calculated as:
P s = 3 ( P s p + P s n ) .
On the other hand, the positive- and negative-sequence reactive powers at s bus can be expressed as follows:
Q s p = ( P r p V r p ) 2 X s c + V s p 2 X m ,
Q s n = I s n 2 X s c .
By regarding both reactive powers, the total reactive power at s bus can be calculated:
Q s = 3 ( Q s p + Q s n ) .
Since Prp and Prn have unknown values, the model needs an iterative solution algorithm. The algorithm of the Developed model is summarized below:
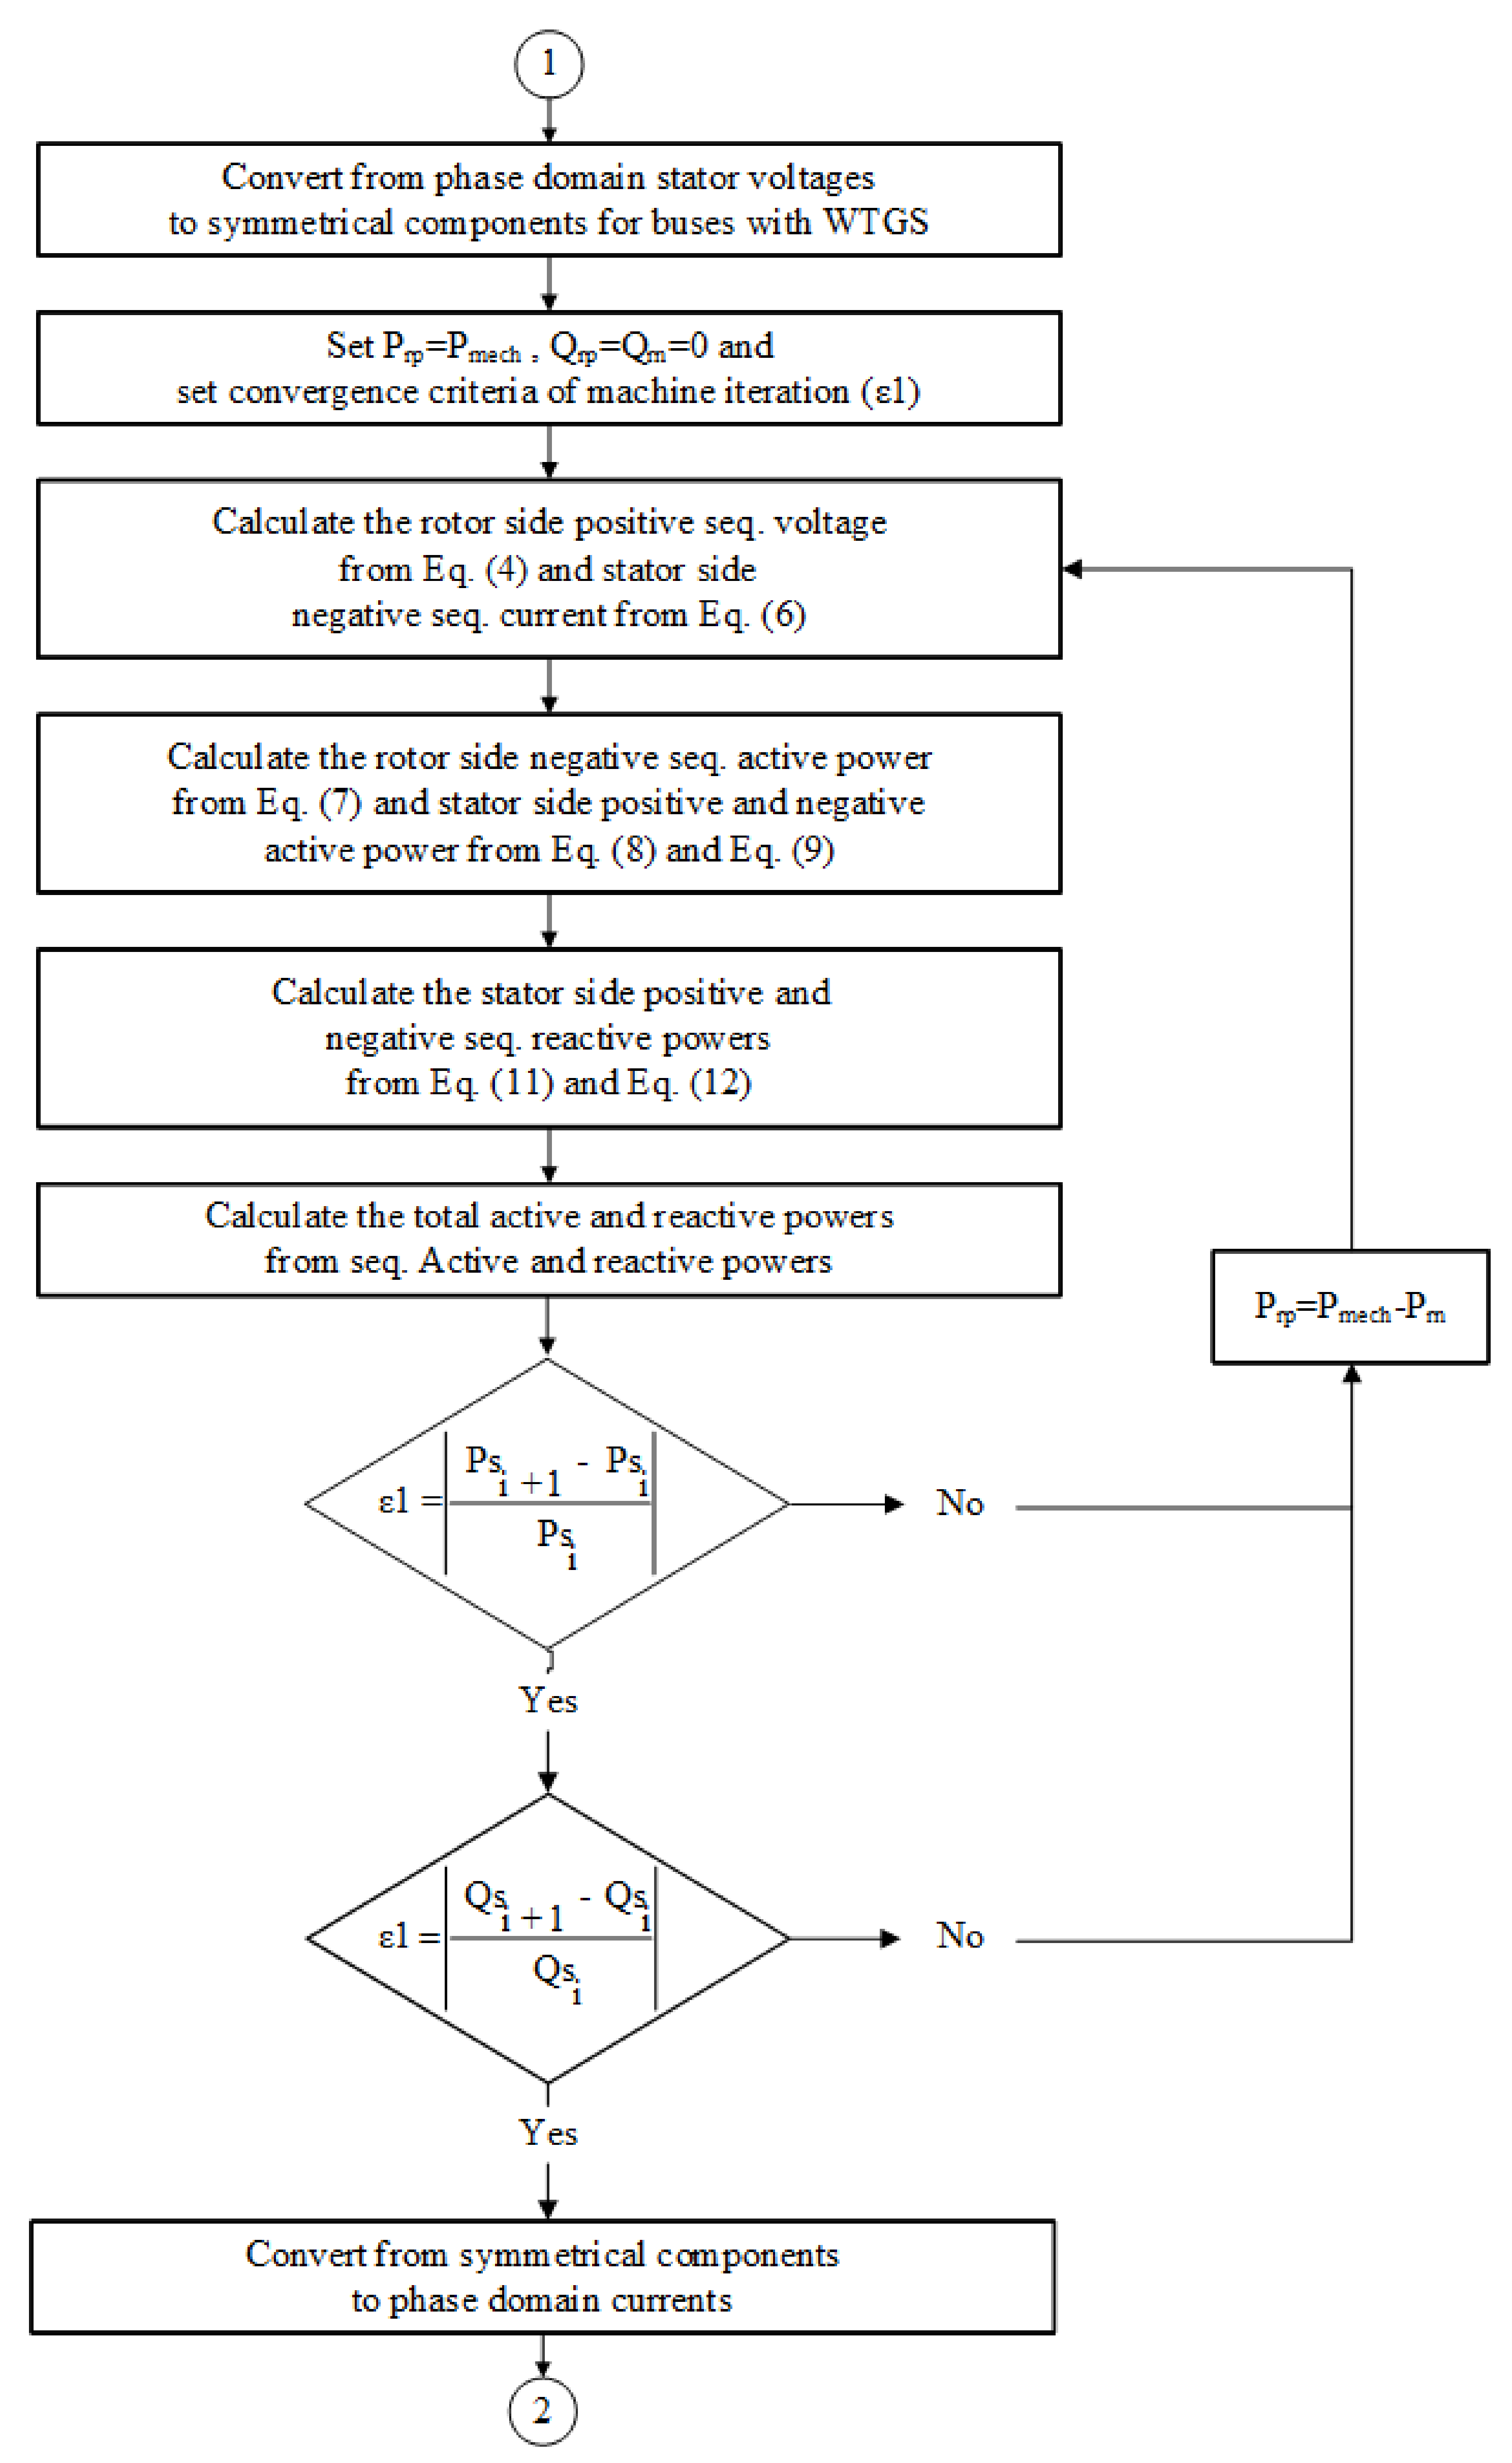
  • Step 1: Determine initial value of Prp by assuming all of the mechanical power (PT) delivered to the positive-sequence circuit.
  • Step 2: Calculate Vrp via Equation (4).
  • Step 3: Find Irn and Prn by substituting the Vrp and the Prp values in Equations (6) and (7).
  • Step 4: Calculate Ps and Qs values by means of Equations (8)–(13).
  • Step 5: Find the relative difference value of Ps and the relative difference value of Qs, which are calculated for the last two iterations (i + 1. and i. iterations), via Equations (14) and (15).
  • Step 6: If both calculated relative difference values are larger than tolerance value (ε), update the Prp value by substituting the last calculated Prn value in Equation (3), and return to the Vrp calculation step. Otherwise, finalize the solution algorithm:
ε > | P S i + 1 P S i P S i | ,
ε > | Q S i + 1 Q S i Q S i | .
Note that the magnitudes (Vsp, Vsn) and angles ( φ sp, φ sn) of the sequence voltages at the s bus have known values, and sequence active powers (Psp, Psn), sequence reactive powers (Qsp, Qsn) and magnitudes (Isp, Isn) of sequence currents at the s bus are found after completing the iterative algorithm. Additionally, the angles of the positive- and negative-sequence currents measured at the s bus, denoted as βsp and βsn, can be calculated by considering Equations (16) and (17):
β s p = φ s p cos 1 ( P s p V s p I s p ) ,
β s n = φ s n cos 1 ( P s n V s n I s n ) .
Finally, sequence voltages and currents of the stator side can be converted to the phase values of those quantities by means of the symmetrical components method. Then, using Equations (18) and (19), active and reactive powers can be found for m = a, b, c phases:
P m = V m I m cos θ m ,
Q m = V m I m sin θ m .
In Equations (18) and (19), θm denotes phase angle difference between voltage and current of phase m. If phase active and reactive powers have a minus (−) sign, it can be mentioned that these powers are injected from generator to grid; otherwise, these powers flow from grid to the generator. Note that, in the next sections, due to the fact that the injected active and demanded reactive power are given in the analysis, both of them will have a positive sign.

2.2. Load Flow Analysis Implementation of Developed Model

The details of the algorithm are provided in this section to incorporate the developed CFIG based WTGS model in load flow analyses. It is divided into two iterative blocks as given in Figure 2 and Figure 3. The first part of the blocks is three-phase unbalanced load flow block, and the second part is provided for the Developed model. The unbalanced load flow analysis for the Developed model can be performed by a sweep based algorithm that is commonly used in distribution systems [23].
The first step at the implementation of the Developed model into the load flow analysis is the data preparation of related line and transformers’ impedances, loads and generator data and initial values of the bus voltages, which are assumed to be 1 pu. In the second step, three-phase unbalanced load flow is performed. After that, generator terminal voltages, which are necessary for asynchronous machine iteration block (machine iteration block), are calculated. By converting to positive- and negative-sequence components from calculated generator terminal phase voltages, machine iteration starts and this is shown in Figure 3 after number (1). It will be stopped when Equations (14) and (15) are satisfied. Finally, the model algorithm provides the phase-domain quantities for the load flow algorithm at number (2).

3. Results and Discussion

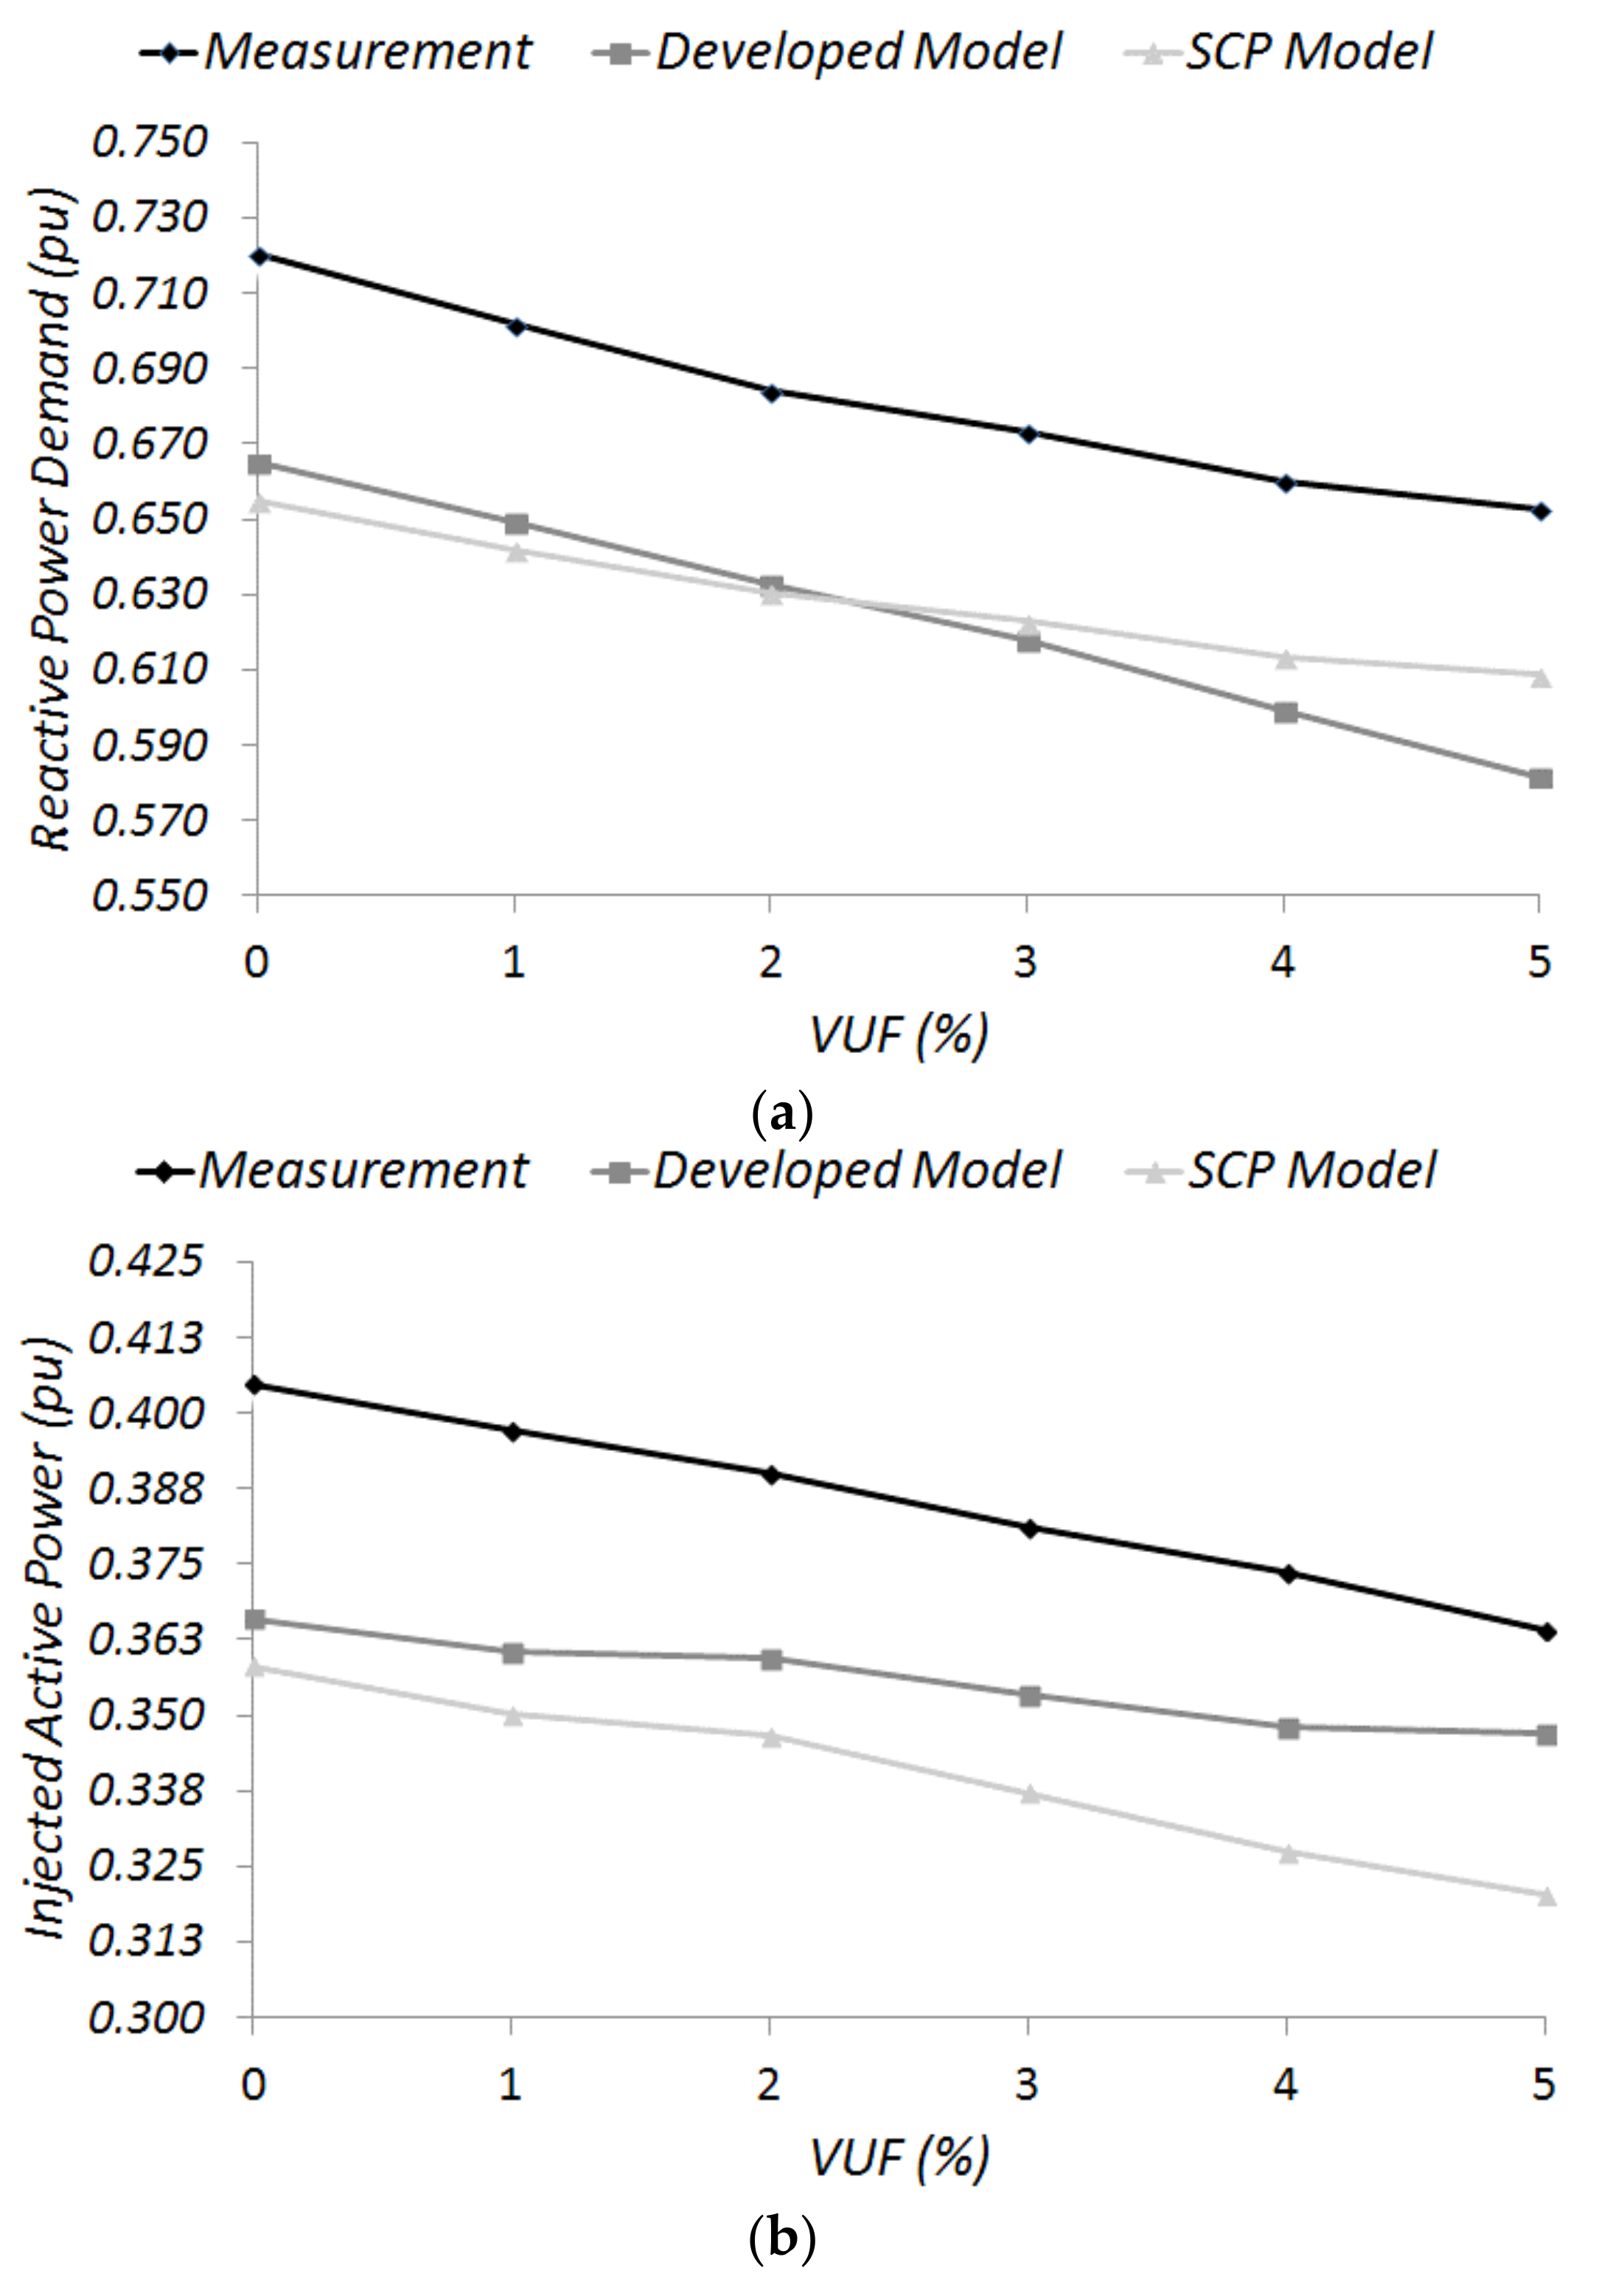
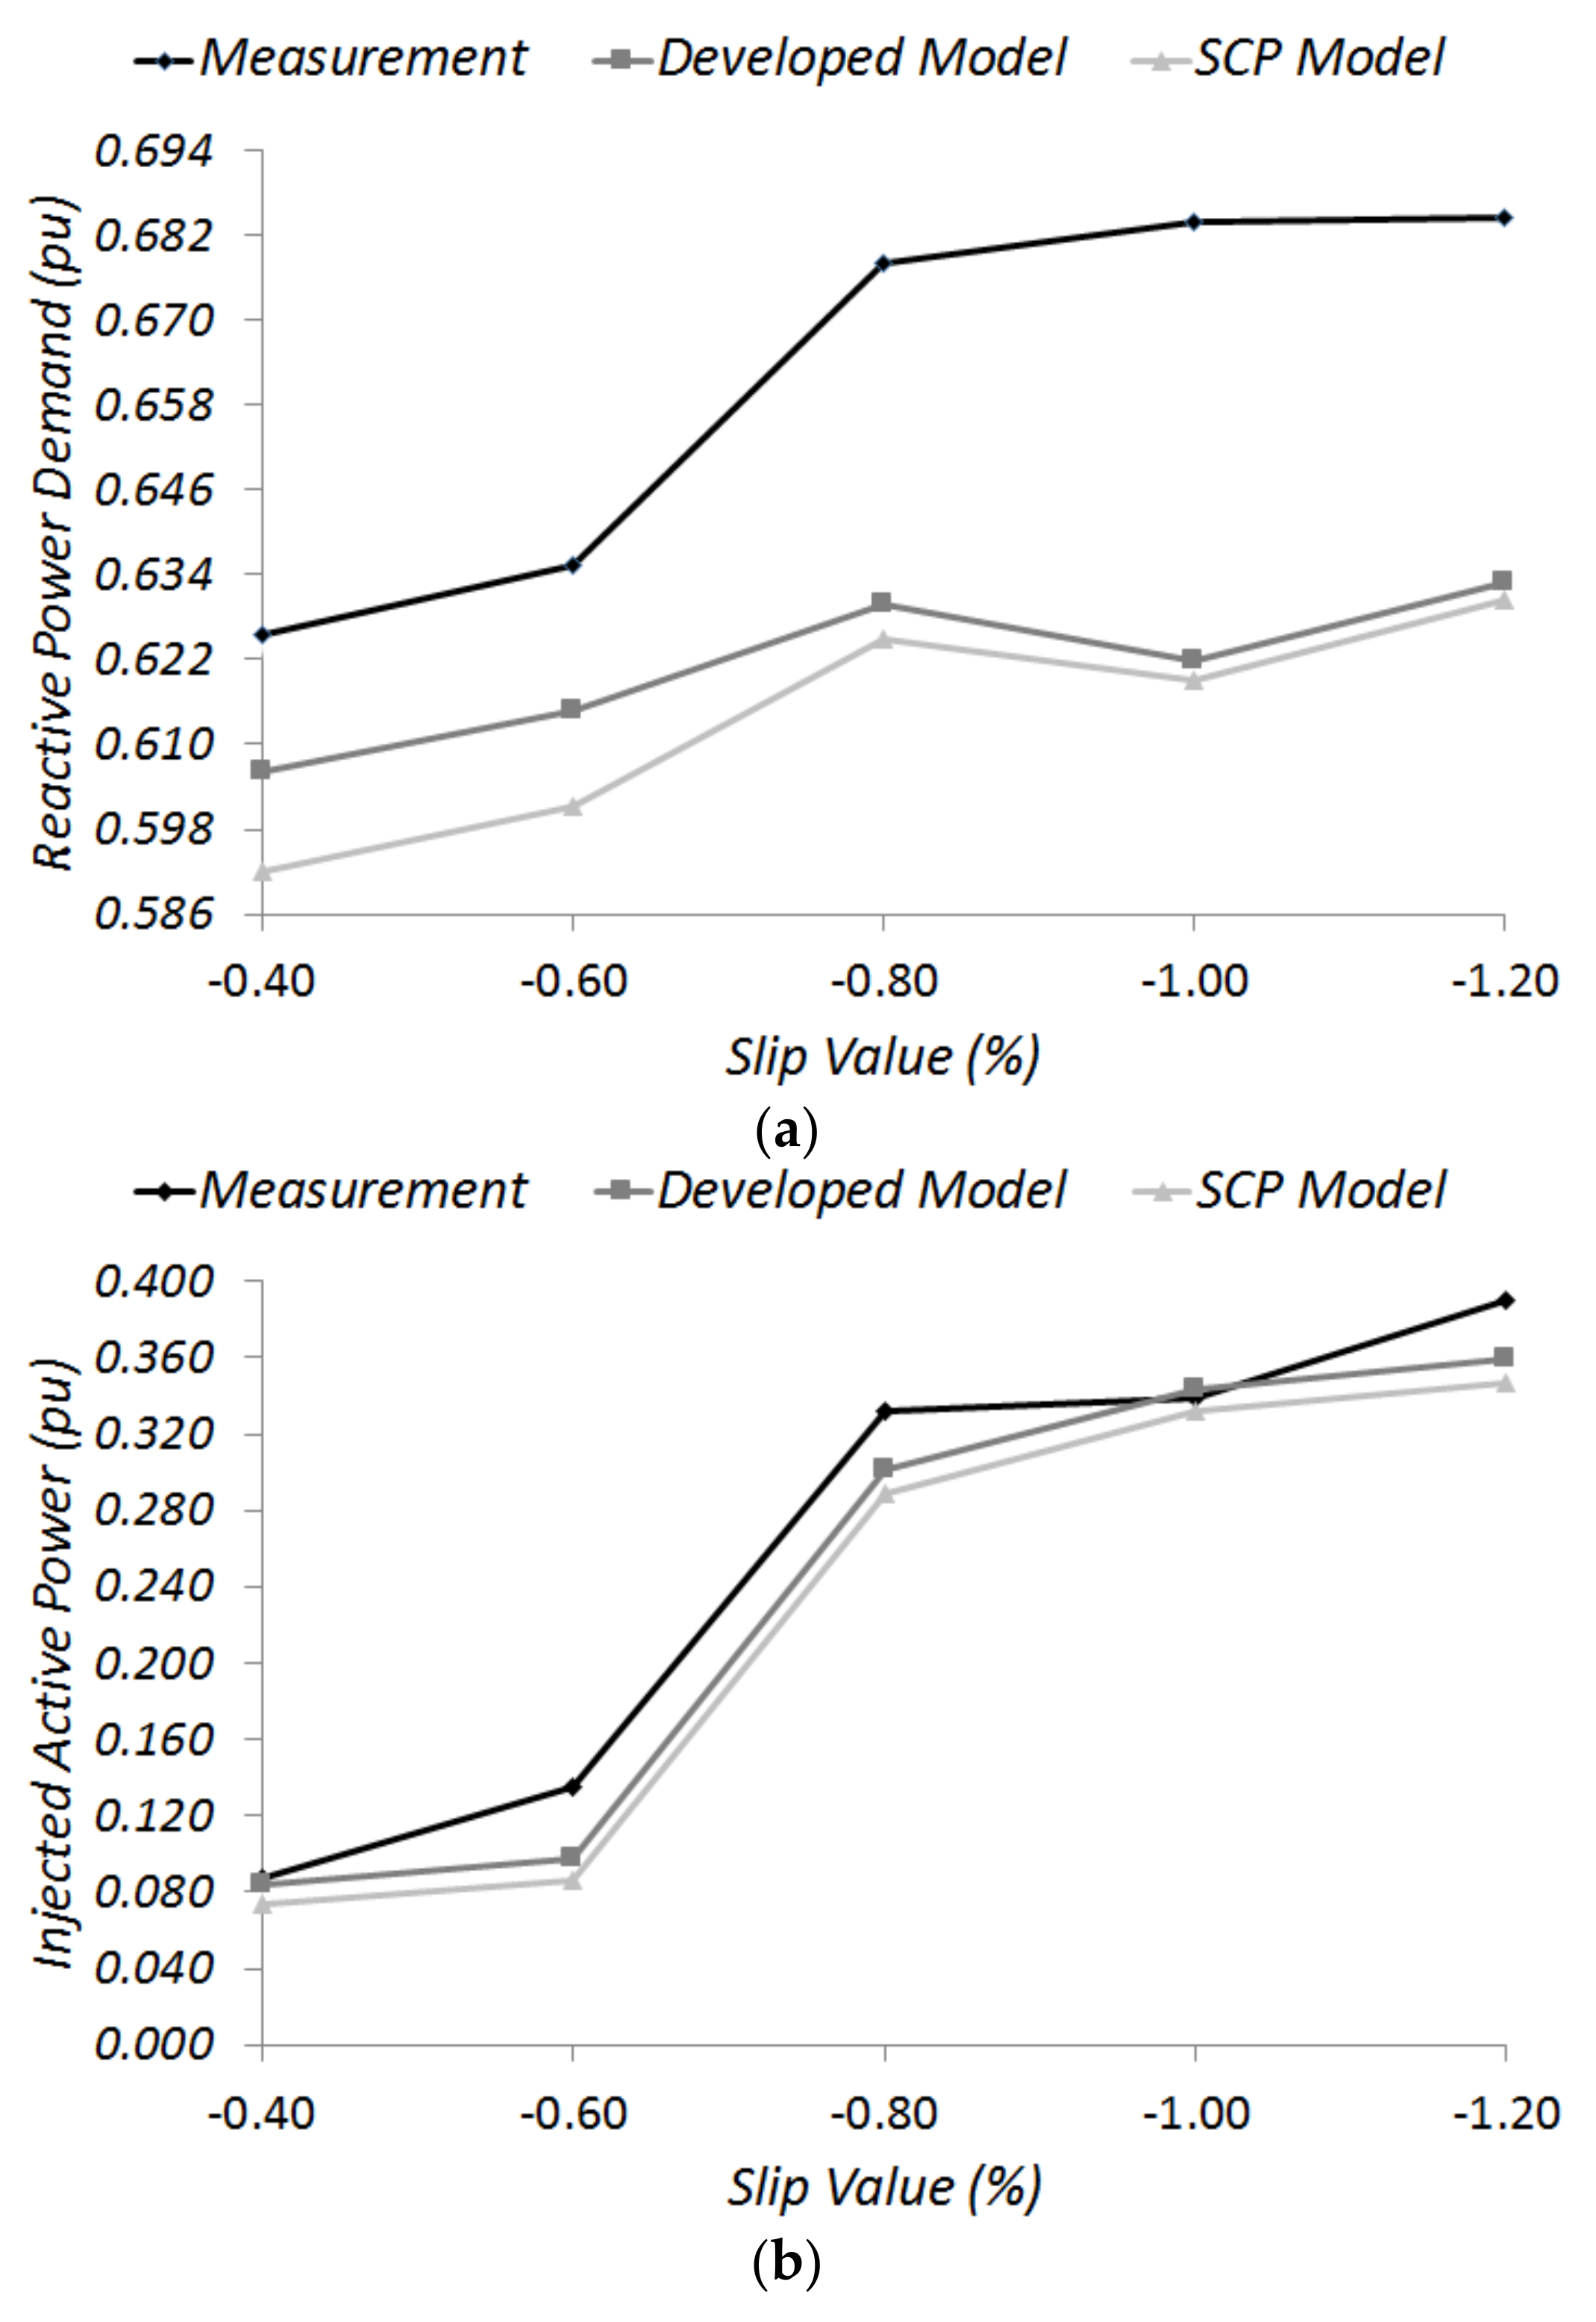
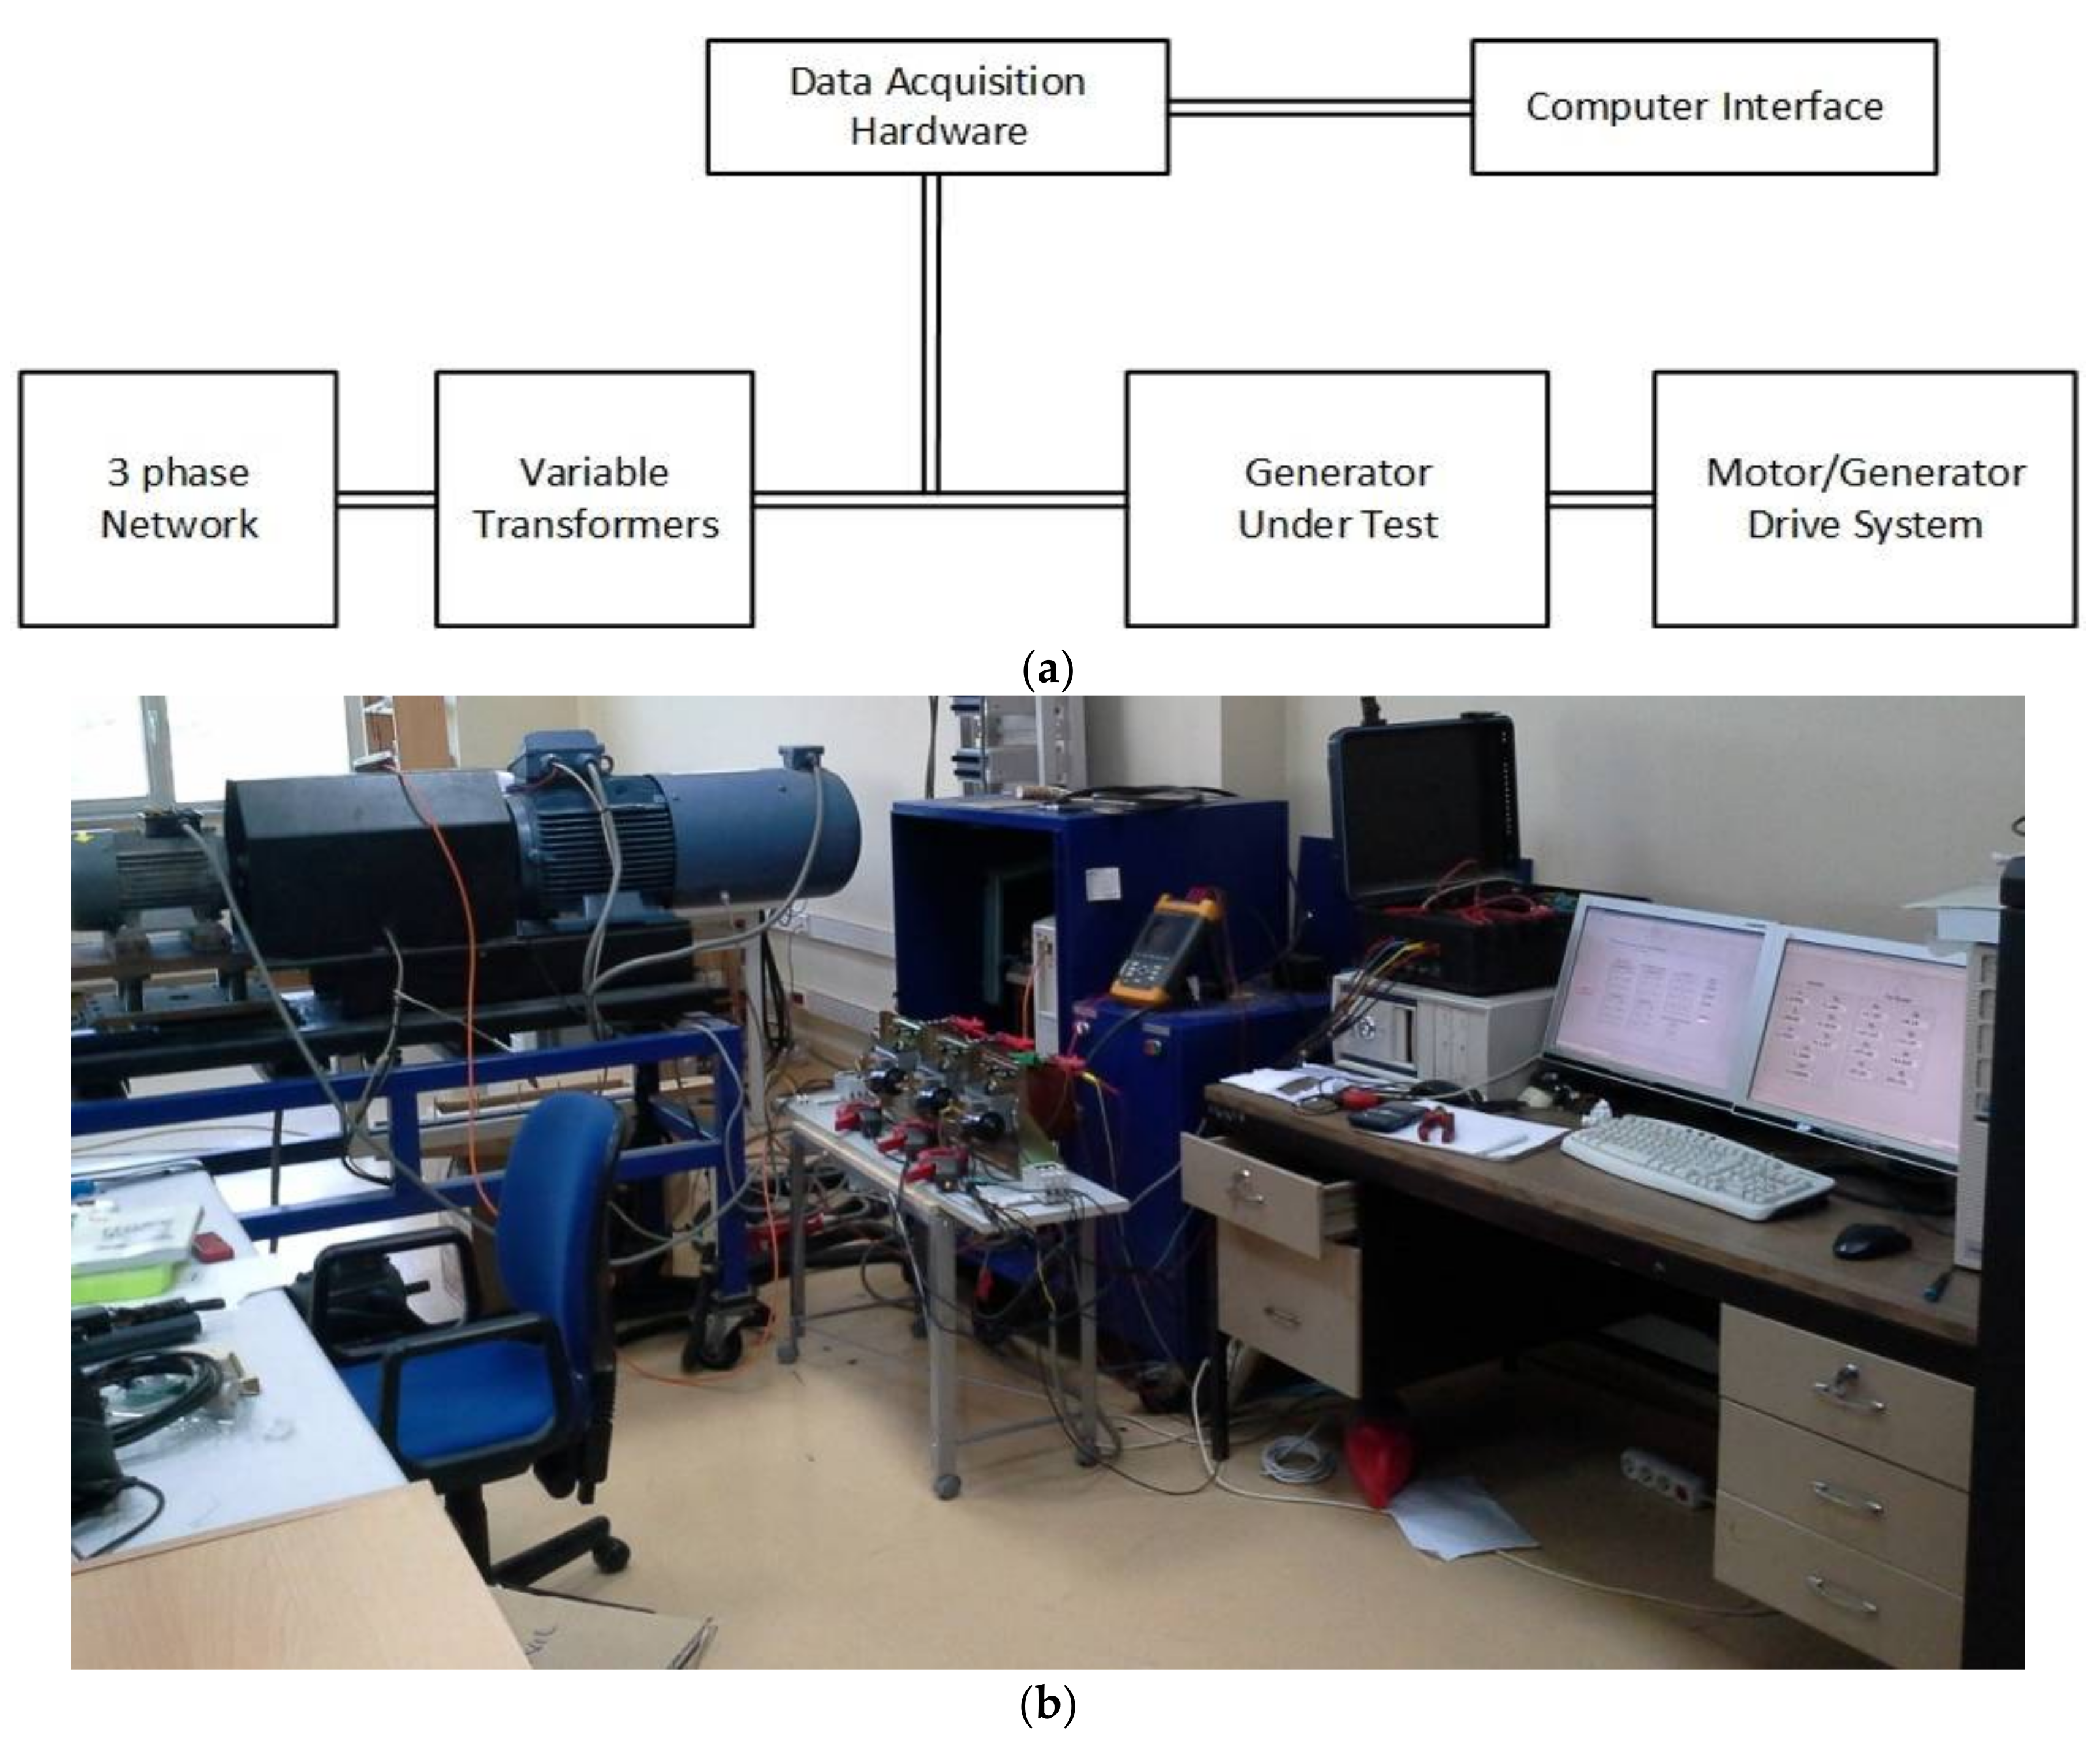
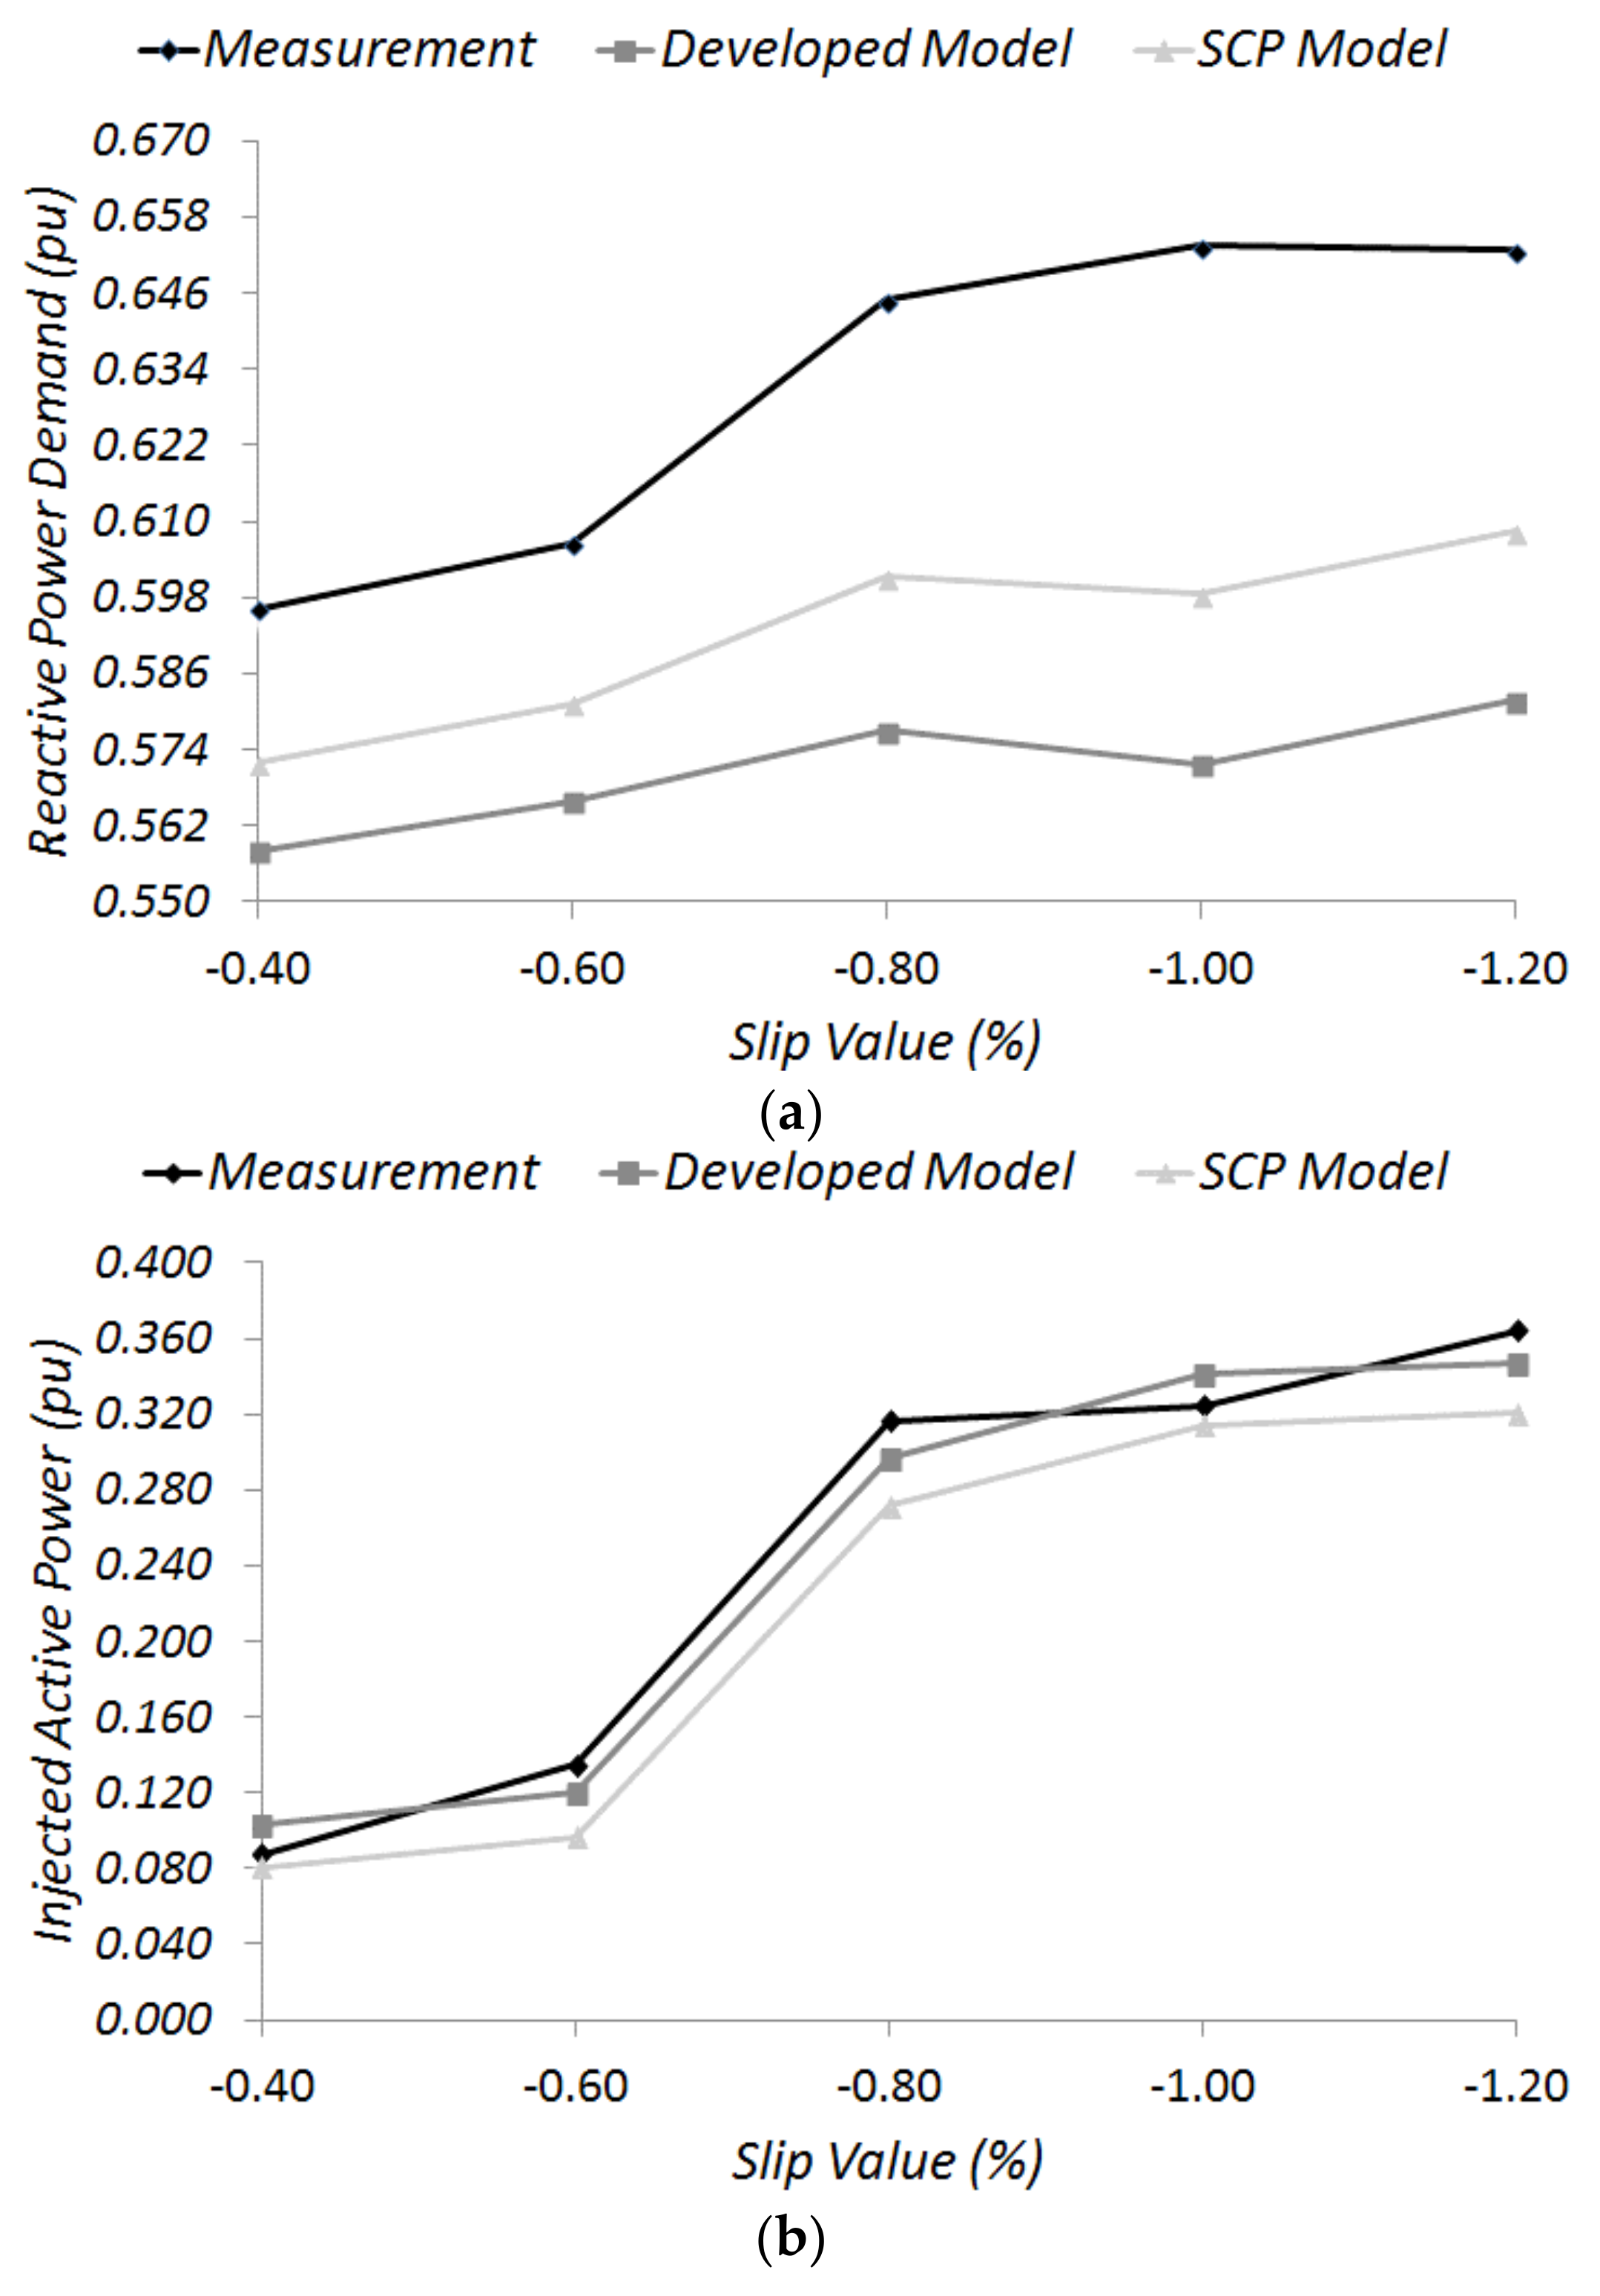
3.1. Validation of Model

To show the validity of the Developed model, its results are comparatively evaluated with the experimental results obtained in a test system. In addition, the results of the SCP model [12] are also provided. The equivalent circuit parameters of the test machine are given in Table A1, and these parameters are obtained by standard no-load and blocked rotor tests. In the system, active and reactive powers of the asynchronous generator are measured under unbalanced voltages. For the same unbalanced voltages, the results of the Developed model and SCP model [12] are calculated, and they are comparatively evaluated by considering the measurement results as reference values.
In the comparative analysis, the voltage unbalance factor (VUF) [24,25] is considered to quantify the unbalance level of the test voltages. The expression of VUF can be written as:
V U F ( % ) = V s n V s p · 100 .
A schematic representation and a photograph of the test system, which are used for validity tests of the model, are taken and provided in Figure 4. In the first part of the validity tests, for the induction generator working with the constant rotor slip value (s = −1.2%) under the VUF values between 0% and 5%, the injected active and demanded reactive powers are plotted in Figure 5. Thus, the Developed model and SCP model [12] are examined in how they responded to VUF changes. In the second part of the tests, the asynchronous generator working with the slip values between −0.4% and −1.2% under the unbalanced terminal voltage with VUF = 5%, the injected active and demanded reactive powers are plotted in Figure 6. The VUF values have been obtained by changing the magnitudes of phase voltages while the phase angle differences remained constant at 120 degrees. In addition to that, the tolerance value (ε) of the machine iterations for validity tests has been determined as 10−9 for both models.
The obtained and calculated reactive power demand results at VUF 0% given in Figure 5a are 0.720 pu, 0.665 pu and 0.655 pu, respectively, for Measurement, the Developed Model and the SCP Model [12]. In the same figure, reactive power demand results at VUF 5% are 0.653 pu, 0.582 pu and 0.608 pu, respectively, for Measurement, the Developed Model and the SCP Model [12]. Similarly, injected active power results at VUF 0% seen in Figure 5b are 0.405 pu, 0.366 pu and 0.358 pu, respectively, for Measurement, the Developed Model and the SCP Model [12]. In the same figure, injected active power results at VUF 5% are 0.364 pu, 0.347 pu and 0.320 pu, respectively, for Measurement, the Developed Model and the SCP Model [12]. In light of this information, as a result of neglecting Rm and Xm values which are not readily available and difficult to determine, for simplification in the negative sequence equivalent circuit, at higher VUF values, the reactive power demand results obtained by the Developed Model are moving away from the trend of the measured values. For higher VUF values, a similar situation is also observed in the results obtained by the SCP model [12].
The obtained and calculated reactive power demand results at −0.4% slip value given in Figure 6a are 0.596 pu, 0.557 pu and 0.571 pu, respectively, for Measurement, the Developed Model and the SCP Model [12]. In the same figure, reactive power demand results at −1.20% slip value are 0.653 pu, 0.582 pu and 0.608 pu, respectively, for Measurement, the Developed Model and the SCP Model [12]. Similarly, injected active power results at −0.40% slip value seen in Figure 6b are 0.087 pu, 0.103 pu and 0.080 pu, respectively, for Measurement, the Developed Model and the SCP Model [12]. In the same figure, injected active power results at −1.20% slip value are 0.364 pu, 0.347 pu and 0.320 pu, respectively, for Measurement, the Developed Model and the SCP Model [12]. Despite the change in rotor slip value, the injected active power and reactive power demand given in Figure 6a,b show that the Developed model and the SCP model give close results, and these results have the same trend as the measured ones.
Actually, at BS EN 50160 [26], it is recommended that the value of the VUF is less than 2% in the distribution systems. For this reason, in order to evaluate the Developed model better, the test results of the asynchronous generator working with the slip values between −0.4% and −1.2% under the unbalanced terminal voltage with VUF = 2% are also given in Figure 7.
The obtained and calculated reactive power demand results at −0.4% slip value given in Figure 7a are 0.625 pu, 0.606 pu and 0.592 pu, respectively, for Measurement, the Developed Model and the SCP Model [12]. In the same figure, reactive power demand results at −1.20% slip value are 0.684 pu, 0.632 pu and 0.630 pu, respectively, for Measurement, the Developed Model and the SCP Model [12]. Similarly, injected active power results at −0.4% slip value seen in Figure 7b are 0.087 pu, 0.083 pu and 0.073 pu, respectively, for Measurement, the Developed Model and the SCP Model [12]. In the same figure, injected active power results at −1.20% slip value are 0.390 pu, 0.359 pu and 0.346 pu respectively for Measurement, the Developed Model and the SCP Model [12]. It is seen in Figure 7 that the results obtained by the Developed model are in close agreement with the SCP model [12] and show the same trends and similar trends as the measured ones.

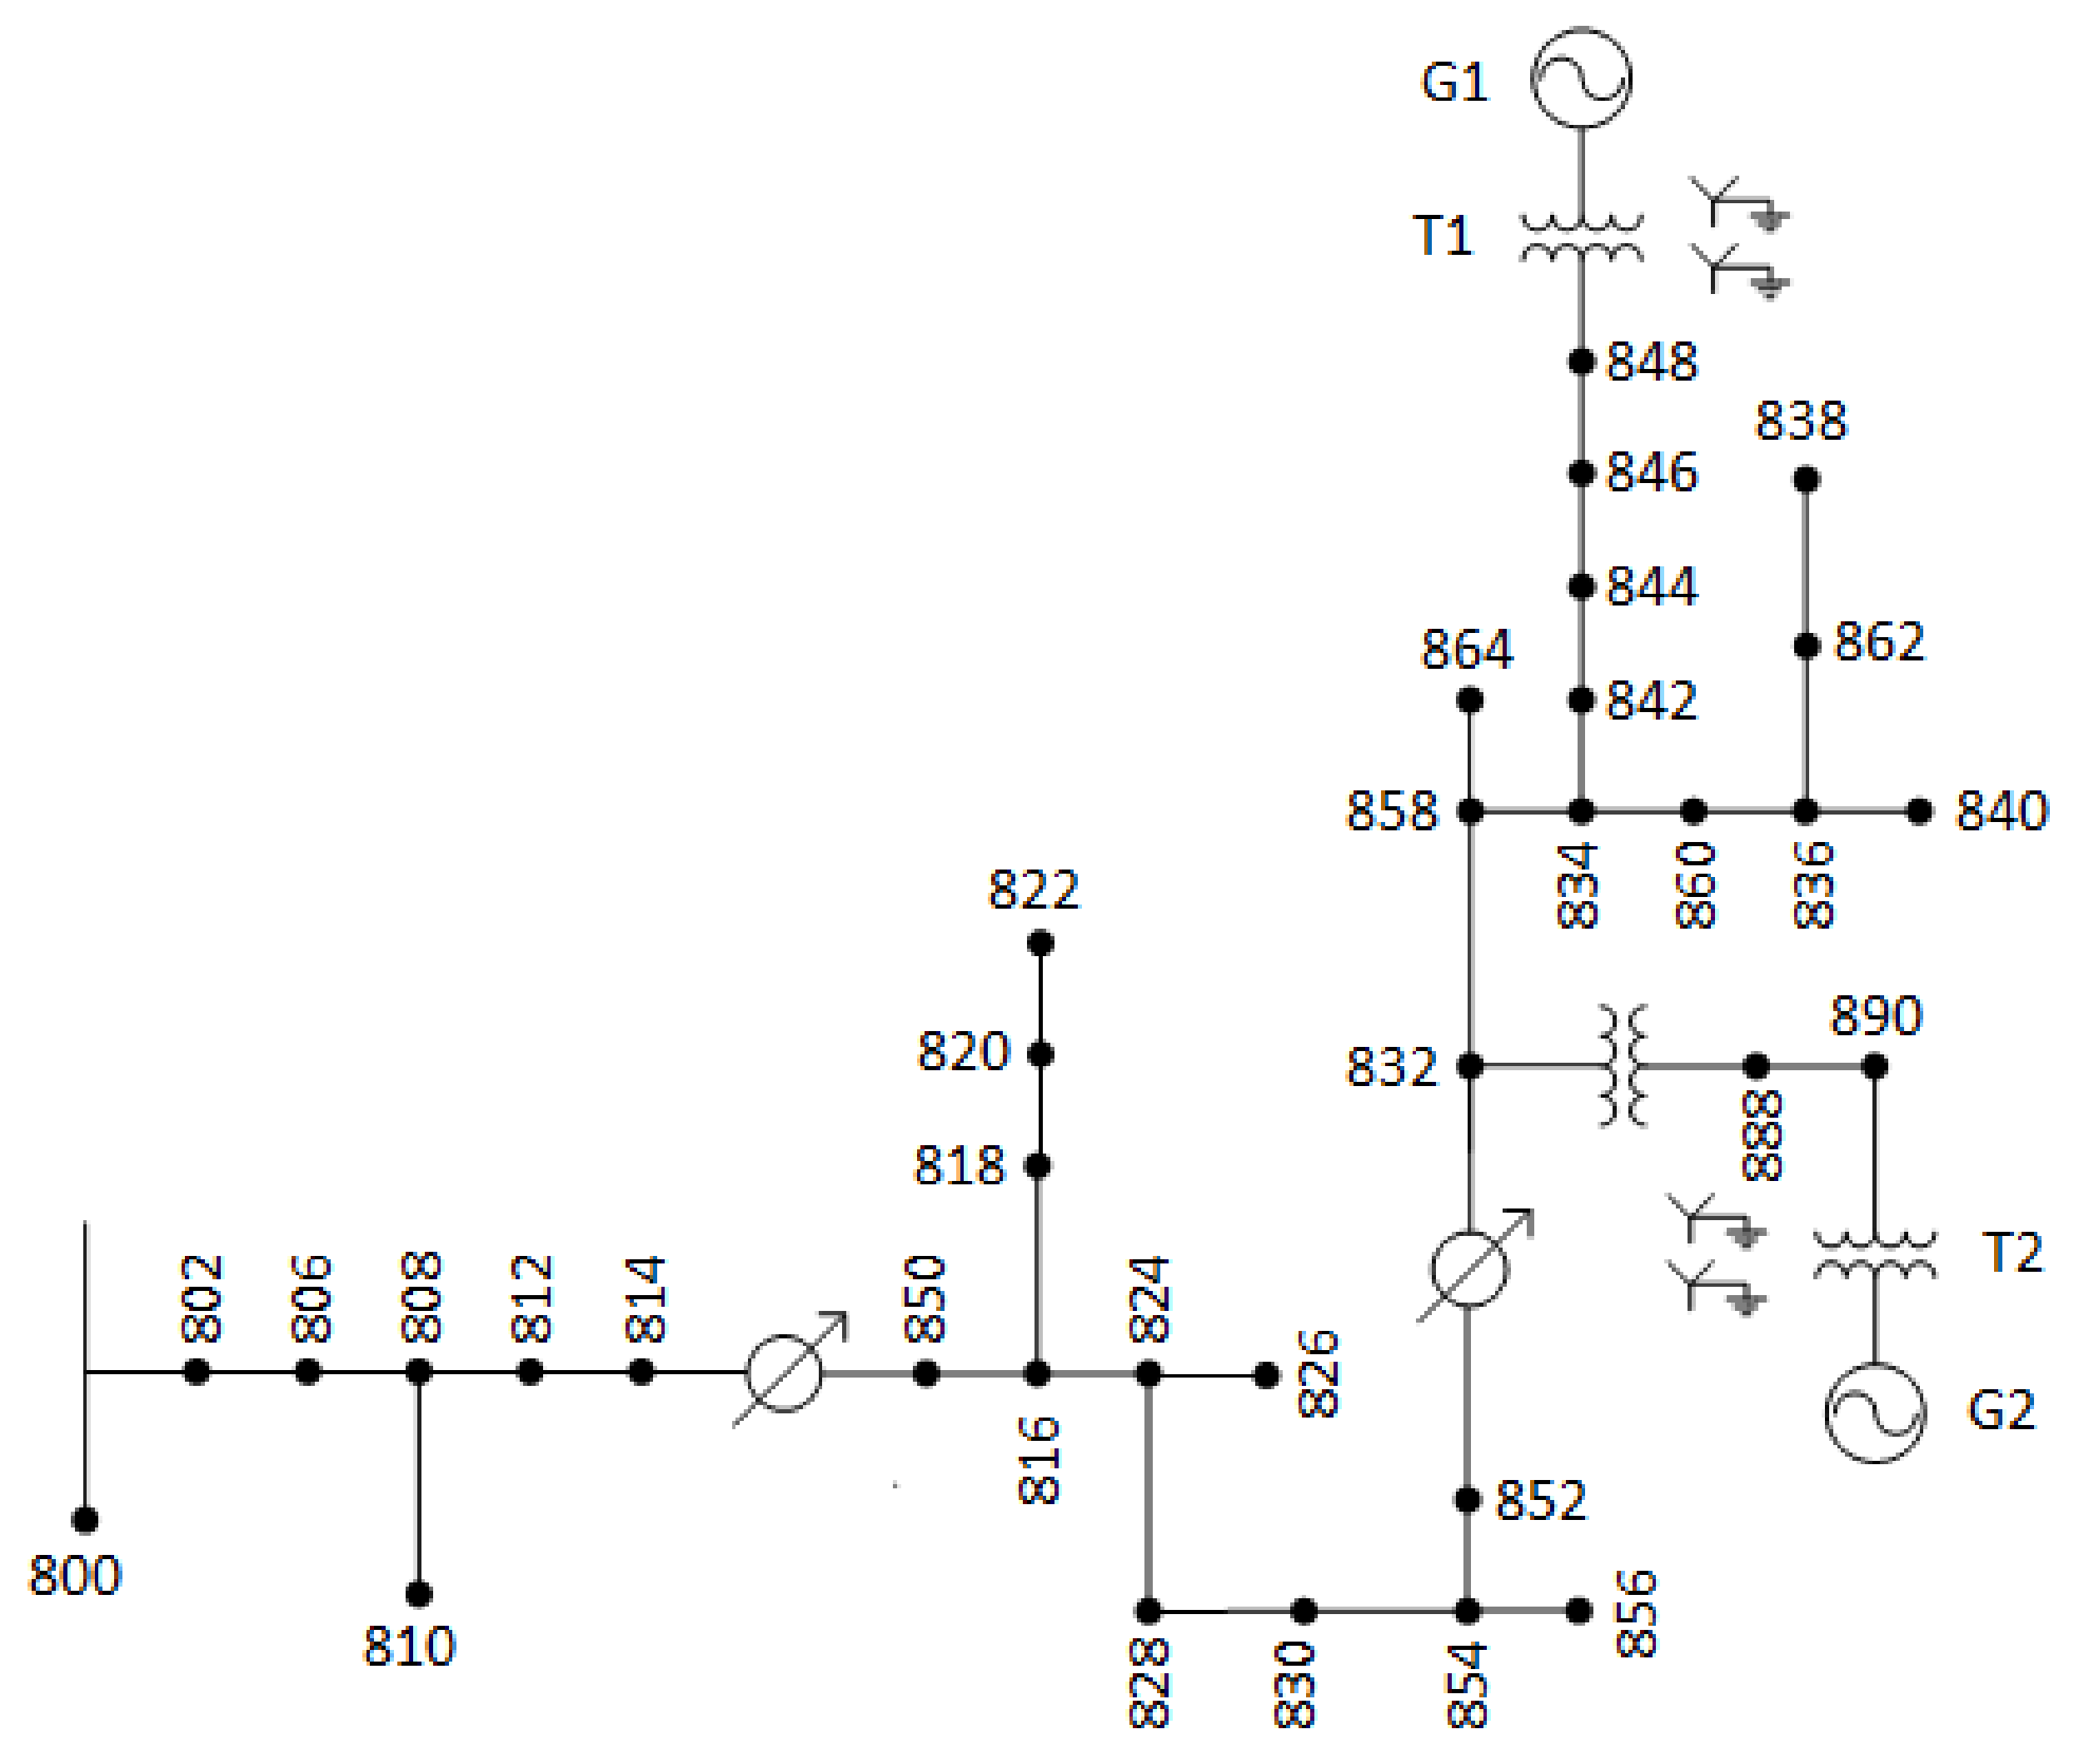
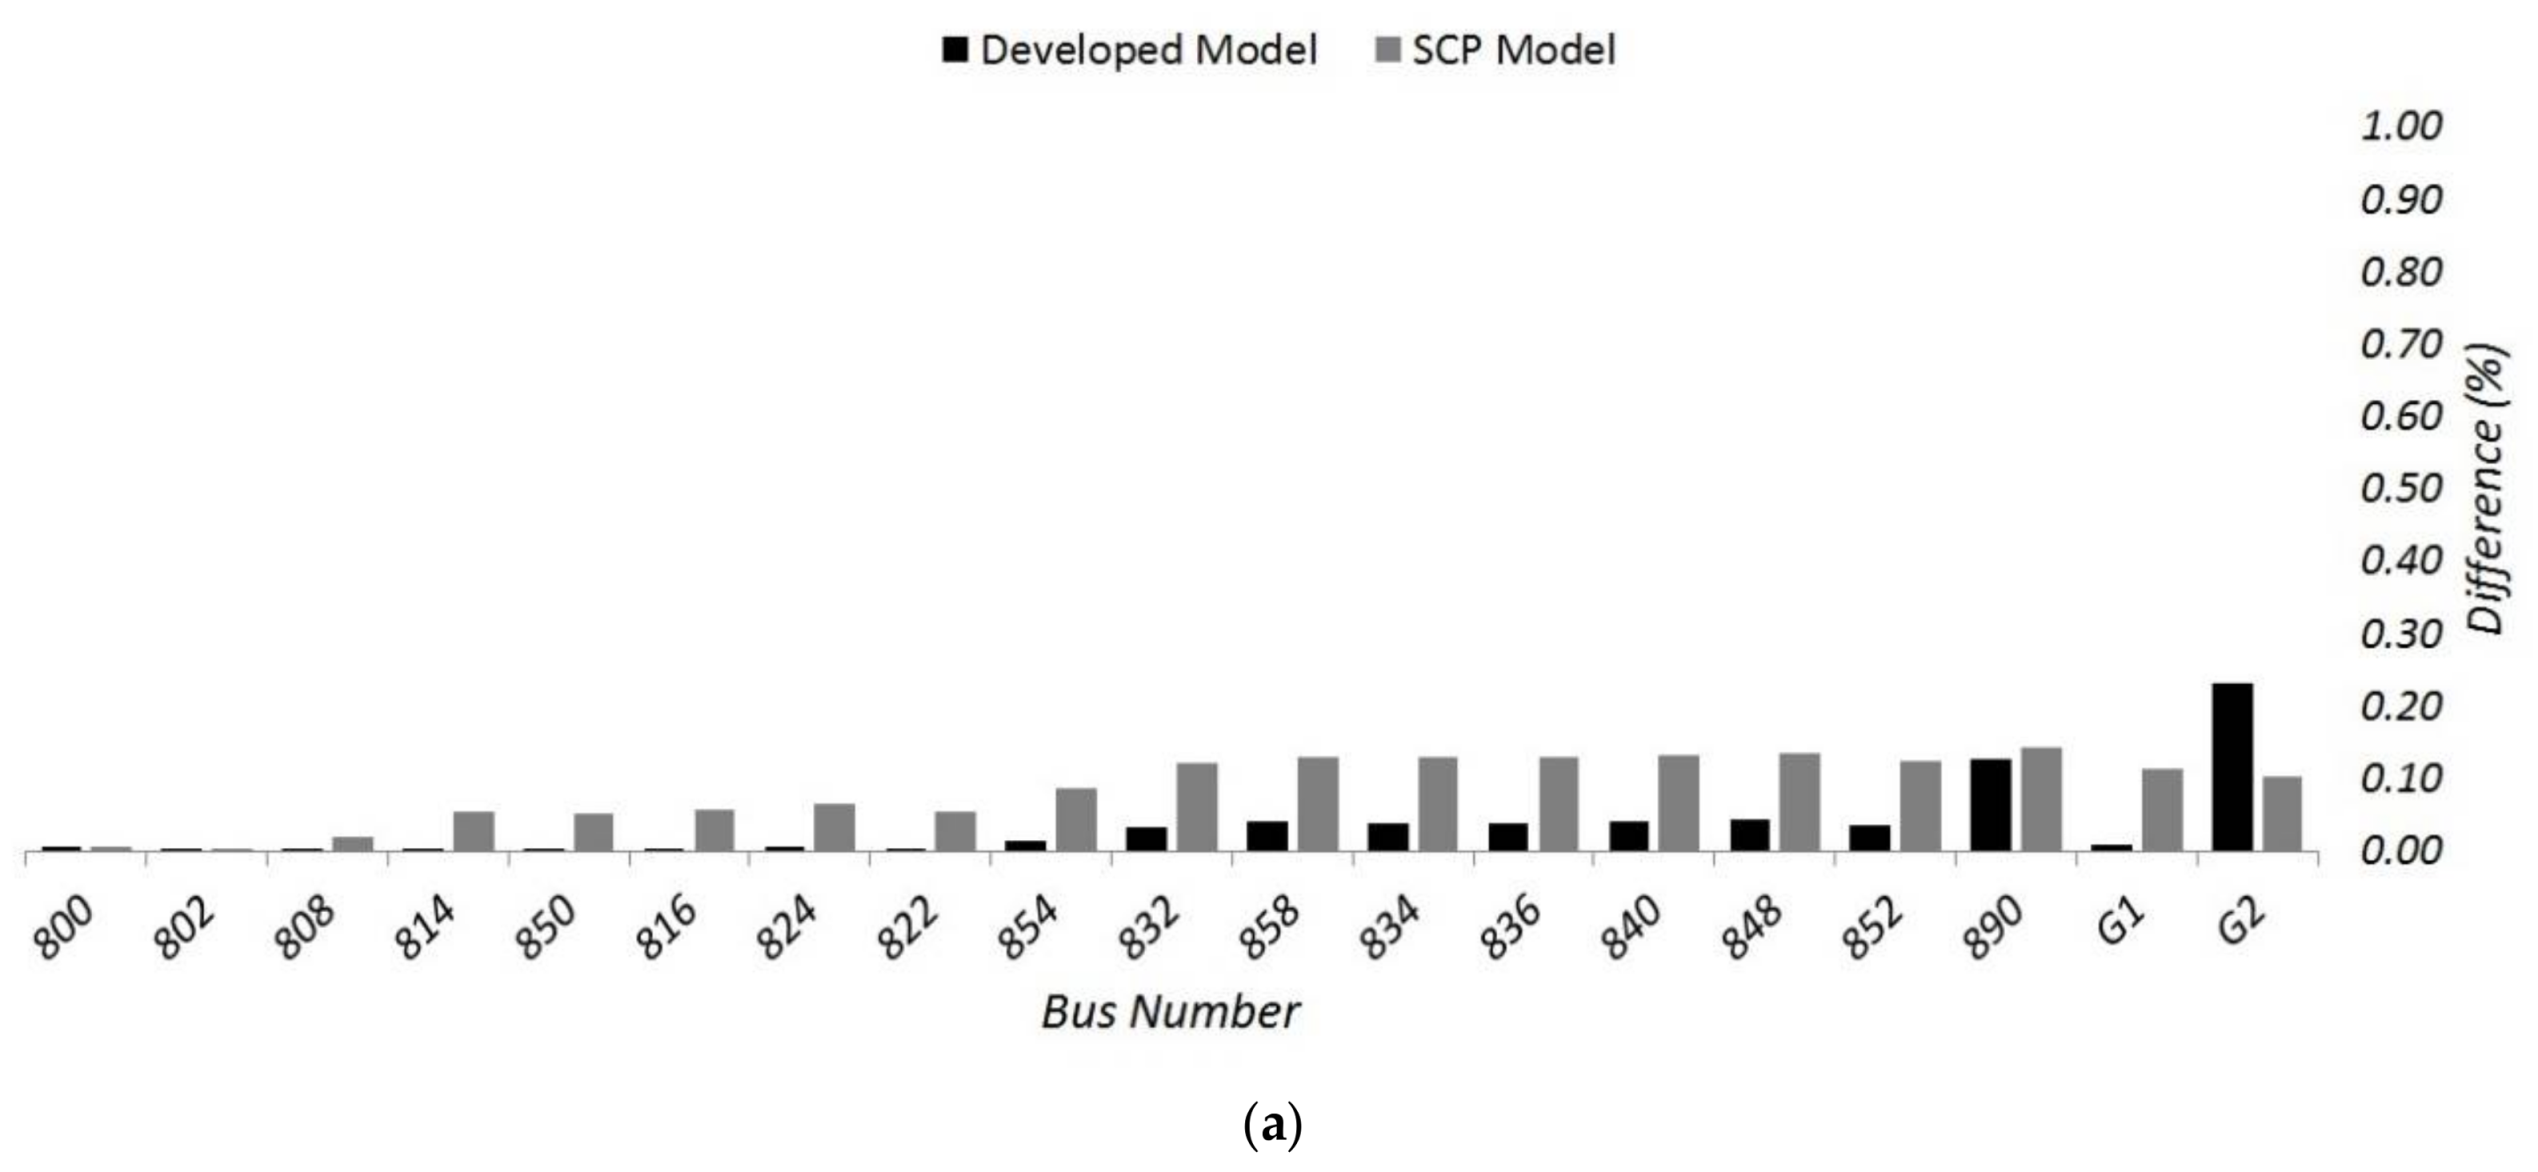
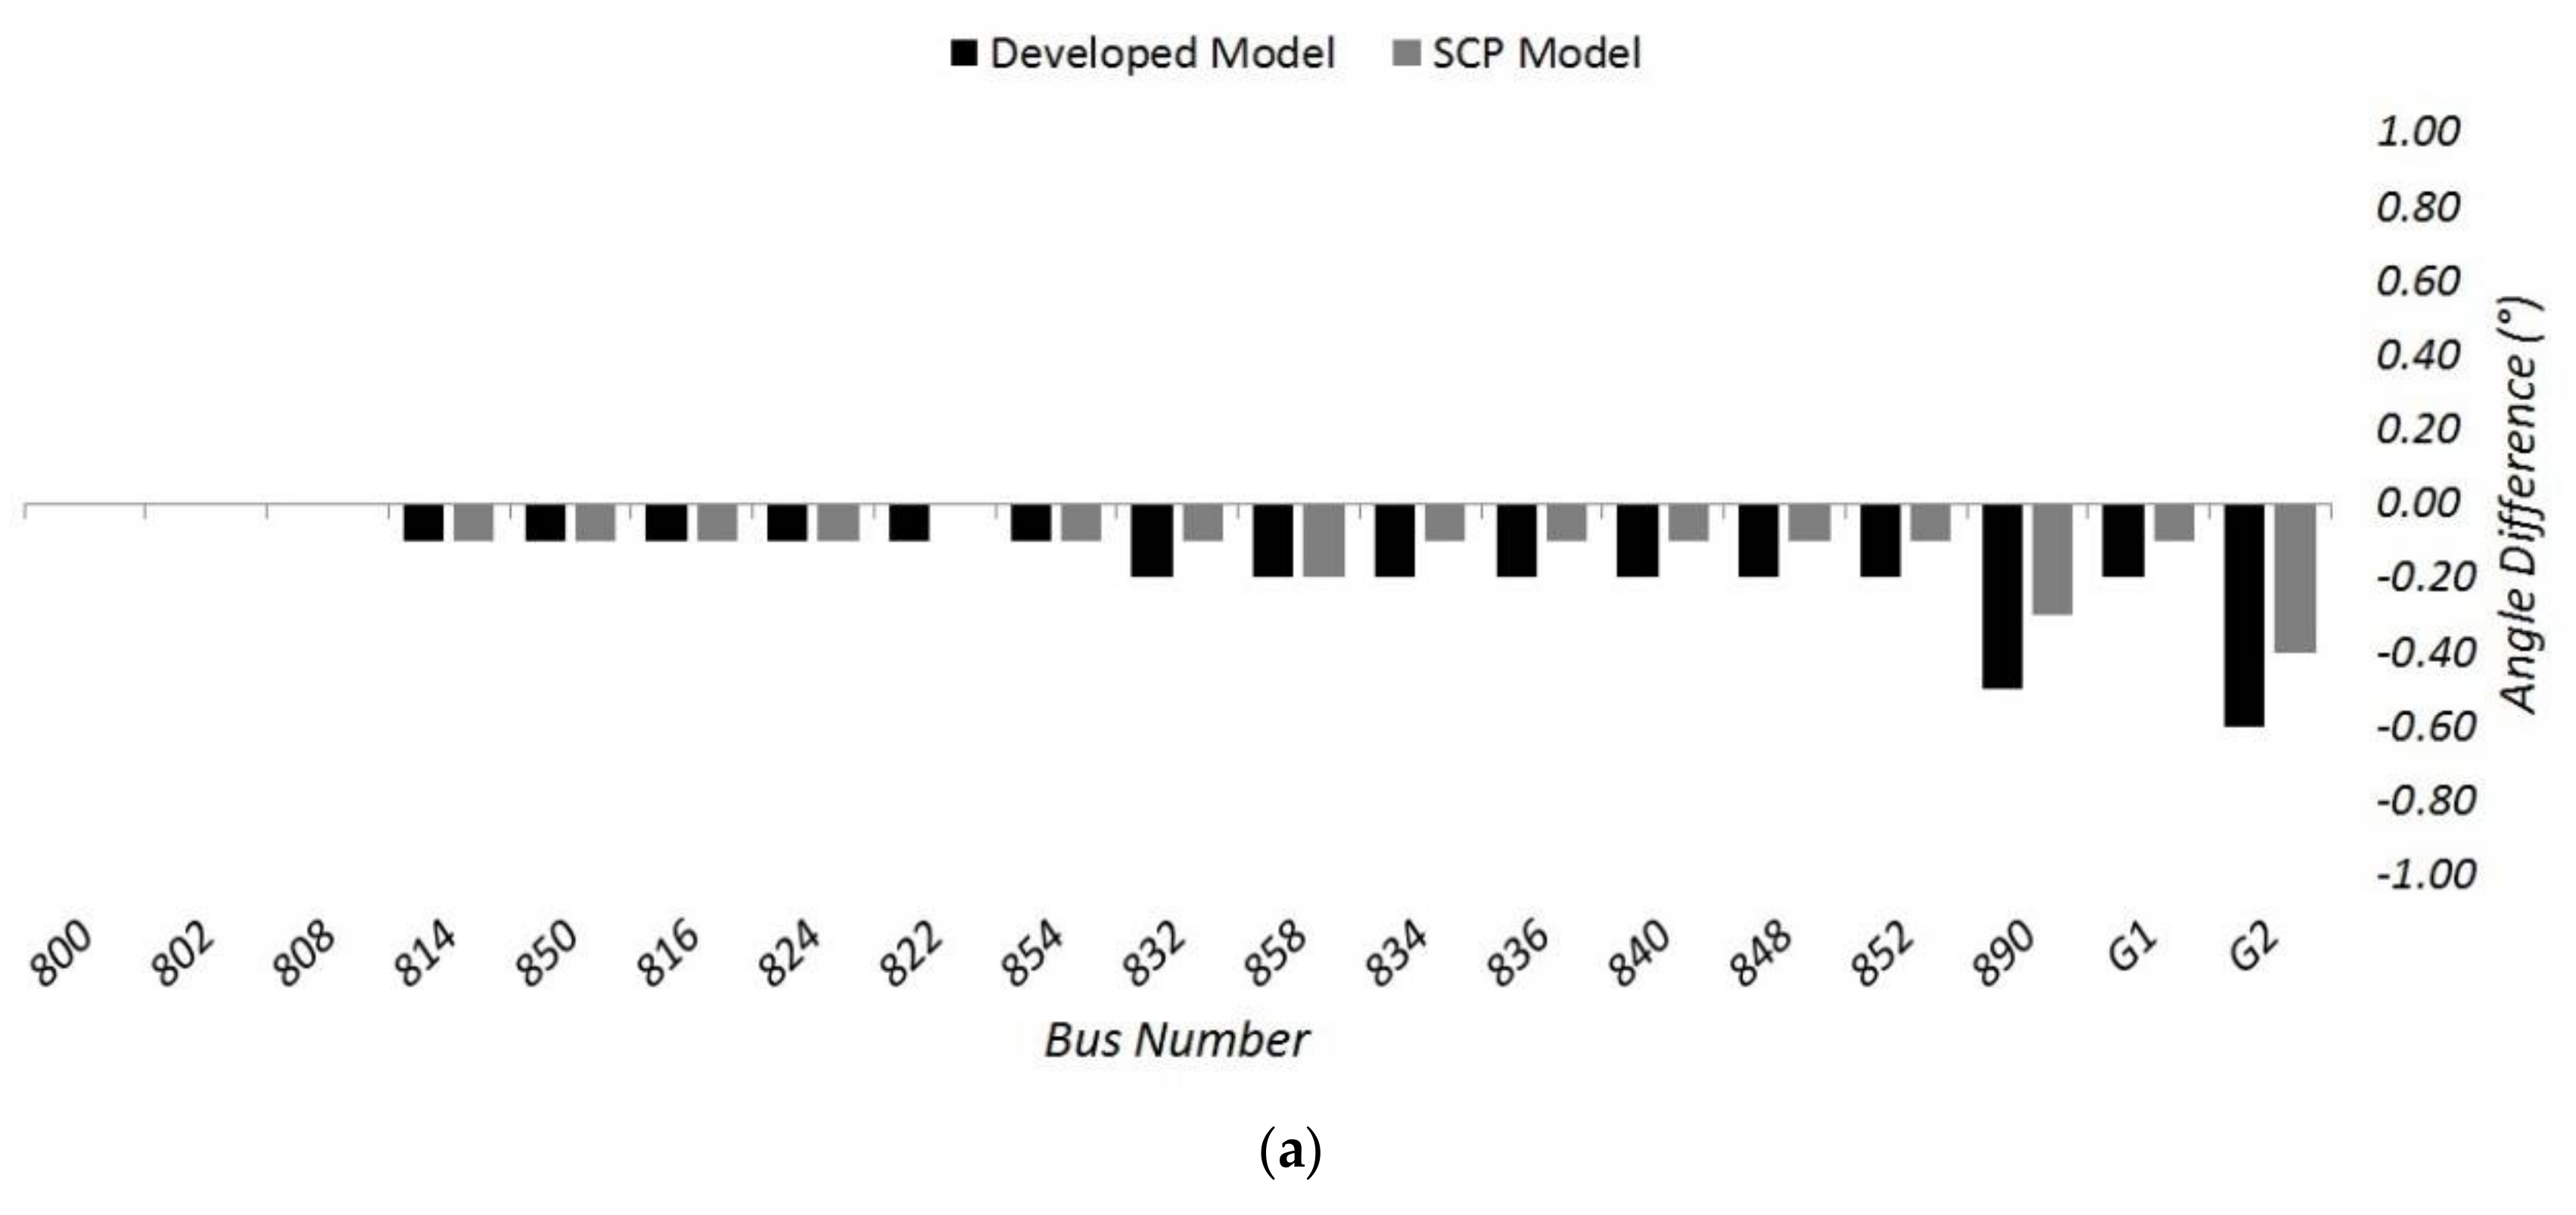
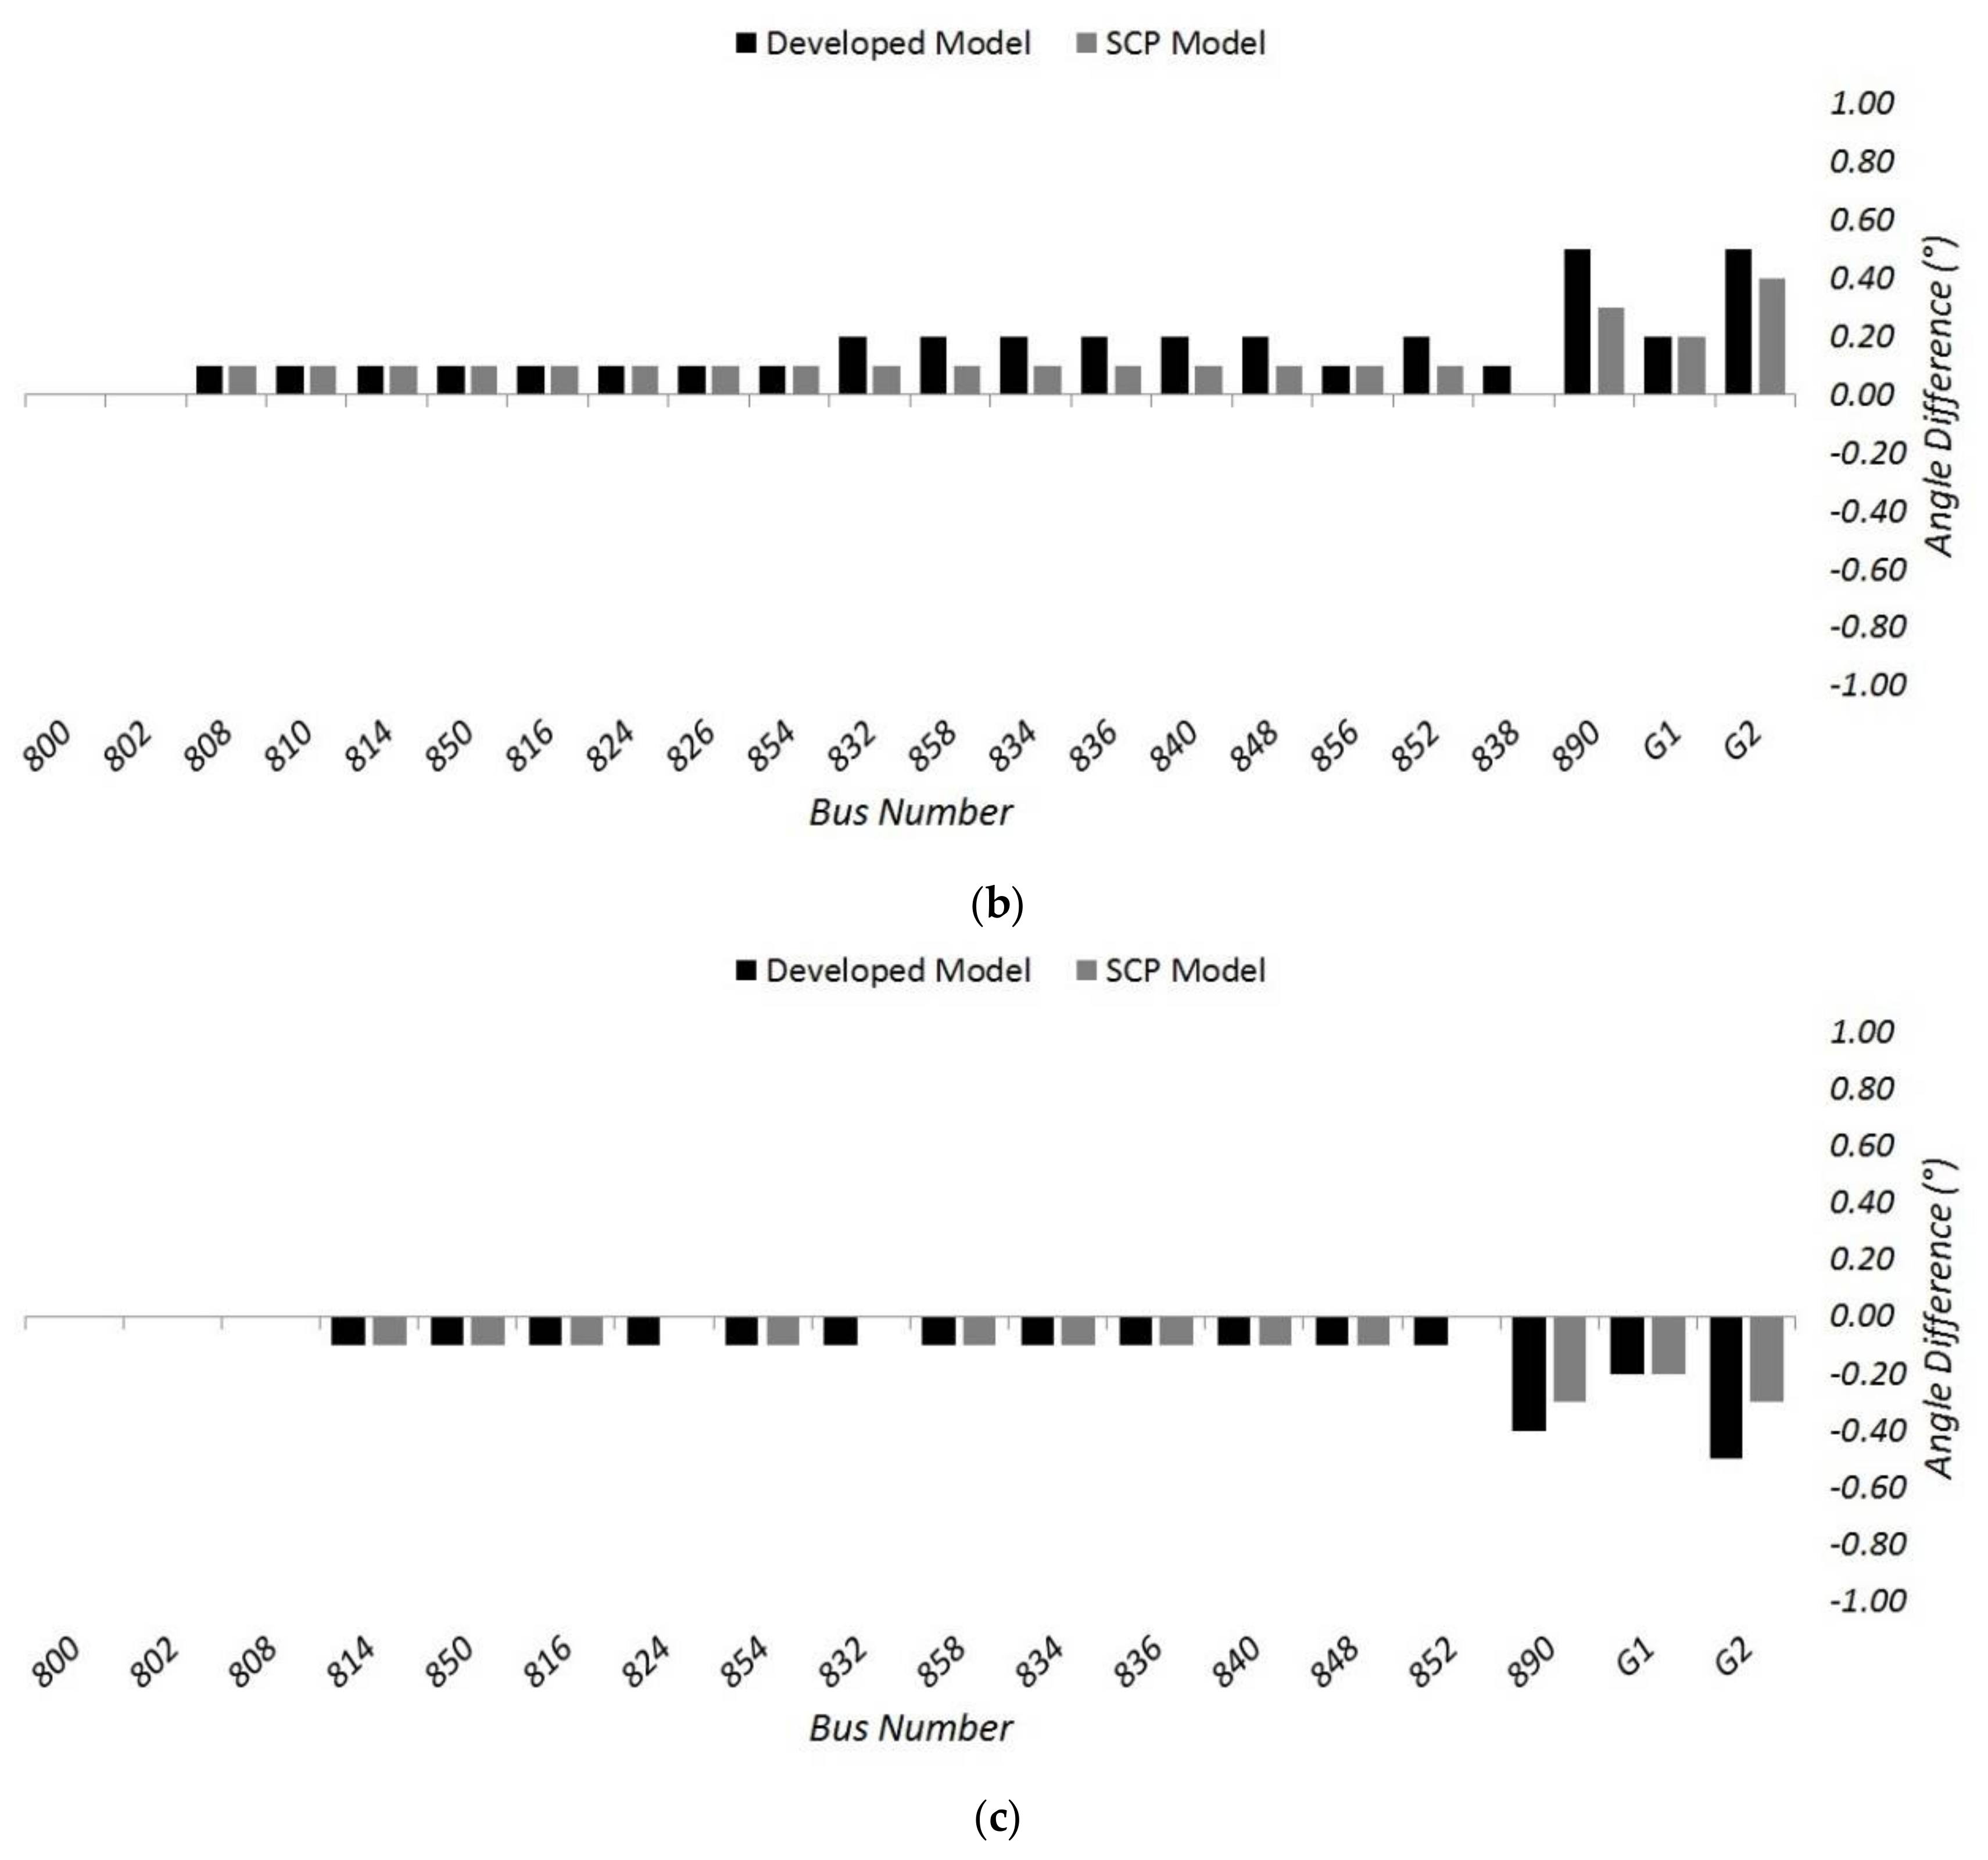
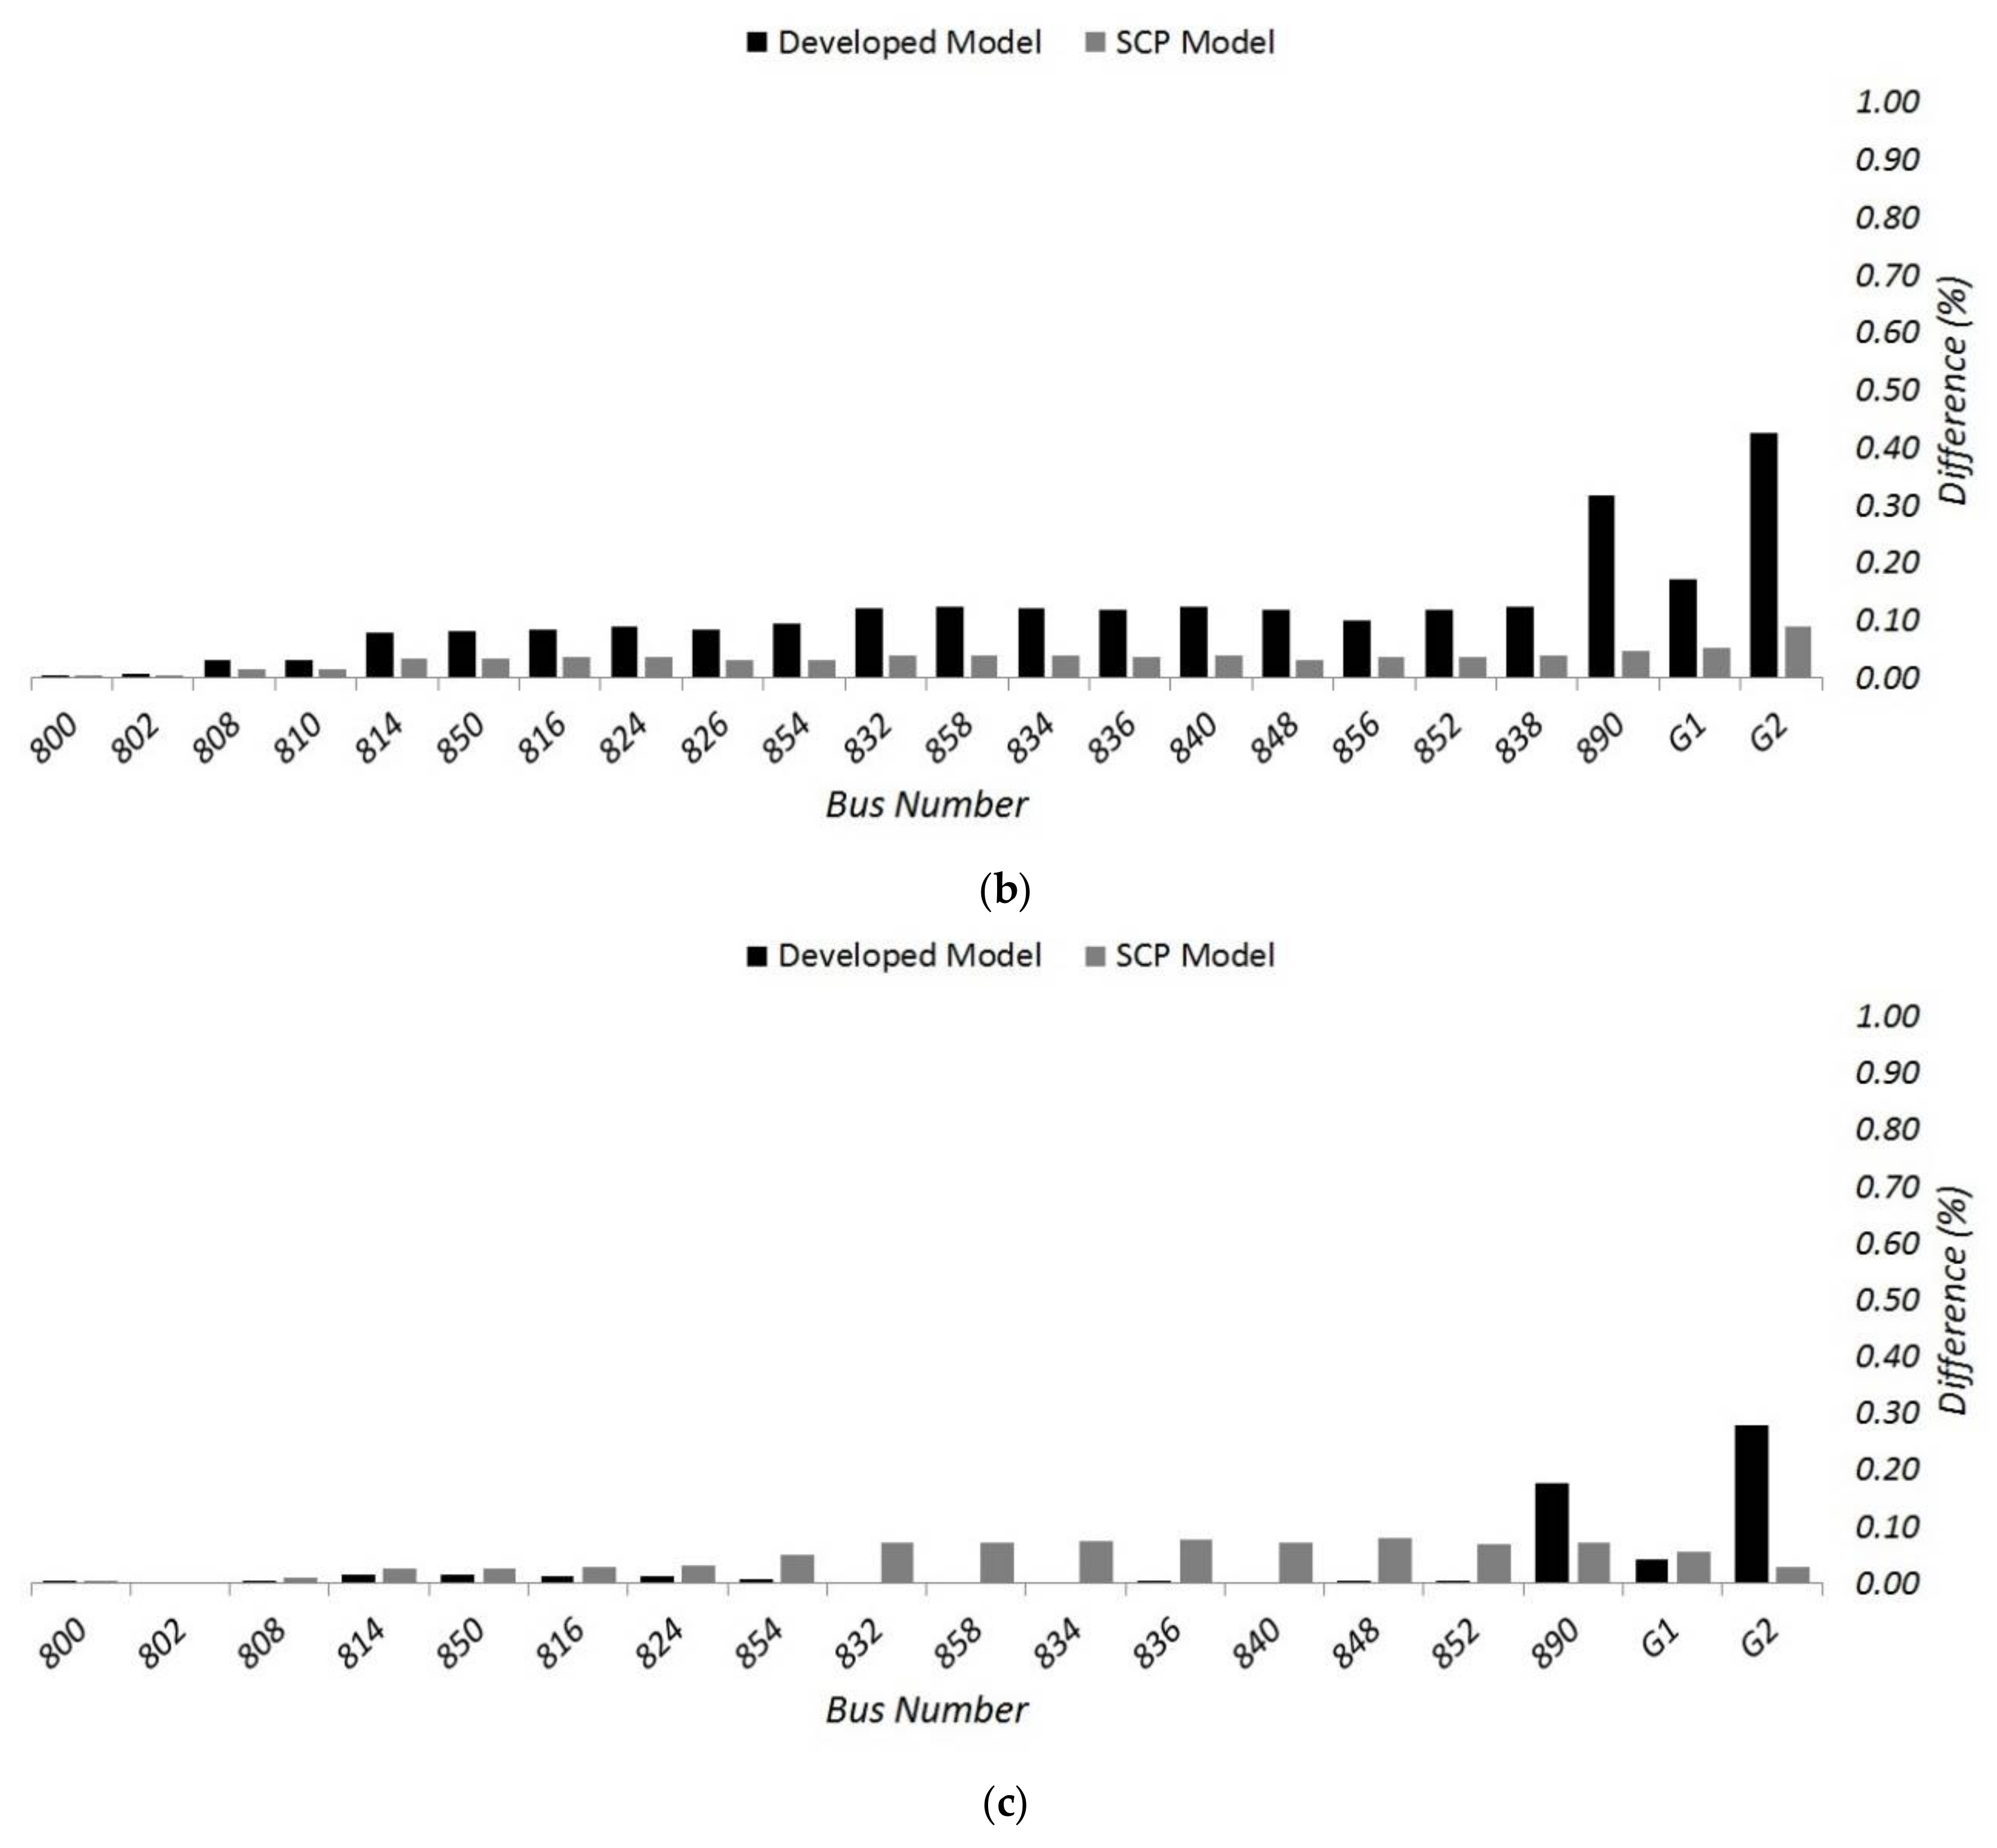
3.2. Load Flow Analysis Results for the IEEE 34 Bus Test System

In this section, it is aimed to comparatively evaluate the results of the load flow analysis achieved with the Developed model and SCP model [12] for the IEEE 34 bus radial distribution test system, prepared by IEEE [20] and modified by Dugan et al. [27]. The modification of the test system was carried out by adding two generators with two service transformers to its two buses in Dugan et al. [27].
The single-line diagram of this test system is given in Figure 8. Here, it should be noted that the bus 800 refers to the main feeder in Figure 8. The wind turbines are placed at the buses 848 and 890 with the proper service transformers, and their parameters are given in Table A2. Wind turbines with induction generators have been planned as having 660 kW rated output power, and all of their parameters are included in Table A3.
For the test system detailed above, load flow analysis is performed using two models and thus phase voltages of each buses are obtained to compare with the phase voltages provided by Dugan et al. [27]. The tolerance value (ε) of the machine iterations at each sweep in power flow analyses has been determined as 10−9 for both models. In addition, the tolerance value (ε) for the power flow analyses has been determined as 10−4.
The percentage difference of the phase voltages and angle differences for the each buses are given in Figure 9 and Figure 10 respectively. In Figure 9, the overall differences of bus voltage do not exceed 0.23%, 0.43% and 0.28%, respectively, for phases A, B and C. Additionally, in Figure 10, the overall differences of bus voltage angle values do not exceed −0.6°, 0.5° and −0.5°, respectively, for phases A, B and C.
The highest magnitude difference values of Developed Model and SCP Model [12] for phase A is 0.23% and 0.14%, for phase B is 0.43% and 0.09%, and for phase C is 0.28% and 0.08%. In addition, the highest angle difference values of the Developed Model and the SCP Model [12] for phase A is −0.6° and −0.4°, for phase B is 0.5° and 0.4°, and for phase C is −0.3° and −0.5°. It is seen from Figure 9 and Figure 10 that the Developed model is in close agreement with the SCP Model [12].

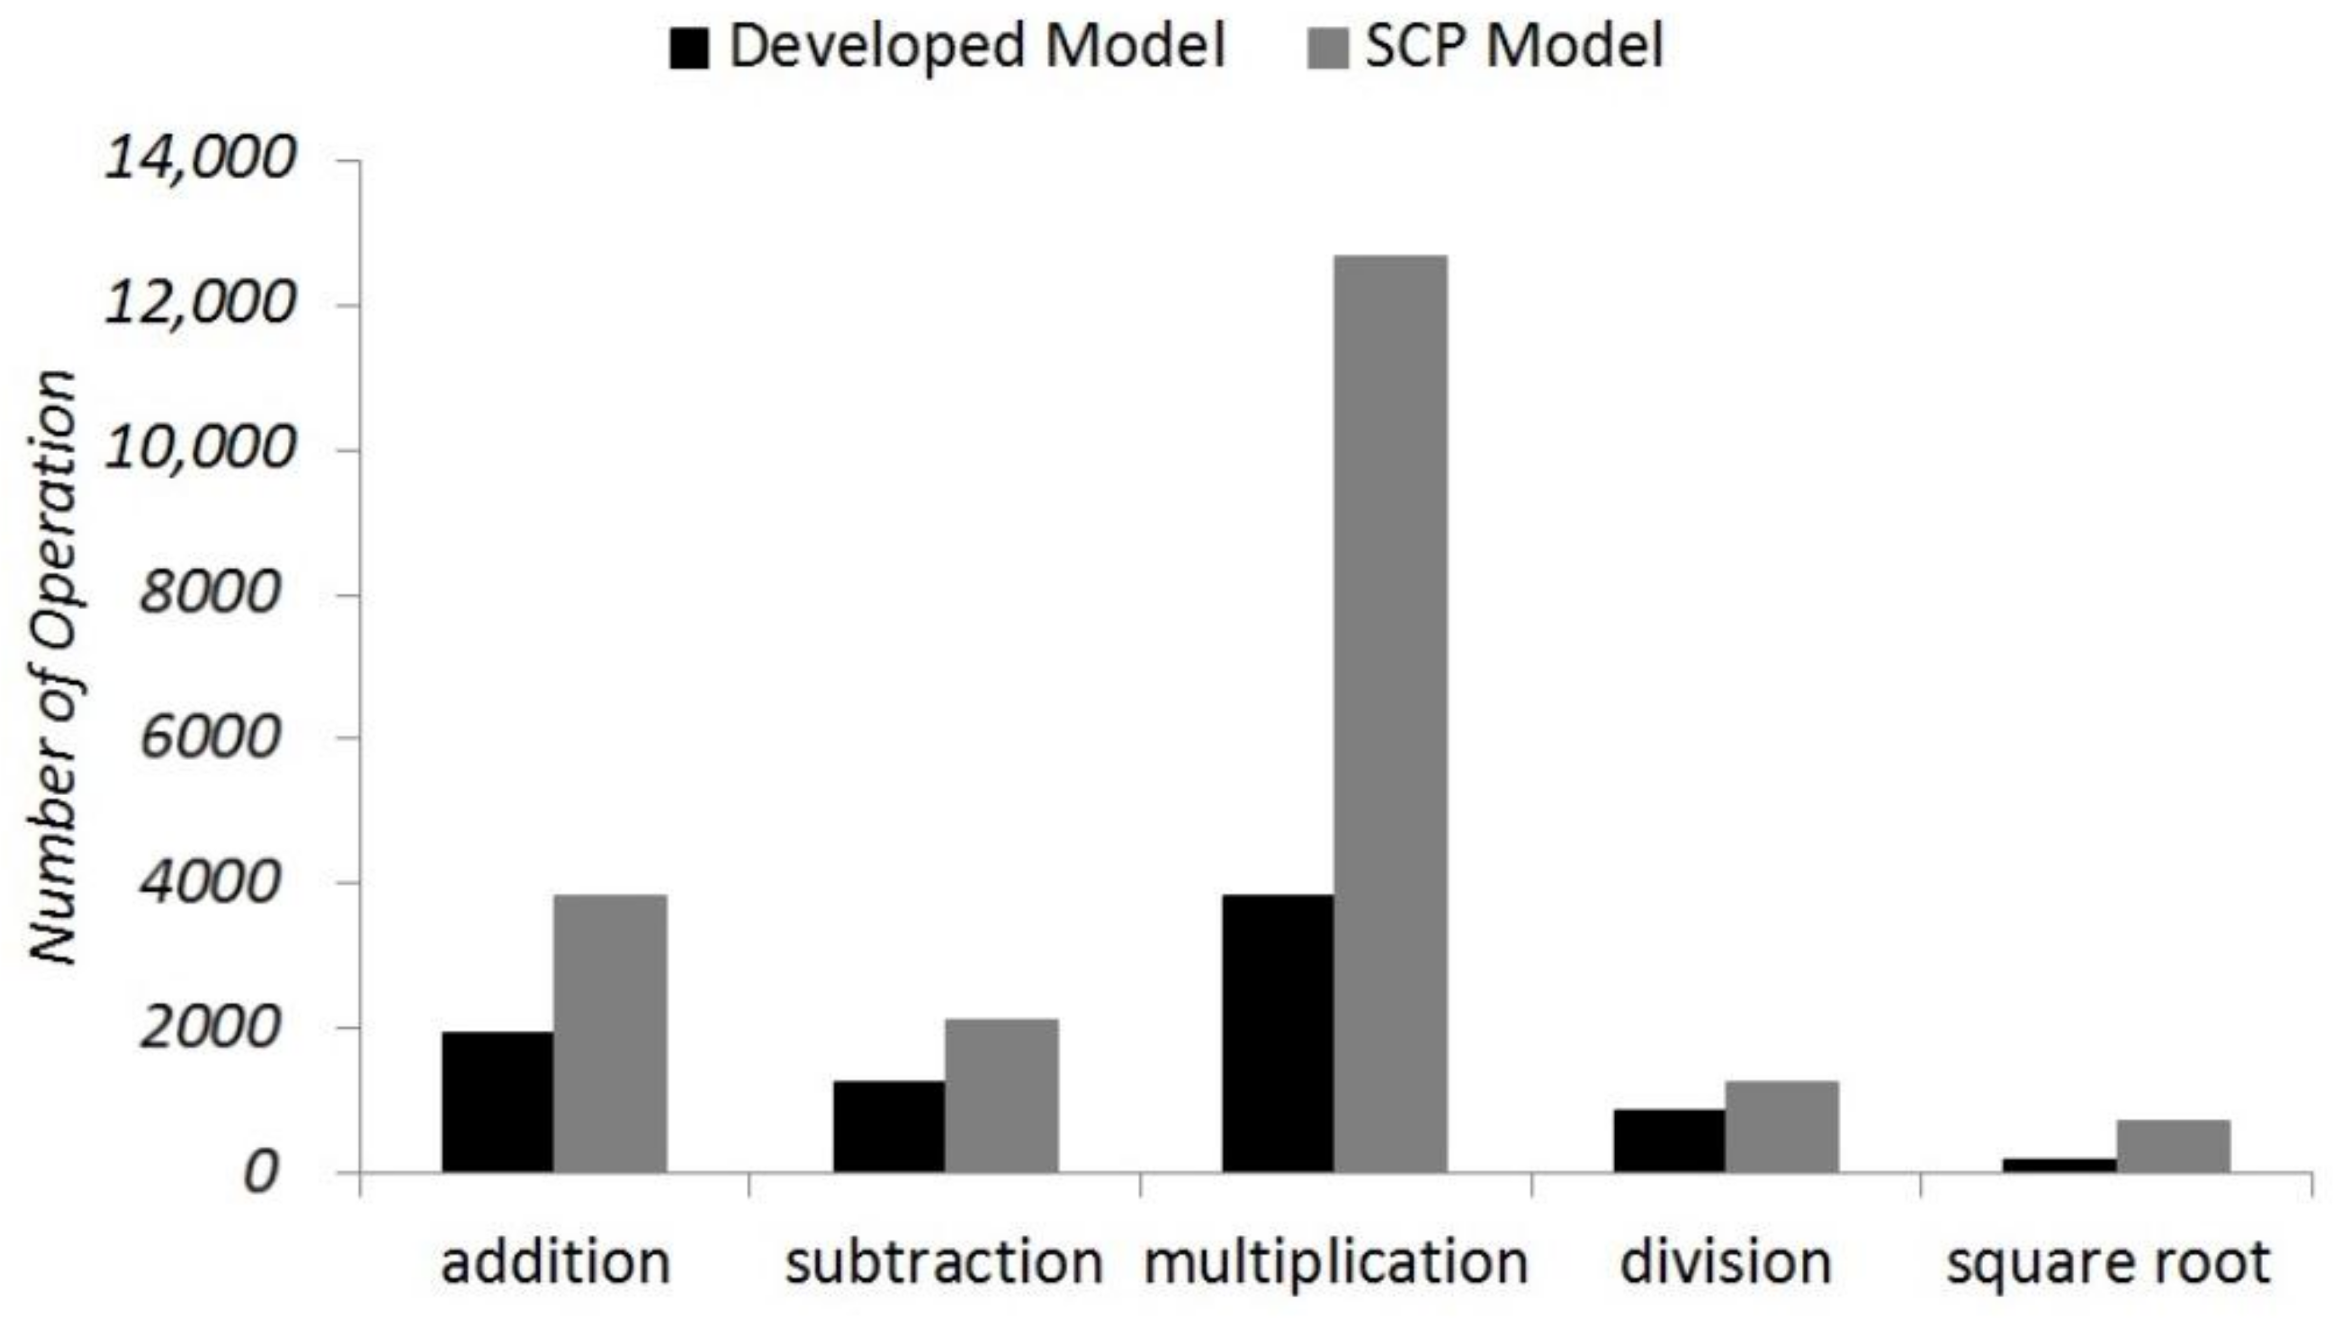
3.3. Computational Performance of the Models

The iteration numbers and complexities of the studied models for the load flow of the 34 bus test system are investigated in this section. Accordingly, two terms related with iteration numbers such as general and maximum machine iterations are given in Table 1. General iteration number describes the number of iterations required in order to reach the solution of the load flow analysis and the machine iteration number represents the number of iterations required to meet the convergence criteria of the machine iteration within the load flow algorithm. The maximum machine iteration shows the maximum number of machine iterations that occurred during the load flow iterations. Table 1 shows that the load flow algorithms accompanied with the Developed Model and the SCP Model [10] converge in 11 and 12 iterations, respectively. In addition, the maximum number of machine iterations for the Developed Model and the SCP Model [12] are, respectively, two and six iterations.
On the other side, numbers of operations, which are required by the models for the load flow analysis of the 34 bus test system, are shown in Figure 11. It is seen from this figure that the SCP Model [12] requires numbers of addition, subtraction, multiplication, division and square root operations as 3840, 2112, 12,672, 1272 and 744, respectively. In addition to this, the Developed model requires numbers of the respective operations as 1936, 1276, 3828, 880 and 176.
According to the results given up to here, it can clearly be mentioned that the Developed Model is computationally more efficient than the SCP Model [12] for the load flow analysis.

4. Conclusions

In this study, a model to be used in balanced or unbalanced distribution system load flow analysis for CFIG based WTGSs, which is directly connected to the grid, is developed, and it is also incorporated into a sweep based load flow analysis algorithm. The accuracy of the Developed model is experimentally evaluated and extensive validation is performed against the SCP Model [12] previously presented in the literature.
Considering the experimental analysis results obtained under different voltage unbalance and rotor slip levels, it is found that the Developed Model successfully estimates the reactive power demand of the machine and provides a meaningful figure for the generated active power when compared with the measured values and the SCP Model [12]. Thus, it can be concluded that the Developed model is robust and facilitates the computation of real and reactive power outputs of the induction generator for a specified wind speed and the terminal voltage by recognizing that machine equivalent circuit parameters are available.
In addition, the Developed Model and the SCP Model [12] are used for the load flow analysis of the 34 bus unbalanced radial distribution test system. Accordingly, it is clearly pointed out that both models give results very close to the load flow results of the 34 bus test system provided by Dugan et al. [27]. Models are also compared in terms of operation number and complexity for the load flow analysis of the 34 bus test system. As a result, it is concluded that the Developed Model requires less iterations and number of operations when compared with the SCP Model [12].

Acknowledgments

This work was supported by the Scientific and Technological Research Council of Turkey (TUBITAK) under project number 112E222.

Author Contributions

Ahmet Koksoy designed and performed the experiments. Onur Ozturk performed the analyses and Ahmet Koksoy wrote the paper. Murat Erhan Balci and Mehmet Hakan Hocaoglu supervise the whole work.

Conflicts of Interest

The authors declare no conflict of interest.

Appendix A

Table A1. Asynchronous generator parameters used in the experimental system.
Type of ParametersValues
Power (kW)7.5
Voltage (V)380
Rs (Ohm)0.710
Xs (Ohm)1.154
Rr (Ohm)0.710
Xr (Ohm)1.154
Rm (Ohm)195.199
Xm (Ohm)30.738
Table A2. Service transformer parameters used in the 34 bus test system.
Type of ParametersValues
Rated Power (kVA)750
Rated Voltage (kV)24.9/0.48
R (pu)%1
X (pu)%5
Table A3. Asynchronous generator parameters used in the 34 bus test system.
Type of ParametersValues
Rated Power (kW)660
Rated Voltage (V)480
Rs (Ohm)0.0018501
Xs (Ohm)0.037006
Rr (Ohm)0.0024436
Xr (Ohm)0.04189
Xm (Ohm)1.39636

References

  1. European Renewable Energy Targets. Available online: http://ec.europa.eu/energy/en/topics/renewable-energy (accessed on 25 January 2018).
  2. The Federal Energy Management Program. Available online: http://energy.gov/eere/femp/achieving-30-renewable-electricity-use-2025 (accessed on 25 January 2018).
  3. National Renewable Energy Action for Turkey. Available online: http://www.ebrd.com/documents/comms-and-bis/turkey-national-renewable-energy-action-plan.pdf (accessed on 25 January 2018).
  4. Rashid, M.H. Alternative Energy in Power Electronics, 1st ed.; Elsevier: Oxford, UK, 2015; ISBN 9780124167148. [Google Scholar]
  5. Amirat, Y.; Benbouzid, M.E.H.; Bensaker, B.; Wamkeue, R. Generators for wind energy conversion systems: State of the art and coming attractions. J. Electr. Syst. 2007, 3, 26–38. [Google Scholar]
  6. Vita, V. Development of a decision-making algorithm for the optimum size and placement of distributed generation units in distribution networks. Energies 2017, 10, 1433. [Google Scholar] [CrossRef]
  7. Vita, V.; Alimardan, T.; Ekonomou, L. The impact of distributed generation in the distribution networks’ voltage profile and energy losses. In Proceedings of the 9th IEEE European Modelling Symposium (EMS), Madrid, Spain, 6–8 October 2015; pp. 260–265. [Google Scholar] [CrossRef]
  8. Haque, M.H. Incorporation of fixed speed wind turbine generators in load flow analysis of distribution systems. Int. J. Renew. Energy Technol. 2015, 6, 317–334. [Google Scholar] [CrossRef]
  9. Fuchs, E.F.; Masoum, M.A.S. Power Quality in Power Systems and Electrical Machines, 1st ed.; Elsevier Academic Press: Burlington, MA, USA, 2008; ISBN 978-0-12-369536-9. [Google Scholar]
  10. Eminoglu, U.; Dursun, B.; Hocaoglu, M.H. Incorporation of a new wind turbine generating system model into distribution systems load flow analysis. Wind Energy J. 2009, 12, 375–390. [Google Scholar] [CrossRef]
  11. Eminoglu, U.; Hocaoglu, M.H. A new power flow method for radial distribution systems including voltage dependent load models. Electr. Power Syst. Res. 2005, 76, 106–114. [Google Scholar] [CrossRef]
  12. Abdel-Akher, M.; Mahmoud, K. Unbalanced distribution power-flow model and analysis of wind turbine generating systems. Eur. Trans. Electr. Power 2013, 23, 689–700. [Google Scholar] [CrossRef]
  13. Ghorashi, A.H.; Murthy, S.S.; Singh, B.P.; Singh, B. Analysis of wind driven grid connected induction generators under unbalanced grid conditions. IEEE Trans. Energy Convers. 1994, 9, 217–223. [Google Scholar] [CrossRef]
  14. Moghaddas-Tafreshi, S.M.; Mashhour, E. Distributed generation modeling for power flow studies and a three-phase unbalanced power flow solution for radial distribution systems considering distributed generation. Electr. Power Syst. Res. 2009, 79, 680–686. [Google Scholar] [CrossRef]
  15. Fengli, J.; Zailin, P.; Shihong, W.; Rui, H.; Yunan, Z. Power Flow Calculation for Radial Distribution Systems with Distributed Generation. In Proceedings of the 2012 International Conference on Mechatronics and Automation (ICMA), Chengdu, China, 5–8 August 2012; pp. 1287–1291. [Google Scholar] [CrossRef]
  16. Yang, X.; Wei, Z.; Sun, G.; Sun, Y.; Yuan, Y.; Lu, Z.; Xu, X.; Huang, L. Power flow calculation for unbalanced three-phase distribution network with DGs based on phase-sequence hybrid modeling. In Proceedings of the 2013 IEEE International Conference on Smart Energy Grid Engineering (SEGE), Oshawa, ON, Canada, 28–30 August 2013; pp. 1–6. [Google Scholar] [CrossRef]
  17. Balci, M.E.; Hocaoglu, M.H.; Koksoy, A.; Ozturk, O.; Dursun, B. A fixed speed induction generator model for unbalanced power flow analysis. In Proceedings of the 2014 16th International Conference on Harmonics and Quality of Power (ICHQP), Bucharest, Romania, 25–28 May 2014; pp. 209–213. [Google Scholar] [CrossRef]
  18. Feij´oo, A.; Villanueva, D. A PQ model for asynchronous machines based on rotor voltage calculation. In IEEE Transactions Energy Conversion; IEEE: Piscataway, NJ, USA, 2016; Volume 31, pp. 813–814. [Google Scholar] [CrossRef]
  19. Divya, K.C.; Rao, P.S.N. Models for wind turbine generating systems and their application in load flow studies. Electr. Power Syst. Res. 2006, 76, 844–856. [Google Scholar] [CrossRef]
  20. IEEE Power & Energy Soceity. 34-Bus Feeder (XLS and DOC). Available online: http://www.ewh.ieee.org/soc/pes/dsacom/testfeeders/feeder34.zip (accessed on 25 January 2018).
  21. Mathworks. Matlab Software documentation. Available online: http://www.mathworks.com/help/matlab/language-fundamentals.html (accessed on 25 January 2018).
  22. Dugan, R.C. Reference Guide. The Open Distribution Simulator (OpenDSS). Available online: http://download2.nust.na/pub4/sourceforge/e/el/electricdss/OpenDSS/OpenDSSManual.pdf (accessed on 25 January 2018).
  23. Eminoglu, U.; Hocaoglu, M.H. Distribution systems forward/backward sweep-based power flow algorithms: A review and comparison study. Electr. Power Compon. Syst. 2008, 37, 91–110. [Google Scholar] [CrossRef]
  24. IEC Standard 60034-26. Rotating Electrical Machines, Part 26: Effects of Unbalanced Voltages on the Performance of Three-Phase Induction Motors; IEC: Geneva, Switzerland, 2014. [Google Scholar]
  25. Jouanne, A.; Banerjee, B. Assessment of voltage unbalance. IEEE Trans. Power Deliv. 2001, 16, 782–790. [Google Scholar] [CrossRef]
  26. BS EN 50160:2010+A1:2015. Voltage Characteristics of Electricity Supplied by Public Distribution Systems; CENELEC: Brussels, Belgium, 2015. [Google Scholar]
  27. Dugan, R.C.; Kersting, W.H. Induction machine test case for the 34-bus test feeder-description. In Proceedings of the IEEE Power Engineering Society General Meeting, Montreal, QC, Canada, 18–22 June 2006. [Google Scholar] [CrossRef]
Figure 1. (a) positive-sequence and (b) negative sequence equivalent circuits of an induction generator referred to its stator side.
Applsci 08 00502 g001
Figure 2. Flowchart of the Load Flow Algorithm.
Applsci 08 00502 g002
Figure 3. Flowchart of the Algorithm Implemented for the Developed Model.
Applsci 08 00502 g003
Figure 4. Schematic representation (a), and a photograph (b) of the test system.
Applsci 08 00502 g004
Figure 5. Variation of the reactive power demand (a) and injected active power (b) of the generator at the −1.20% slip value for various unbalanced terminal voltages (VUF%).
Applsci 08 00502 g005
Figure 6. Variation of the reactive power demand (a), and injected active power (b) of the generator at the 5% VUF value for different rotor slip values.
Applsci 08 00502 g006
Figure 7. Variation of the reactive power demand (a), and injected active power (b) of the generator at the 2% VUF value for different rotor slip values.
Applsci 08 00502 g007
Figure 8. 34 bus radial test system with the placement of wind turbines (redrawed from [27]).
Applsci 08 00502 g008
Figure 9. Phase voltage differences (%) of each bus with models for (a) Phase A; (b) Phase B; and (c) Phase C.
Applsci 08 00502 g009aApplsci 08 00502 g009b
Figure 10. Voltage angle differences (°) of each bus with models for (a) Phase A; (b) Phase B; and (c) Phase C.
Applsci 08 00502 g010aApplsci 08 00502 g010b
Figure 11. Executed operation numbers for models in the 34 bus test system analysis.
Applsci 08 00502 g011
Table 1. Iteration number of models in the 34 bus test system.
Developed ModelSCP Model [12]
General IterationMaximum Machine IterationGeneral IterationMaximum Machine Iteration
112126

