1. Introduction
In order to mitigate the Radio Frequency (RF) technology limitations, over the past decades, there has been a growing interest in free space optical (FSO) communications. In the current scenario of limited radio spectrum, FSO can be a savior with its high speed over the secure free license optical wavelengths [
1,
2]. However, the performance of FSO transmission is highly dependent on atmospheric conditions such as temperature, humidity, solar irradiance, etc.
Fog is considered one of the most challenging environments for wireless optical transmissions [
3]. Fog affects the transmission where wavelengths are in the visible and infrared range, as the fog particles and the wavelength range are of the same magnitude [
4,
5]. Foggy weather leads to the appearance of scattering phenomena, which causes the optical signal degradation. On the other hand, there are other sources of impairments that highly affect the FSO behavior, such as the pointing errors caused by the building sways and mechanical vibrations which enhances the deviation of laser beam leading to the attenuation of the received light signal [
6,
7]. Scintillation phenomenon is also one of the major sources affecting the performance of FSO communications, which is also known as atmospheric turbulence. Scintillation is caused by air turbulence leading to fluctuations in both the intensity and the phase of the received light signal causing impaired link performance [
8].
In the literature, most of the experimental works were focused on the fog effect [
2,
5,
8,
9,
10]. The effects of atmospheric turbulence have been also studied. Many researchers studied the strength of atmospheric turbulence called refractive index. In fact, in [
11], the authors made some experimental tests related to the effect of scintillation on FSO link. They found that the refractive index is highly affected by the ambient temperature and by the time of day. In their work, they did not present how the fluctuations of refractive index affected the behavior of FSO link. Moreover, the path link is limited to 220 m. In [
12], an indoor test to measure the refractive index was made. They have characterized the effects of these fluctuations on an ad-hoc FSO network. The dust and sandstorm effect on FSO link in the Gulf Cooperation Council (GCC) states was also studied in [
12]. The authors made an experimental test of the performance of FSO under dusty weather. They found that the dust has a bigger effect than the fog. In all the work stated above, a detailed description of the test setup along with the sensors and detailed statistical analysis of the results from the test setup to show their effect on the performance of the FSO communication was missing.
Studying extremely hot weather and moderate winter effects on FSO link in GCC countries can be considered as a major step towards a large-scale deployment of wireless optical communication technology in these countries. For this reason, in this work, we will briefly analyze the effects of some major environment parameters in Qatar on FSO link. Qatar’s climate could be characterized as harsh sub-tropical desert climate with very dry and hot summer. The temperature is high throughout the year and is above 14 °C even in winter. The sun shines bright throughout most of the year. The period from December to February is considered as winter season with moderate temperature oscillating between 14 °C and 30 °C. The lowest temperature in the year is recorded during this period. On the other hand, the period from June to August is considered as the peak summer time in Qatar. The average summer’s temperature is about 45 °C. During this period, it is extremely hot during the day, while the nights are warm but not as extreme as the day. The experimental tests were carried out throughout 2015 so that we can do an evaluation of the FSO performances during the prominent four seasons of Qatar. Furthermore, we also validated the relation of the strength of turbulence, called refractive index (
Cn2) with the FSO performance. Based on data collected from the sensors and by adopting the Blaunstein model (BKB) [
13], we will analyze how the variation of refractive index during the different times of the day affects the FSO performance.
The paper is organized in the following sections: In
Section 2, an overview of the complete installed system at QU and the application, that has been designed to measure the performance of FSO link under harsh climate, is presented. The behavior of FSO link along with detailed statistical analysis during winter and summer season at Qatar is presented in
Section 3. In
Section 4, the fluctuations of refractive index in Qatar during the winter season (as the environmental parameters are not within the limits of BKB model for the summer season) using the BKB model is presented which is also used to validate the results in
Section 3. All the statistics and data from the previous sections were used to form a closed form expression relating the Packet Delivery Ratio (PDR) with the major environment parameters during the summer season, as they do not affect the PDR much during the other seasons. Finally, a conclusion is presented in
Section 5.
2. System Overview
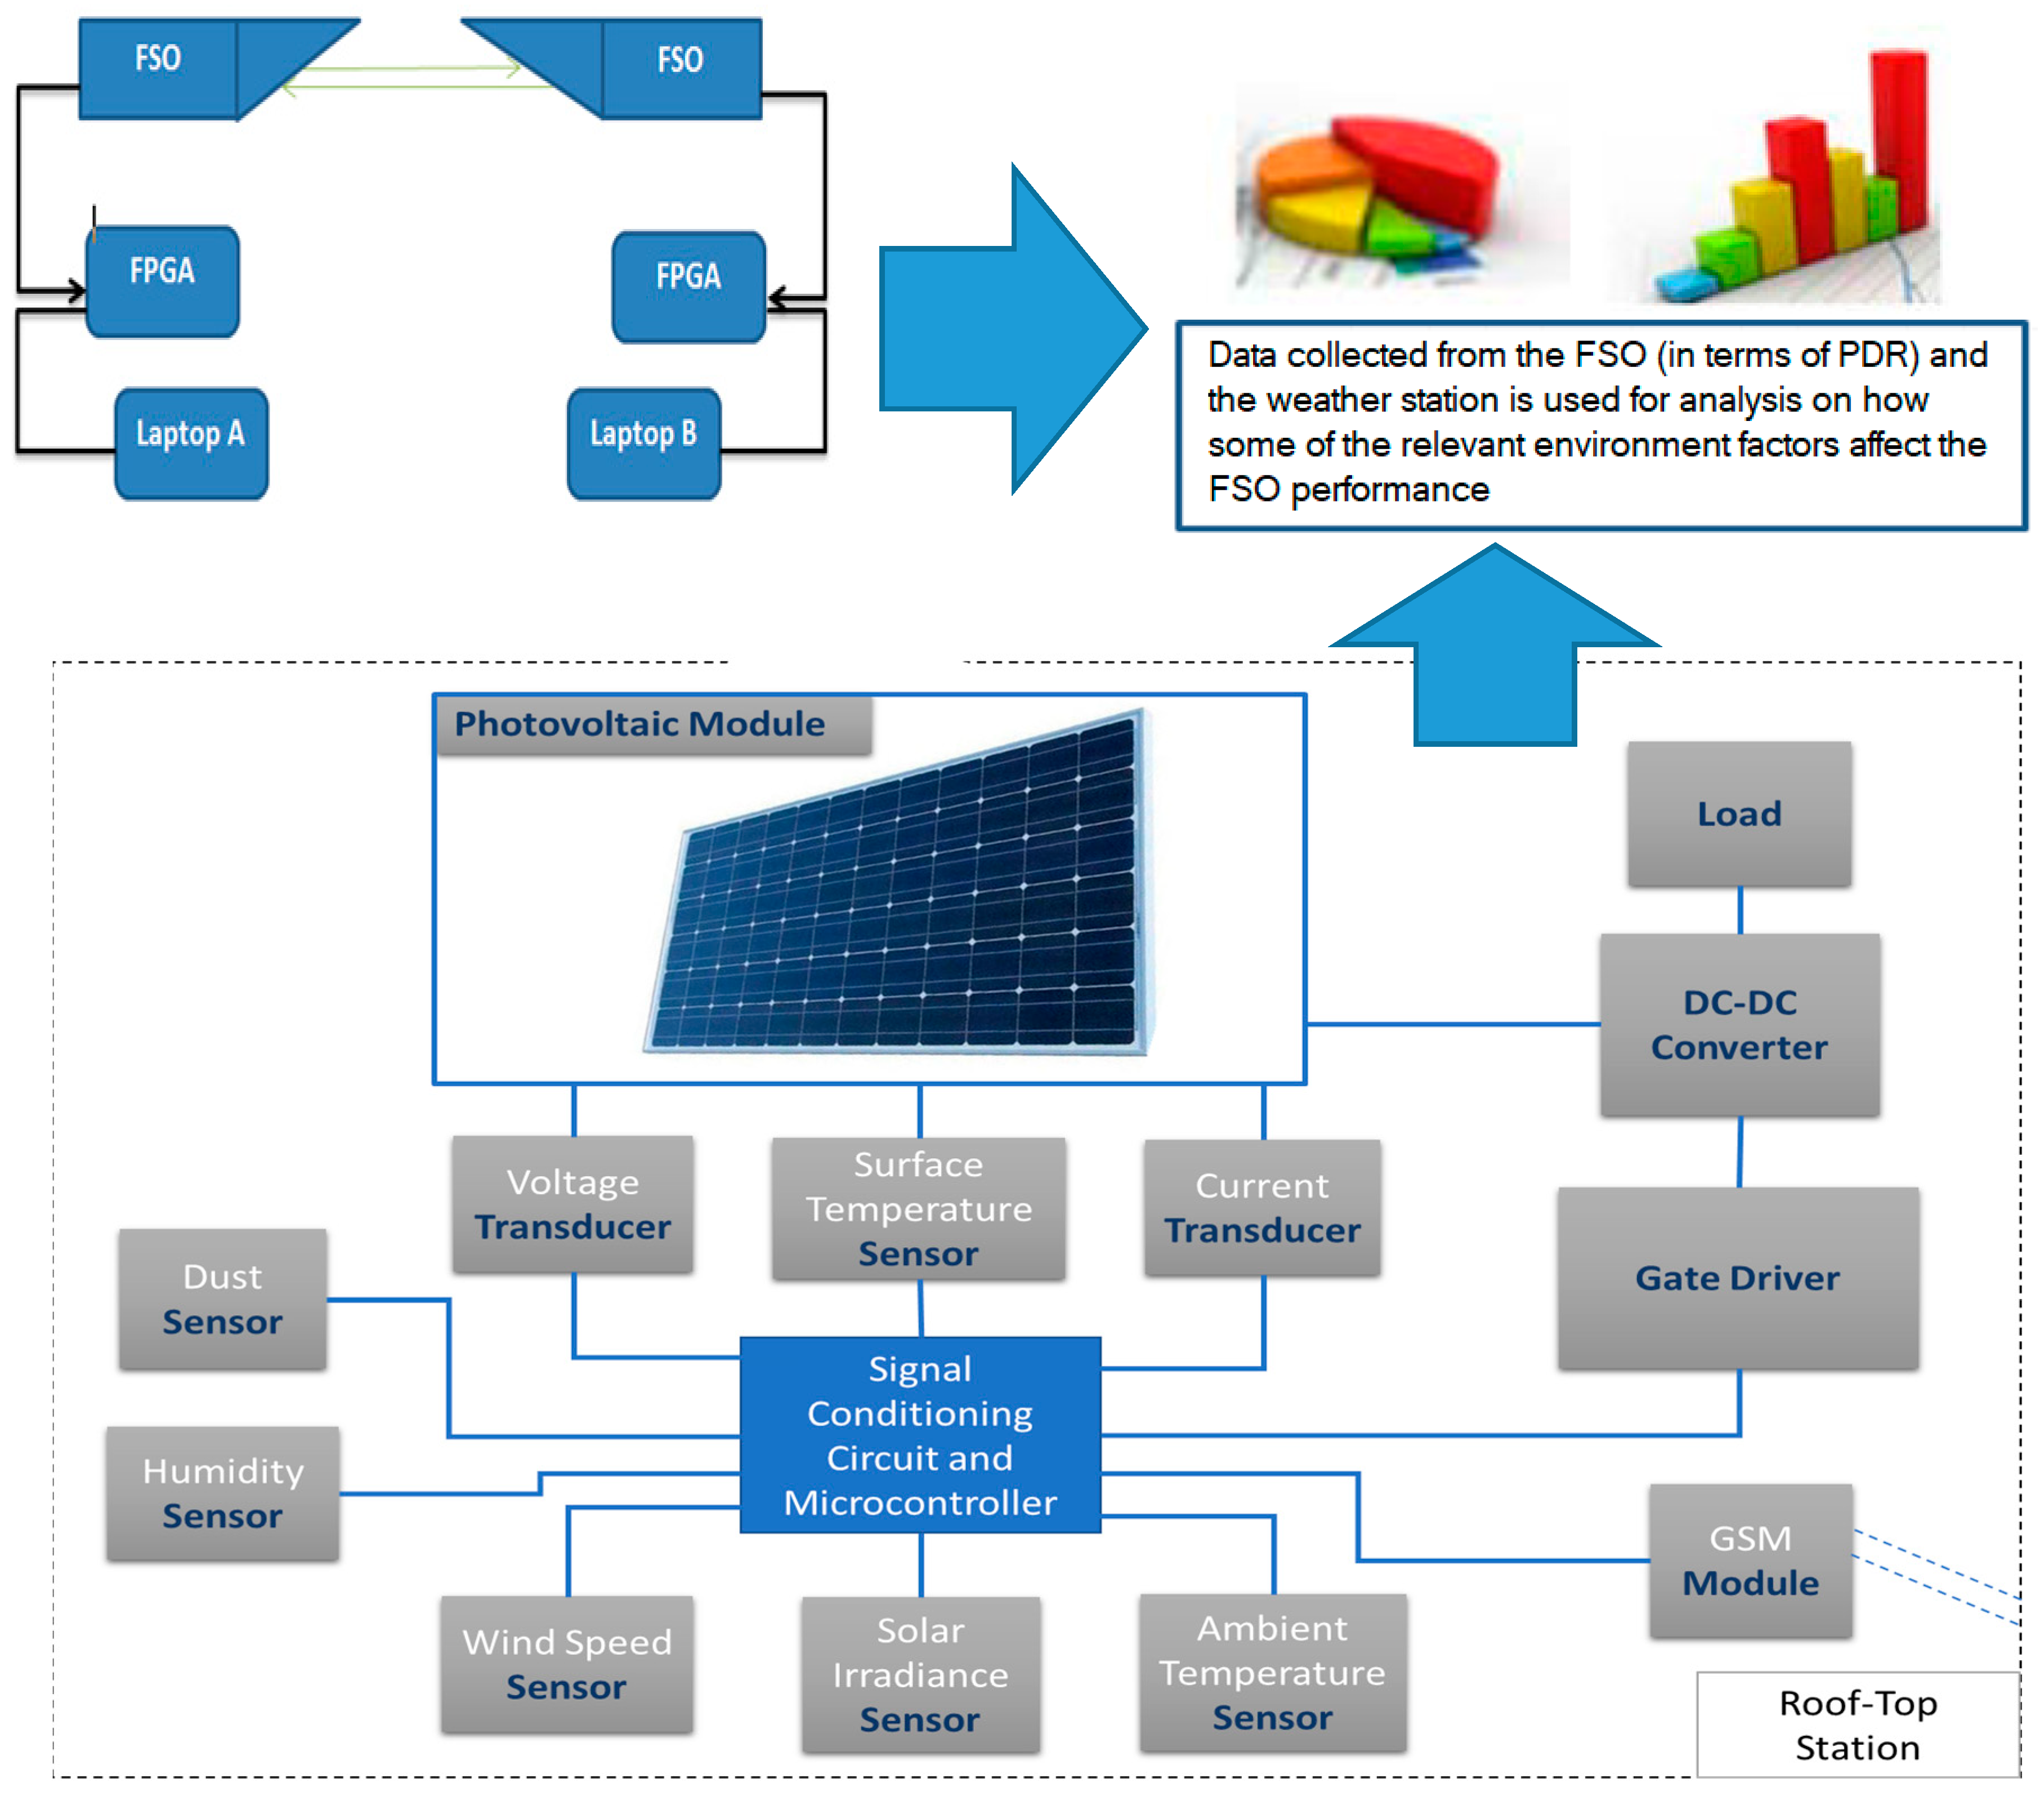
A detailed description of the test setup along with the sensors used is presented in this section. The FSO transceivers were installed on the rooftops of Engineering and Business buildings of Qatar University, which are 600 m apart. The FSO communication link operates at 1 mW fixed optical power (set by the hardware) and at a wavelength of 1550 nm,
Figure 1. The FSO units which can work only at wavelength of 1550 nm help to eliminate the effect of absorption phenomenon [
1,
3]. The FSO communication link used in the test setup consists of 2 FSO units, 1 transmitter and 1 receiver. The FSO units were periodically calibrated to overcome any loss of transmission due to pointing errors. The unit makes the alignment and collimates the beam automatically. A User Datagram Protocol (UDP) application is running on Field Programmable Gate Arrays (FPGAs) connected to the FSO transceivers. The FPGA development kit NETFPGA-1G-CML (Diglient, Pullman, WA, USA) was used as it is a versatile, low cost network hardware development platform featuring a Xilinx Kintex-7 XC7K325T FPGA (Xilinx, San Jose, CA, USA) and includes four Ethernet interfaces capable of negotiating up to 1 Gbps [
14]. The NetFPGA-1G-CML board has 512 MB of 800 MHz Double Data Rate Type 3 (DDR3) that can support high throughput packet buffering. It uses low jitter 200 MHz oscillator that is required to speed up encoding/decoding algorithm.
One of the FPGA’s will act as the server and keep transmitting packets which will be received by the other FPGA which is acting as client. One Gbps capacity was used and was confirmed using the Iperf tool. The transmission of packets occur periodically and the collected packets are compared with the known transmitted packets for computation of PDR. The use of FPGA makes it easier to control the communication and does not occupy larger space. The FPGAs have Ubuntu 9.0 operating system installed in them and the UDP applications are running on the operating system.
The paper aims at setting an experimental setup for analyzing the FSO performance in Qatar. The metric used for analyzing the performance of FSO is PDR. PDR is defined as the ratio of data packets correctly received by the destination to those generated by the sources. Thus, closer the value of PDR is to 100%, the better is the FSO performance. In general, for wireless optical transmissions, PDR is largely depended on the environment. Mathematically, the PDR is defined as
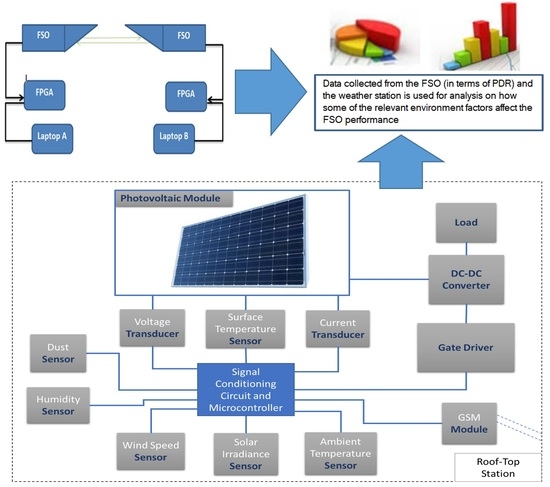
On the other hand, in order to measure the environmental factors, many sensors were installed at QU near the FSO transceiver as shown in
Figure 2, which is also a part of the authors previous work [
15]. These sensors measure the temperature, the solar irradiance and the relative humidity.
As shown in
Figure 2 the data (Ambient Temperature, Humidity, and Irradiance) are collected from the weather station and correlated with the data collected from the FSO system, i.e., PDR. The sensors used for collecting data from the weather station are stated in detail in
Table 1. To investigate the effects of environmental factors on FSO performance, a detailed analysis is done on the collected data in next section. The measured data for each season is also provided.
3. Statistical Analysis of the Collected Data for Different Seasons
3.1. Winter and Spring Season
In this section, the performance of the FSO link, during winter season (i.e., December, January, and February) and spring season (March) in terms of PDR variations is presented.
The UDP application measuring the PDR is running continuously 24 h per day. Every day data is collected from the system. For each month, the data is collected for a window of 30 min in each hour of the day. The values of each hour of the day of the month are averaged. Thus, for each month the average collected data as a function of time and weather factors are presented.
In
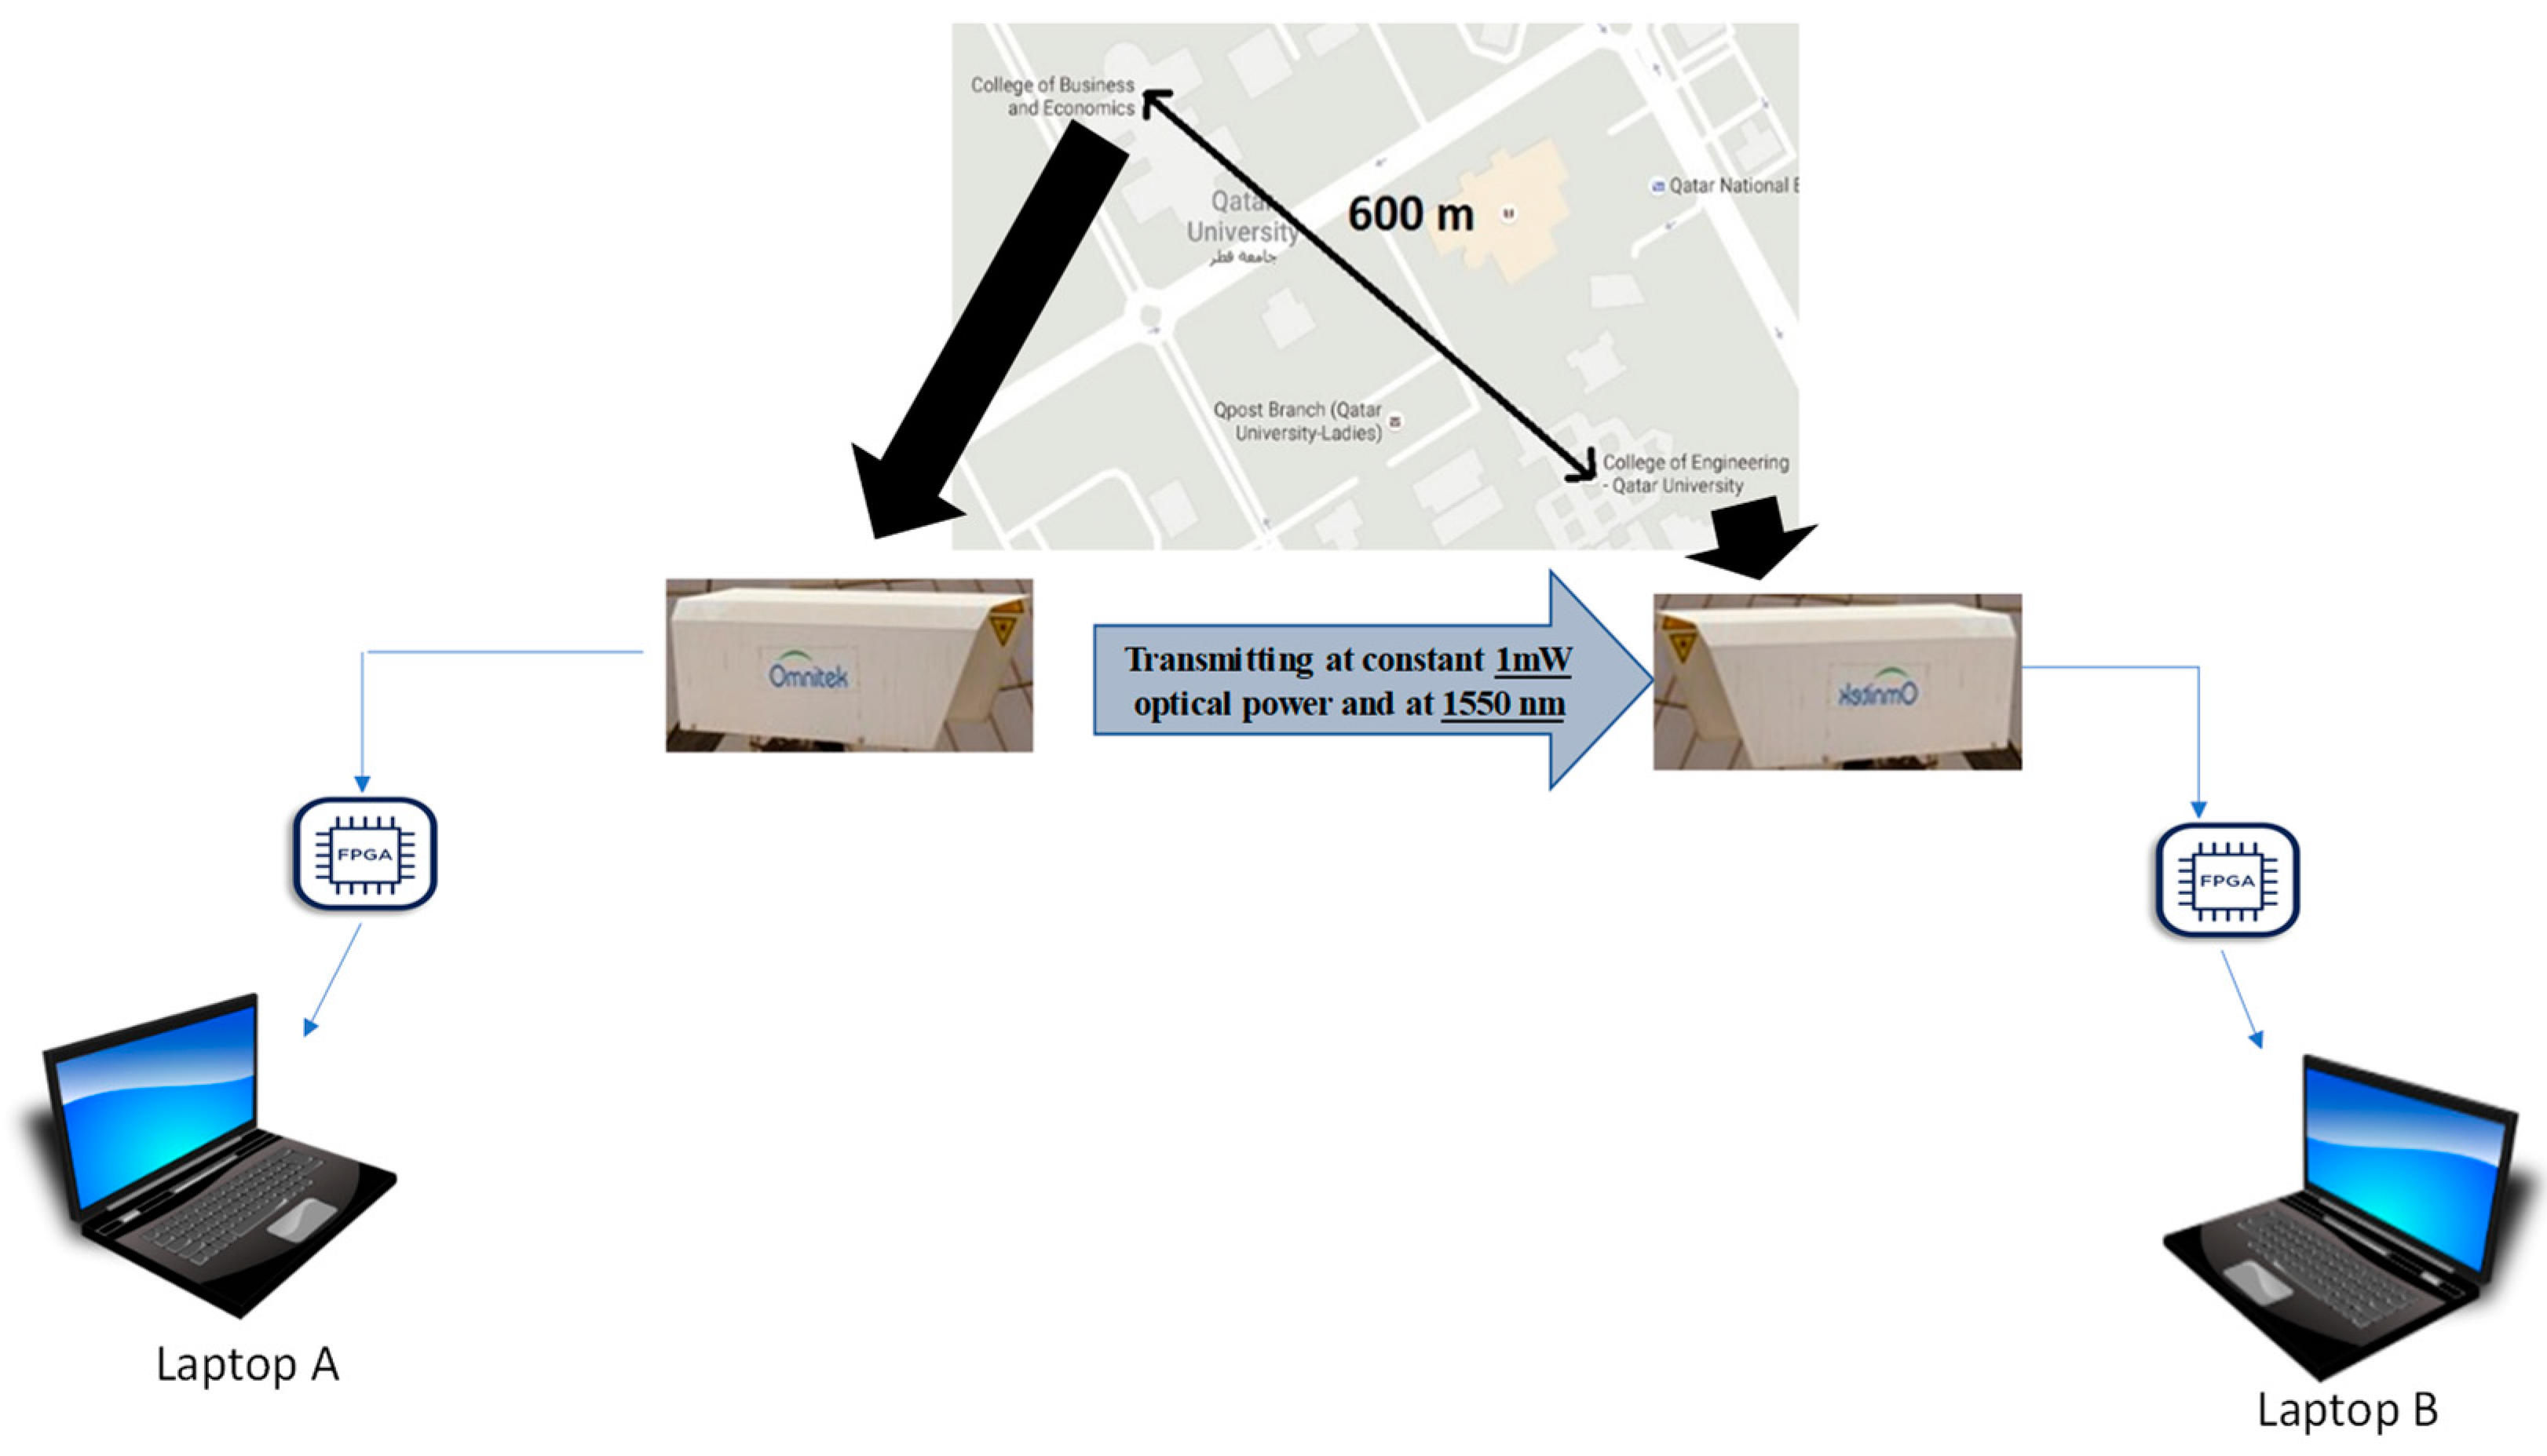
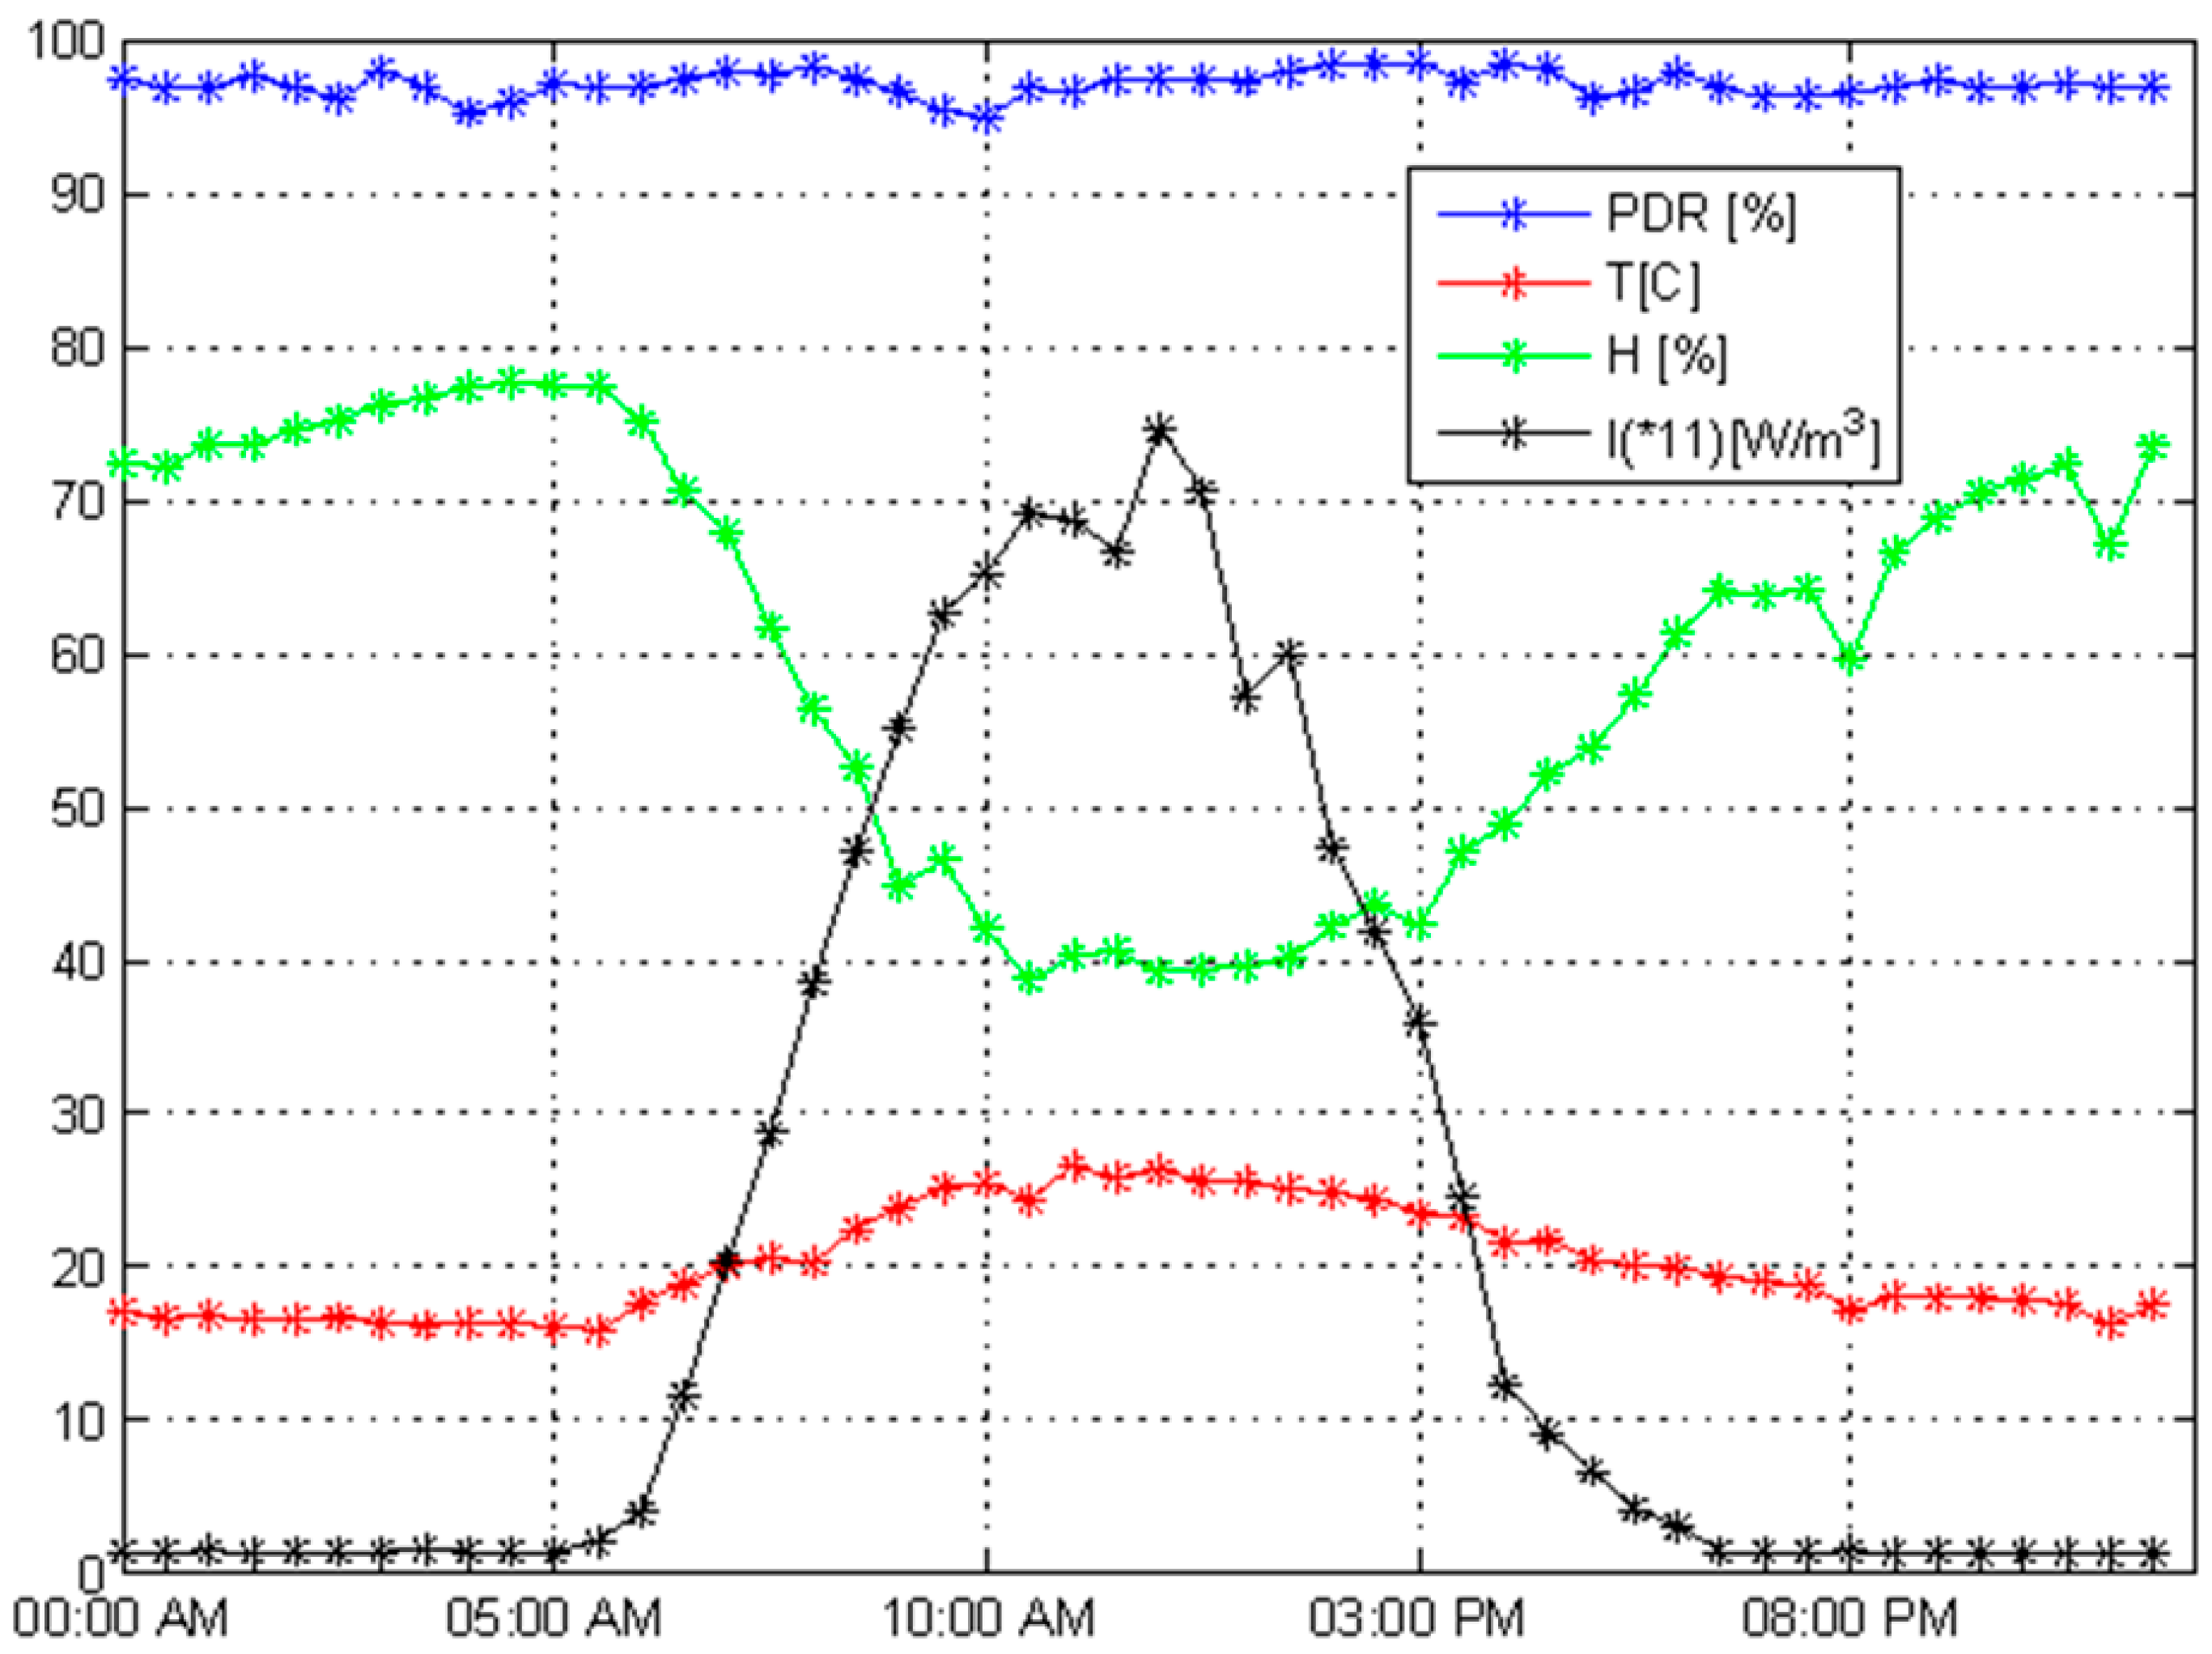
Figure 3, the behavior of FSO link during December 2014, January 2015 and February 2015 is presented. The plots contain the PDR, temperature, humidity and solar irradiance as a function of time. As shown in
Figure 3, the weather in Qatar during December is considered moderate, where the temperature varies between 14 °C and 28 °C and the humidity is between 38% and 90%. The FSO performs well as the PDR reaches a high level and oscillates between 95% and 100%. It should also be noted that the humidity and temperature fluctuates even at night and can affect the behavior of FSO link. Similar performances can be seen in January and February, which is considered winter season in Qatar as the temperature, is the minimum during this time. The temperature is however very high if compared to Europe and America during same season.
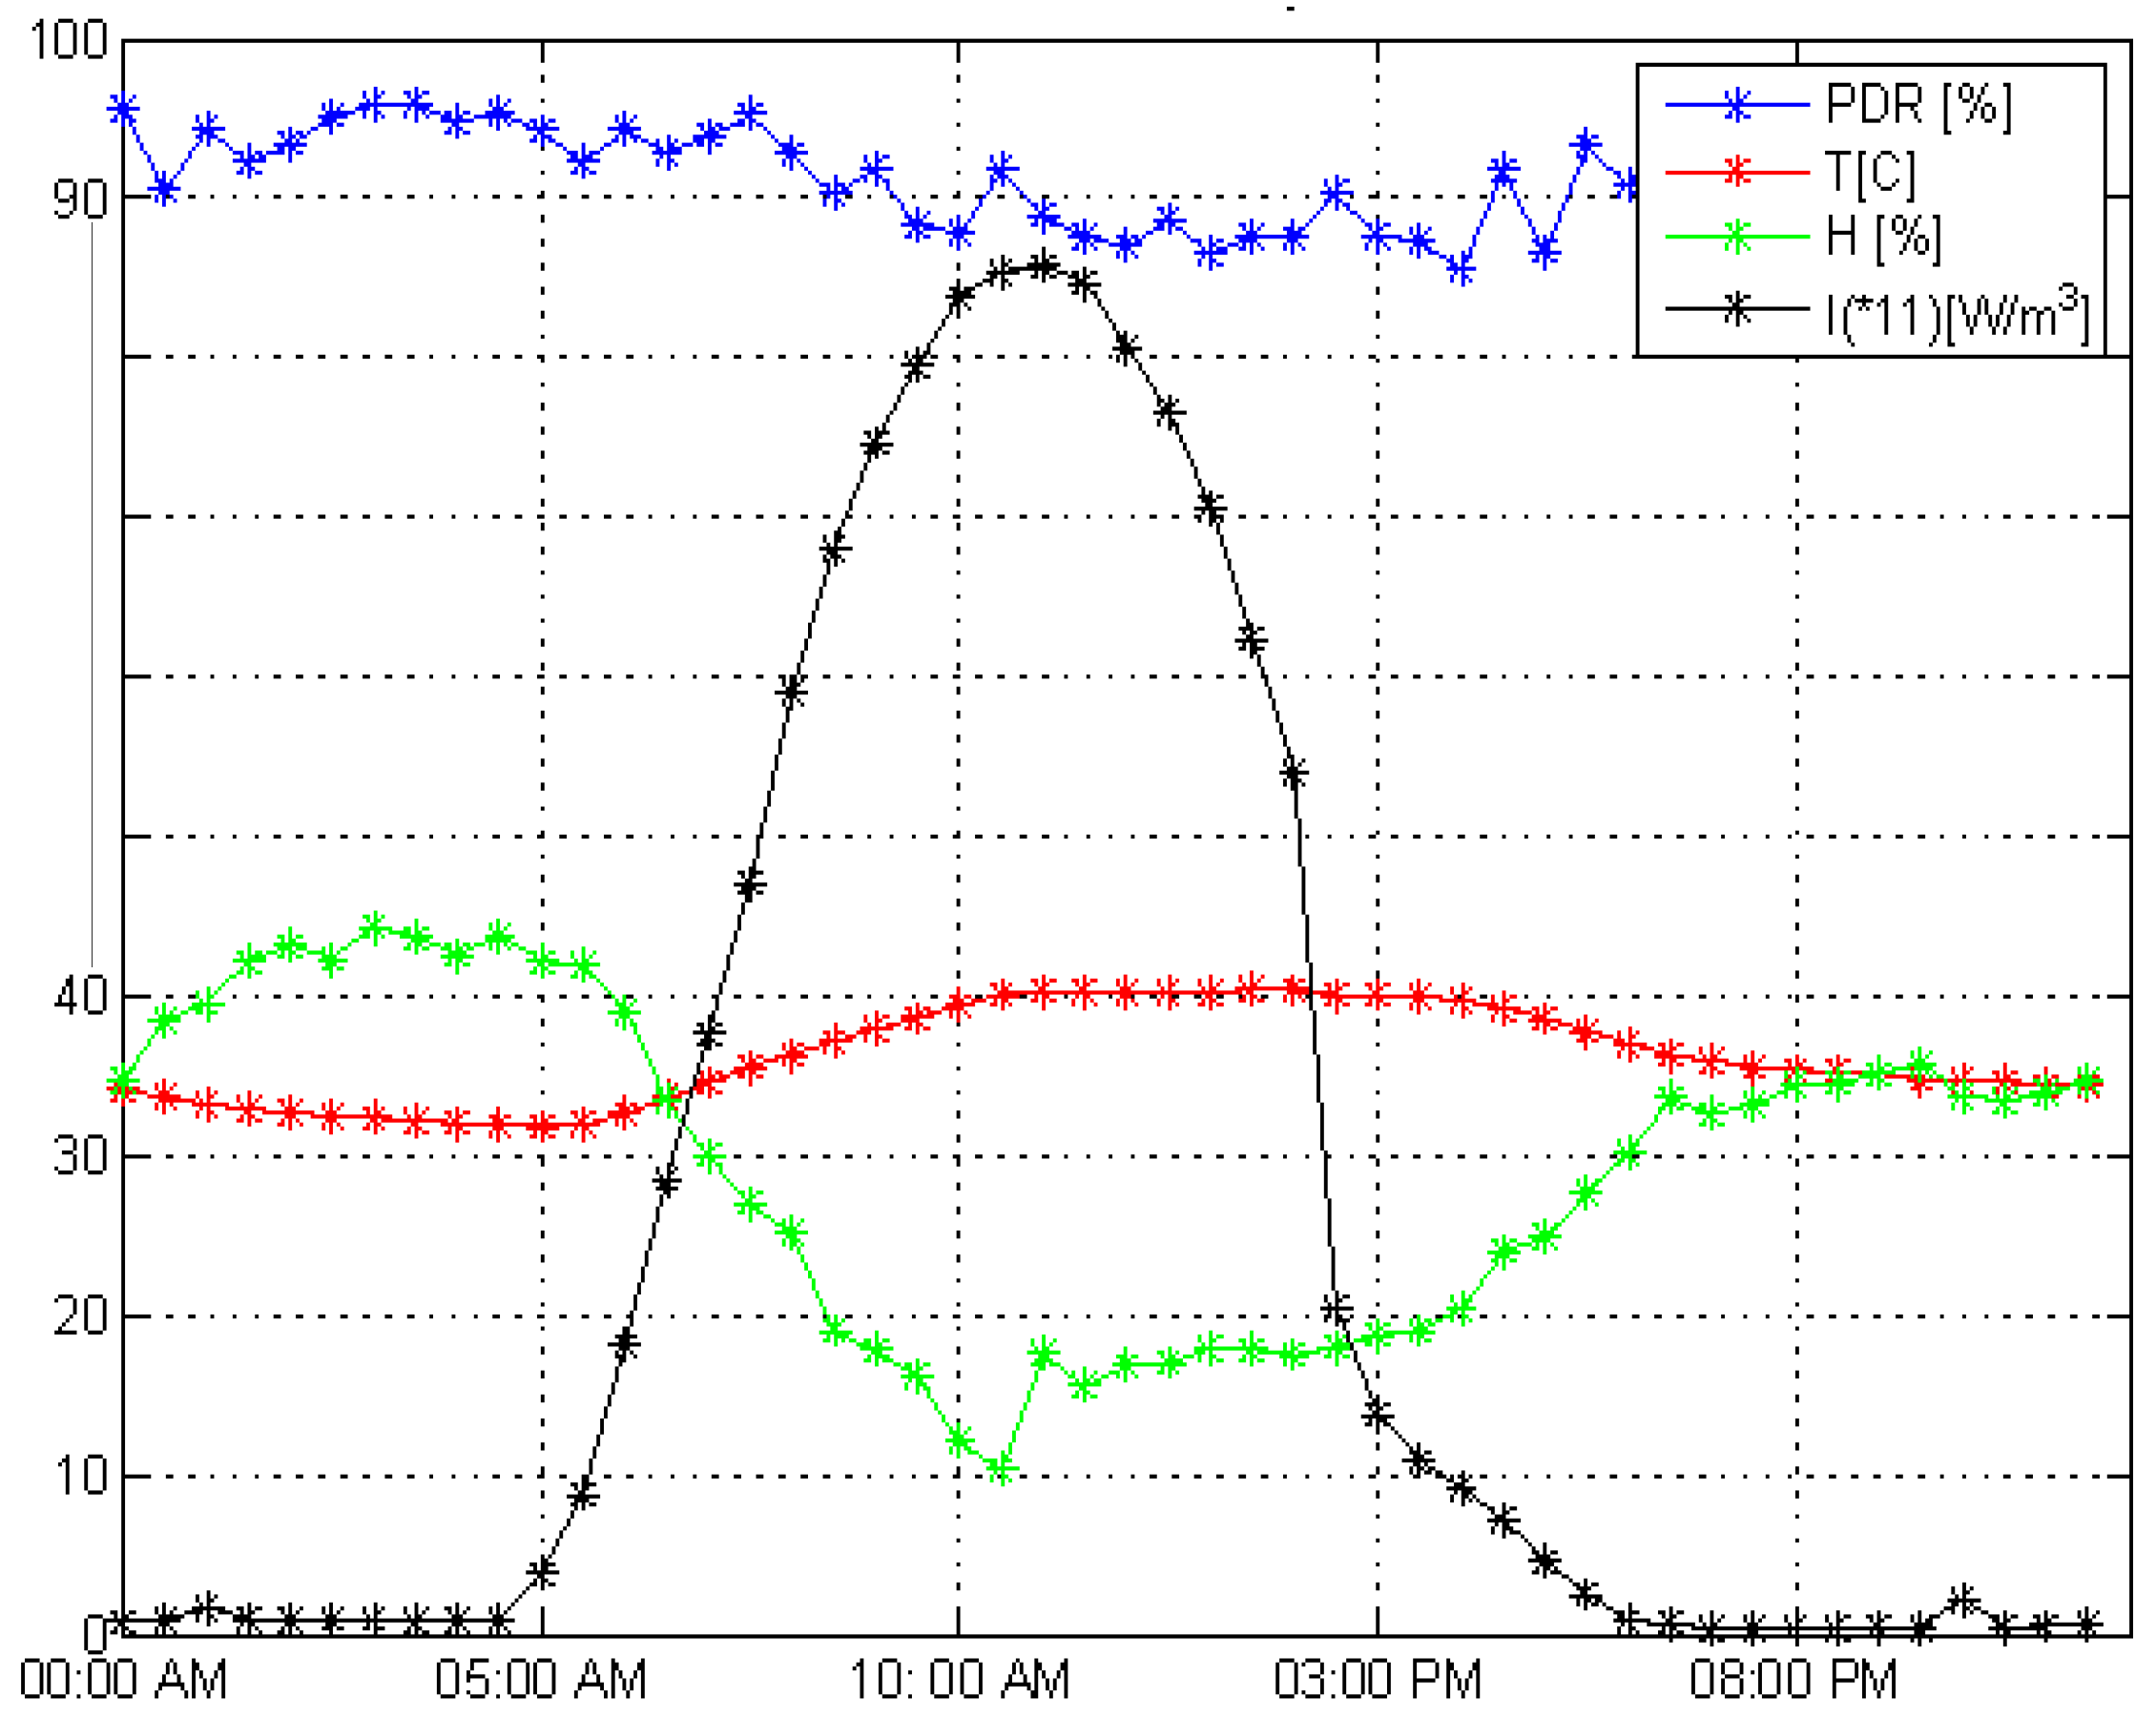
In Qatar, March is considered as spring season. In
Figure 4, the PDR variations along with temperature and humidity during March is presented. As shown from the plots, the FSO has the same performance as the previous months. In fact, the FSO shows a better performance and the PDR does not fall below 95%.
From the figures, it can concluded that during winter and spring seasons, the PDR varies slowly during a single day and it can be considered to be constant with a good performance. On the other hand, as discussed before, the temperature also varies slowly and does not reach high level. Thus it validates that there is relationship between the low variation of weather factors and the good performance of the FSO link. In Qatar, the temperature and the humidity during the winter and the spring seasons are low and does not cause much effect on the PDR. To further investigate and validate the relation of the FSO link performance with weather factors, in the next section, the measurement of pre-summer and summer seasons are presented, where the temperature varies significantly during the day and reaches higher levels. Statistics to investigate which environment factor has the major effect on the FSO performance was also investigated.
3.2. Pre-Summer and Summer Measurements
In Qatar, May is considered to be as pre-summer season.
Figure 5 illustrates the behavior of FSO link during this season. As shown from the plots, the PDR fluctuates significantly during one day where the average temperature exceeds 40 °C and the humidity oscillates in low levels (does not exceed 50%). The temperature has a strong negative relation with the PDR as it can be seen from the regression analysis and t-test statistics done in
Table 2. In other word, if the temperature increases the PDR drops. The humidity does not affect the FSO communication performance as seen in
Table 2, which can be attributed to the low humidity environmental parameter, which is not strong enough to affect its performance. Next, to validate this suggestion, FSO behavior during summer season is also presented.
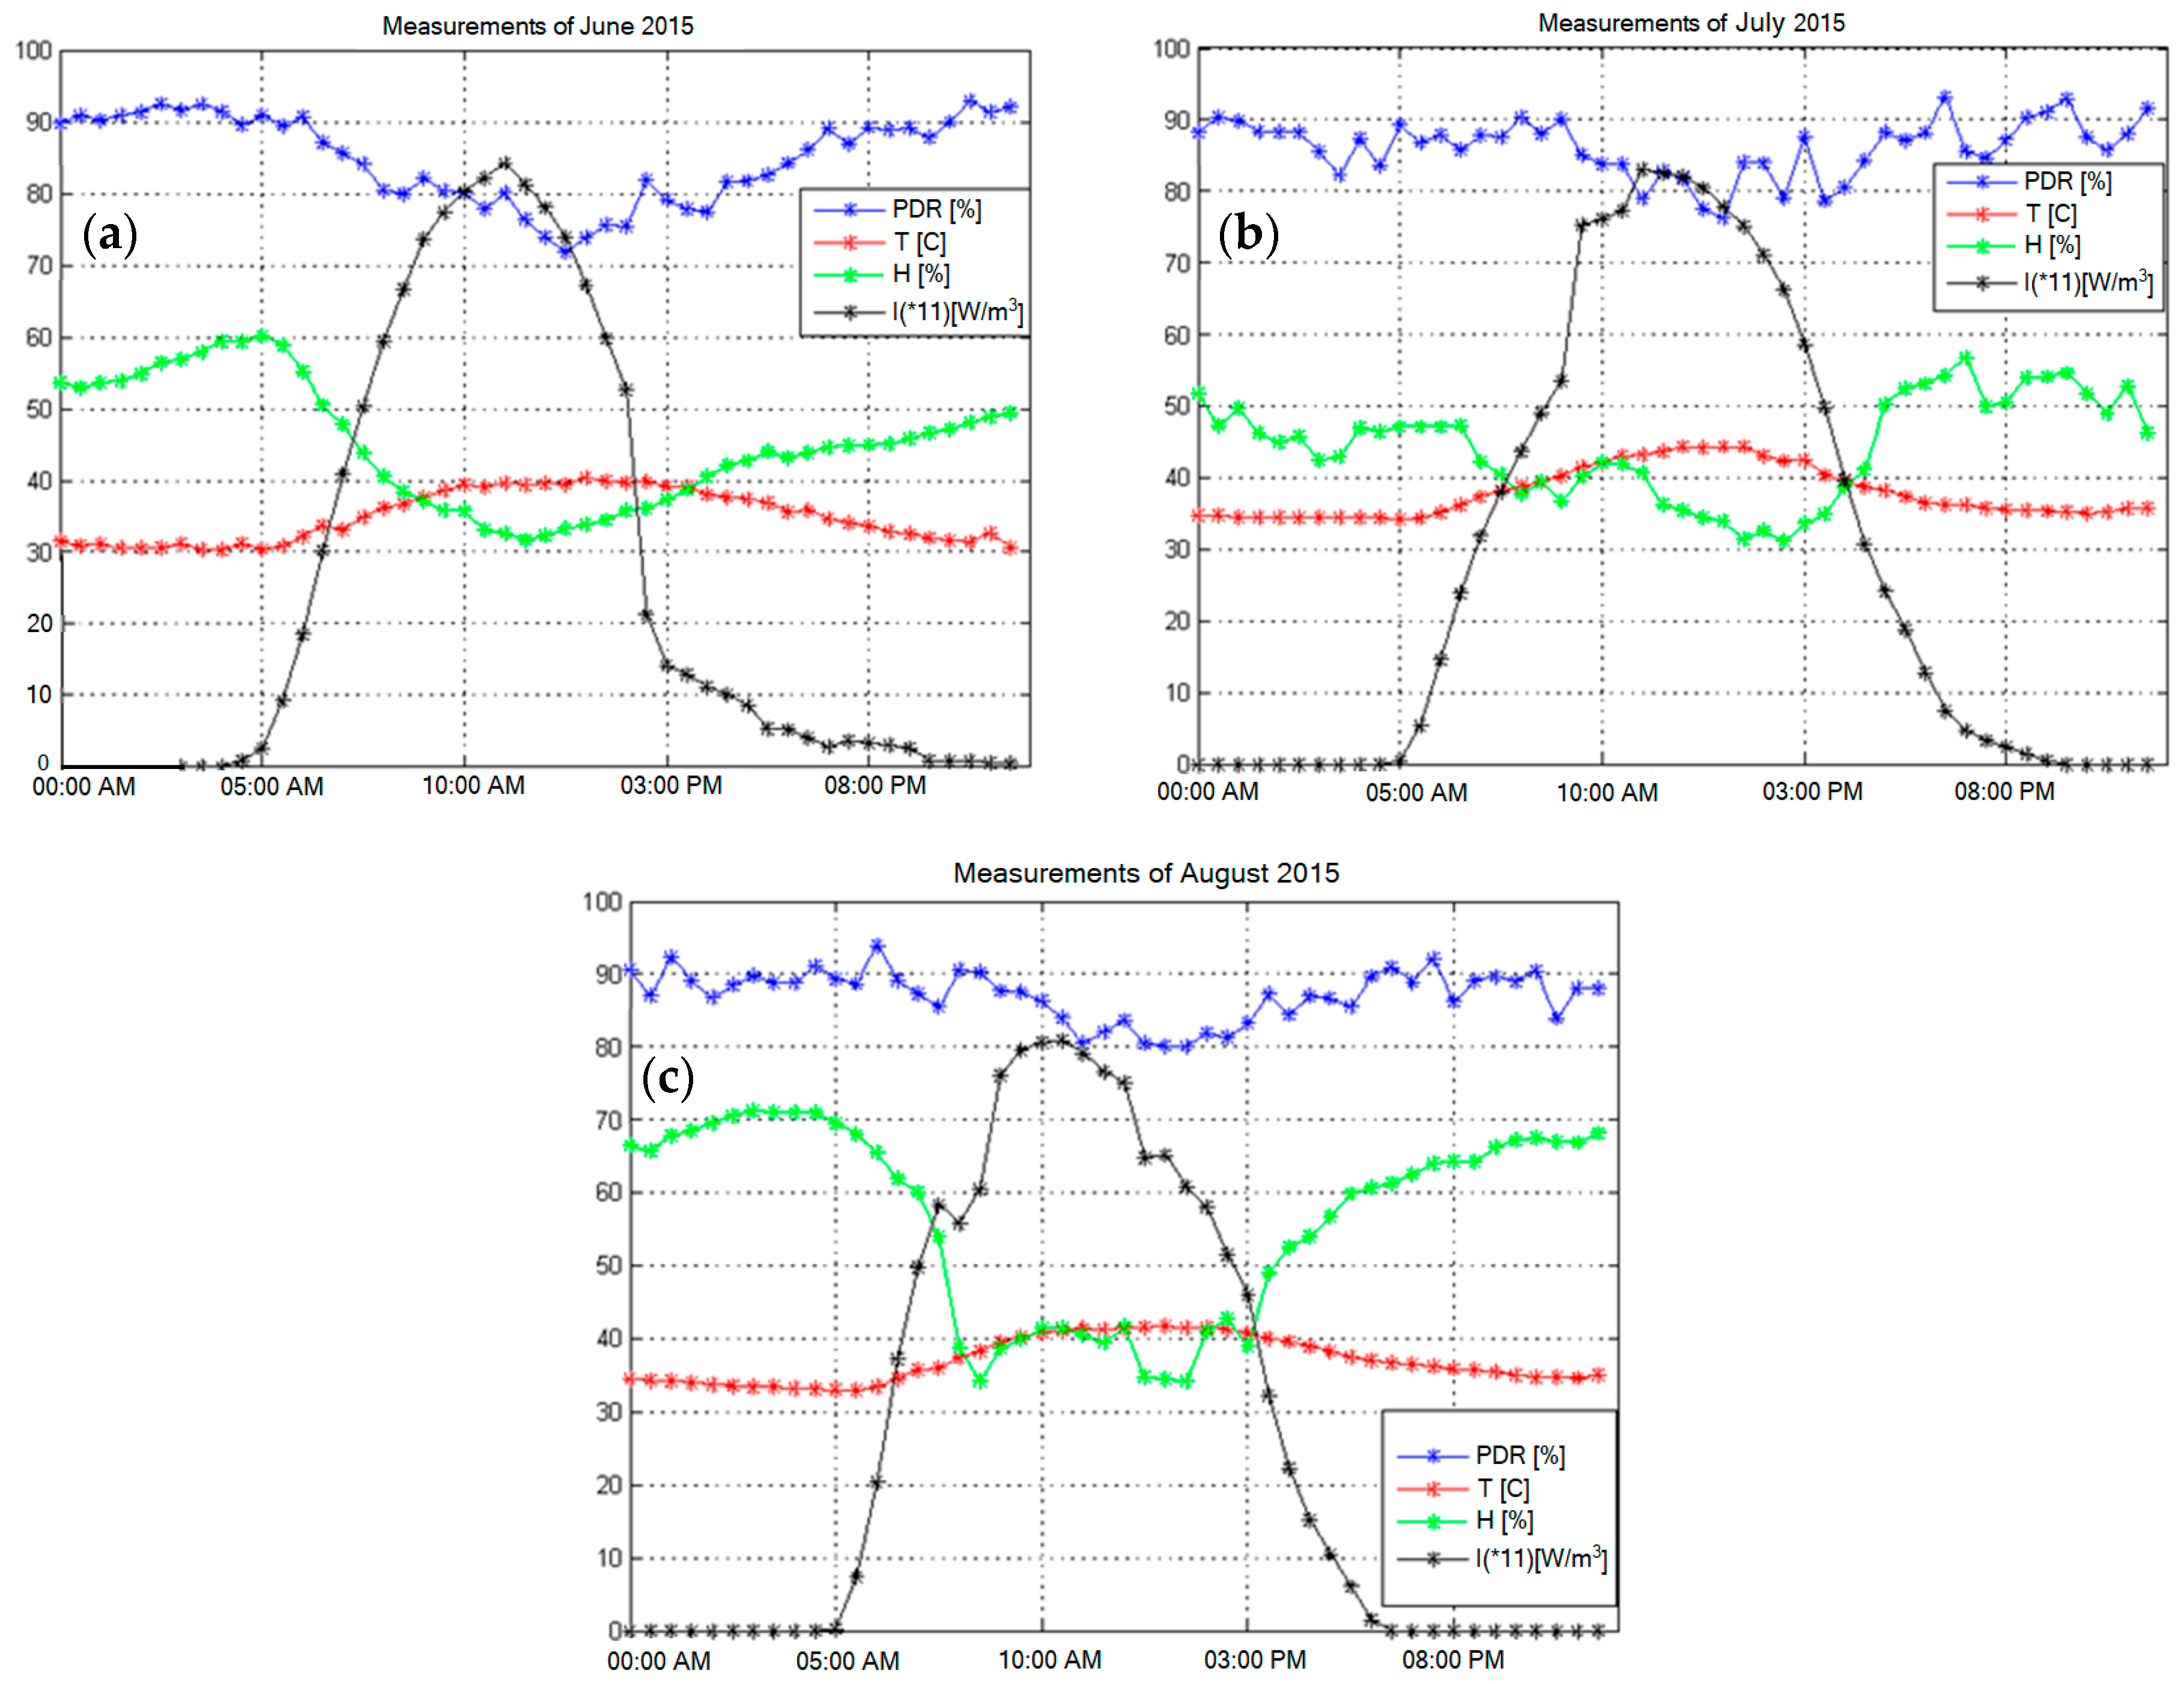
Figure 6 illustrates the average PDR variations along with the average Temperature (T), Humidity (H) and Irradiance (I) for June, July, and August (i.e., summer season). It is evident from the plots, that the FSO performance is not steady in the summer and changes significantly during the course of the day. For the three months, the plots have the same behavior: healthier PDR by nightfall and lowest PDR in the afternoon. In June when summer starts (highest temperature and solar irradiance), the FSO showed the lowest performance. In July when the temperature and solar irradiance are highest, the FSO performance is the lowest during the afternoon. It is also evident that there was a steady rise in temperature and solar irradiance in the afternoon of July which contributed a large degradation of the FSO performance, i.e., from 90% to 73% PDR. In the other months of July and August, the increase in the solar irradiance and the temperature were not as steady as June, and thus the effect was also not that intense, as the PDR was in the range of 80% to 90%. It follows that for June to August, one can conclude that the degradation is recorded from 09:00 AM to 03:00 PM where the PDR falls below 80%. However, at night and early morning, the PDR achieves a maximum of 92%.
The below results indicate that humidity varies opposite to temperature and that an increase in temperature can affect the FSO link more than an increase in humidity. In addition, the temperature increases with the solar irradiance. These two factors have a great impact on the FSO performance, which can also be validated from the regression analysis and t-test statistics shown in
Table 3.
High temperature and large amount of solar irradiance affect critically the FSO link and cause degradation of the link performance. From the results, a linear relation between temperature, humidity and irradiance can be seen. A strong relation is observed with the temperature and solar irradiance in all the 3 months compared to the humidity effect. The humidity is not high enough to cause degradation of the FSO link performance while the temperature was high enough to cause such degradation. Irradiance does not increase much with temperature, thus does not affect the performance much. However, from all the above results, it is evident that the temperature has a strong negative correlation with PDR, where it affects it highly in summer than in winter and spring.
After continuous tests of the FSO performance and correlating its performance with the weather factors and studying the refractive index variations, it is found that the temperature has the biggest and noticeable effect on FSO behavior than any other factors. This adds a more insight on what really affect FSO performance as compared to the previous results of the authors [
14].
There were interesting results during the winter and spring seasons, which could be further verified in
Figure 3, which shows the relation between PDR and the environment parameters for the winter and spring seasons from December until February. The environment parameters are not high enough to cause any effect to the FSO communication (refer
Table 4).
4. Closed Form Expression and Behavior of FSO Link Based on the Variation of the Strength of Atmospheric Turbulences
It is quite clear that the FSO performs better in Qatar during the winter than the summer and it is verified using the statistics with the data recorded in
Section 3. One more significant result seen in the previous section is the variation of PDR throughout the day in the different seasons. For a reliable communication, consistent communication link would be a requirement for application to avoid changing of communication links. This changing of communication links can lead to unnecessary delays. The PDR variation is very small or could be considered constant during a single day in winter, which is a great advantage in addition to high PDR; refer
Figure 3 and
Figure 4. Whereas during summer there is a great variation in PDR and fall less than 80 % during the middle of the day, refer
Figure 6.
The reason for this variation could be attributed to an environmental phenomenon called as scintillation [
1,
16,
17]. This phenomenon is the major reason for the degradation of the FSO communication link, which uses laser beams for transmitting information. The major environmental parameter that results in scintillation phenomenon is the higher levels of temperature and solar irradiance, which are more in summer than in winter. This clearly explains the reason for the greater degradation of FSO performance in summer than in winter.
In this section, we will support the obtained results by mathematical models developed and verified by the authors in [
18], which shows the effect of weather factors on FSO behavior. The models will help in relating the variation of the strength of atmospheric turbulence i.e.,
Cn2 with the environmental parameters. In addition, the authors will also provide a closed form expression relating the PDR with respect to the environmental parameters with the uncertainties.
The cumulative environmental parameter refractive index is depending on weather factor such as temperature, humidity, and solar irradiance, which is also considered as the strength of atmospheric turbulence. Experimentally, the refractive index can be measured directly using a scintillometer by measuring the variance of the fluctuations of received signal [
19,
20]. There are various models that can be used to get the refractive index such as the ones in [
20,
21]; three such models can be stated: Kopeika developed the first model in 1994. Later, this model is improved by Bendersky, Kopeika, and Blaunstein to present a new model called “the Rocky Terrain” (BKB) model. Based on these two models, the “Alternate BKB” model was developed in [
13]. All these models are using the environmental parameters such as temperature
T (Kelvin), Humidity
H (%), wind speed
v (m/s), solar flux SF (KW/m
2) and temporal hour of the day
Tth for calculating the refractive index parameter. The temporal hour is calculated based on the time of sunrise and sunset and the duration of one
Tth is 1/12 of the sunrise time subtracted from sunset time. The current temporal hour is the sunrise time subtracted from the current hour then divided by the duration of one
Tth. For each temporal hour exists a relative weight W and is given by [
22].
The previous models are given by [
22]. In this work, the adapted Alternate BKB model can be represented as follows
where
W is the weight function based on the temporal hour and given by [
22]. Based on the Alternate BKB model and on the data taken from the sensors installed at QU we can validate the cumulative effect of the environmental parameters on the FSO communication link in
Figure 7.
In
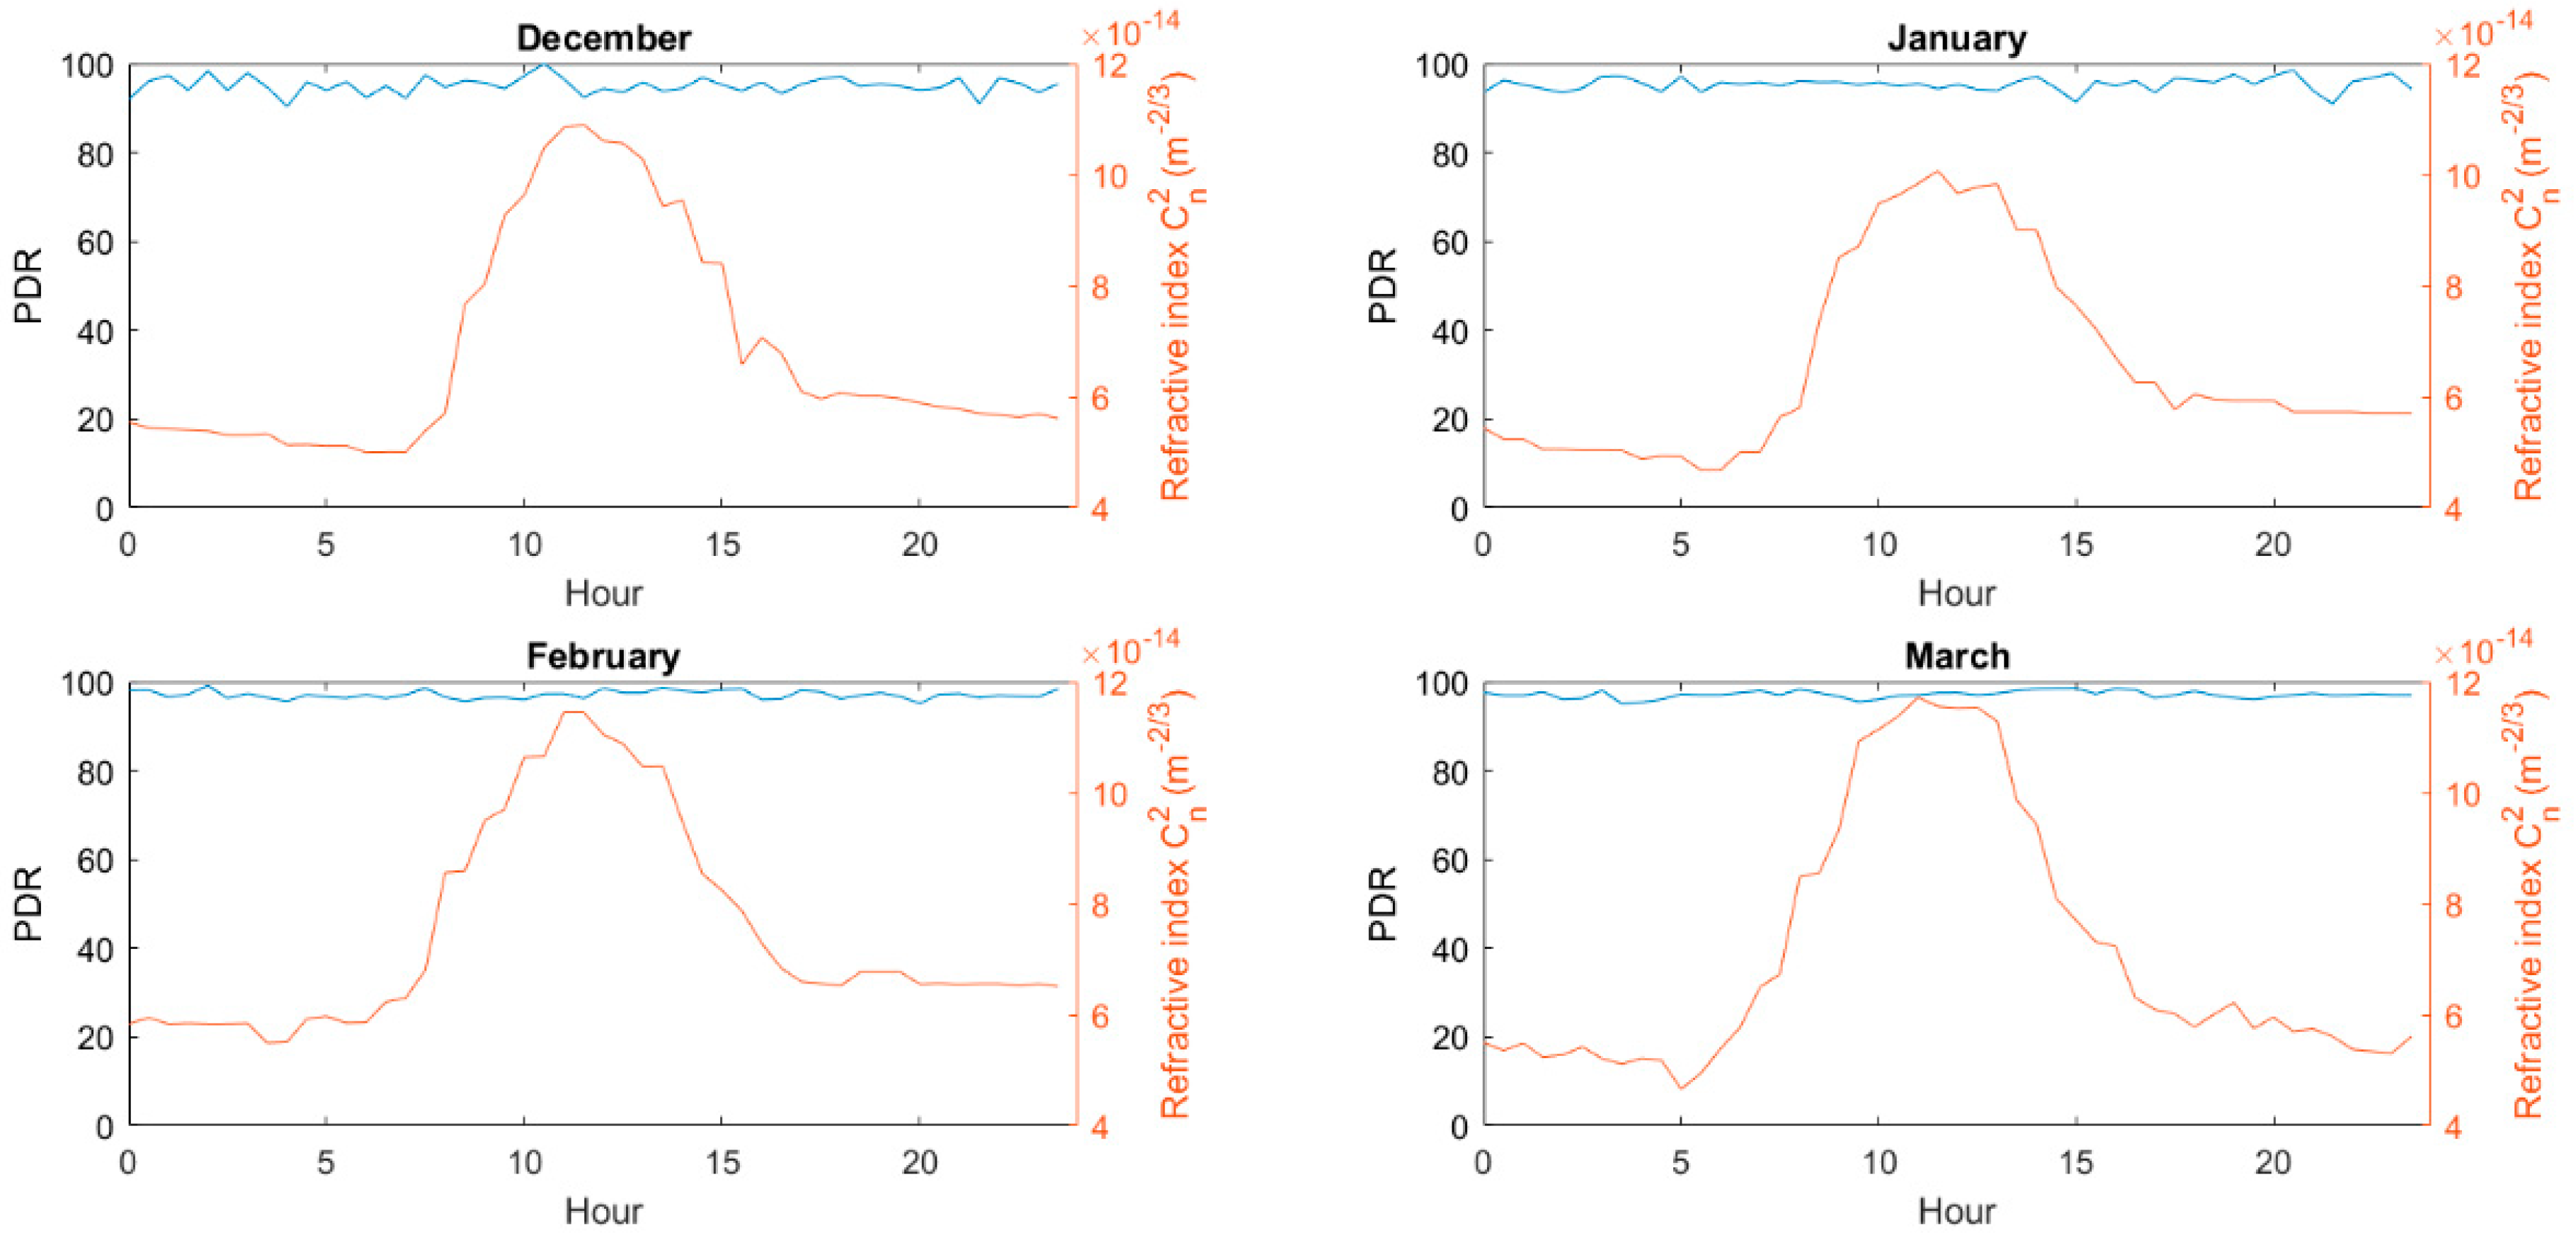
Figure 7, the variation of the refractive index for the duration of the day and the effect on the PDR for certain days of the month of December, January, February and March are presented. As shown,
Cn2 reaches its minimum at night, which is due to the absence of solar irradiance and low temperature at that time. Then starts increasing with the increase of temperature reaching a maximum in the middle of the day. The PDR during the above months are almost constant without much variation as they are not high enough to affect its performance, which could be seen in
Figure 7 and verified in the previous statistics shown in
Table 4 and
Figure 3 and
Figure 4.
From the plots, the selected day of March has the highest refractive index followed by the selected day of February. This is because these 2 months have the highest temperatures compared to the other months. However, the refractive index of the selected day of December is more than January, which is due to the higher temperature recorded for the day of December. Even during winter season, it is noticed that the strength of turbulence reaches a high level in the order of 10−13 m−2/3. This is due to the high temperature, which does not fall below the 14 °C. However, the temperature was not high enough to affect the constant performance of the FSO unlike summer where the temperature is high.
According to [
22,
23], the BKB model is valid only for a specific range of weather parameters. In fact, the temperature has to be between 9 °C and 35 °C, the relative humidity in the range of 14% and 92% and the wind speed between 0 and 10 m/s. However, in Qatar during summer season, as shown in the previous section, the weather factors exceed these thresholds. For this reason, the variation of refractive index during summer season is not presented. As discussed earlier, the strength of atmospheric turbulence is highly affected by the increasing temperature. Thus, a notable increase of refractive index during summer season can be seen.
The authors have deduced a closed form expression, from the large data collected from the FSO system and the weather station, for the months of June, July and August (summer in Qatar) and it can be used to estimate the FSO performance in terms of PDR using the Temperature, Humidity and Solar Irradiance Environment parameters. The closed form expression along with the statistics are shown below:
In the above expression T is Temperature in Celsius, H is the Relative Humidity in % and I is the Solar Irradiance in W/m2. The closed form expression can be estimated to have a Maximum Linearity Error of 0.44%, which can be considered as a considerably good estimation. Similar expressions were not found for the rest of the months as seen in the previous sections that the environment factors were not affecting the PDR during the other months, as they were sufficiently.

 ,
, 


