Article

Position- and Angle-Specific Variation in the Bilateral Deficit in Hamstring Isometric Strength: A Comparative Analysis


by
Aleksandar Rajkovic
1,
Amador García-Ramos
2,3,*,
Nejc Šarabon
4,5,
Olivera M. Knežević
1 and
Dragan M. Mirkov
1
1
Faculty of Sport and Physical Education, University of Belgrade, 11000 Belgrade, Serbia
2
Department of Physical Education and Sport, Faculty of Sport Sciences, University of Granada, 18012 Granada, Spain
3
Department of Sports Sciences and Physical Conditioning, Faculty of Education, Universidad Católica de la Santísima Concepción, Concepción 4090541, Chile
4
Faculty of Health Sciences, University of Primorska, 6000 Izola, Slovenia
5
Ludwig Boltzmann Institute for Rehabilitation Research, 3100 Vienna, Austria
*
Author to whom correspondence should be addressed.
Appl. Sci. 2026, 16(6), 2852; https://doi.org/10.3390/app16062852
Submission received: 5 February 2026 / Revised: 7 March 2026 / Accepted: 13 March 2026 / Published: 16 March 2026
(This article belongs to the Special Issue Biomechanical Analysis for Sport Performance)

Abstract

This study investigated how varying body positions (seated, prone, supine) and knee joint angles (90°, 120°, 150°) influence the bilateral deficit (BD) in isometric hamstring strength. Thirty physically active participants (15 males, 15 females) performed unilateral and bilateral maximal voluntary isometric contractions (MVICs) across the tested position × angle conditions. Peak force (Fmax) and rate of force development (RFD) measures (RFDmax, RFD50 ms, and RFD200 ms) were recorded. Results indicated that the seated position elicited a greater bilateral deficit (i.e., lower BD ratios) than the prone and supine positions, with differences that were more pronounced at more extended knee angles. These findings underscore the importance of considering position- and angle-specific influences when assessing BD in hamstring strength. Clinicians and researchers should standardize testing protocols to ensure accurate evaluation and data interpretation. From an applied standpoint, the results support the development of resistance-training strategies aimed at enhancing hamstring function at long muscle lengths—an approach relevant to both performance optimization and injury prevention.

1. Introduction

The hamstring muscle group plays a pivotal role in both athletic performance and injury prevention, particularly due to its function in knee stabilization, hip extension, and dynamic movement control [1,2,3,4]. Given their susceptibility to injuries, accurate and reliable assessment of hamstring muscle strength is crucial for athletes, clinicians, and researchers [5,6,7,8]. Currently, isometric testing represents one of the most common methods for assessing hamstring strength due to its safety, simplicity, and strong correlation with dynamic functional performance [9,10]. Typically, these isometric tests vary in terms of body positions (seated, prone, supine) and joint angles (e.g., 90°, 120°, 150°), significantly affecting muscle length–tension relationships and muscle activation patterns, thus potentially influencing strength outcomes and functional interpretations [11,12,13,14,15]. Moreover, both unilateral and bilateral strength assessments are commonly utilized, each offering different insights into neuromuscular function [16,17].
Among field-based hamstring strength tests, the Nordic Hamstring Exercise (NHE) is one of the most widely utilized, particularly for its eccentric-only, bilateral knee flexion action performed from a kneeling posture [8,18]. However, the bilateral eccentric-only NHE has limited applicability for neuromuscular profiling techniques such as bilateral deficit analysis or angle-specific torque measurement [19]. Moreover, studies comparing NHE torque with isometric hamstring strength have shown poor correlations (e.g., r ≈ 0.24–0.30), suggesting that NHE performance reflects a distinct muscle function from that captured by isometric testing [8,20]. Additionally, electromyography (EMG)-based comparisons between unilateral and bilateral NHE variants reveal significant differences in muscle activation, particularly in the biceps femoris, further highlighting the specificity of unilateral isometric testing for understanding neuromuscular asymmetries [21]. Taken together, these considerations support the use of controlled isometric testing as a practical approach to quantify bilateral deficit (BD) across standardized joint configurations in the present study.
The bilateral deficit (BD) is a neuromuscular phenomenon defined as a lower maximal voluntary force output during simultaneous bilateral contractions compared with the sum of unilateral contractions of each limb performed independently [22,23]. BD has been proposed to reflect neural mechanisms (e.g., inter-hemispheric inhibition and specific patterns of motor unit recruitment), although these mechanisms were not directly measured in the present study [24,25]. Emerging evidence also highlights the relevance of lower-limb neuromuscular function, including bilateral performance characteristics, to athletic performance outcomes such as change in direction (CoD), sprinting, and jump efficiency [26,27]. Furthermore, the potential for bilateral facilitation or inhibition to vary across populations and testing modalities underlines the need for controlled methodological assessment [23].
In the present study, BD is expressed as a ratio (BD ratio = X_bilateral/(X_unilateral_left + X_unilateral_right)), where X denotes the outcome metric for which BD is computed (e.g., peak force [Fmax], mean force, RFDmax, RFD50 ms, or RFD200 ms), obtained under the respective contraction condition; values < 1 indicate a bilateral deficit, whereas values > 1 indicate bilateral facilitation. Because the practical meaning of a given BD magnitude can depend on the task and sport context and there is no single universally accepted threshold, we focus on between-condition comparisons and report effect sizes to aid interpretation.
Despite the known influence of joint angles and body positions on hamstring muscle activation and force production, the specific effects of these variables on the magnitude of BD remain unclear. Prior work has shown that body position and joint configuration can meaningfully alter hamstring force output and neuromuscular activation during isometric testing [12,13,14], but whether these methodological factors systematically modify BD ratios across conditions has not been established. Thus, a systematic investigation into how varying joint angles and assessment positions influence BD during isometric contractions of the hamstring muscles is warranted. Therefore, the primary aim of this study was to examine the effects of body position (seated, prone, supine) and joint angle (90°, 120°, 150°) on BD during maximal and rapid force-generation tasks in the hamstring muscles. Based on length–tension relationships and theoretical neurophysiological considerations, we reasoned that bilateral motor-control constraints and inter-hemispheric inhibitory interactions can reduce net neural drive during simultaneous bilateral contractions relative to unilateral efforts [23,24]. Accordingly, testing configurations with less favorable muscle length–tension (e.g., seated at extended knee angles) may accentuate such constraints and yield lower BD ratios. We hypothesized that BD would differ across positions and angles, with greater deficits expected in the seated position, particularly at more extended joint angles (120° and 150°).

2. Methods

2.1. Participants

Thirty physically active, healthy young sport science students (15 males, 15 females) from the Faculty of Sport and Physical Education, University of Belgrade (Belgrade, Serbia), volunteered to participate in the study. Participants were classified as physically active based on the International Physical Activity Questionnaire (IPAQ) criteria, and were excluded if they reported a history of lower-extremity injury that could affect testing. Two participants reported the left leg as dominant, while the remaining 28 reported the right leg as dominant; leg dominance was recorded for descriptive purposes and was not included in the primary analyses. Participants were advised to refrain from any strength training for 3 days before the first experimental session and throughout the study period.
Participant characteristics (mean ± SD) were: males—age 24.2 ± 3.1 years, height 187.6 ± 6.3 cm; females—age 23.1 ± 2.0 years, height 170.8 ± 6.8 cm; total sample—age 23.7 ± 2.6 years, height 179.2 ± 10.7 cm, body mass 75 ± 14 kg.
Participants were informed about the study’s procedures, risks, and benefits, and provided written informed consent before participation. No financial or other incentives were provided. The Institutional Review Board approved the study protocol of the Ethics Committee of the Faculty of Sport and Physical Education, University of Belgrade (approval No. 02-993/23-1; 10 May 2023).

2.2. Study Design and Experimental Protocol

A cross-sectional, repeated-measures study design was used to investigate the presence and consistency of BD in isometric hamstring muscle performance under eight different testing conditions. The study was conducted at the Faculty of Sport and Physical Education, University of Belgrade, during May, June, and July of 2023. Data collection was conducted over four sessions, consisting of one familiarization session followed by three experimental sessions. The first experimental session included two tests (seated position at 120° and 150°), while the second and third sessions consisted of three tests each (prone and supine positions at 90°, 120°, and 150°). Each participant completed the experimental protocol over approximately 1 week, with a minimum of 48 h (typically two days) of rest between sessions to minimize fatigue effects.
Isometric strength of the hamstring muscles was assessed unilaterally and bilaterally (both legs simultaneously, with forces recorded independently). Testing was performed in the following positions (Figure 1):
(a)
Seated position with 110° hip flexion and knee joint angles of 120° and 150°
(b)
Prone position (lying face down) with knee joint angles of 90°, 120°, and 150°
(c)
Supine position (lying on the back) with knee joint angles of 90°, 120°, and 150°
The order of testing conditions (combination of positions and specific joint angles) was randomized to avoid potential order effects. Each condition was tested under unilateral (left and right legs tested separately) and bilateral efforts, with participants performing three maximal voluntary isometric contractions (MVICs) per effort, resulting in a total of nine contractions per testing condition. The order of unilateral (left/right) and bilateral efforts was randomized within each condition. Participants were tested individually. A minimum of 30 min of rest was provided between different test conditions, and 2 min of rest were given between each contraction within the same test condition to manage cumulative fatigue.
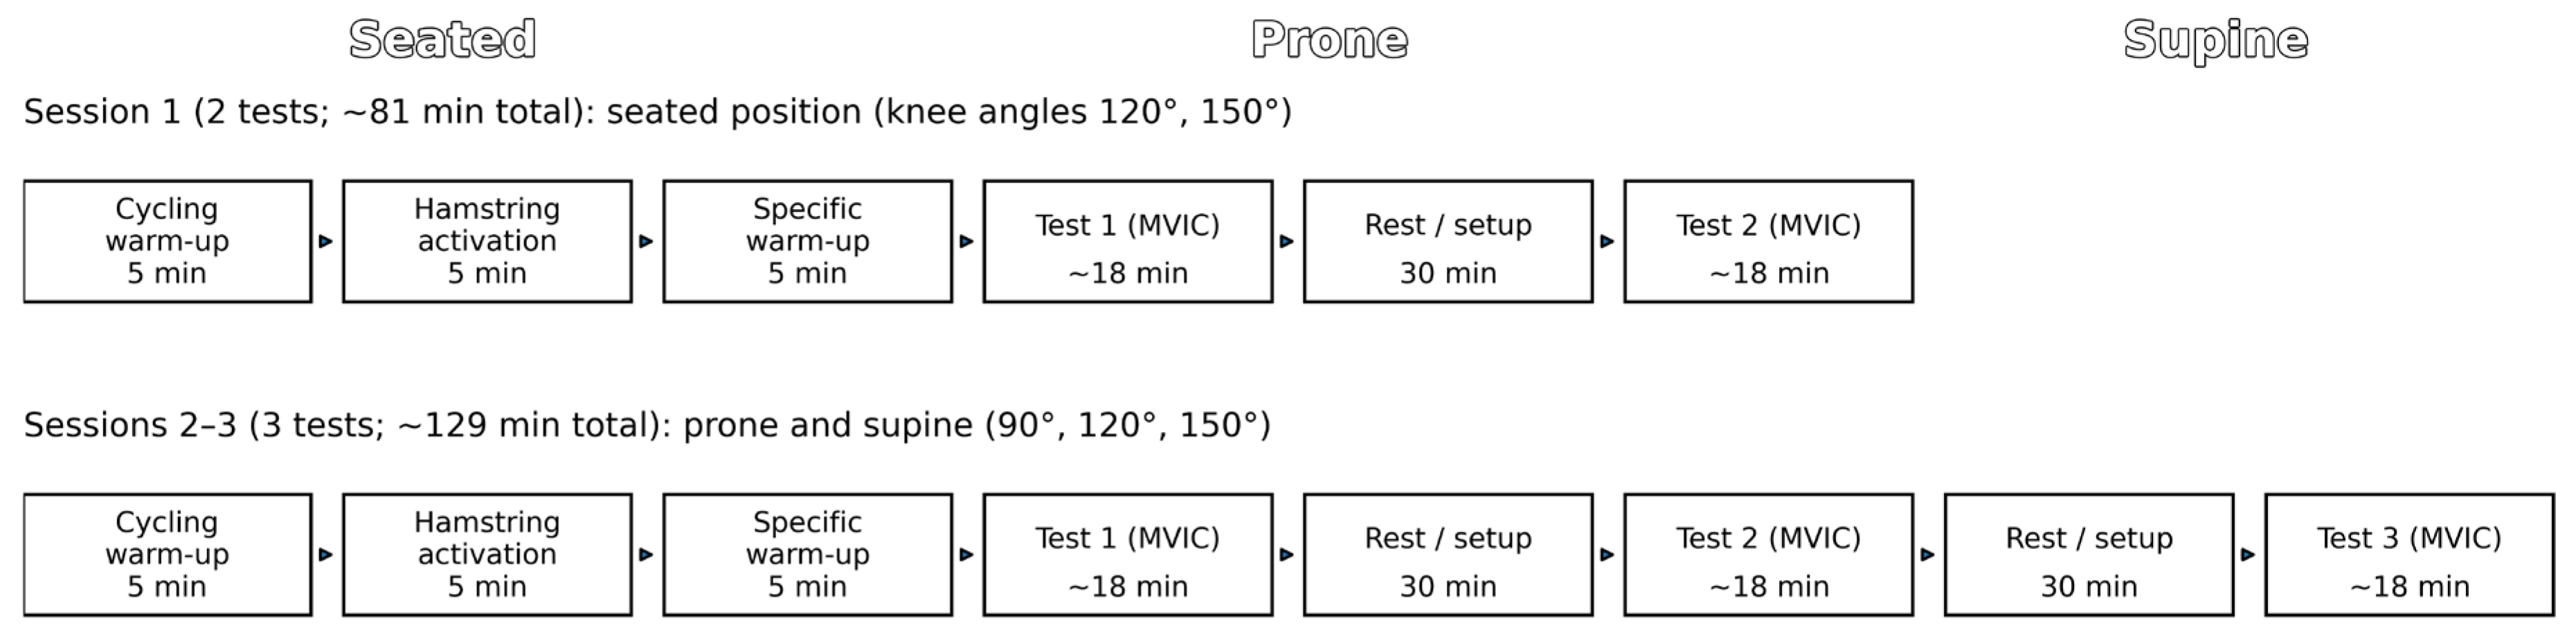
The two-test experimental session lasted approximately 80 min, whereas the three-test sessions lasted approximately 130 min. All sessions followed the same standardized sequence of warm-up, testing, and rest intervals (Figure 2).
The general warm-up included 5 min of cycling on an ergometer followed by 5 min of mat-based hamstring activation exercises. The specific warm-up consisted of bilateral isometric hamstring contractions performed over a 5 min period. During this time, participants gradually increased contraction intensity over three progressive efforts at 50%, 70%, and 90%, followed by a single contraction at 100% intensity. Participants were instructed to pull their heels back as quickly and forcefully as possible upon receiving the verbal cue “pull.” Each contraction lasted approximately 5–6 s and was accompanied by continuous auditory stimulation to encourage maximal effort and consistency. All tests were conducted at the same time of day for each participant, under similar environmental and temperature conditions. Prior to testing, participants completed both general and specific warm-up routines.

2.3. Data Collection and Analysis

This section describes signal processing and outcome derivation from the force–time recordings. Hamstring isometric strength was measured using a commercially available device (“All4Gym”, Belgrade, Serbia). Force signals were sampled at 1000 Hz and digitally processed to calculate peak force and rate of force development measures. Raw force–time signals were analyzed offline using MATLAB (MATLAB and Statistics Toolbox Release R2023b; The MathWorks, Inc.: Natick, MA, USA, 2023; https://www.mathworks.com/products/matlab.html (accessed on 5 March 2026)). Peak force (Fmax) was defined as the highest force value recorded during each trial. The maximum rate of force development (RFDmax) was calculated as the peak value of the first derivative of the force–time curve. Timed RFD measures (RFD50 ms and RFD200 ms) were calculated by averaging the slopes of the force–time curve over the respective time intervals, using 1 ms increments following the onset of contraction. Force onset was defined as the point at which the derivative of the force–time curve exceeded 5% of the maximal derivative value. This relative threshold was selected to reduce sensitivity to baseline noise and to provide a consistent onset criterion across trials; all trials were processed using the same algorithm and visually inspected for plausibility.
Bilateral deficit (BD) was quantified as a ratio: BD ratio = X_bilateral/(X_unilateral_left + X_unilateral_right), where X_bilateral represents the mean value of the outcome metric X obtained during bilateral trials (both legs simultaneously) and X_unilateral_left and X_unilateral_right represent the corresponding mean values obtained during unilateral trials for each leg. This computation was applied to all outcomes reported in the present study (Fmax, RFDmax, RFD50 ms, and RFD200 ms). Values < 1 indicate a bilateral deficit, values > 1 indicate bilateral facilitation, and values closer to 1 indicate a smaller deficit.

2.4. Statistical Analysis

This section describes the inferential statistical procedures used to test the study hypotheses. Data were analyzed using linear mixed-model analyses with repeated measures for the factors of body position (seated, prone, supine) and joint angle (90°, 120°, 150°). Pairwise comparisons were conducted using Bonferroni corrections to control for multiple comparisons, with statistical significance set to p < 0.05. Partial eta squared (η2p) was calculated to quantify the magnitude of main effects and interactions, representing the proportion of variance in each dependent variable (Fmax, RFDmax, RFD50 ms, RFD200 ms) explained by the independent factors and their interaction. Effect size interpretation for partial eta squared was defined as small (η2p = 0.01), medium (η2p = 0.06), and large (η2p = 0.14). Additionally, Cohen’s d was computed for significant pairwise comparisons to quantify the standardized mean difference between conditions, interpreted as small (d = 0.20), medium (d = 0.50), or large (d = 0.80). All analyses were performed in Python (Python 3.14.2) using Statsmodels and SciPy. To contextualize the sample size, we conducted a post hoc sensitivity analysis for within-subject (paired) contrasts (two-tailed α = 0.05). With n = 30, the design provides 80% power to detect effects of approximately Cohen’s dz ≥ 0.53. Within-session stability was examined by comparing the 1st and 3rd MVIC attempts (collapsed across conditions) separately for bilateral and unilateral efforts using paired t-tests. Sex was not included as a covariate or interaction factor in the primary analyses because the study aim was to characterize BD ratios across positions and knee joint angles in the cohort as a whole. Although the sample was balanced by sex, the study was not designed to provide adequately powered inference for sex-by-condition interactions across multiple outcomes; therefore, sex-specific effects were not tested and are recommended for future targeted studies.

3. Results

Descriptive statistics for unilateral and bilateral measures used to calculate bilateral deficit (BD) are presented in Table 1, while BD ratios (mean (SD)) and the corresponding main effects, interaction effects, and effect sizes are summarized in Table 2.
Table 1 shows that absolute unilateral-sum and bilateral Fmax and RFD values generally increased with more extended knee angles and were highest in the seated position at 120–150°. In contrast, Table 2 (Panel A) indicates that despite these higher absolute values, the seated configuration—especially at 150°—elicited the lowest BD ratios (i.e., the largest deficits), whereas prone and supine conditions exhibited BD ratios closer to 1.0.
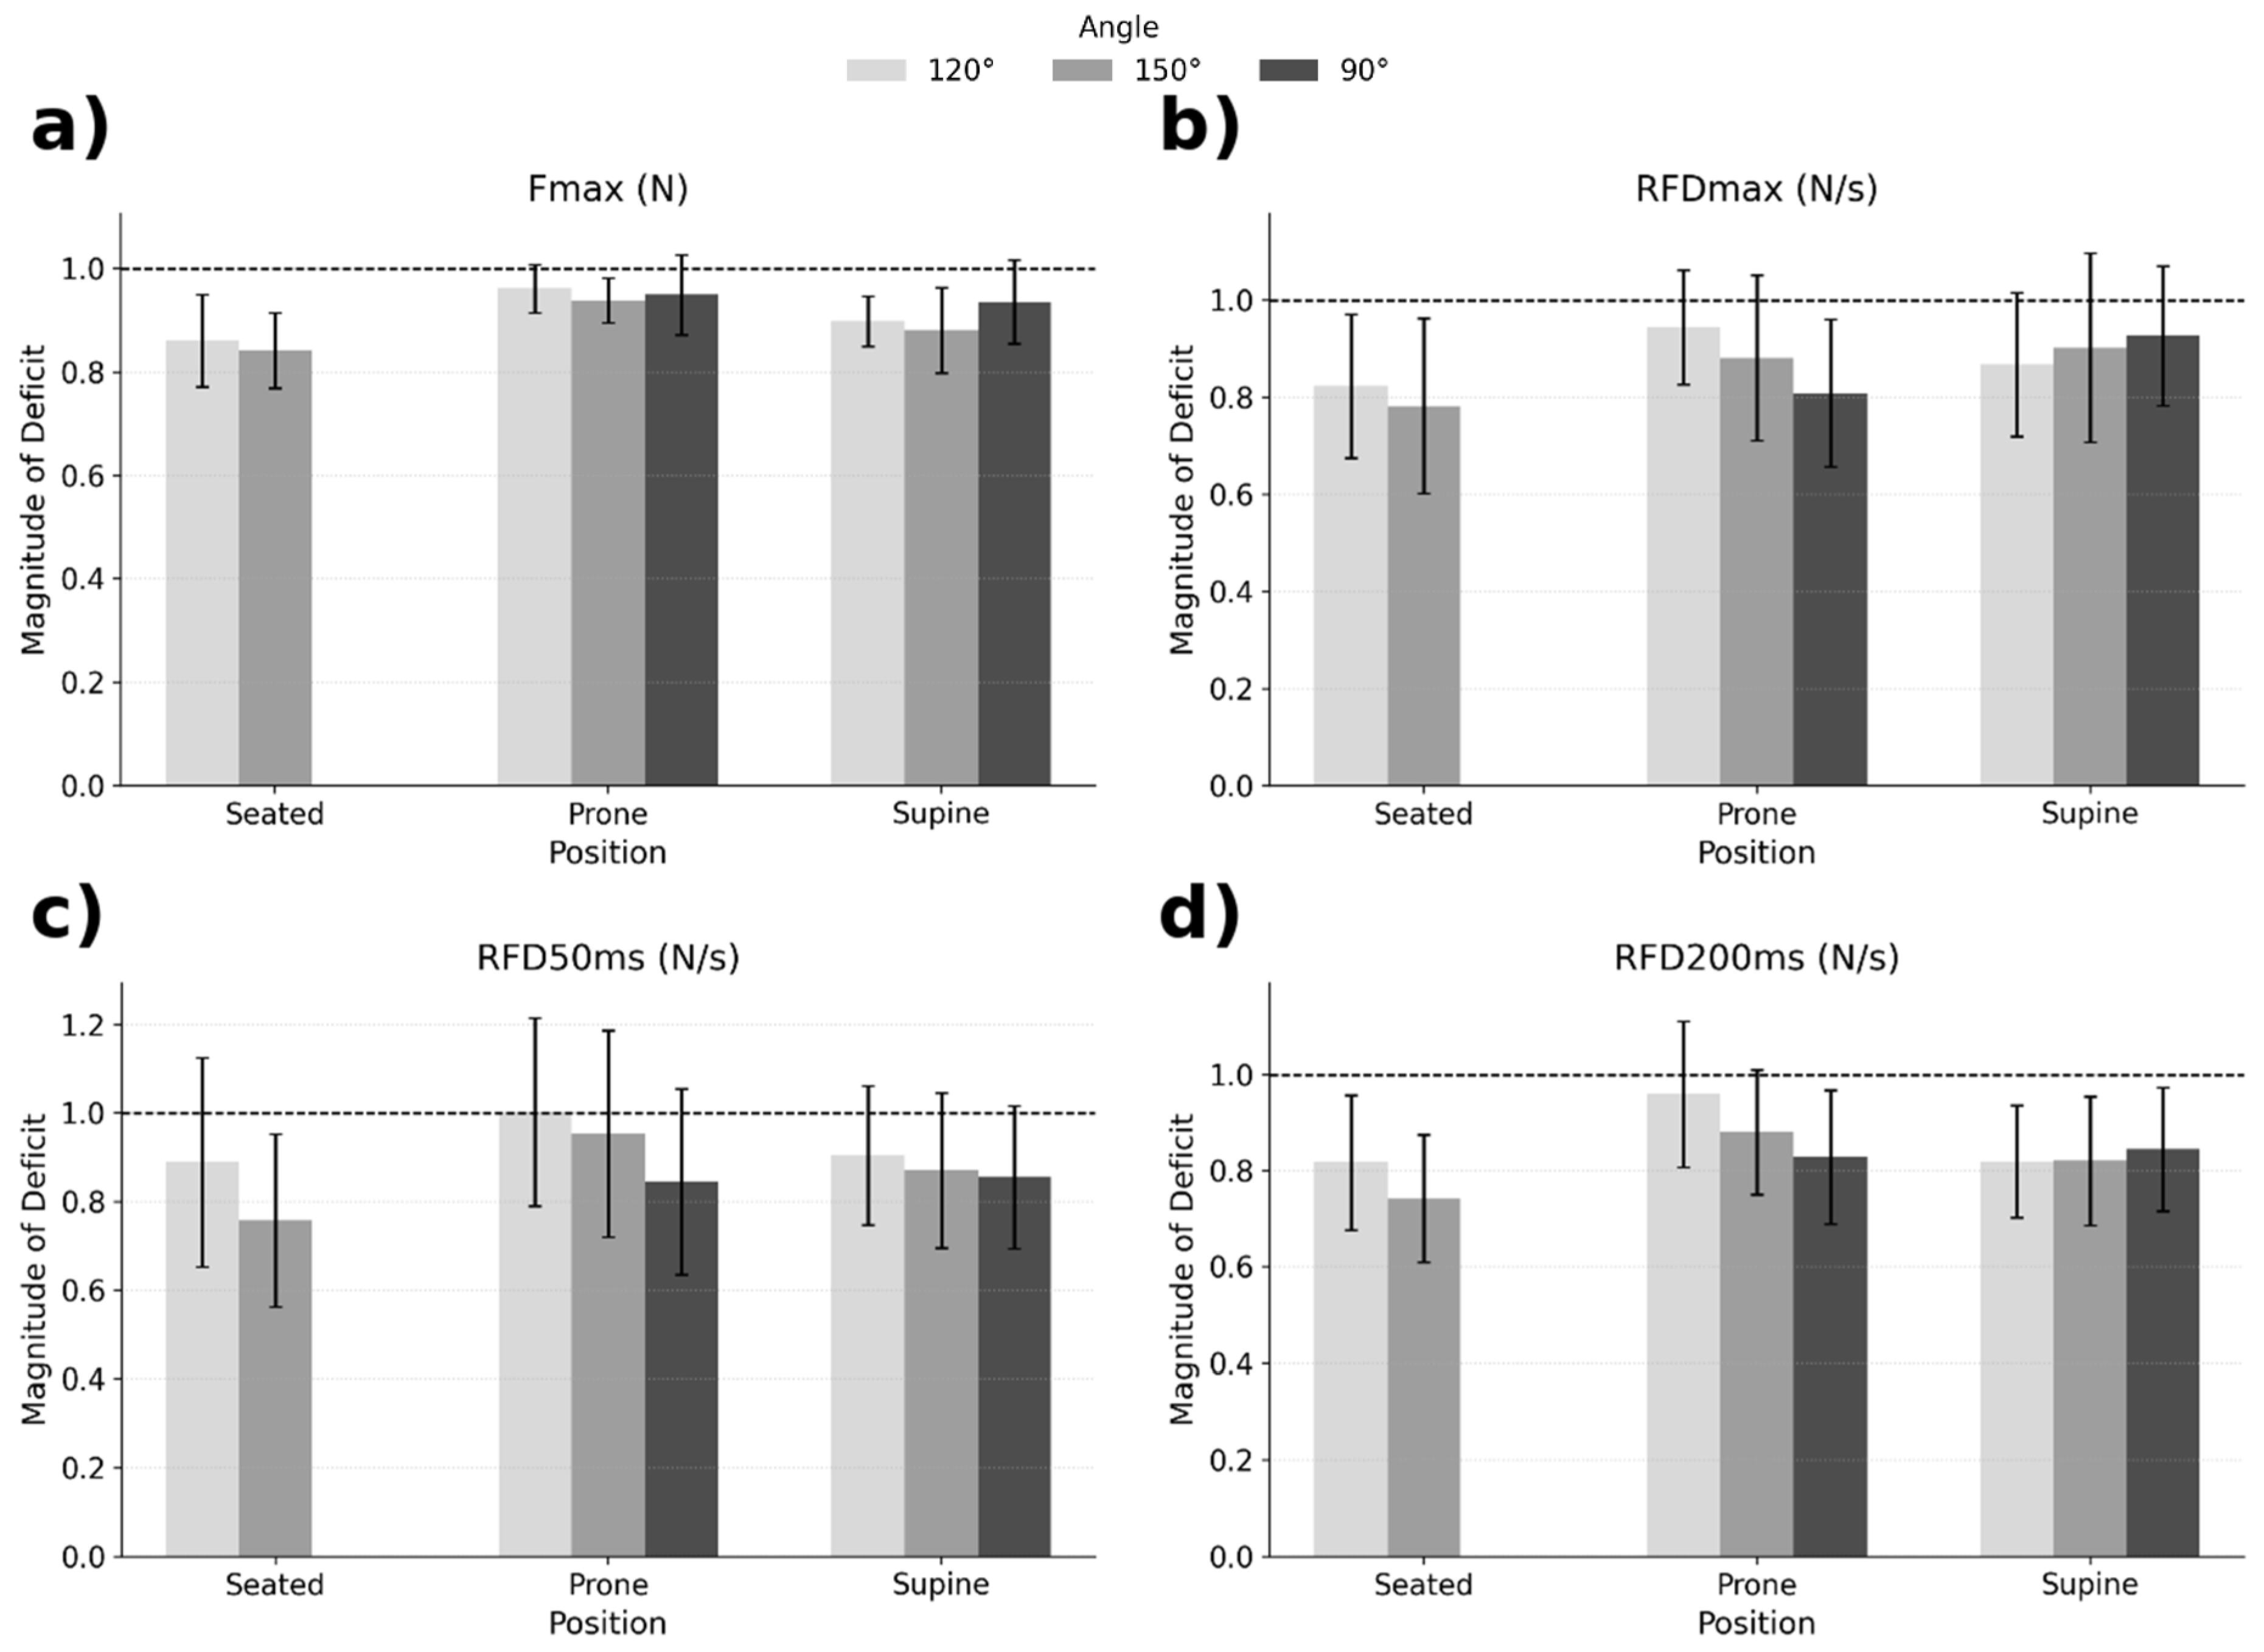
A linear mixed-model analysis revealed significant main effects of position and angle, as well as position × angle interactions, for all BD outcomes (Table 2, Panel B). For Fmax, the seated position showed a greater bilateral deficit (lower BD ratios) than the prone and supine positions, particularly at 120° and 150° (Figure 3a). For RFDmax, deficits were also greater in the seated position compared with the prone position at 120° and compared with the supine position at 150° (Figure 3b). For RFD50 ms, the seated position at 150° displayed the greatest deficit compared with the prone position (Figure 3c), whereas for RFD200 ms deficits were higher in the seated position compared with the prone position at 120° and 150° (Figure 3d). Although some overlap in SD was evident—especially for RFD measures—the overall patterns were consistent across outcomes. Practically, BD ratios were smallest in the seated 150° condition (e.g., Fmax ≈ 0.84) and closest to 1.0 in prone/supine conditions (Table 2, Panel A).
Representative paired effect sizes for the key contrast in Fmax BD ratio (prone vs. seated) were large at 120° (dz = 1.01) and 150° (dz = 1.19).
Within-session stability analysis indicated no systematic decline in peak force across attempts (bilateral: +1.06%, p = 0.053; unilateral: +0.45%, p = 0.445). In contrast, bilateral explosive measures showed a small reduction across repeated attempts (RFDmax: −5.60%, p = 0.0035; RFD50 ms: −6.64%, p = 0.0033; RFD200 ms: −4.94%, p = 0.0038), whereas unilateral RFD measures did not change (all p ≥ 0.316). As a sensitivity check, BD ratios recalculated using the 1st attempt only yielded the same between-condition patterns (e.g., seated < prone/supine at 120° and 150° across outcomes), indicating that the primary conclusions are unchanged.

4. Discussion

The purpose of this study was to examine how body position (seated, prone, supine) and knee joint angle (90°, 120°, 150°) influence bilateral deficit (BD) ratios during maximal and rapid isometric hamstring force production. By systematically comparing commonly used testing configurations, the present findings provide practical guidance for standardizing hamstring BD assessment across laboratory and applied settings.

4.1. Position Effects on BD

Across outcomes, the seated position generally elicited greater bilateral deficits (lower BD ratios) than prone and supine positions (Table 2; Figure 3). In contrast, prone and supine configurations tended to show smaller deficits, with BD ratios closer to 1.0, suggesting that these positions may better preserve bilateral force expression under the tested conditions. Notably, BD ratios did not exceed 1.00 in any condition, indicating no clear bilateral facilitation in the present dataset.
BD tended to be more pronounced at more extended knee angles, particularly in the seated position (Table 2). For example, for Fmax the mean BD ratio in the seated position decreased from approximately 0.86 at 120° to approximately 0.84 at 150°, whereas prone and supine conditions generally maintained higher ratios (approximately 0.94–0.96). These differences correspond to approximately 10% lower bilateral force expression relative to the unilateral sum in the seated 150° condition compared with prone 150° (Table 2, Panel A), and were accompanied by large model effect sizes (Table 2, Panel B).

4.2. Potential Neuromechanical Explanations

Because neural activity was not directly measured, the following explanations should be considered plausible interpretations rather than confirmed mechanisms. In the seated position, the hamstrings operate at longer muscle lengths due to concurrent hip flexion and knee extension, which may increase passive tension and alter neuromuscular activation strategies [28,29]. Such length-dependent changes could contribute to a greater bilateral deficit under seated, extended-angle conditions. Conversely, prone and supine positions may reduce stretch-related constraints, potentially allowing more effective bilateral activation and thereby smaller deficits.

4.3. Practical Implications

From an applied perspective, the magnitude of BD depends on the testing configuration; therefore, clinicians and practitioners should standardize position and angle when monitoring BD over time or comparing individuals. The present results suggest that seated testing—especially at extended angles—may yield larger bilateral deficits, whereas prone and supine positions may provide BD ratios closer to 1.0 (Table 2). These findings may inform strength assessment and training decisions where long muscle-length hamstring function is of interest, while recognizing that BD is not universally ‘good’ or ‘bad’ and may relate differently to unilateral- versus bilateral-dominant sport actions.
Several limitations should be considered. Detailed training-history variables (e.g., unilateral versus bilateral training exposure) were not examined as moderators of the observed effects and should be considered in future work. First, the sample consisted of healthy, physically active young adults, which limits generalizability to elite athletes, injured populations, and older adults. Second, electromyographic (EMG) data were not collected; therefore, neural explanations remain speculative. Third, sex-specific effects were not examined in the present analyses. Although the sample was balanced by sex, the study was not designed to provide adequately powered inference for sex-by-condition interactions across multiple outcomes; therefore, we focused on cohort-level effects and recommend future studies specifically powered for such analyses. Fourth, no prospective (a priori) power analysis was conducted before data collection; however, a post hoc sensitivity analysis indicated that with n = 30, the study had 80% power to detect within-subject effects of approximately dz = 0.53, and key contrasts were larger (e.g., prone vs. seated for Fmax BD ratio at 120° dz = 1.01 and at 150° dz = 1.19). Future work should nevertheless include formal a priori sample-size planning. We also observed a small within-session reduction in bilateral RFD outcomes across repeated attempts (approximately 5–7%), whereas peak force remained stable; importantly, sensitivity analyses using the first attempt only yielded the same between-condition patterns. Finally, due to constructional limitations of the testing setup, the 90° angle in the seated position was not measured.
In conclusion, body position and knee angle significantly influence BD during maximal and rapid hamstring force production, with larger deficits generally observed in the seated position and at more extended knee angles. These findings highlight the need for consistent protocols and cautious interpretation of BD values outside the studied population and testing configurations.

Author Contributions

Conceptualization, A.G.-R., N.Š., O.M.K. and D.M.M.; Methodology, A.G.-R., N.Š., O.M.K. and D.M.M.; Formal analysis, A.R. and D.M.M.; Data curation, A.R.; Writing—original draft preparation, A.R. and D.M.M.; Writing—review and editing, A.R., A.G.-R., N.Š., O.M.K. and D.M.M. All authors have read and agreed to the published version of the manuscript.

Funding

This research received no external funding.

Institutional Review Board Statement

The study was conducted according to the guidelines of the Declaration of Helsinki and approved by the Institutional Review Board of the University of Belgrade, Faculty of Sport and Physical Education—#02-993/23-1 (Approved on: 10 May 2023).

Informed Consent Statement

Written informed consent was obtained from all subjects involved in the study.

Data Availability Statement

The data presented in this study are available on request from the corresponding author.

Conflicts of Interest

The authors declare no conflicts of interest.

References

  1. Aagaard, P.; Simonsen, E.B.; Andersen, J.L.; Magnusson, S.P.; Bojsen-Møller, F.; Dyhre-Poulsen, P. Antagonist muscle coactivation during isokinetic knee extension. Scand. J. Med. Sci. Sports 2000, 10, 58–67. [Google Scholar] [CrossRef]
  2. Chumanov, E.S.; Heiderscheit, B.C.; Thelen, D.G. The effect of speed and influence of individual muscles on hamstring mechanics during the swing phase of sprinting. J. Biomech. 2007, 40, 3555–3562. [Google Scholar] [CrossRef] [PubMed]
  3. Draganich, L.F.; Jaeger, R.J.; Kralj, A.R. Coactivation of the hamstrings and quadriceps during extension of the knee. J. Bone Jt. Surg. 1989, 71, 1075–1081. [Google Scholar] [CrossRef]
  4. Schache, A.G.; Dorn, T.W.; Wrigley, T.V.; Brown, N.A.T.; Pandy, M.G. Stretch and activation of the human biarticular hamstrings across a range of running speeds. Eur. J. Appl. Physiol. 2013, 113, 2813–2828. [Google Scholar] [CrossRef] [PubMed]
  5. Nara, G.; Samukawa, M.; Oba, K.; Koshino, Y.; Ishida, T.; Kasahara, S.; Tohyama, H. The deficits of isometric knee flexor strength in lengthened hamstring position after hamstring strain injury. Phys. Ther. Sport 2022, 53, 91–96. [Google Scholar] [CrossRef]
  6. Ogborn, D.; McRae, S.; Larose, G.; Leiter, J.; Brown, H.; MacDonald, P. Knee flexor strength and symmetry vary by device, body position and angle of assessment following ACL reconstruction with hamstring grafts at long-term follow-up. Knee Surg. Sports Traumatol. Arthrosc. 2023, 31, 1658–1664. [Google Scholar] [CrossRef]
  7. Opar, D.A.; Williams, M.D.; Timmins, R.G.; Dear, N.M.; Shield, A.J. Knee flexor strength and bicep femoris electromyographical activity is lower in previously strained hamstrings. J. Electromyogr. Kinesiol. 2013, 23, 696–703. [Google Scholar] [CrossRef] [PubMed]
  8. Van Dyk, N.; Bahr, R.; Whiteley, R.; Tol, J.L.; Kumar, B.D.; Hamilton, B.; Farooq, A.; Witvrouw, E. Hamstring and Quadriceps Isokinetic Strength Deficits Are Weak Risk Factors for Hamstring Strain Injuries. Am. J. Sports Med. 2016, 44, 1789–1795. [Google Scholar] [CrossRef]
  9. Baron, M.; Divernois, G.; Grandjean, B.; Guex, K. Validity and Reliability of Handheld Dynamometry to Assess Isometric Hamstrings and Quadriceps Strength at Varying Muscle Lengths. J. Sport Rehabil. 2024, 33, 267–274. [Google Scholar] [CrossRef] [PubMed]
  10. Requena, B.; González-Badillo, J.J.; Saez De Villareal, E.S.; Ereline, J.; García, I.; Gapeyeva, H.; Pääsuke, M. Functional performance, maximal strength, and power characteristics in isometric and dynamic actions of lower extremities in soccer players. J. Strength Cond. Res. 2009, 23, 1391–1401. [Google Scholar] [CrossRef]
  11. Miyamoto, N.; Hirata, K.; Kanehisa, H. Effects of hamstring stretching on passive muscle stiffness vary between hip flexion and knee extension maneuvers. Scand. J. Med. Sci. Sports 2017, 27, 99–106. [Google Scholar] [CrossRef] [PubMed]
  12. Murphy, A.J.; Wilson, G.J.; Pryor, J.F.; Newton, R.U. Isometric Assessment of Muscular Function: The Effect of Joint Angle. J. Appl. Biomech. 1995, 11, 205–215. [Google Scholar] [CrossRef]
  13. Read, P.J.; Turner, A.N.; Clarke, R.; Applebee, S.; Hughes, J. Knee Angle Affects Posterior Chain Muscle Activation During an Isometric Test Used in Soccer Players. Sports 2019, 7, 13. [Google Scholar] [CrossRef]
  14. Timmins, R.G.; Shield, A.J.; Williams, M.D.; Lorenzen, C.; Opar, D.A. Architectural adaptations of muscle to training and injury: A narrative review outlining the contributions by fascicle length, pennation angle and muscle thickness. Br. J. Sports Med. 2016, 50, 1467–1472. [Google Scholar] [CrossRef]
  15. Wu, R.; Delahunt, E.; Ditroilo, M.; Lowery, M.M.; De Vito, G. Effect of Knee Joint Angle and Contraction Intensity on Hamstrings Coactivation. Med. Sci. Sports Exerc. 2017, 49, 1668–1676. [Google Scholar] [CrossRef]
  16. Krishnan, C.; Williams, G.N. Effect of knee joint angle on side-to-side strength ratios. J. Strength Cond. Res. 2014, 28, 2981–2987. [Google Scholar] [CrossRef] [PubMed]
  17. Ruiz-Cárdenas, J.; Jiménez-Reyes, P.; Rodríguez-Juan, J. OC16 The bilateral deficit phenomenon: Bibliographic review. Br. J. Sports Med. 2014, 48, A6. [Google Scholar] [CrossRef]
  18. Wiesinger, H.P.; Gressenbauer, C.; Kösters, A.; Scharinger, M.; Müller, E. Device and method matter: A critical evaluation of eccentric hamstring muscle strength assessments. Scand. J. Med. Sci. Sports 2020, 30, 217–226. [Google Scholar] [CrossRef]
  19. Iga, J.; Fruer, C.S.; Deighan, M.; Croix, M.D.S.; James, D.V.B. Nordic hamstrings exercise—Engagement characteristics and training responses. Int. J. Sports Med. 2012, 33, 1000–1004. [Google Scholar] [CrossRef]
  20. Nishida, S.; Nakamura, M.; Kiyono, R.; Sato, S.; Yasaka, K.; Yoshida, R.; Nosaka, K. Relationship between Nordic hamstring strength and maximal voluntary eccentric, concentric and isometric knee flexion torque. PLoS ONE 2022, 17, e0264465. [Google Scholar] [CrossRef]
  21. Soga, T.; Keerasomboon, T.; Akiyama, K.; Hirose, N. Difference of Hamstring Activity Between Bilateral and Unilateral Nordic Hamstring Exercises with a Sloped Platform. J. Sport Rehabil. 2022, 31, 325–330. [Google Scholar] [CrossRef] [PubMed]
  22. Jakobi, J.M.; Chilibeck, P.D. Bilateral and unilateral contractions: Possible differences in maximal voluntary force. Can. J. Appl. Physiol. 2001, 26, 12–33. [Google Scholar] [CrossRef]
  23. Škarabot, J.; Cronin, N.; Strojnik, V.; Avela, J. Bilateral deficit in maximal force production. Eur. J. Appl. Physiol. 2016, 116, 2057–2084. [Google Scholar] [CrossRef]
  24. Carson, R.G. Inter-hemispheric inhibition sculpts the output of neural circuits by co-opting the two cerebral hemispheres. J. Physiol. 2020, 598, 4781–4802. [Google Scholar] [CrossRef]
  25. MacDonald, G.Z.; Mazara, N.; Herzog, W.; Power, G.A. Mitigating the bilateral deficit: Reducing neural deficits through residual force enhancement and activation reduction. Eur. J. Appl. Physiol. 2018, 118, 1911–1919. [Google Scholar] [CrossRef] [PubMed]
  26. Šarabon, N.; Kozinc, Ž.; Bishop, C. Comparison of Vertical and Horizontal Reactive Strength Index Variants and Association with Change of Direction Performance. J. Strength Cond. Res. 2023, 37, 84–90. [Google Scholar] [CrossRef]
  27. Železnik, P.; Slak, V.; Kozinc, Ž.; Šarabon, N. The Association between Bilateral Deficit and Athletic Performance: A Brief Review. Sports 2022, 10, 112. [Google Scholar] [CrossRef]
  28. Le Sant, G.; Ates, F.; Brasseur, J.L.; Nordez, A. Elastography Study of Hamstring Behaviors during Passive Stretching. PLoS ONE 2015, 10, e0139272. [Google Scholar] [CrossRef] [PubMed]
  29. Motomura, Y.; Tateuchi, H.; Nakao, S.; Shimizu, I.; Kato, T.; Kondo, Y.; Ichihashi, N. Effect of different knee flexion angles with a constant hip and knee torque on the muscle forces and neuromuscular activities of hamstrings and gluteus maximus muscles. Eur. J. Appl. Physiol. 2019, 119, 399–407. [Google Scholar] [CrossRef]
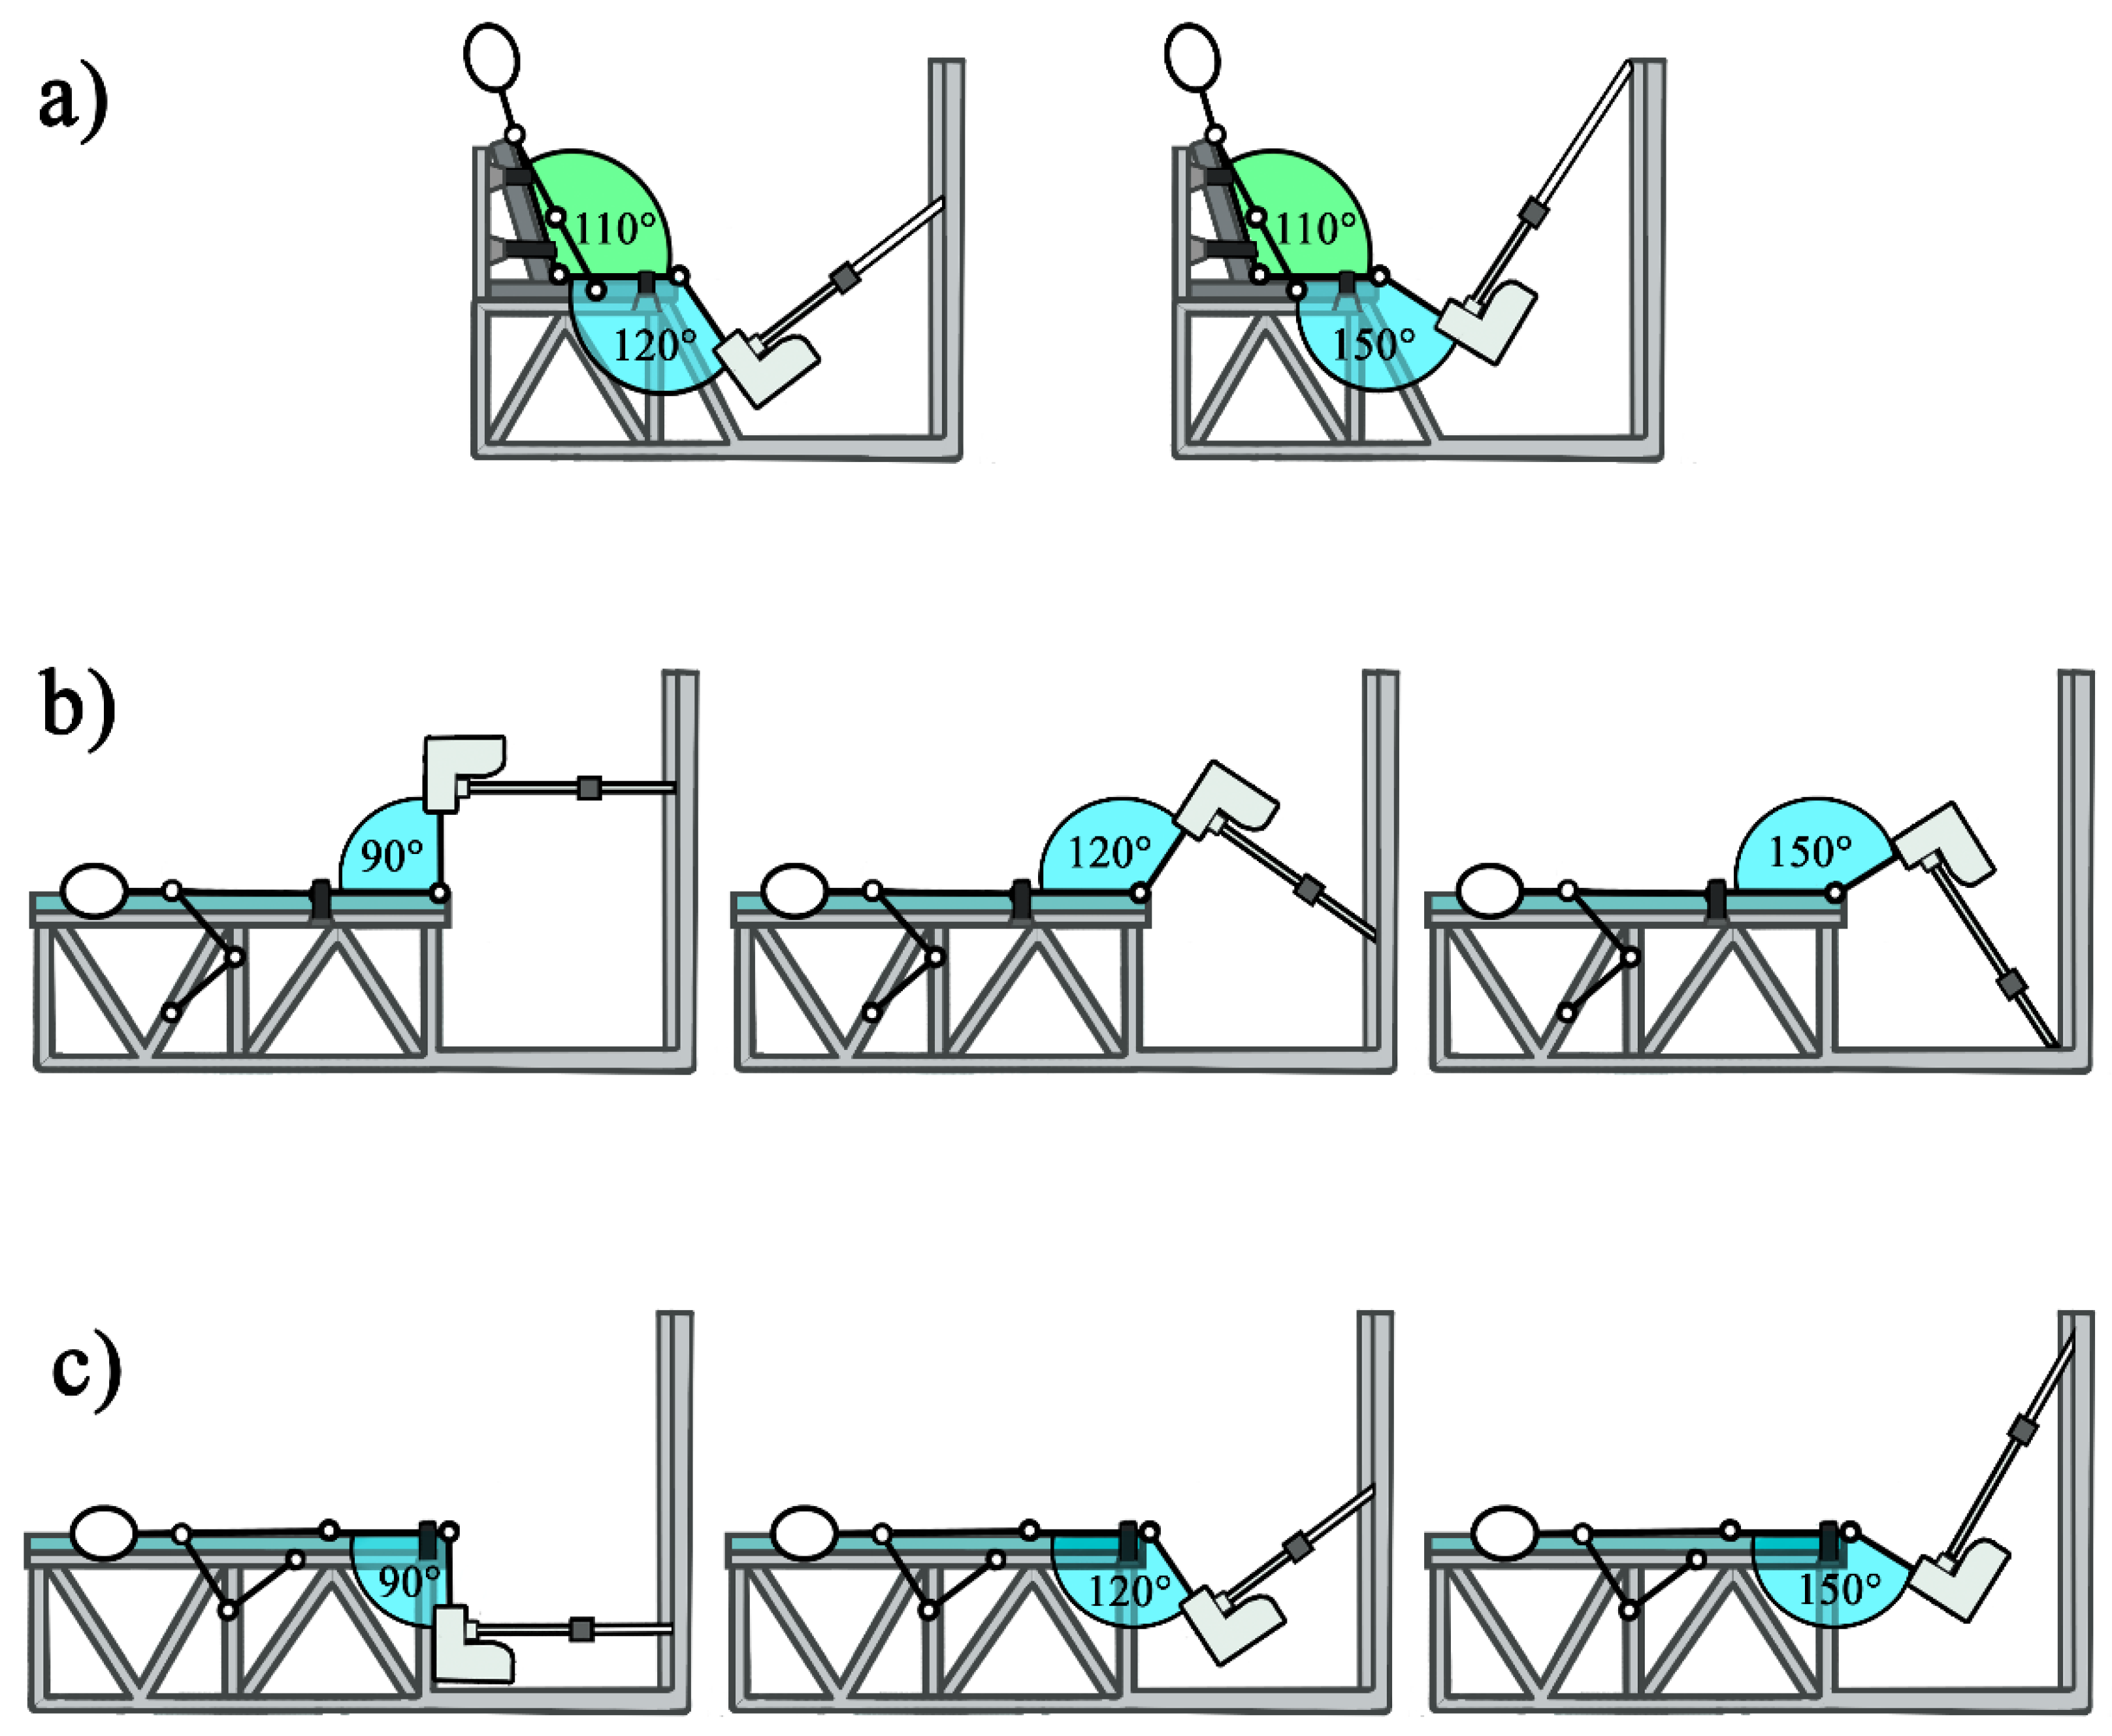
Figure 1. Illustration of the positions used in the experimental set-up: (a) seated; (b) prone; (c) supine. Green shading indicates the hip flexion angle, and blue shading indicates the knee joint angle.
Applsci 16 02852 g001
Figure 2. Schematic timeline of the experimental sessions and distribution of testing conditions. MVIC, maximal voluntary isometric contraction.
Applsci 16 02852 g002
Figure 3. The magnitude of bilateral deficit in (a) Fmax, (b) RFDmax, (c) RFD50 ms, and (d) RFD200 ms in all positions (seated, prone, and supine) and joint angles (90°, 120°, and 150°). The dashed horizontal line indicates a BD ratio of 1.0 (i.e., no bilateral deficit or facilitation). Fmax, maximal isometric force; RFD, rate of force development.
Applsci 16 02852 g003
Table 1. Mean (SD) of Unilateral (Sum) and Bilateral Hamstring Peak Force and Rate of Force Development by Testing Position and Knee Angle. n = 30 (15 males, 15 females).
PositionSeatedProneSupine
AngleVariableUnilateral (Sum)BilateralUnilateral (Sum)BilateralUnilateral (Sum)Bilateral
90°Fmax (N) 372 (98)342 (92)337 (96)318 (97)
RFDmax (N/s) 2363 (987)1917 (895)1666 (647)1556 (695)
RFD200 ms (N/s) 1169 (360)974 (353)1067 (369)902 (377)
RFD50 ms (N/s) 1465 (659)1280 (604)967 (408)854 (430)
120°Fmax (N)683 (131)580 (116)495 (106)477 (107)375 (102)336 (102)
RFDmax (N/s)3020 (996)2501 (967)3148 (1304)2962 (1457)1796 (607)1574 (734)
RFD200 ms (N/s)1965 (535)1601 (539)1552 (437)1481 (459)1129 (390)923 (366)
RFD50 ms (N/s)1569 (737)1346 (725)1929 (878)1903 (1038)1077 (444)992 (550)
150°Fmax (N)737 (166)624 (163)605 (145)564 (139)462 (121)408 (105)
RFDmax (N/s)3020 (971)2495 (1042)3589 (1102)3189 (1186)1996 (634)1847 (693)
RFD200 ms (N/s)2091 (637)1659 (601)1892 (476)1653 (448)1276 (418)1066 (366)
RFD50 ms (N/s)1557 (661)1290 (702)1960 (712)1869 (819)1107 (448)964 (416)
Table 2. Bilateral deficit (BD) ratios across body positions and knee joint angles (Panel A) and corresponding model main effects and interactions (Panel B) for maximal force (Fmax) and rate of force development (RFD) outcomes. Values are mean (SD). n = 30 (15 males, 15 females).
Panel A. BD Ratios (Mean (SD))
Angle (°)PositionFmaxRFDmaxRFD50 msRFD200 ms
90Prone0.95 (0.08)0.81 (0.15)0.84 (0.21)0.83 (0.14)
Supine0.94 (0.08)0.93 (0.14)0.85 (0.16)0.85 (0.13)
120Seated0.86 (0.09)0.82 (0.15)0.89 (0.24)0.82 (0.14)
Prone0.96 (0.05)0.94 (0.12)1.00 (0.21)0.96 (0.15)
Supine0.90 (0.05)0.87 (0.15)0.90 (0.16)0.82 (0.12)
150Seated0.84 (0.07)0.78 (0.18)0.76 (0.19)0.74 (0.13)
Prone0.94 (0.04)0.88 (0.17)0.95 (0.23)0.88 (0.13)
Supine0.88 (0.08)0.90 (0.20)0.87 (0.18)0.82 (0.13)
Panel B. Linear Mixed-Model Main Effects and Interactions
OutcomeEffectFdf1df2pPartial η2
FmaxPosition199.372203<0.0010.663
Angle32.52203<0.0010.243
Position × Angle48.874203<0.0010.491
RFDmaxPosition45.312203<0.0010.309
Angle14.12203<0.0010.122
Position × Angle7.694203<0.0010.132
RFD50 msPosition25.252203<0.0010.199
Angle20.832203<0.0010.17
Position × Angle3.0442030.0180.056
RFD200 msPosition54.472203<0.0010.349
Angle23.812203<0.0010.19
Position × Angle10.014203<0.0010.165
Note: BD ratio = X_bilateral/(X_unilateral_left + X_unilateral_right), where X denotes the outcome metric (e.g., Fmax, RFDmax, RFD50 ms, RFD200 ms). Values < 1 indicate a bilateral deficit; values > 1 indicate bilateral facilitation.
Disclaimer/Publisher’s Note: The statements, opinions and data contained in all publications are solely those of the individual author(s) and contributor(s) and not of MDPI and/or the editor(s). MDPI and/or the editor(s) disclaim responsibility for any injury to people or property resulting from any ideas, methods, instructions or products referred to in the content.