1. Introduction
Malaria is an infectious disease with high morbidity and mortality, caused by parasites of the genus
Plasmodium and transmitted by mosquitoes of the genus
Anopheles sp. There are five
Plasmodium species that infect humans:
Plasmodium vivax,
P. falciparum,
P. malariae,
P. ovale and
P. knowlesi [
1]. It remains a critical global health burden. After the setbacks observed during the COVID-19 pandemic, malaria cases and deaths have risen again, with approximately 249 million estimated cases in 2022. These figures highlight the urgent need for faster, more accessible and more scalable diagnostic methods that can enable early treatment and better epidemiological surveillance in resource-limited settings [
2].
In Peru, despite the progress achieved in recent years, malaria continues to be a major public health problem, especially in the Amazon region and in districts with high socioeconomic vulnerability. For example, in 2022, 15,381 malaria cases were reported nationwide, representing an increase of 64.22% compared with the same period in 2021, including several autochthonous deaths in children between 2 and 7 years of age. The Loreto region accounts for most national cases, followed by Junín and Amazonas [
3]. In addition, a recent study estimated that 22,617 malaria cases occurred in the country in 2023, which reflects both the magnitude of the disease and the urgent need to improve surveillance and diagnostic methods [
4].
Microscopic examination of Giemsa-stained blood smears remains the reference standard for diagnosis, but it is a laborious and time-consuming procedure that requires qualified personnel. This dependence leads to interobserver variability and bottlenecks in timely access to care in remote areas. For this reason, over the last decade, there has been growing interest in automating the detection and quantification of
Plasmodium parasites using computer vision, deep learning and mobile platforms [
5,
6]. Recent studies and reviews highlight both the clinical potential and the practical limitations of these approaches, such as variability in smear preparation, image heterogeneity and the need for field validation, and they point to smartphones as a promising avenue for image acquisition and deployment of lightweight models at the point of care.
Smartphone microscopy image characteristics. Thick-smear images acquired with smartphones coupled to conventional microscopes exhibit substantial device- and session-dependent variability. Differences in smartphone optics and sensors, coupling alignment, and in-camera processing (auto-exposure, auto-white balance, sharpening/denoising, and compression) can alter color, contrast, noise texture, and apparent sharpness across acquisitions. In routine practice, additional variability arises from staining heterogeneity, uneven illumination, minor defocus, and the presence of debris, all of which can produce parasite-like patterns and increase ambiguity for automated detectors.
In this context, we propose a smartphone-based, deep learning–driven workflow for thick-smear microscopy that prioritizes deployability and alignment with routine clinical practice, aiming to improve screening accuracy, speed, and consistency under heterogeneous, real-world acquisition conditions. The main contributions are: (1) a clinically validated dataset of thick smears acquired under heterogeneous, real-world imaging conditions using multiple smartphone models; (2) an end-to-end workflow that mirrors clinical practice, including visual-field localization, standardized tiling, and lightweight parasite detection; and (3) a deployment-oriented evaluation that jointly reports detection performance and on-device efficiency, enabling practical execution across a range of Android smartphones (low-, mid-, and high-range)
2. Background and Related Work on Automated Malaria Detection
Building on the need for lightweight, smartphone-based diagnostic tools outlined in the Introduction, this section reviews prior work on automated malaria detection from microscopy images. We first summarize systems developed under controlled laboratory conditions and then discuss approaches evaluated in field-like or routine clinical settings, with particular attention to deep learning and mobile-based solutions.
Over the last decade, automatic detection of Plasmodium in blood smears has evolved from experimental approaches on public datasets to mobile prototypes with limited field validation. The literature can be broadly divided into two main groups: (i) studies conducted under controlled conditions with segmented images, which report high accuracies but lack clinical validation, such as [
7,
8,
9,
10,
11] and (ii) systems designed for field use, with initial tests on real patients [
12,
13]. Taken together, these works show high performance metrics in controlled environments, often above 95% accuracy, but they exhibit clear gaps in terms of generalization across species, variability in slide preparation, parasitaemia quantification and performance in different endemic regions.
Within the group of computational studies on segmented data, ref. [
7] trained CNN variants with autoencoders and knowledge distillation on the public National Institutes of Health (NIH) dataset, comprising 27,558 balanced images, achieving 99.23% accuracy and inference times below one second using TensorFlow Lite. However, validation was restricted to public data and technical tests on a phone, without clinical trials or use on full smears. Similarly, ref. [
8] employed transfer learning with EfficientNet-B2 and reported 97.57% accuracy, area under the ROC curve (AUC) of 99.21% and an F1-score of 0.9755, although the study was fully simulated and did not consider real-world variability or coinfections. Along the same comparative line, ref. [
9] evaluated MobileNetV2 and ResNet50 on the same dataset, achieving accuracy values between 95.9% and 97.1%, with AUC up to 96.7%, but without external validation, which limits its practical applicability. Finally, ref. [
10] combined an SSD300 detector, a super-resolution model (FSRCNN) and a VGG16 CNN in an Android app executable on-device, reaching 96.5% accuracy and an AUC of 0.994; however, it remained a conceptual demonstration trained on segmented images without clinical validation.
Among more integrated systems, although still in laboratory settings, ref. [
11] proposed a complete pipeline using Faster R-CNN for detection and ResNet-50/34 networks for classification and staging of
P. falciparum in in vitro cultures. The authors reported an AUC of 0.98, sensitivity of 99.5% and specificity of 99.8%, with results comparable to expert microscopists. Nonetheless, experiments were limited to laboratory cultures, without evaluation on real patients or routine diagnostic scenarios.
In the group of prototypes with field validation, ref. [
12] developed the AIDMAN system based on YOLOv5, Transformers and CNNs, trained on 1822 thin-smear images acquired with smartphones in hospitals in Sierra Leone. It achieved 98.62% accuracy at the cell level, 97% at the slide level and 98.44% in clinical validation with 64 patients, demonstrating operational feasibility in hospital environments. However, the dataset was limited to
P. falciparum and thin smears, and did not represent geographic variability or different species.
In turn, ref. [
13] evaluated the Malaria Screener system, a mobile application developed by the NIH, in 190 patients from rural areas of Sudan. The app, coupled to a microscope and based on deep networks, obtained 74.1% accuracy compared with expert microscopists and 71.8% compared with PCR, improving to 91.8% after threshold recalibration (WHO Level 1). In a later phase, the PlasmodiumVF-Net algorithm reached 83.1% compared with microscopy and 81.0% compared with PCR (WHO Level 2). The authors showed that models optimized and validated in one country do not necessarily reproduce the same performance in another due to differences in laboratory conditions, illumination, slide preparation and species prevalence, underscoring the lack of global standardization. Consequently, even though it is one of the few works with real-world validation, its applicability remained restricted to the local context.
In summary, studies [
7,
8,
9,
10,
11] demonstrate the technical maturity of deep learning approaches under controlled data conditions, but without clinical validation or inter-center robustness. By contrast, ref. [
12] and especially [
13] move towards real-world scenarios and direct comparisons with microscopy and PCR, although they confirm that model effectiveness is highly dependent on the environment and the country where they are deployed. This landscape highlights the need for systems that combine robustness to biological and geographic variability, coinfection detection and multicenter clinical validation, ensuring real applicability in diverse endemic contexts.
Unlike previous studies, the present work expands the experimental and clinical scope of automated detection of Plasmodium spp. using computer vision. While earlier research focused on public databases or controlled scenarios with a limited number of species and segmented samples, the present study uses a larger and more diverse dataset composed of more than 8000 images of full smears obtained from real samples in the field and in a clinical laboratory, including coinfection cases of P. vivax and P. falciparum. In addition, we evaluate a lightweight model, YOLO-nano v11 (YOLOv11n), optimized for mobile deployment, achieving robust performance under heterogeneous acquisition conditions. In this way, the work goes beyond the limitations identified in previous research by incorporating experimental validation under real conditions and a multi-species approach with operational application potential in endemic settings in Latin America.
Table 1 presents a comparative summary of the reviewed studies, highlighting the main methodological characteristics, number of samples and level of validation achieved in each case.
3. Materials and Methods
Based on the findings identified in the state of the art, it became evident that although there are Plasmodium parasite detection models with outstanding results in controlled environments, most of them show limited generalization, lack clinical validation and have poor adaptability to mobile devices. In this context, we propose a comparative approach aimed at evaluating the performance of different convolutional neural network architectures optimized for deployment on smartphones, with the goal of developing an automated, fast and accessible system for microscopic malaria diagnosis in low-resource settings.
The workflow comprises: (i) acquisition of blood smears and image capture at 100× using smartphones coupled to a microscope while applying quality and inclusion criteria; (ii) expert annotation of eight classes; (iii) preprocessing and standardization of images, followed by tiling with data augmentation and stratified splitting of the dataset; and (iv) training of four lightweight architectures (Table 4). Performance was determined through an IoU–confidence threshold sweep to select the optimal model according to the trade-off between accuracy and inference time. The overall pipeline is shown in
Figure 1.
3.1. Dataset and Image Acquisition
The study population consisted of images of Giemsa-stained thick blood smears used for microscopic malaria diagnosis. A total of 400 slides were collected: 200 from reference panels prepared and validated by expert microscopists at the Reference Laboratory of Loreto (GERESA Loreto), and 200 from quality control samples received from healthcare facilities distributed across the Loreto region. For the latter group, the specific originating health facility or catchment area was not recorded, as the slides were handled as routine material sent to the reference laboratory for validation and external quality assessment. All slides were provided in a blinded form, with no access to patient identifiers or demographic information (such as age or sex).
For image acquisition, an Olympus CX23 optical microscope configured with a 10× eyepiece and a 100× oil-immersion objective (total magnification of 1000×) was used. Three different smartphones: (1) Samsung Galaxy S24 Ultra—S928B (Samsung Electronics, Suwon, South Korea) (2) Motorola Edge 30 Pro (Motorola Mobility, Chicago, IL, USA), and (3) HONOR ALINX3 (HONOR, Shenzhen, China) were mounted on the microscope to incorporate real-world variations in illumination, white balance, and optical characteristics. In total, 8625 images were obtained with predefined focus and exposure settings (see
Table 2). To build the database, we included only images with a diagnostic confirmation (positive or negative) for Plasmodium issued by at least three certified microscopists. Slides that were damaged or showed preparation defects that hindered adequate visualization of parasites were excluded, as well as images without validation from expert microscopists.
Compared with images captured using dedicated microscope camera systems under controlled settings, smartphone-acquired microscopy images typically present higher variability due to automatic camera pipelines and heterogeneous hardware. Dedicated systems usually provide a more stable optical path and more consistent acquisition parameters, while smartphones introduce stronger domain shift across devices and capture conditions. This motivates the need for a deployment-oriented pipeline and robustness-focused training strategy.
3.2. Expert Annotation
Ground-truth labels were assigned by expert microscopists on clinically validated Giemsa-stained thick smears following routine morphological criteria (parasite chromatin and cytoplasm appearance and stage-dependent patterns, depending on the class definition). The proposed detector is trained to recognize these expert-defined visual cues under heterogeneous smartphone acquisition conditions.
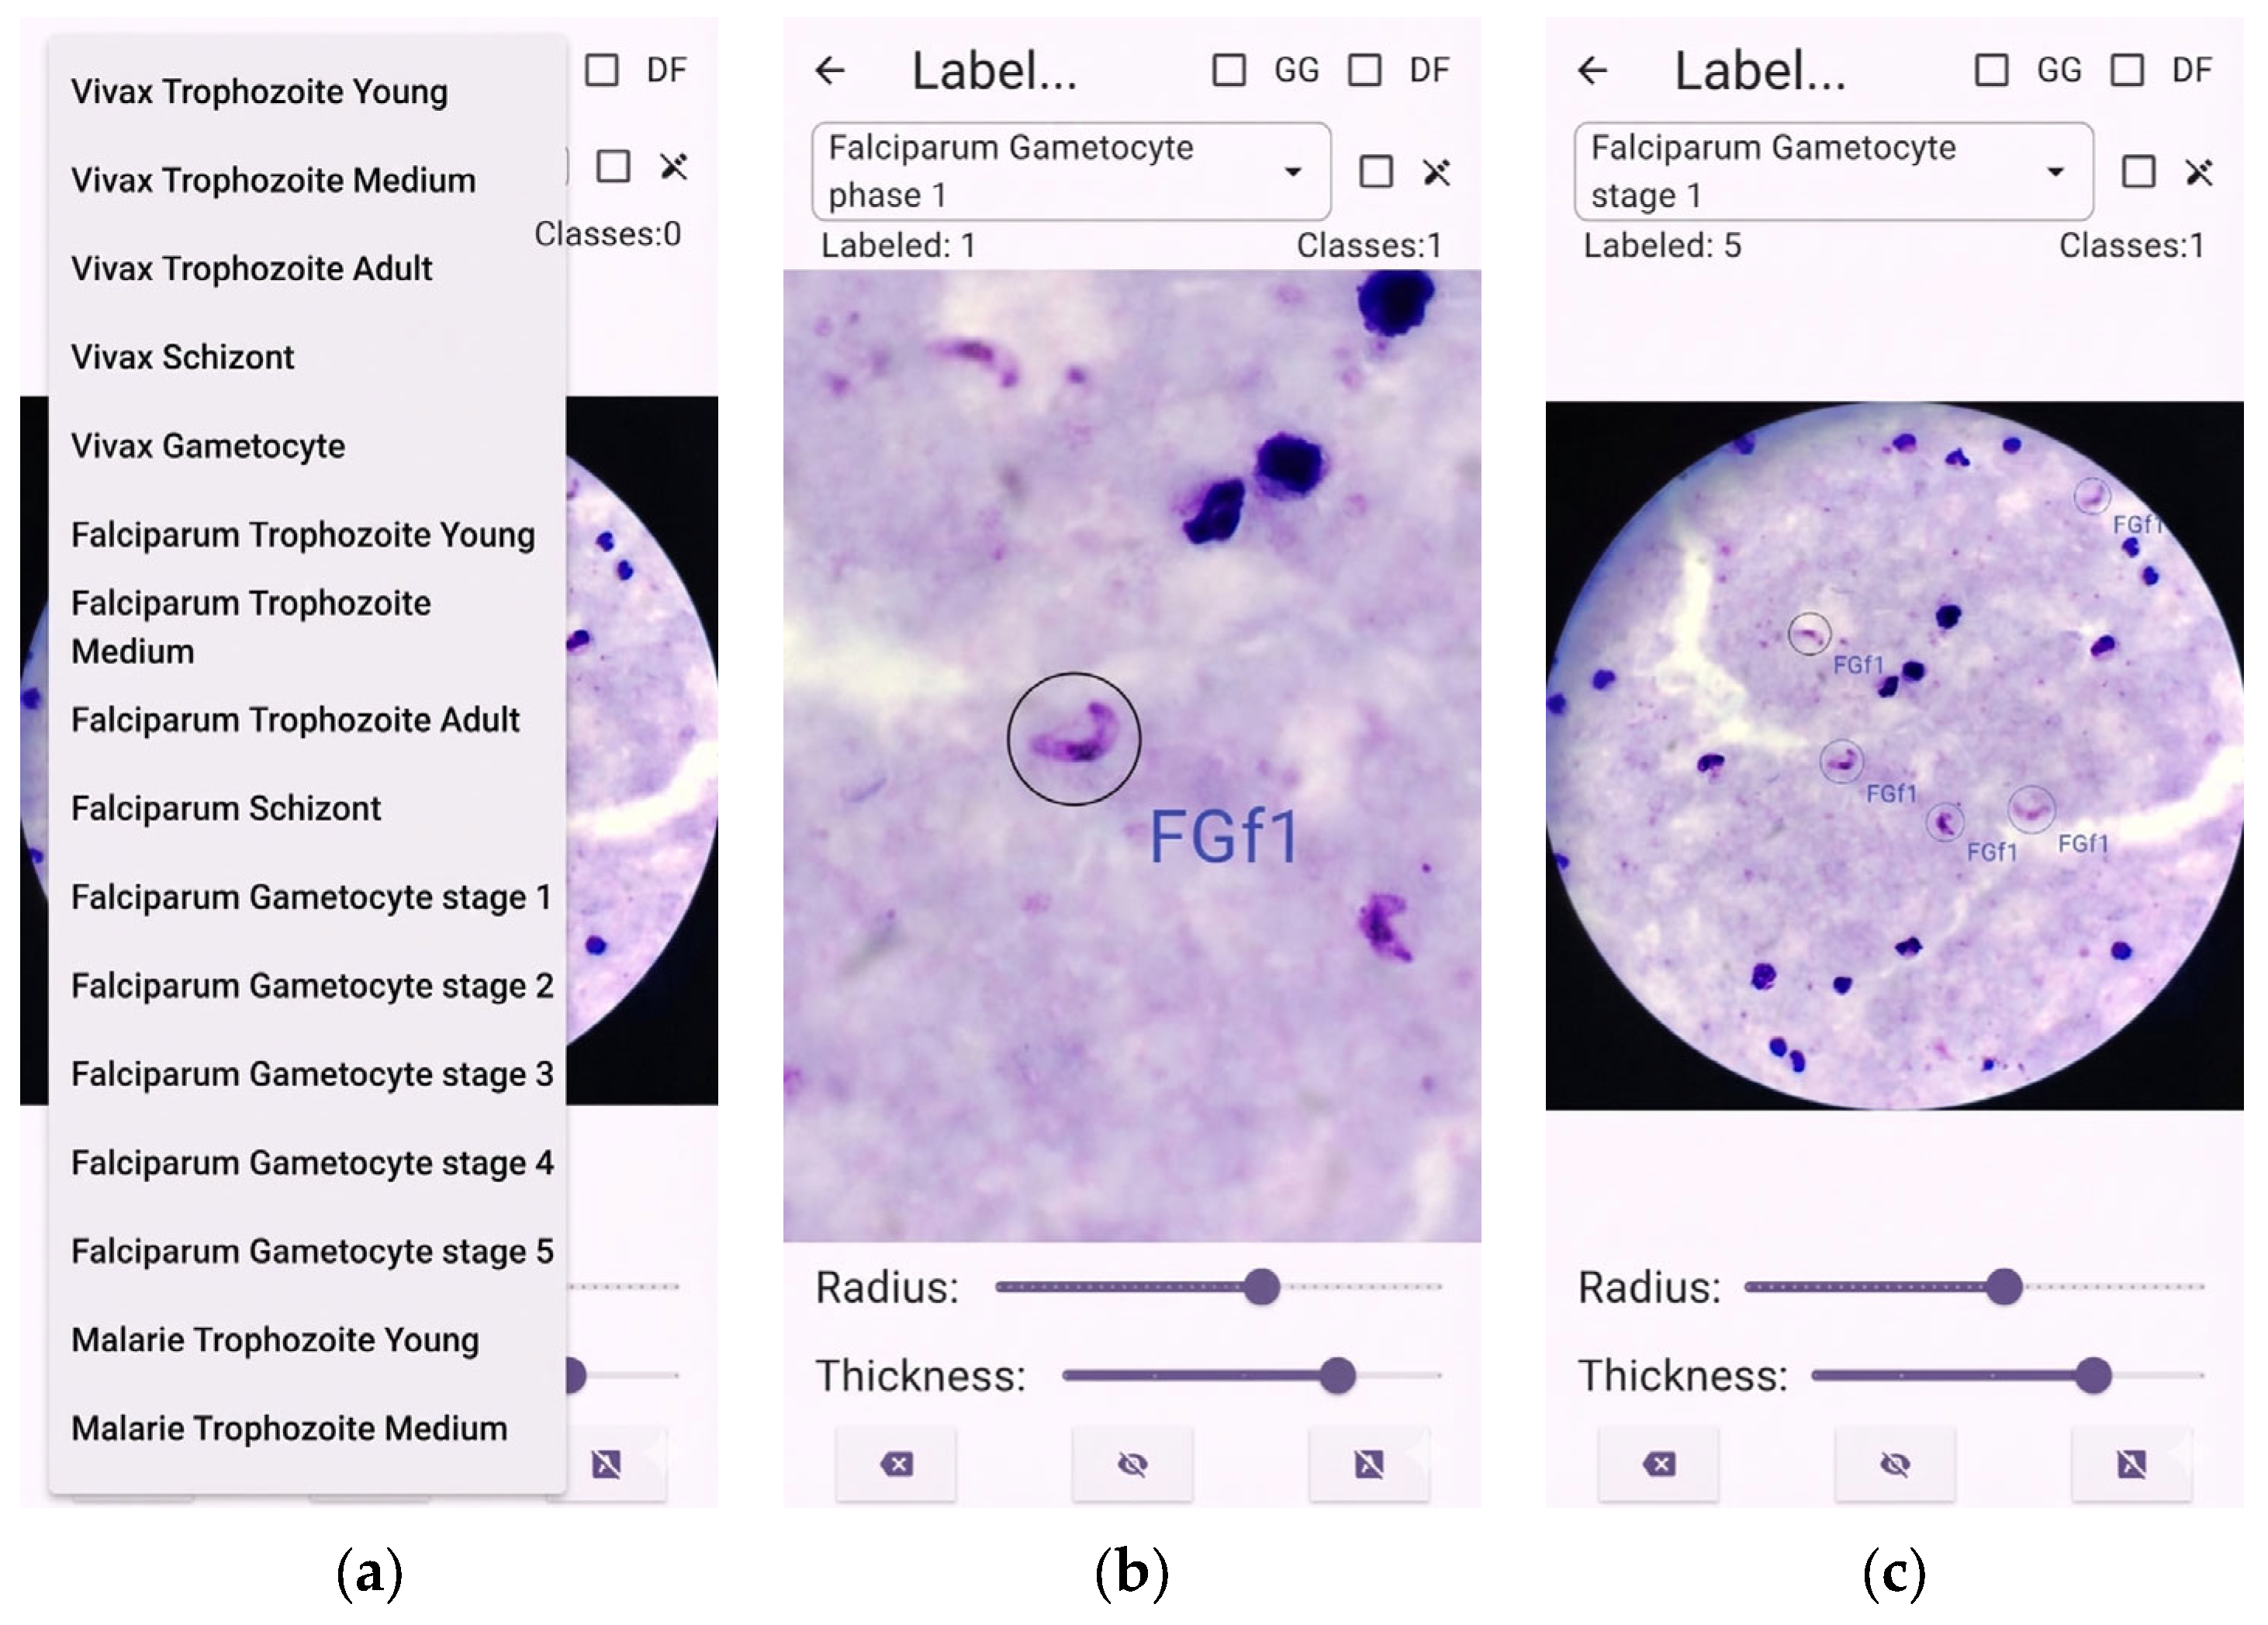
Annotation was performed using a mobile application developed specifically for this project (
Figure 2). Eight classes were defined, combining species and parasite stage. Each annotation was verified by two experts, and disagreements (less than 3%) were resolved by consensus. The final dataset included 54,531 annotated instances, distributed between
Plasmodium vivax and
P. falciparum at different stages (young trophozoite, mature trophozoite, schizont, and gametocyte) (see
Table 3).
3.3. Preprocessing and Data Augmentation
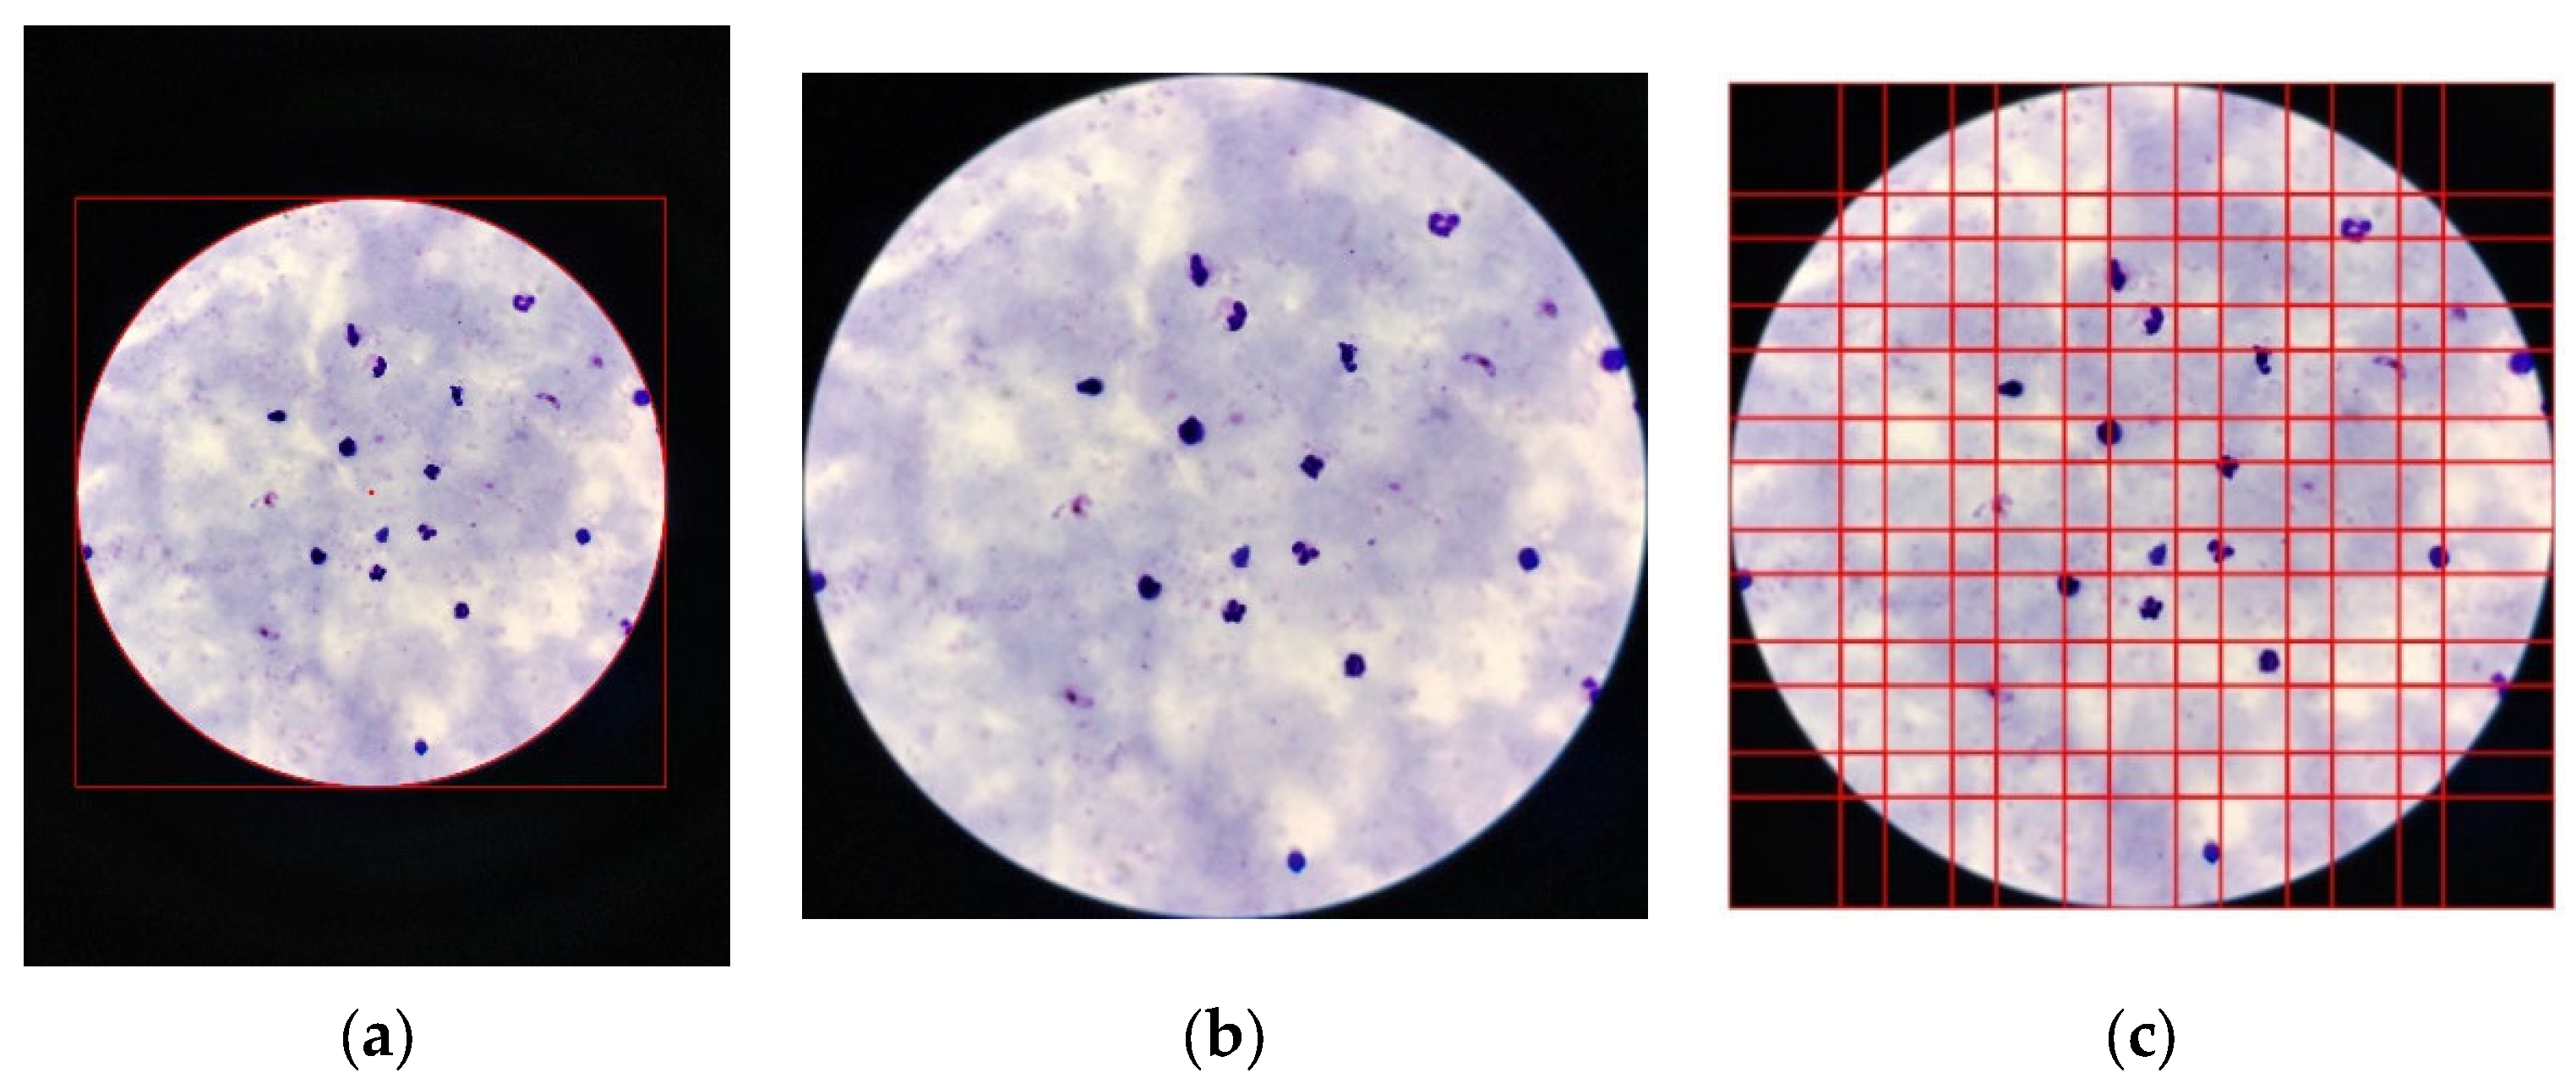
To improve model robustness to visual variability, we implemented a modular preprocessing pipeline composed of the three following steps (illustrated in
Figure 3):
Segmentation of the visual field. To automatically crop the circular microscopic field in each photograph, we initially implemented the Hough transform [
14]. This approach allowed correct detection of the visual field, but the per-image processing time during on-device implementation was considerably higher than the inference time of the parasite detection model itself, creating a bottleneck for real-time use on mobile devices. To overcome this limitation, we decided to train a lightweight object detector based on YOLOv11n, dedicated exclusively to localizing the circular field [
15].
The dataset for this detector was built from 16,308 microscopy images containing circular structures, including additional images that were not used for training or validating the parasite models. As a self-labeling strategy, we applied the Hough transform to this dataset to detect circles and obtain their centers and radii, which were then converted into YOLO-format bounding boxes and used as ground truth for training. The dataset was split into training, validation, and test subsets (11,406, 2449, and 2453 images, respectively). The selected model achieved precision and recall values above 99% and an mAP@0.5:0.95 of 0.995 on the test set, where mAP@0.5:0.95 corresponds to the mean average precision computed over intersection-over-union (IoU) thresholds from 0.5 to 0.95 in increments of 0.05. For this reason, it was integrated as the first preprocessing step to locate the circular field in each original image and automatically crop the useful area, significantly reducing latency compared with the exclusive use of the Hough transform.
Image scaling. Once the circular field was identified, the region of interest was cropped and resized to a square resolution of 2510 × 2510 pixels, centering the microscopic field while preserving the original aspect ratio. Rescaling was performed using bicubic interpolation.
Tiling (mosaic division): Each segmented image was subdivided into 640 × 640-pixel patches with 20% overlap in both directions. When the image dimensions did not allow a complete patch at the borders, the tiling window was shifted backwards from the far edge to ensure that only full-size patches were generated. This process produced approximately 220,000 tiles containing at least one annotated parasite and 45,000 tiles without annotations.
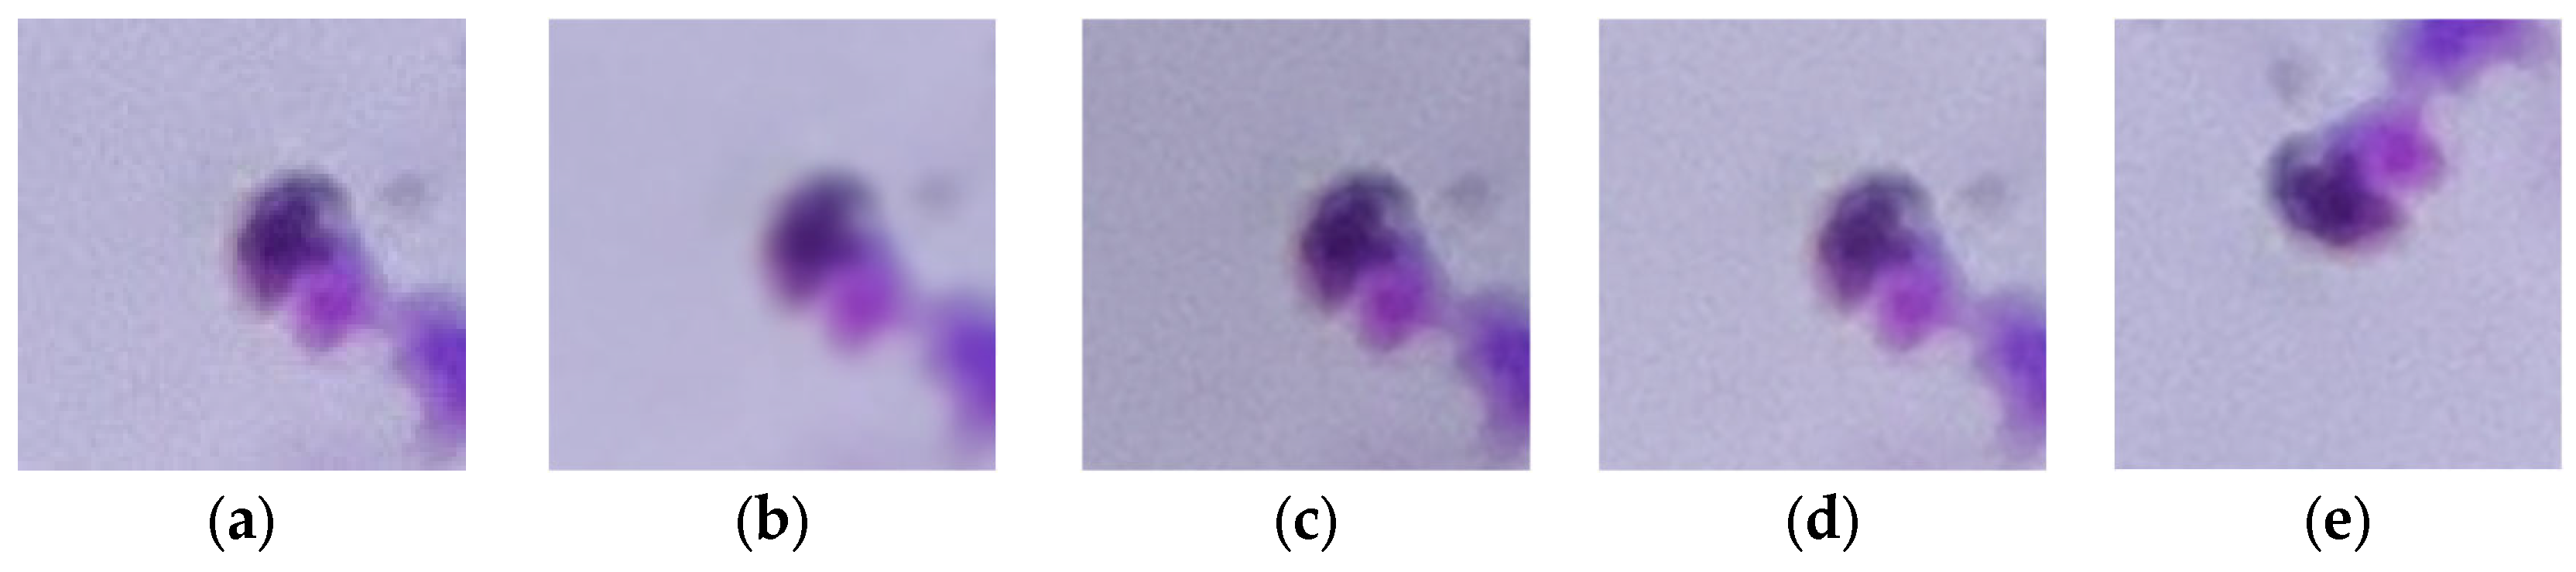
Finally, data augmentation was applied to improve robustness under routine smartphone microscopy conditions, where illumination, white balance, staining heterogeneity, minor blur, and device-dependent optical characteristics introduce substantial appearance variability. To reduce overfitting and mitigate class imbalance across parasite stages, augmentations were applied exclusively to the training subset after the slide-level split to prevent information leakage [
16,
17]. This choice was further supported by a control experiment trained without augmentation, in which the model did not reach 90% accuracy (Table 5). In contrast, incorporating augmentation increased performance above this threshold. The final augmentation pipeline includes:
Gaussian blur: On the patch containing the parasite, Gaussian blur was applied stochastically in approximately 50% of cases. The blur intensity was randomly selected within a continuous range between 0.5 and 2.0, simulating variations in focus and sharpness typical of microscopic capture [
18].
Brightness and contrast adjustment: At patch level, brightness was modified using a multiplicative factor chosen randomly between 0.8 and 1.2, so the parasite could appear slightly darker or lighter depending on illumination conditions [
19]. Complementarily, contrast was adjusted with a random factor between 0.9 and 1.1, producing subtle changes that preserve parasite structure while reproducing differences in staining and acquisition among slides.
Rotation: To increase orientation invariance, tiles containing parasites were rotated rigidly by 90°, 180°, and 270°. These rotations preserve the structure of the thick smear and enable the model to recognize parasites regardless of their orientation in the microscopic field [
20].
Saturation adjustment: To reproduce variations in staining and color balance, saturation of the parasite patch was modified with a factor between 0.6 and 1.4. This allowed parasites to appear in slightly muted or more intense tones while maintaining chromatic consistency with Giemsa staining [
21].
Scaling: A slight scale variation was introduced for parasites using scaling factors close to unity (for example, 1.08), simulating small differences in apparent size caused by changes in focus or capture distance. However, the tiles generated for training were kept at a fixed resolution of 640 × 640 pixels, so scaling affected only the relative parasite size within the mosaic [
22].
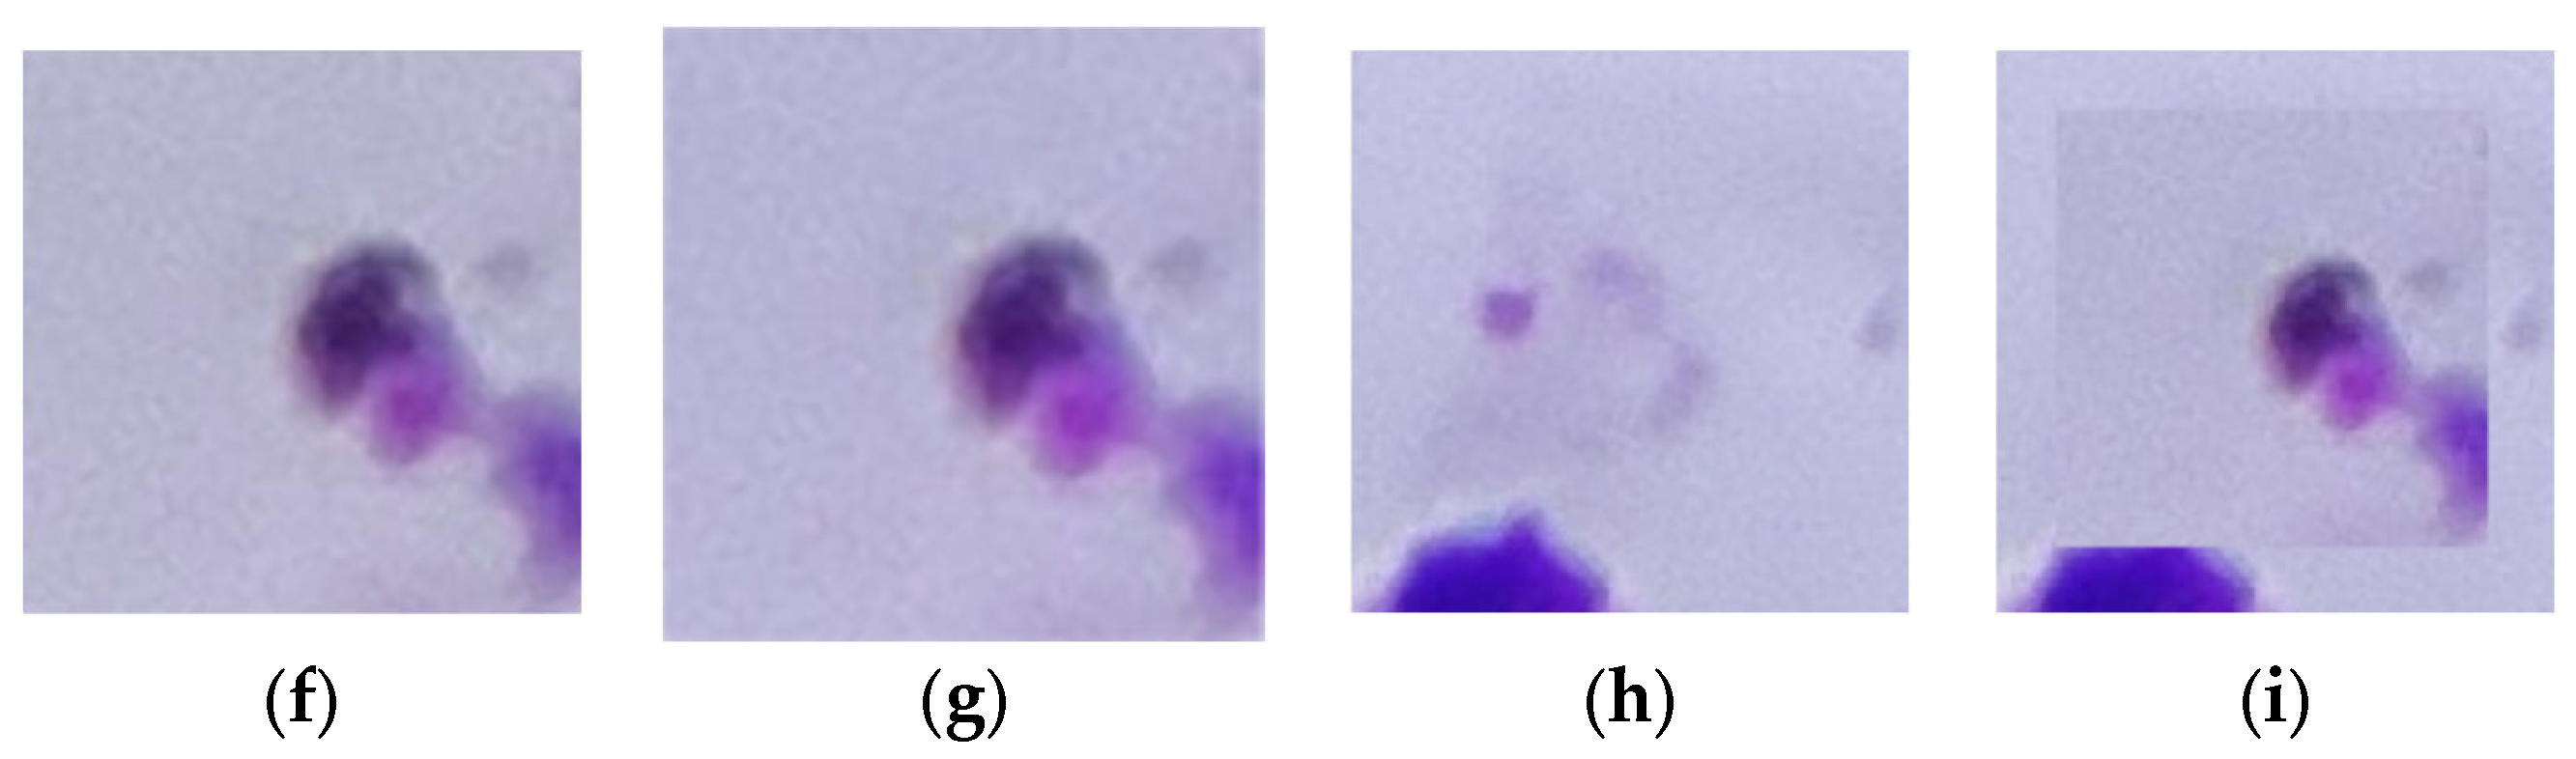
Cut–paste based on donor slides: We used a compositional augmentation strategy consisting of cutting out parasites (donor slides) and pasting them onto other images with low parasitic density (background slides) to generate new tiles. Pasting was always performed within the smear circle and in regions free of previous annotations, avoiding overlap with other parasites or relevant artifacts. Synthetic generation targets of 2500 additional instances were set for classes 2, 3, 4, 6, and 7, controlling the maximum number of pasted parasites per new image (up to 5 per tile) and the maximum number of versions generated from the se background (up to 20). Insertion positions were selected randomly, with a slight preference for the central region of the field [
23].
An additional replica was created for majority classes (+10%) and three replicas for minority classes (+40%).
Figure 4 shows an example of each technique used.
3.4. Evaluated Architectures and Training Protocol
The parasite detection dataset comprises 8625 microscopy images acquired from 400 thick-smear slides under routine conditions (
Section 3.1). To prevent information leakage introduced by the subsequent tiling step (640 × 640 patches with 20% overlap), data were partitioned at the slide level prior to preprocessing, ensuring that all images (and therefore all derived tiles) originating from the same slide were assigned to a single subset. Slides were split into training (70%), validation (15%), and test (15%) subsets (280/60/60 slides, respectively). The split was stratified by smartphone model and slide-level diagnostic status (positive/negative) to preserve acquisition-related variability and class prevalence across splits. After splitting, each subset underwent the same preprocessing pipeline (visual-field segmentation, scaling, and tiling), and data augmentation was applied only to the training subset. Based on mobile-deployment constraints (model size, inference latency, and compatibility with smartphone runtimes), four candidate detection architectures were selected for training and comparison, as summarized in
Table 4.
The four selected models were trained using input images of 640 × 640 pixels obtained from the visual-field segmentation and tiling described in
Section 3.3. The specific configurations were:
YOLOv11n: anchor-free detector with RepN and C2f blocks, optimized for execution on ARM and NNAPI devices, using Focal Loss as the main loss function.
EfficientDet-D0 Lite: lightweight and scalable detection architecture based on EfficientDet, configured with Focal Loss to handle class imbalance.
SSD-MobileNetV1: single-stage SSD detector with MobileNetV1 backbone and support for deployment in TFLite INT8, also trained with Focal Loss.
Faster R-CNN + MobileNetV3-Small: two-stage architecture with region proposal generation, using Smooth L1 Loss for box regression and Cross-Entropy Loss for classification.
In all cases, the AdamW optimizer was used with an adaptive learning rate and with a patience of 15 epochs, monitoring mAP on the validation set.
The evaluated models are CNN-based object detectors that operate directly on image data. Each segmented visual field is subdivided into 640 × 640 RGB tiles, which are used as network inputs. The detector outputs a set of predictions per tile, each consisting of a bounding box (x, y, w, h), a parasite class label (
Table 3), and an associated confidence score. Tile-level predictions are then mapped back to the original visual field and consolidated through post-processing and operating-point thresholding as described in
Section 4.1.
4. Results
The four detectors were trained to localize parasites into eight morphologic classes (species × stage). Performance was quantified using accuracy, precision, sensitivity/recall, and F1-score [
29]; mAP@0.5 and mAP@[0.5:0.95] [
30]; and computational-efficiency metrics (latency, FPS, peak RAM, and model size). The optimal model was selected by considering the balance between detection performance and real-time execution capability in resource-limited environments.
4.1. Procedure to Determine the Optimal IoU–Confidence Threshold
In this workflow, the IoU parameter is used during post-processing to consolidate duplicated detections after mapping tile-level predictions back to the original visual field. Because visual fields are subdivided into 640 × 640 tiles using a 20% overlap in both directions, the same parasite can appear in neighboring tiles and generate multiple partially misaligned boxes, particularly near tile borders. For very small targets, slight localization differences (a few pixels), partial visibility, and annotation uncertainty can yield relatively low IoU values between duplicated boxes. Therefore, an IoU threshold that is too high may fail to suppress duplicates consistently, inflating false positives at the visual-field decision level. Conversely, truly distinct parasites rarely produce high-overlap boxes due to their small spatial extent, so a lower IoU can be appropriate for duplicate removal in this setting. For this reason, we sweep IoU and confidence thresholds jointly and select an operating point that maximizes visual-field diagnostic performance while prioritizing low false-positive rates for deployment-oriented screening.
For each architecture, a “raw” prediction file was generated by retaining all bounding boxes with a minimum confidence of 0.01 and without applying any non-maximum suppression (neither standard nor soft NMS). Based on that output, a systematic sweep of the detector’s IoU and confidence thresholds was performed to characterize performance across operating points on the validation set. The IoU threshold was varied from 0.20 to 0.90 in increments of 0.05, and the corresponding performance metrics were computed for each configuration.
In addition, different confidence thresholds were evaluated: 0.226, 0.30, 0.50, 0.70, 0.80, and 0.90. The value 0.226 corresponds to the operating point that provided the best trade-off between precision and sensitivity in the validation set, while the remaining levels allow analysis of how performance changes as higher confidence is required for predictions.
For each IoU–confidence pair, accuracy, precision, sensitivity, and F1-score were computed using the original eight-class labels (
Table 3), and the results are summarized in
Table 5. The “optimal” threshold was defined as the configuration that maximized the F1-score. In case of ties, the configuration with the highest precision was selected; if the tie persisted, the configuration with the highest confidence threshold was chosen, prioritizing fewer false positives for the future mobile application.
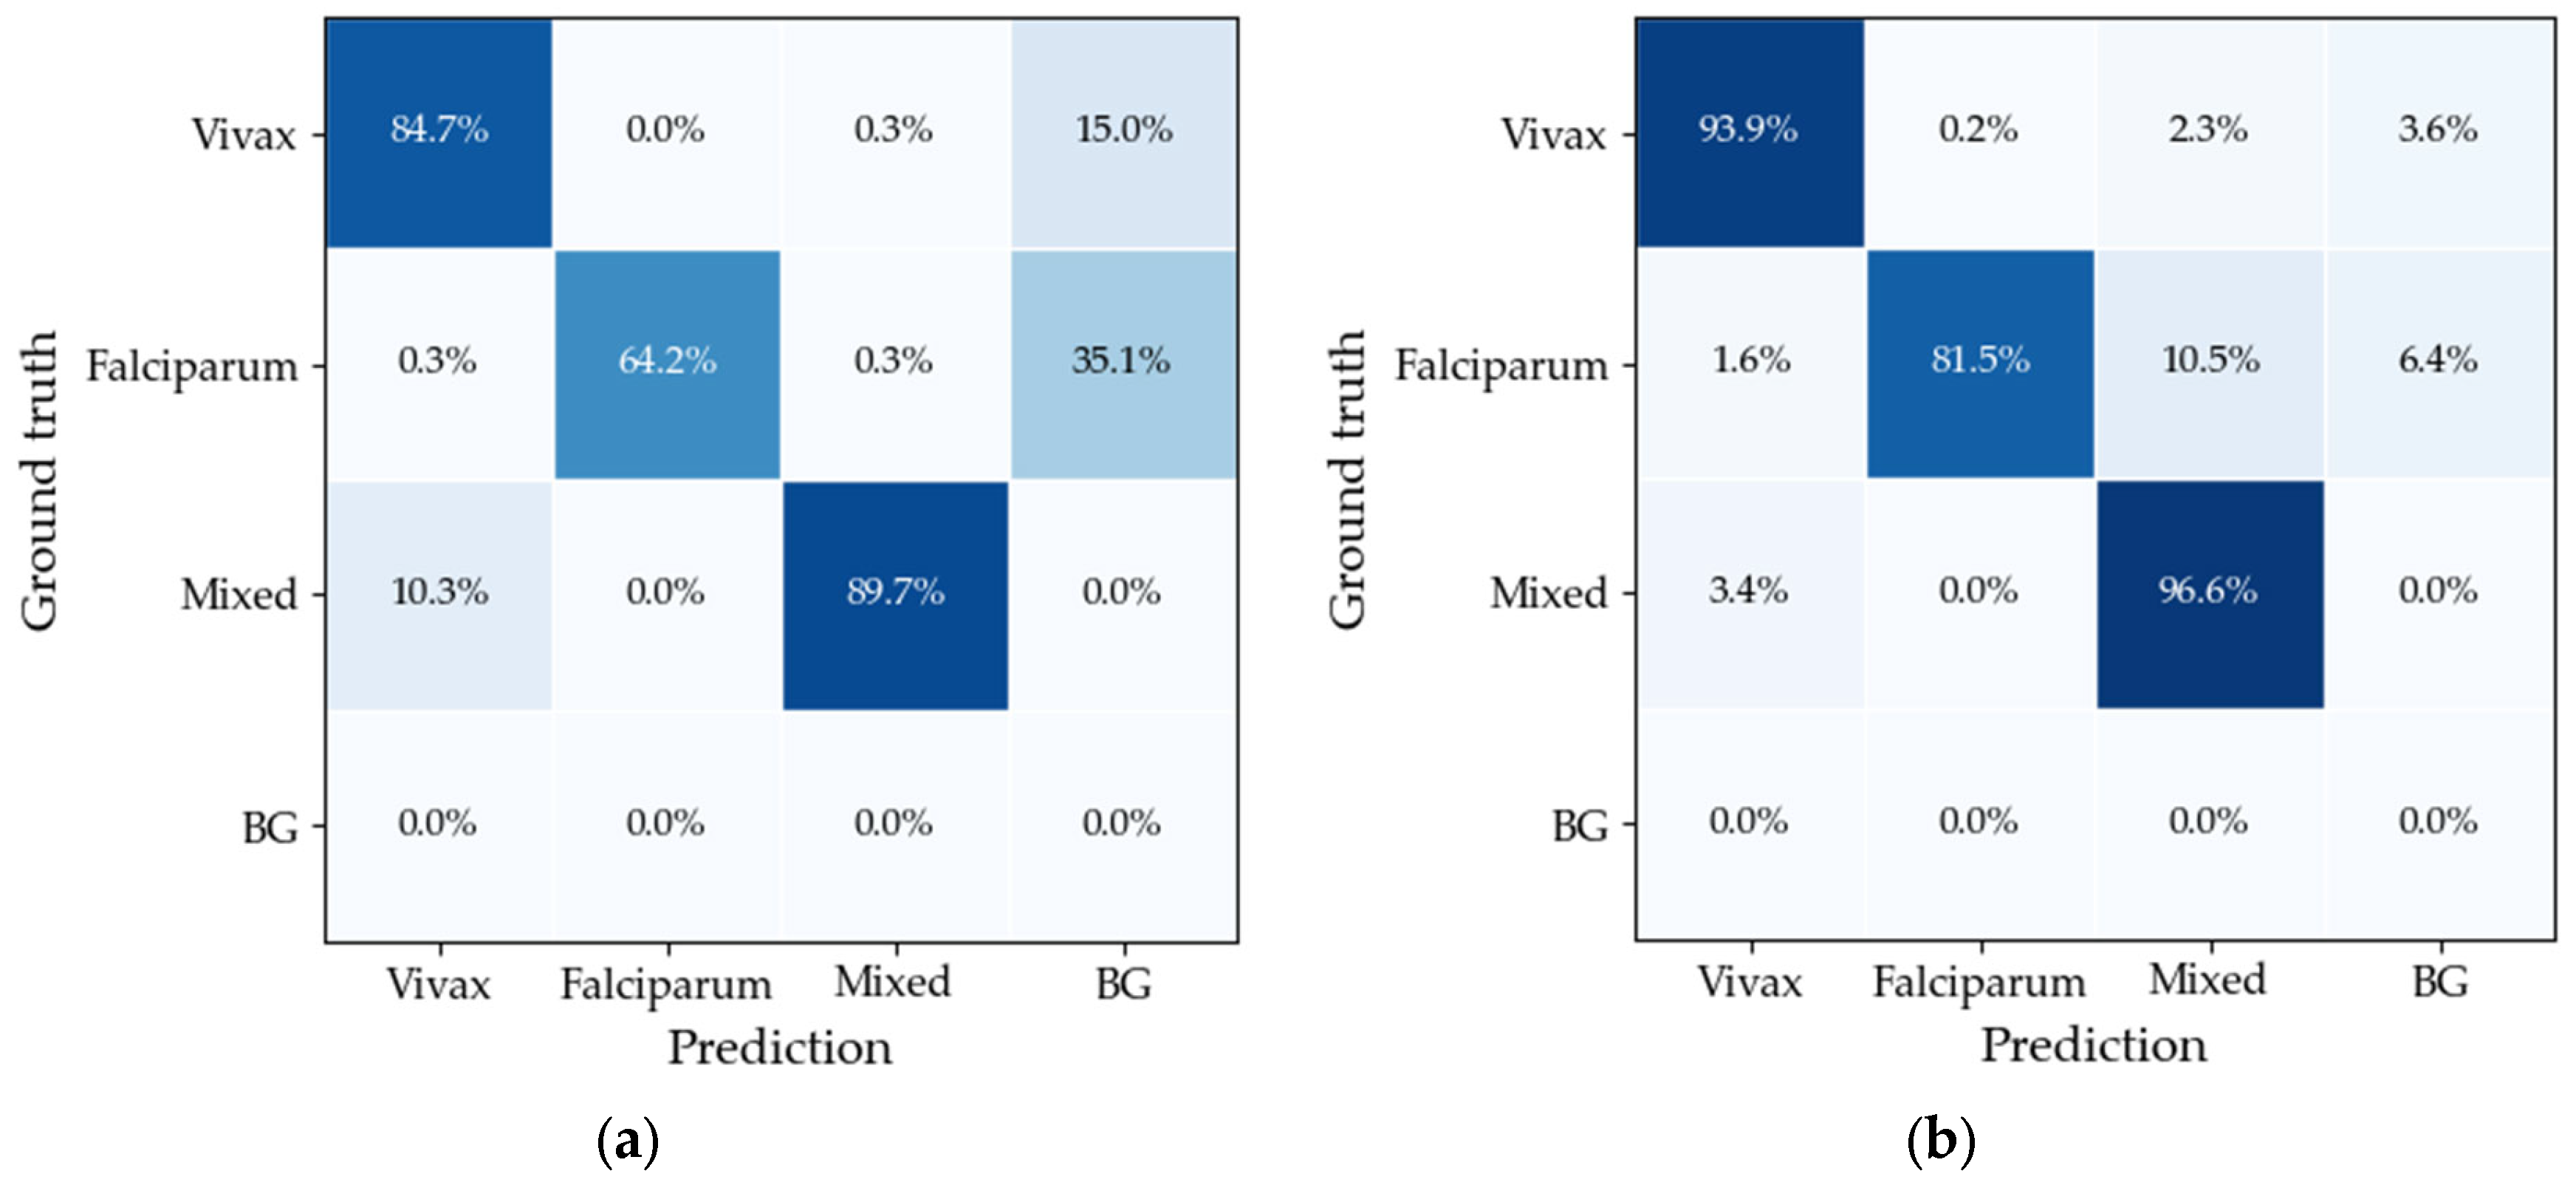
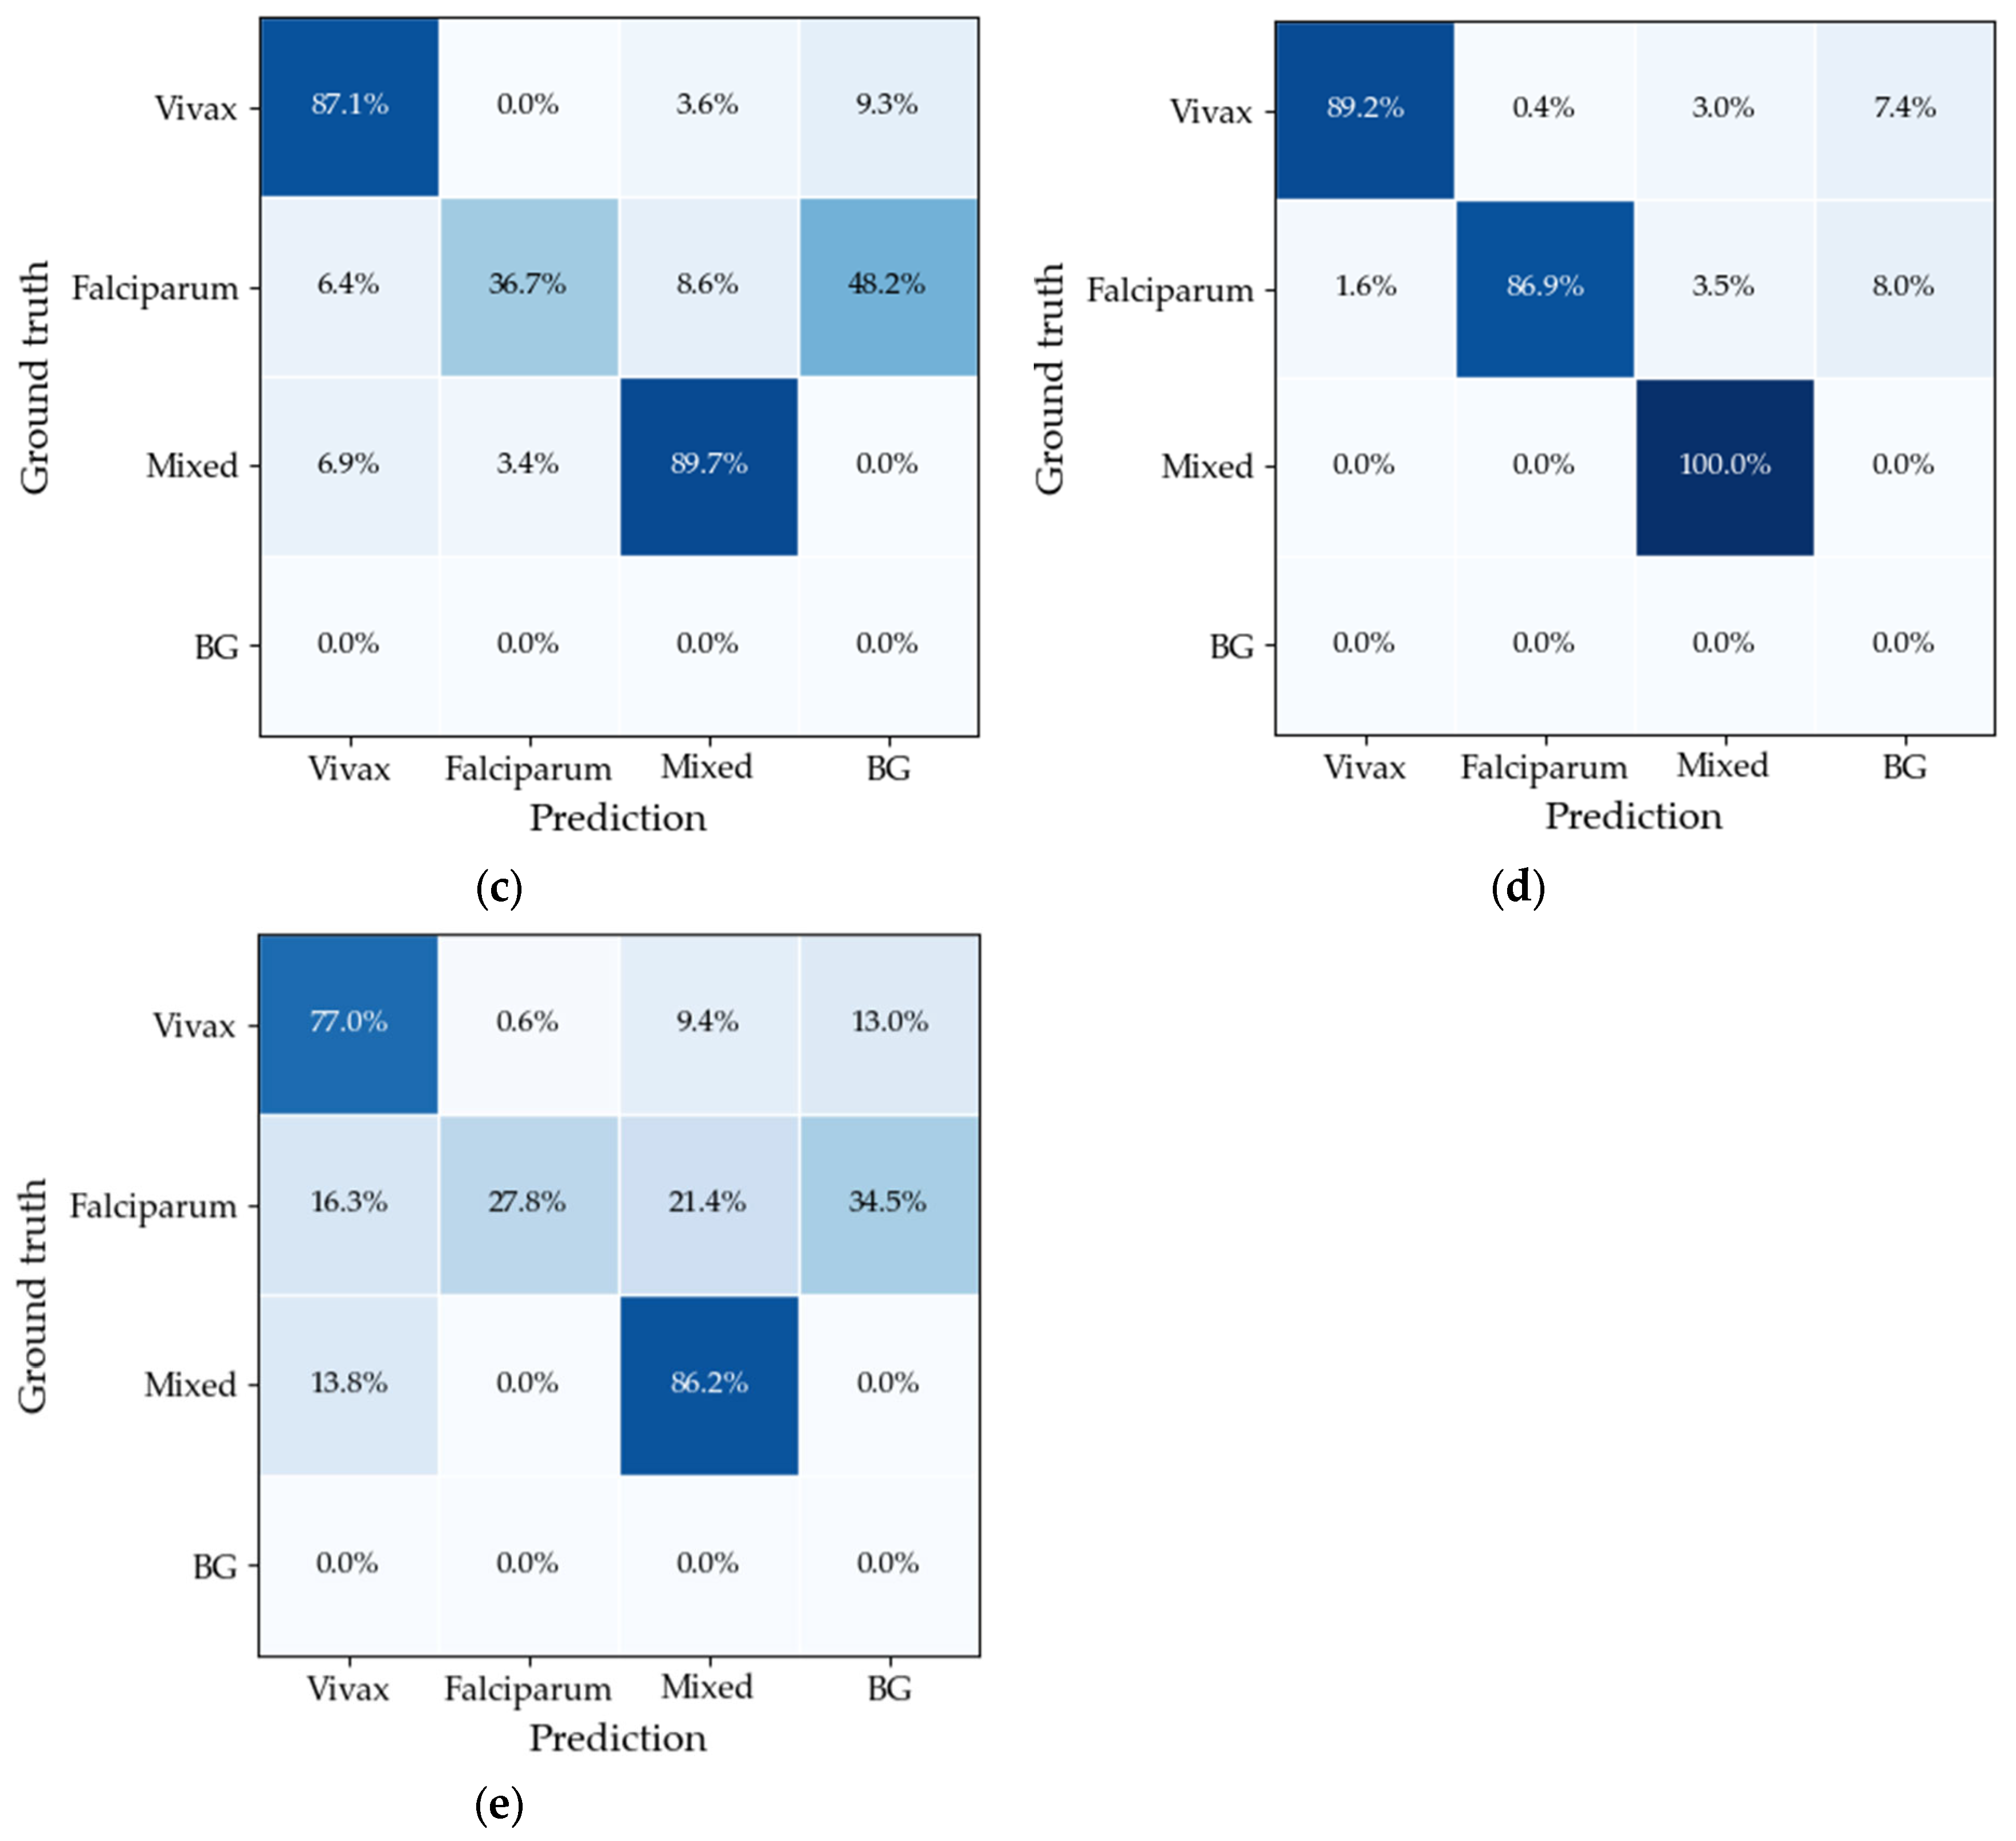
Although the detectors were trained for object detection using eight morphologic classes (species × stage), the confusion matrices in
Figure 5 report performance at the visual-field diagnostic level. For each visual field, after applying the selected confidence threshold and non-maximum suppression, all retained detections were mapped to species by aggregating any
P. vivax stage into the meta-class Vivax and any
P. falciparum stage into Falciparum. A field was labeled as Mixed when detections from both species were present. Finally, Background was defined as the absence of parasite instances in the visual field (i.e., no annotated parasites in the ground truth and no retained detections after post-processing).
Figure 5 reports diagnostic confusion matrices computed on the test set (1288 images) using the grouped classes (Vivax, Falciparum, Mixed, and Background), providing an assessment of visual-field–level diagnostic generalization.
A qualitative review of misclassified visual fields indicates that most errors are explained by a small number of recurring failure modes. False negatives typically occur in low-parasitemia fields where parasites are sparse, faint, partially occluded by leukocyte debris, or out of focus, which reduces the detector confidence below the operating threshold. False positives are most frequently associated with staining artifacts and debris that mimic parasite texture at the tile level, particularly under uneven illumination or when color balance varies across devices. In mixed-infection settings, misclassification is often driven by class imbalance within the same field: when one species is represented by very few instances, the field-level decision can be dominated by the more prevalent species, leading to under-calling mixed infections. Finally, a small fraction of errors can be attributed to tile boundary effects, where partial parasite structures appear fragmented across tiles. These observations support the need for artifact-aware augmentation and calibration of operating points when prioritizing sensitivity versus specificity in deployment.
4.2. Computational Efficiency and Resource Usage
Table 6 summarizes computational efficiency for mobile deployment. Latency and frames per second were measured on a Samsung Galaxy S24 Ultra (Samsung Electronics, Suwon, Republic of Korea) as per-inference runtime at batch size 1 for a 640 × 640 input; FPS was computed as the reciprocal of latency (FPS = 1000/Latency (ms)). Peak RAM corresponds to the maximum resident memory observed during model execution (inference), and model size was obtained from the on-disk file size of the deployed model (MB). These metrics are reported to support feasibility comparisons across architectures under smartphone constraints.
Table 7.
YOLOV11n performance.
Table 7.
YOLOV11n performance.
| Model | FPS | Latency (ms) | Peak RAM (MB) | Model Size(MB) |
|---|
| YOLOv11n—float32 | 9.02 | 110.9 | 749.6 | 10.5 |
| YOLOv11n—float16 | 9.10 | 109.9 | 782.0 | 5.3 |
| YOLOv11n—int8 | 7.98 | 125.4 | 782.0 | 3.4 |
4.3. On-Device Processing Time and Qualitative Detection Examples
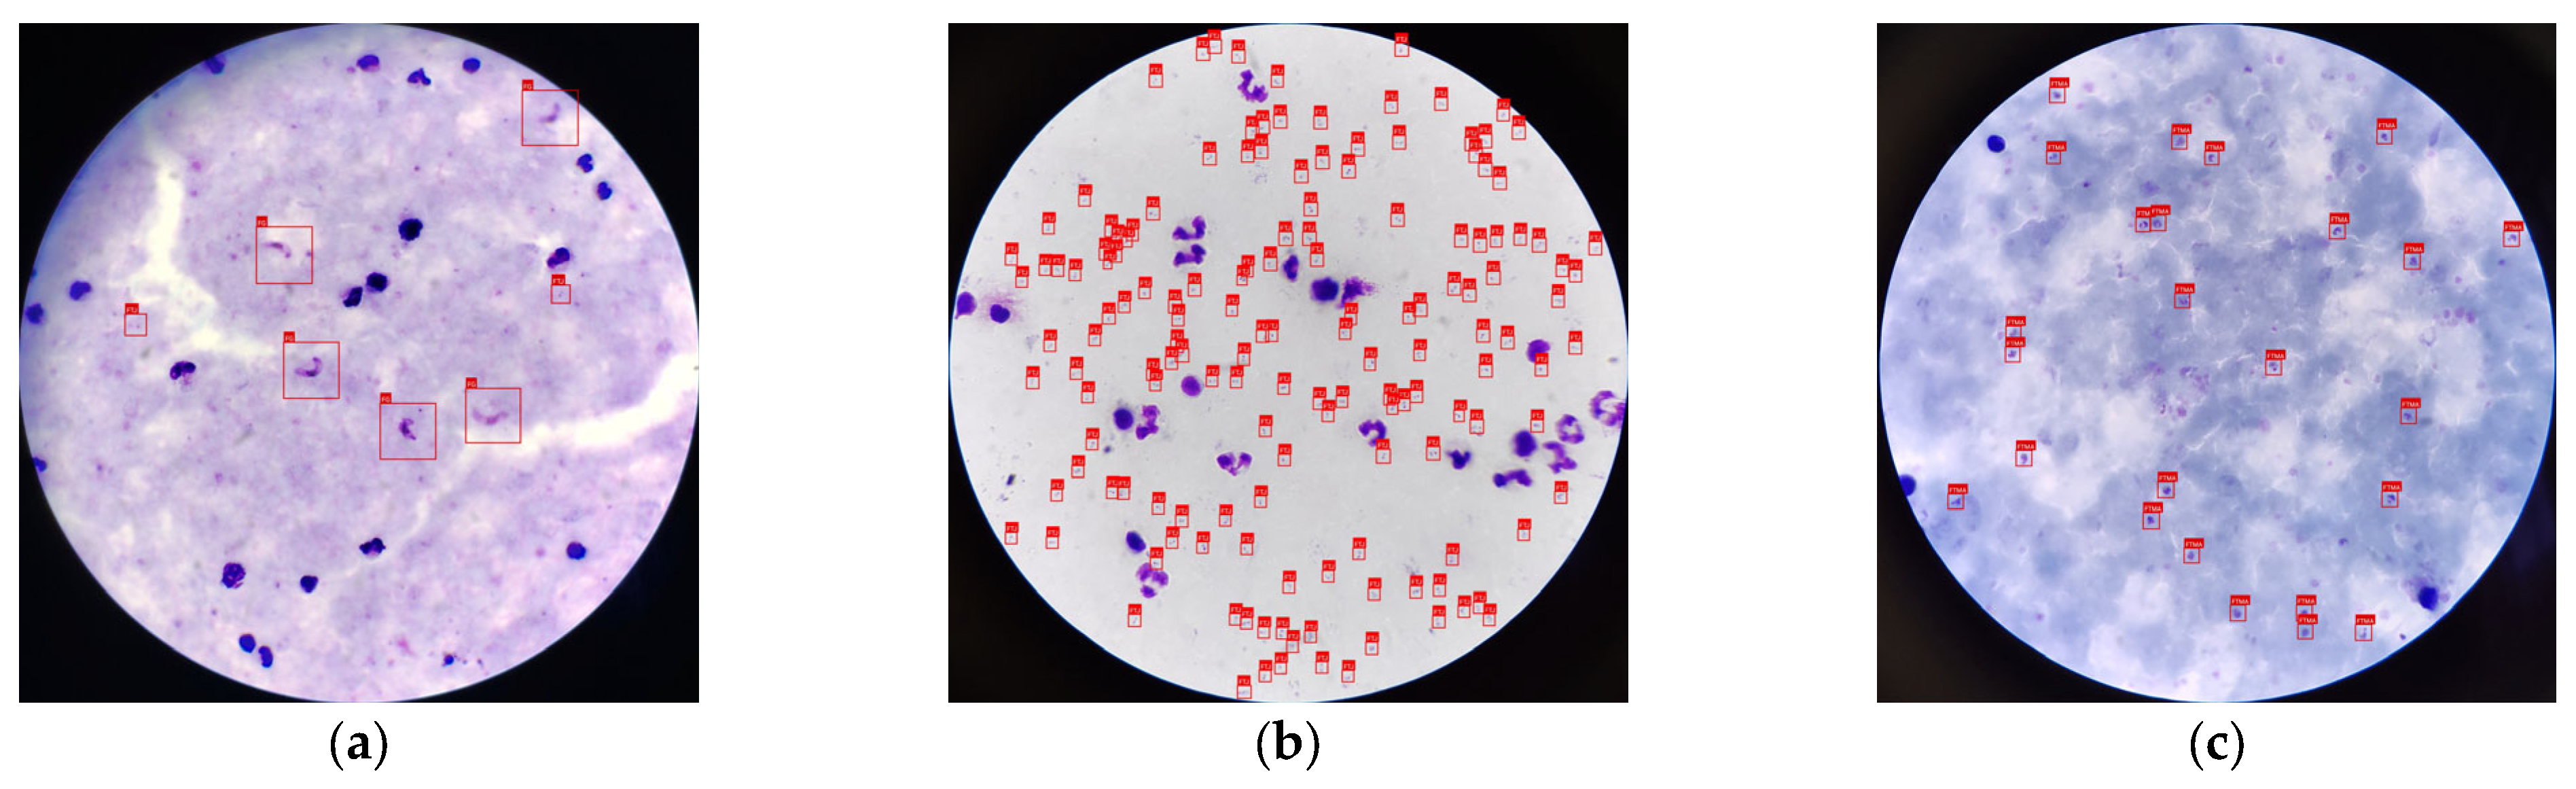
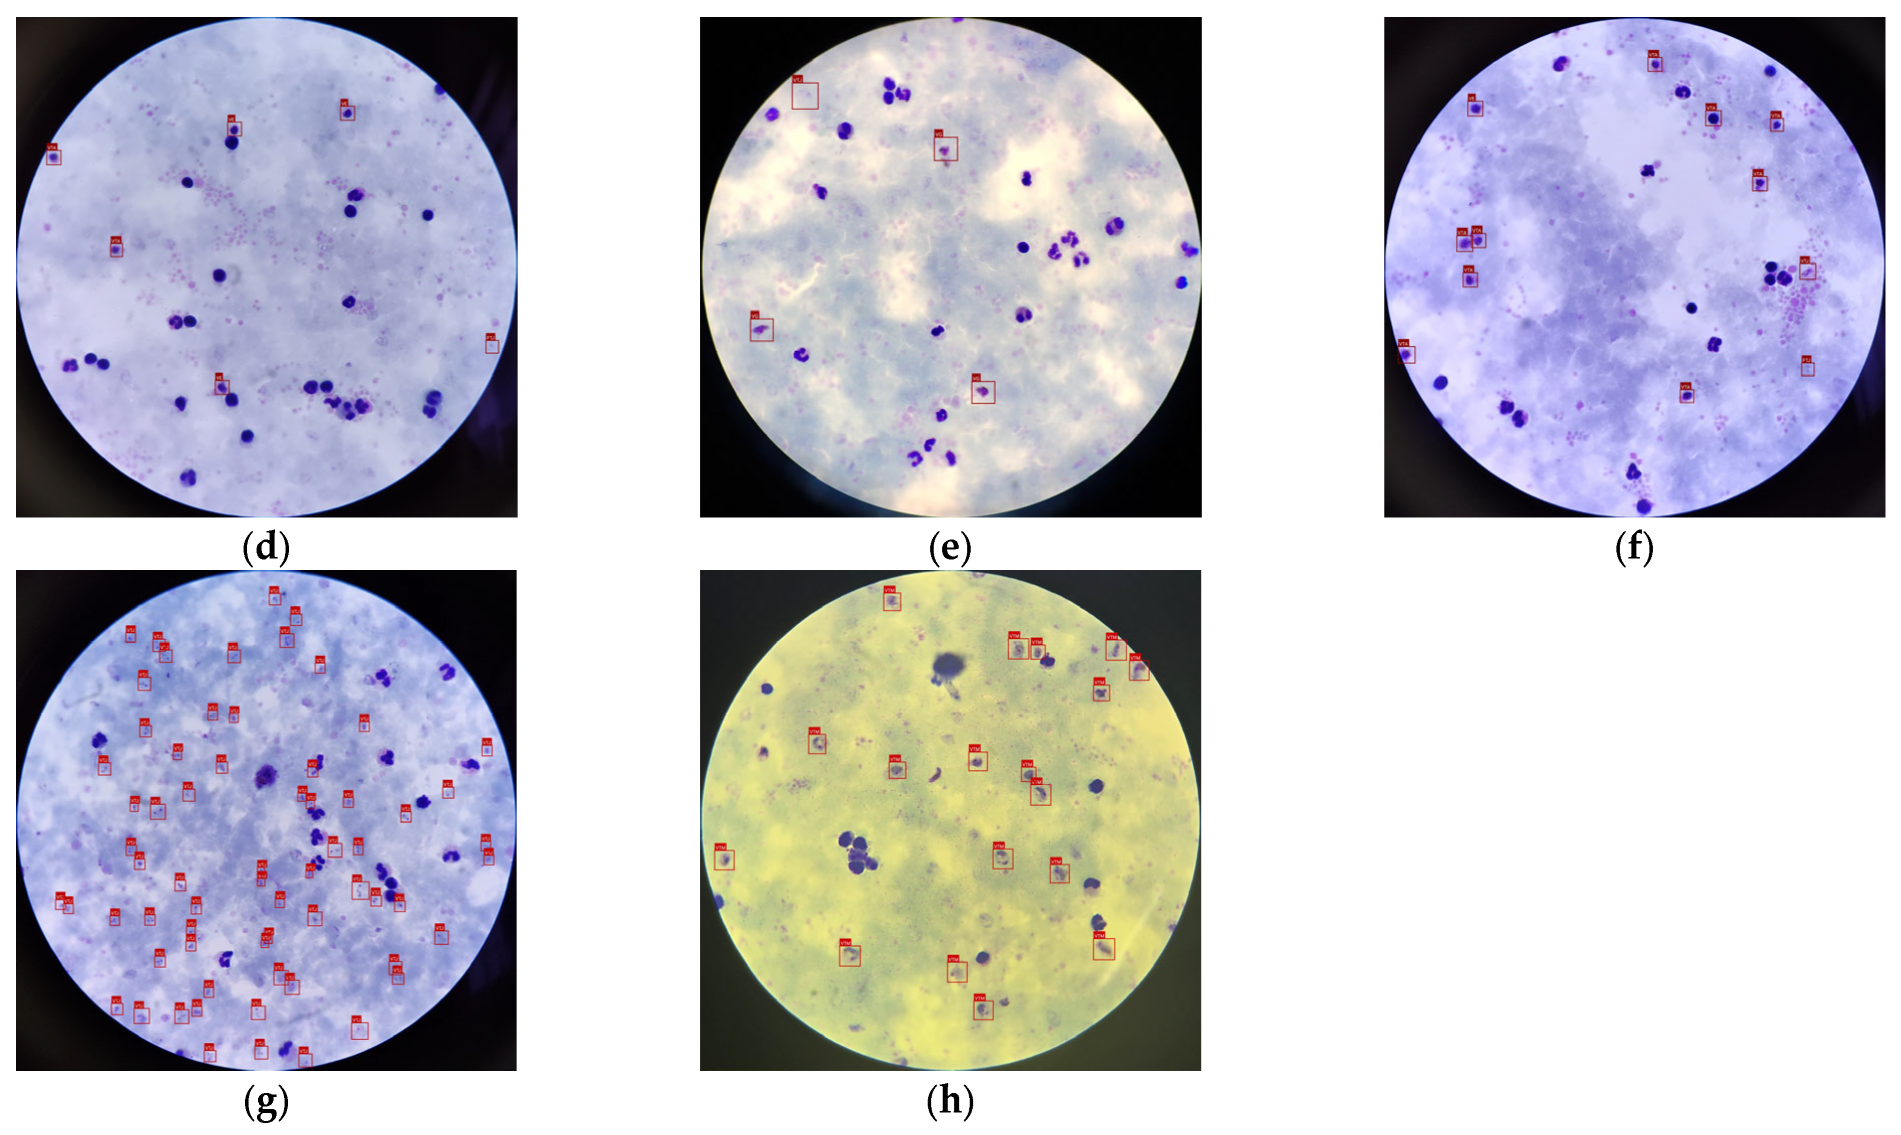
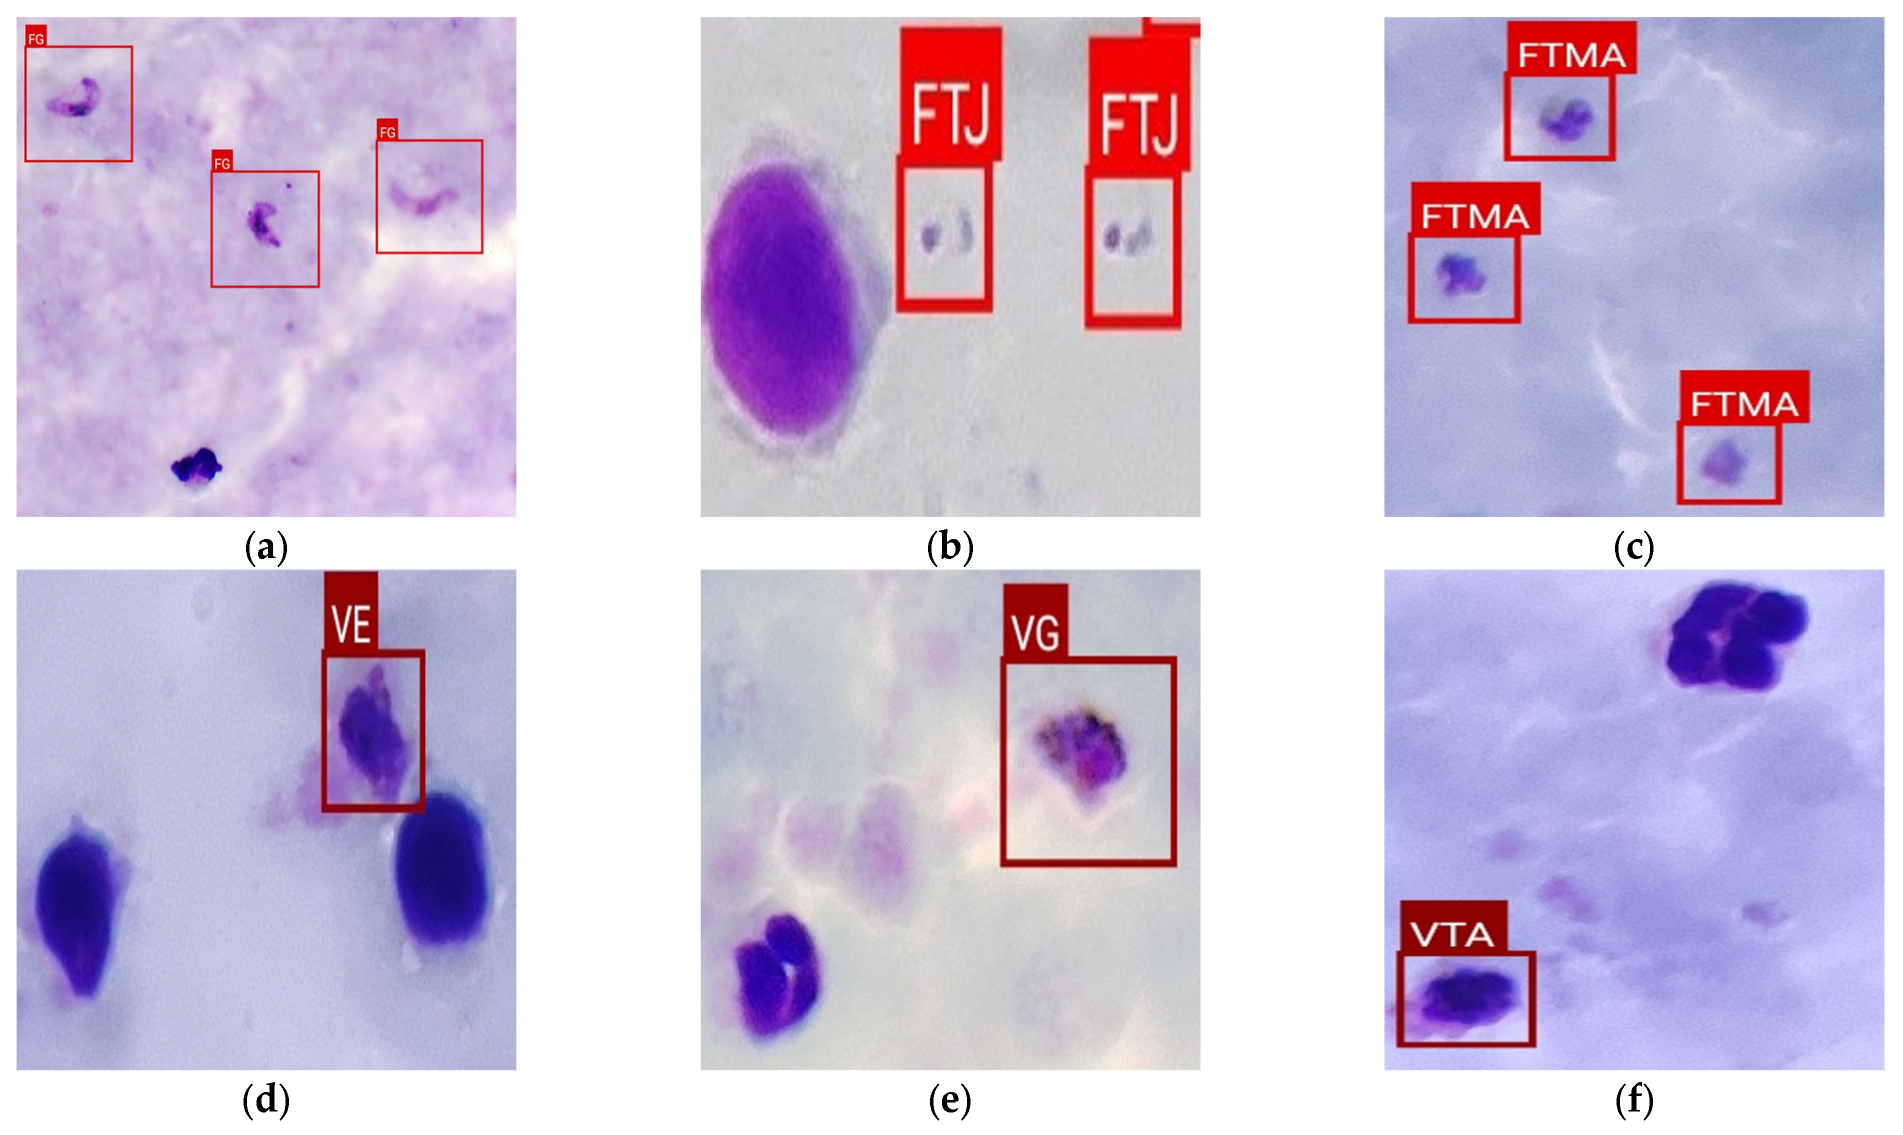
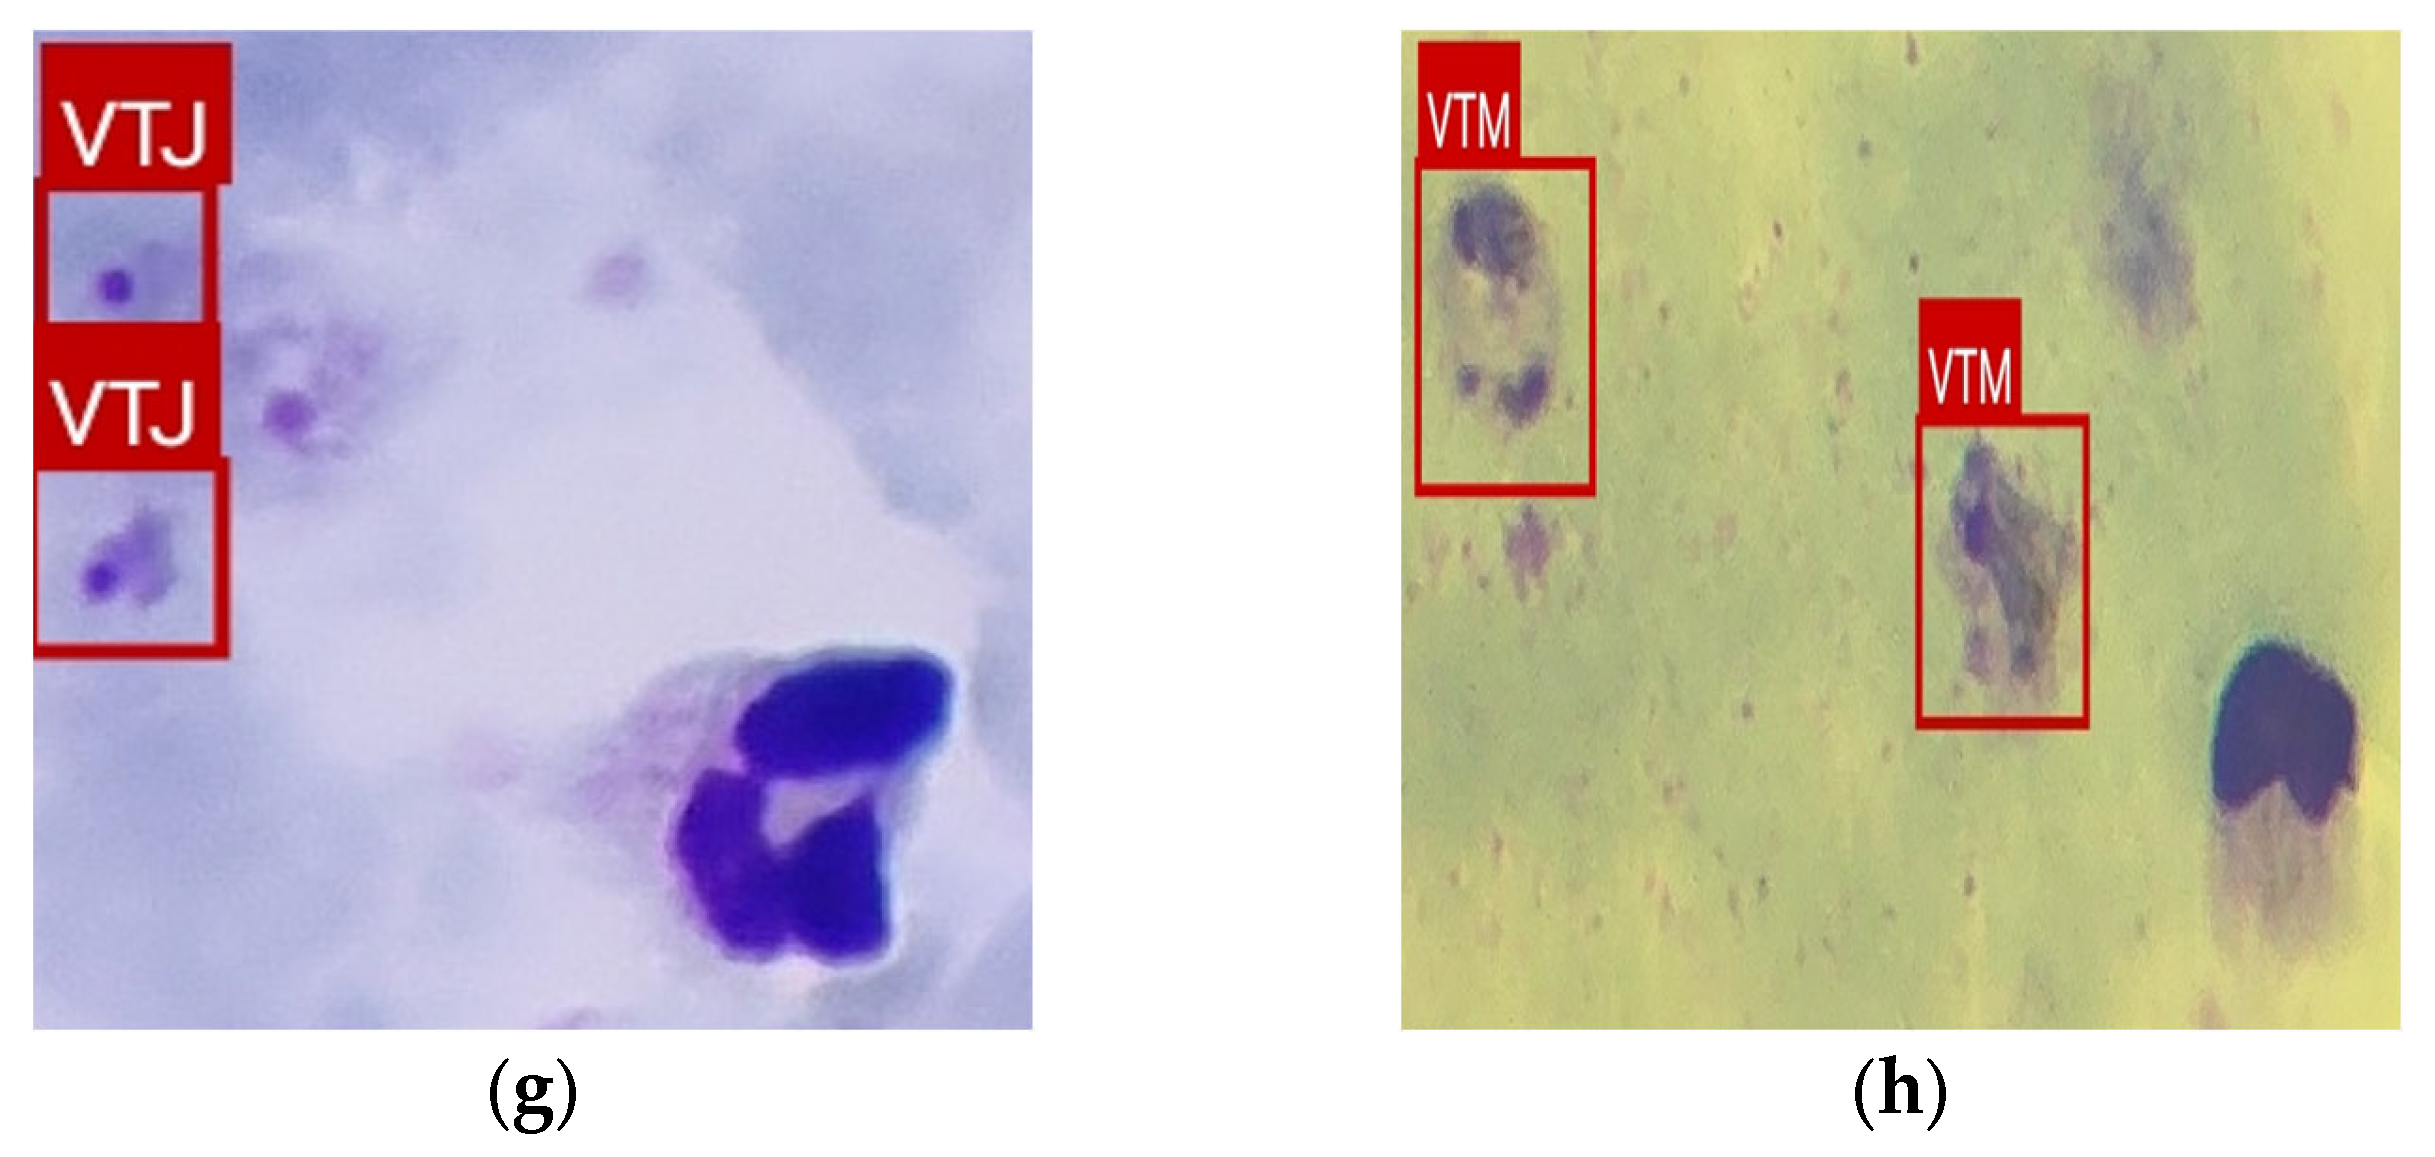
Figure 6 illustrates representative qualitative results of the proposed pipeline when detecting different parasite types under heterogeneous acquisition conditions. To facilitate a more detailed inspection of the labeled objects and detections,
Figure 7 presents zoomed-in views of selected regions from
Figure 6, highlighting parasite morphology and local visual context.
Table 8 reports resource consumption by mobile device range (CPU utilization, RAM usage, battery drain rate, and device temperature) for the evaluated detectors, providing a deployment-oriented comparison beyond accuracy alone.
Table 9 summarizes the average inference time of the mobile application, expressed in minutes and stratified by the number of detected objects and the evaluated smartphone model. In this scenario, on-device processing corresponds only to inference of the YOLOv11n-based network deployed on the smartphone.
To allow a more detailed inspection of the labeled objects,
Figure 7 presents zoomed-in views of selected regions from
Figure 6. These magnified crops highlight parasite morphology and the local visual context, making it easier to assess detection quality and to interpret challenging cases under heterogeneous acquisition conditions.
5. Discussion
This study explored a lightweight, smartphone-based system for automatic detection of Plasmodium parasites in Giemsa-stained thick smears acquired under routine conditions in the Peruvian Amazon. The pipeline, which combines visual-field segmentation, tiling, extensive data augmentation, and object detection networks, was designed to address two gaps frequently reported in previous work: the limited representativeness of training datasets and the lack of solutions explicitly optimized for execution on mobile devices in low-resource settings. By training on a clinically curated dataset with eight parasite classes from P. vivax and P. falciparum, captured with three different smartphone models in a reference laboratory setting, the proposed approach shows that compact detectors can reach performance levels compatible with decision-support use in endemic areas. Among the evaluated architectures, the YOLOv11n-based model offered the best balance between detection performance and computational efficiency on smartphones, outperforming SSD-MobileNet and Faster R-CNN variants and achieving comparable detection metrics to EfficientDet-D0 Lite at a lower computational cost.
The composition of the dataset is an important element to interpret these findings. Slides were obtained from different health facilities in Loreto and digitized using three distinct smartphone models coupled to a conventional microscope. This introduces real-world variability in staining quality, focus, illumination, and white balance, which is often absent in datasets collected under controlled laboratory conditions. In contrast to approaches that operate on manually cropped cells, our system processes entire visual fields and identifies parasites directly in thick smear images. This design is closer to the routine workflow of microscopists and reduces the need for pre-processing steps that would be difficult to reproduce consistently in peripheral laboratories.
Although all slides were clinically validated and collected under routine diagnostic practice, the source facility per slide and demographic metadata were not systematically recorded in the archival process. This limits stratified analyses, complicates the assessment of potential site-specific effects (e.g., staining and preparation differences across facilities), and may reduce representativeness, which can affect generalization when the system is applied to new regions, microscopes, smartphone camera models, or staining and slide-preparation protocols. External validation should therefore include prospective multi-site data collection across geographically distinct endemic settings, multiple microscope configurations, a broader range of smartphone cameras, and controlled variation in staining protocols, followed by recalibration of the operating point if the deployment domain exhibits distribution shift. These steps are part of ongoing and future work required before large-scale operational deployment.
The reported performance should be interpreted in the context of routine thick-smear microscopy acquired under heterogeneous, real-world conditions. Unlike controlled datasets, our images exhibit substantial variability in staining intensity, illumination, focus, white balance, and smartphone-dependent optics, together with confounders such as debris and staining artifacts that can mimic parasite texture. In addition, low-parasitemia fields and mixed-infection patterns reduce the signal-to-noise ratio and increase ambiguity. Therefore, metrics are expected to be lower than those obtained on curated, laboratory-controlled image sets, and the observed results better reflect deployment conditions in endemic, resource-limited settings.
6. Conclusions
This work presented a complete pipeline for the automated detection of Plasmodium parasites in Giemsa-stained thick smears acquired with smartphones attached to a conventional microscope. Using a clinically validated dataset that reflects real conditions in the Peruvian Amazon, the system combines visual-field segmentation, tiling, data augmentation and lightweight object detectors to identify eight parasite classes from P. vivax and P. falciparum. Among the evaluated models, a YOLOv11n-based detector provided the best compromise between detection performance and computational cost, making it suitable for deployment across Android smartphones (low-, mid-, and high-range).
The results indicate that the mobile, AI-assisted system can operate within routine microscopy time constraints (approximately 1–5 min per visual field on a Samsung Galaxy S24 Ultra and 2–10 min on the other evaluated devices, depending on detected-object count), while maintaining accuracy levels compatible with decision-support use in endemic, resource-limited settings. In reference laboratories, the tool could be used to pre-screen slides and highlight candidate regions for review by expert microscopists, helping to reduce workload and variability. In peripheral health posts, it offers a potential pathway to strengthen diagnostic capacity where expert personnel and advanced equipment are scarce.
Nevertheless, further work is required before widespread deployment. Validation in additional endemic regions, inclusion of other Plasmodium species and mixed infections, and prospective assessment of slide- and patient-level performance are essential next steps. In parallel, continued optimization of the models and their integration with existing diagnostic and surveillance infrastructures will be needed to ensure scalability and sustainability.
In summary, the proposed smartphone-based system illustrates how modern deep learning detectors, when trained on regionally relevant data and implemented on accessible hardware, can contribute to more equitable access to malaria diagnosis. With appropriate validation and integration into health services, such tools have the potential to support ongoing efforts toward control and elimination of malaria.
Future Work
Although this study focuses on Plasmodium vivax and P. falciparum due to their epidemiological relevance in our target setting and the availability of clinically validated reference slides, the proposed pipeline is species-agnostic at the system level (visual-field localization, tiling, and mobile inference). Future work will extend the dataset and annotations to other species such as P. malariae, P. ovale, and P. knowlesi, and will evaluate generalization under broader variability in staining protocols, microscopes, and acquisition devices. Additional efforts will explore lightweight fine-tuning strategies to mitigate class imbalance and morphological overlap across species. Finally, future work will further optimize P. falciparum sensitivity through class-aware calibration and expanded training data for rare or low-parasitemia presentations.
Author Contributions
Conceptualization, J.R.C., J.V.A. and R.C.V.; methodology, C.G.C., A.R.P. and E.D.C.; software, B.B.L., C.R.C., K.A.F. and M.C.M.; validation, M.C.M., K.A.F., C.C.A. and K.Z.V.; formal analysis, J.V.A. and B.B.L.; investigation, B.B.L.; resources, H.R.F.; data curation, K.Z.V., C.C.A. and C.R.C.; writing—original draft preparation, B.B.L., C.G.C., A.R.P. and E.D.C.; writing—review and editing, H.R.F. and E.D.C.; visualization, R.C.V.; supervision, H.R.F.; project administration, J.R.C.; funding acquisition, J.V.A. and R.C.V. All authors have read and agreed to the published version of the manuscript.
Funding
This research was funded by the National Program for Scientific Research and Advanced Studies of Peru (PROCIENCIA), an initiative of CONCYTEC, under grant number PE501087306-2024.
Institutional Review Board Statement
The study was conducted in accordance with the Declaration of Helsinki and approved by the Institutional Committee for Ethics in Research (Comité Institucional de Ética en Investigación, CIEI) of the Universidad Nacional de la Amazonía Peruana; Iquitos, Peru (protocol code PI-094-28/06/24-CIEI-UNAP; approval date 26 September 2024).
Informed Consent Statement
Written informed consent was obtained by the Regional Health Directorate of Loreto (GERESA Loreto) from all individuals whose blood smears were used in this study, as part of routine malaria diagnosis. The authors only had access to anonymized, blinded slides with no personal identifiers.
Data Availability Statement
Acknowledgments
The authors would like to thank Milagro Wu Mestanza, Valeria Belén Pinedo Torres, and Pegui Amasifuen Arimuya, technicians from the Reference Laboratory of Loreto—GERESA, for their valuable work in the annotation and verification of the malaria images used in this study. The computational experiments were carried out at the High-Performance Computing Center of the Peruvian Amazon at the Instituto de Investigaciones de la Amazonía Peruana (IIAP) [
31].
Conflicts of Interest
The authors declare no conflicts of interest.
References
- Sato, S. Plasmodium—A brief introduction to the parasites causing human malaria and their basic biology. J. Physiol. Anthropol. 2021, 40, 1. [Google Scholar] [CrossRef]
- World Health Organization. World Malaria Report 2023; World Health Organization: Geneva, Switzerland, 2023. [Google Scholar]
- Perez, D. CDC Perú: Más de 15 mil casos de malaria se han notificado desde inicios del 2022. Centro Nacional de Epidemiología, Prevención y Control de Enfermedades (CDC Perú), Ministerio de Salud del Perú (MINSA), 9 August 2022. Available online: https://www.dge.gob.pe/portalnuevo/informacion-publica/prensa/cdc-peru-mas-de-15-mil-casos-de-malaria-se-han-notificado-desde-inicios-del-2022/ (accessed on 29 September 2025).
- Salazar, G.E.D.; Cano, R.R.V.; Cabrera, J.M.G.; Makiya, J.M.S.; Ramos, C.A.R.; Espinoza, J.R.R.; Rosas, O.R.M.; Colmenares, R.C.M. Incidencia acumulada y distribución espaciotemporal de la malaria en el Perú en el periodo 2000 al 2022. An. Fac. Med. 2024, 85, 414–420. [Google Scholar] [CrossRef]
- Maturana, C.R.; de Oliveira, A.D.; Nadal, S.; Bilalli, B.; Serrat, F.Z.; Soley, M.E.; Igual, E.S.; Bosch, M.; Lluch, A.V.; Abelló, A.; et al. Advances and challenges in automated malaria diagnosis using digital microscopy imaging with artificial intelligence tools: A review. Front. Microbiol. 2022, 13, 1006659. [Google Scholar] [CrossRef] [PubMed]
- Shambhu, S.; Koundal, D.; Das, P.; Hoang, V.T.; Tran-Trung, K.; Turabieh, H. Computational Methods for Automated Analysis of Malaria Parasite Using Blood Smear Images: Recent Advances. Comput. Intell. Neurosci. 2022, 2022, 3626726. [Google Scholar] [CrossRef] [PubMed]
- Fuhad, K.M.F.; Tuba, J.F.; Sarker, M.R.A.; Momen, S.; Mohammed, N.; Rahman, T. Deep Learning Based Automatic Malaria Parasite Detection from Blood Smear and Its Smartphone Based Application. Diagnostics 2020, 10, 329. [Google Scholar] [CrossRef]
- Mujahid, M.; Rustam, F.; Shafique, R.; Montero, E.C.; Alvarado, E.S.; Diez, I.d.l.T.; Ashraf, I. Efficient deep learning-based approach for malaria detection using red blood cell smears. Sci. Rep. 2024, 14, 13249. [Google Scholar] [CrossRef]
- Hemachandran, K.; Alasiry, A.; Marzougui, M.; Ganie, S.M.; Pise, A.A.; Alouane, M.T.-H.; Chola, C. Performance Analysis of Deep Learning Algorithms in Diagnosis of Malaria Disease. Diagnostics 2023, 13, 534. [Google Scholar] [CrossRef]
- Zhao, O.S.; Kolluri, N.; Anand, A.; Chu, N.; Bhavaraju, R.; Ojha, A.; Tiku, S.; Nguyen, D.; Chen, R.; Morales, A.; et al. Convolutional neural networks to automate the screening of malaria in low-resource countries. PeerJ 2020, 8, e9674. [Google Scholar] [CrossRef]
- Davidson, M.S.; Andradi-Brown, C.; Yahiya, S.; Chmielewski, J.; O’dOnnell, A.J.; Gurung, P.; Jeninga, M.D.; Prommana, P.; Andrew, D.W.; Petter, M.; et al. Automated detection and staging of malaria parasites from cytological smears using convolutional neural networks. Biol. Imaging 2021, 1, e2. [Google Scholar] [CrossRef]
- Liu, R.; Liu, T.; Dan, T.; Yang, S.; Li, Y.; Luo, B.; Zhuang, Y.; Fan, X.; Zhang, X.; Cai, H.; et al. AIDMAN: An AI-based object detection system for malaria diagnosis from smartphone thin-blood-smear images. Patterns 2023, 4, 100806. [Google Scholar] [CrossRef]
- Yu, H.; Mohammed, F.O.; Hamid, M.A.; Yang, F.; Kassim, Y.M.; Mohamed, A.O.; Maude, R.J.; Ding, X.C.; Owusu, E.D.; Yerlikaya, S.; et al. Patient-level performance evaluation of a smartphone-based malaria diagnostic application. Malar. J. 2023, 22, 33. [Google Scholar] [CrossRef]
- Rajeshwari, R.; Anushya, A.; Elakya, R.; Harsha, S. Circular Hough Transform and Region Based Methods for Counting of Red Blood and White Blood Cells. Math. Stat. Eng. Appl. 2022, 71, 8519–8525. [Google Scholar] [CrossRef]
- Qiu, Z.; Ou, W.; Mo, D.; Sun, Y.; Ma, X.; Chen, X.; Tian, X. BGWL-YOLO: A Lightweight and Efficient Object Detection Model for Apple Maturity Classification Based on the YOLOv11n Improvement. Horticulturae 2025, 11, 1068. [Google Scholar] [CrossRef]
- Kebaili, A.; Lapuyade-Lahorgue, J.; Ruan, S. Deep Learning Approaches for Data Augmentation in Medical Imaging: A Review. J. Imaging 2023, 9, 81. [Google Scholar] [CrossRef] [PubMed]
- Islam, T.; Hafiz, M.S.; Jim, J.R.; Kabir, M.M.; Mridha, M.F. A systematic review of deep learning data augmentation in medical imaging: Recent advances and future research directions. Healthc. Anal. 2024, 5, 100340. [Google Scholar] [CrossRef]
- Wang, J.; Lee, S. Data Augmentation Methods Applying Grayscale Images for Convolutional Neural Networks in Machine Vision. Appl. Sci. 2021, 11, 6721. [Google Scholar] [CrossRef]
- Goceri, E. Medical image data augmentation: Techniques, comparisons and interpretations. Artif. Intell. Rev. 2023, 56, 12561–12605. [Google Scholar] [CrossRef]
- Rainio, O.; Klén, R. Comparison of simple augmentation transformations for a convolutional neural network classifying medical images. Signal Image Video Process. 2024, 18, 3353–3360. [Google Scholar] [CrossRef]
- Shariff, V.; Paritala, C.; Ankala, K.M. Optimizing non small cell lung cancer detection with convolutional neural networks and differential augmentation. Sci. Rep. 2025, 15, 15640. [Google Scholar] [CrossRef]
- Wang, S. Effectiveness of traditional augmentation methods for rebar counting using UAV imagery with Faster R-CNN and YOLOv10-based transformer architectures. Sci. Rep. 2025, 15, 33702. [Google Scholar] [CrossRef]
- Ghiasi, G.; Cui, Y.; Srinivas, A.; Qian, R.; Lin, T.-Y.; Cubuk, E.D.; Le, Q.V.; Zoph, B. Simple Copy-Paste is a Strong Data Augmentation Method for Instance Segmentation. In Proceedings of the 2021 IEEE/CVF Conference on Computer Vision and Pattern Recognition (CVPR), Nashville, TN, USA, 20–25 June 2021; IEEE Computer Society: Los Alamitos, CA, USA, 2021; pp. 2917–2927. [Google Scholar] [CrossRef]
- Ma, Y.; Xi, C.; Ma, T.; Sun, H.; Lu, H.; Xu, X.; Xu, C. I-YOLOv11n: A Lightweight and Efficient Small Target Detection Framework for UAV Aerial Images. Sensors 2025, 25, 4857. [Google Scholar] [CrossRef]
- Tan, M.; Pang, R.; Le, Q.V. EfficientDet: Scalable and Efficient Object Detection. In Proceedings of the 2021 IEEE/CVF Conference on Computer Vision and Pattern Recognition (CVPR), Nashville, TN, USA, 20–25 June 2021; IEEE Computer Society: Los Alamitos, CA, USA, 2021; pp. 10778–10787. [Google Scholar] [CrossRef]
- Liu, W.; Anguelov, D.; Erhan, D.; Szegedy, C.; Reed, S.; Fu, C.Y.; Berg, A.C. SSD: Single Shot MultiBox Detector. In Computer Vision—ECCV 2016, 14th European Conference, Amsterdam, The Netherlands, 11–14 October 2016; Leibe, B., Matas, J., Sebe, N., Welling, M., Eds.; Springer International Publishing: Cham, Switzerland, 2016; pp. 21–37. [Google Scholar] [CrossRef]
- Ren, S.; He, K.; Girshick, R.; Sun, J. Faster R-CNN: Towards Real-Time Object Detection with Region Proposal Networks. IEEE Trans. Pattern Anal. Mach. Intell. 2017, 39, 1137–1149. [Google Scholar] [CrossRef] [PubMed]
- Howard, A.; Sandler, M.; Chen, B.; Wang, W.; Chen, L.-C.; Tan, M.; Chu, G.; Vasudevan, V.; Zhu, Y.; Pang, R.; et al. Searching for MobileNetV3. In Proceedings of the 2019 IEEE/CVF International Conference on Computer Vision (ICCV), Seoul, Republic of Korea, 27 October–2 November 2019; pp. 1314–1324. [Google Scholar] [CrossRef]
- Hand, D.J.; Christen, P.; Kirielle, N. F*: An interpretable transformation of the F-measure. Mach. Learn. 2021, 110, 451–456. [Google Scholar] [CrossRef]
- Padilla, R.; Passos, W.L.; Dias, T.L.B.; Netto, S.L.; da Silva, E.A.B. A Comparative Analysis of Object Detection Metrics with a Companion Open-Source Toolkit. Electronics 2021, 10, 279. [Google Scholar] [CrossRef]
- Instituto de Investigaciones de la Amazonía Peruana (IIAP). Supercomputador MANATI; Instituto de Investigaciones de la Amazonía Peruana: Iquitos, Peru, 2017. Available online: http://iiap.org.pe/web/carcap.aspx (accessed on 29 September 2025).
Figure 2.
Example of annotation using the custom mobile application. (a) Class selection, (b) region of interest selection, (c) annotated image.
Figure 2.
Example of annotation using the custom mobile application. (a) Class selection, (b) region of interest selection, (c) annotated image.
Figure 3.
Image preparation. (a) Segmentation of the visual field, (b) scaling to 2510 × 2510, (c) tiling example.
Figure 3.
Image preparation. (a) Segmentation of the visual field, (b) scaling to 2510 × 2510, (c) tiling example.
Figure 4.
Data augmentation. (a) Original image, (b) Gaussian blur, (c) brightness, (d) contrast, (e) rotation, (f) saturation, (g) scaling, (h) cut–paste (original), (i) cut–paste (result).
Figure 4.
Data augmentation. (a) Original image, (b) Gaussian blur, (c) brightness, (d) contrast, (e) rotation, (f) saturation, (g) scaling, (h) cut–paste (original), (i) cut–paste (result).
Figure 5.
Confusion matrices. (a) Confusion matrix YOLOv11n (without data augmentation—IoU 0.20/Conf 0.50). (b) Confusion matrix YOLOv11n (IoU 0.20/Conf 0.50). (c) Confusion matrix SSD-MobileNetV1 (IoU 0.20/Conf 0.226). (d) Confusion matrix EfficientDet-D0 (IoU 0.20/Conf 0.90). (e) Confusion matrix Faster R-CNN + MobileNetV3-Small (IoU 0.20/Conf 0.50).
Figure 5.
Confusion matrices. (a) Confusion matrix YOLOv11n (without data augmentation—IoU 0.20/Conf 0.50). (b) Confusion matrix YOLOv11n (IoU 0.20/Conf 0.50). (c) Confusion matrix SSD-MobileNetV1 (IoU 0.20/Conf 0.226). (d) Confusion matrix EfficientDet-D0 (IoU 0.20/Conf 0.90). (e) Confusion matrix Faster R-CNN + MobileNetV3-Small (IoU 0.20/Conf 0.50).
Figure 6.
Detection example. (a) Falciparum gametocyte, (b) Falciparum young trophozoite, (c) Falciparum medium trophozoite, (d) Vivax schizont, (e) Vivax gametocyte, (f) Vivax mature trophozoite, (g) Vivax young trophozoite, (h) Vivax medium trophozoite.
Figure 6.
Detection example. (a) Falciparum gametocyte, (b) Falciparum young trophozoite, (c) Falciparum medium trophozoite, (d) Vivax schizont, (e) Vivax gametocyte, (f) Vivax mature trophozoite, (g) Vivax young trophozoite, (h) Vivax medium trophozoite.
Figure 7.
Zoom over detection example in
Figure 6. (
a) Falciparum gametocyte, (
b) Falciparum young trophozoite, (
c) Falciparum medium trophozoite, (
d) Vivax schizont, (
e) Vivax gametocyte, (
f) Vivax mature trophozoite, (
g) Vivax young trophozoite, (
h) Vivax medium trophozoite.
Figure 7.
Zoom over detection example in
Figure 6. (
a) Falciparum gametocyte, (
b) Falciparum young trophozoite, (
c) Falciparum medium trophozoite, (
d) Vivax schizont, (
e) Vivax gametocyte, (
f) Vivax mature trophozoite, (
g) Vivax young trophozoite, (
h) Vivax medium trophozoite.
Table 1.
Summary of previous studies on automated detection of Plasmodium parasites in blood smear images, including type of smear, data size, validation level, and main limitations.
Table 1.
Summary of previous studies on automated detection of Plasmodium parasites in blood smear images, including type of smear, data size, validation level, and main limitations.
| Study | Sample Type | No. of Images/Cells | Field Validation | Species Considered |
|---|
| [5] | Segmented NIH images (P. falciparum) | 27,558 | No | 1 species |
| [6] | NIH dataset | 27,558 | No | 1 species |
| [7] | NIH dataset | 27,558 | No | 1 species |
| [8] | NIH + Broad datasets | 28,952 images | No | 2 species (falciparum, vivax) |
| [9] | In vitro cultures | 38,000 erythrocytes | No | 1 species (falciparum) |
| [10] | Thin smears, 140 patients | 1822 images | Yes (64 patients) | 1 species |
| [11] | Clinical smears, 190 patients | – | Yes (Sudan) | 2 species (falciparum, vivax) |
| This work | Real smears with coinfections, different origins (Peru) | 8625 images (400 patients) | Yes | 2 species + coinfections (falciparum, vivax, both) |
Table 2.
Distribution of images per device.
Table 2.
Distribution of images per device.
| Phone Model | Megapixels | Aperture | Exposure
Time | ISO | Exposure
Compensation | Focal Length | Images |
|---|
| Honor ALI-NX3 | 12 MP | f/1.8 | 1/60 s | ISO-222 | 0 | 5 mm | 4389 |
| Motorola Edge 30 Pro | 12.6 MP | f/1.8 | 1/120 s | ISO-256 | 0 | 6 mm | 3211 |
| Samsung Galaxy S24 Ultra | 12 MP | f/1.7 | 1/180 s | ISO-80 | 0 | 6 mm | 1025 |
| Total | 8625 |
Table 3.
Distribution of annotated classes.
Table 3.
Distribution of annotated classes.
| No. | Label | Annotations |
|---|
| 1 | Plasmodium vivax trophozoite (mature) | 1591 |
| 2 | P. vivax trophozoite (developing) | 19,973 |
| 3 | P. vivax trophozoite (young) | 17,399 |
| 4 | P. vivax gametocyte | 1543 |
| 5 | P. vivax schizont | 516 |
| 6 | Plasmodium falciparum trophozoite (mature) | 1788 |
| 7 | P. falciparum trophozoite (young) | 10,283 |
| 8 | P. falciparum gametocyte | 1438 |
| Total | 54,531 |
Table 4.
Selected deep models and technical justification.
Table 4.
Selected deep models and technical justification.
| Model | Technical Justification | Key Advantage |
|---|
| YOLOv11n | Ultralight single-stage detector specifically optimized for execution on mobile hardware with a reduced number of parameters. It maintains good capability for detecting small objects and offers a competitive trade-off between accuracy, inference speed, and memory consumption [24]. | Compact model size with competitive latency on smartphones |
| EfficientDet-D0 Lite | Architecture based on compound scaling and an efficient BiFPN, which allows balanced exploitation of resolution, depth, and width. The D0 Lite variant is oriented toward resource-constrained devices and constitutes a good comparison point against other lightweight architectures [25]. | Excellent mAP/latency ratio on mobile processors |
| SSD-MobileNetV1 | Classical combination of a single-stage detector (SSD) with a lightweight backbone (MobileNetV1), widely used in mobile and embedded vision scenarios. Its architectural simplicity and low computational cost make it an appropriate baseline to contrast the benefits of more recent architectures [26]. | Very low RAM usage (<25 MB) and high CPU speed |
| Faster R-CNN + MobileNetV3-Small | Two-stage detector with higher capacity, coupled to a modern backbone optimized for mobile devices. This configuration allows comparison of a region-proposal scheme against single-stage detectors while keeping the number of parameters and computational cost under control [27,28]. | High sensitivity, minimizes false negatives in diagnosis |
Table 5.
Quantitative results per architecture.
Table 5.
Quantitative results per architecture.
| Model | Optimal IoU | Optimal Conf. | Accuracy (%) | Precision | Sensitivity | F1-Score | mAP@0.5 | mAP@0.5:0.95 |
|---|
| YOLOv11n(without data augmentation) | 0.20 | 0.50 | 79.81 | 0.893 | 0.798 | 0.882 | 54.57 | 33.53 |
| YOLOv11n | 0.20 | 0.50 | 90.92 | 0.978 | 0.909 | 0.938 | 65.71 | 39.44 |
| SSD-MobileNet V1 | 0.20 | 0.226 | 74.92 | 0.963 | 0.749 | 0.816 | 33.42 | 15.51 |
| EfficientDet-D0 Lite | 0.20 | 0.90 | 88.89 | 0.979 | 0.889 | 0.929 | 79.84 | 56.62 |
| Faster R-CNN + MobileNetV3-S | 0.20 | 0.50 | 65.22 | 0.913 | 0.652 | 0.728 | 22.43 | 7.00 |
Table 6.
Mobile runtime and memory footprint on Samsung Galaxy S24 Ultra (640 × 640, batch size 1).
Table 6.
Mobile runtime and memory footprint on Samsung Galaxy S24 Ultra (640 × 640, batch size 1).
| Model | Latency (ms) | FPS | Peak RAM (MB) | Model Size (MB) |
|---|
| YOLOv11n 1 | 110.9 | 9.02 | 749.6 | 10.5 |
| SSD-MobileNet V1 | 184.1 | 5.43 | 523.7 | 9.2 |
| EfficientDet-D0 Lite | 146.2 | 6.85 | 892.3 | 24.8 |
| Faster R-CNN + MobileNetV3-S | 458.7 | 2.18 | 1247.5 | 31.6 |
Table 8.
Resource Consumption by Mobile Device Range.
Table 8.
Resource Consumption by Mobile Device Range.
| Model | Device Range | CPU (%) | RAM (MB) | Battery (mAh/h) | Temperature (°C) |
|---|
| YOLOv11n | Low Range | 78.5 | 892.3 | 485 | 42.1 |
| Mid Range | 65.2 | 812.7 | 398 | 38.9 |
| High Range | 52.8 | 749.6 | 324 | 35.7 |
| EfficientDet-D0 Lite | Low Range | 89.7 | 1156.8 | 612 | 46.3 |
| Mid Range | 74.3 | 1024.5 | 523 | 43.2 |
| High Range | 61.9 | 892.3 | 445 | 39.8 |
| Faster R-CNN + MobileNetV3-S | Low Range | 95.4 | 1587.2 | 798 | 51.2 |
| Mid Range | 87.6 | 1398.9 | 689 | 48.7 |
| High Range | 79.2 | 1247.5 | 598 | 45.3 |
| SSD-MobileNet V1 | Low Range | 82.1 | 687.4 | 523 | 43.8 |
| Mid Range | 69.8 | 598.2 | 432 | 40.6 |
| High Range | 58.3 | 523.7 | 367 | 37.4 |
Table 9.
Average inference times of the YOLOv11n-based mobile solution by smartphone model and number of detected objects.
Table 9.
Average inference times of the YOLOv11n-based mobile solution by smartphone model and number of detected objects.
| Number of Detected Objects | Honor ALI-NX3 (min) | Motorola Edge 30 Pro (min) | Samsung Galaxy S24 Ultra (min) |
|---|
| <10 | 3 | 2 | 1 |
| 10 to 50 | 5 | 4 | 2 |
| 51 to 150 | 10 | 8 | 5 |
| Disclaimer/Publisher’s Note: The statements, opinions and data contained in all publications are solely those of the individual author(s) and contributor(s) and not of MDPI and/or the editor(s). MDPI and/or the editor(s) disclaim responsibility for any injury to people or property resulting from any ideas, methods, instructions or products referred to in the content. |




 ,
,