Article

Predictive Modeling of Packaging Seal Strength: A Hybrid Vision and Process Data Approach for Non-Destructive Quality Assurance


1
Łukasiewicz Research Network—Institute for Sustainable Technologies, K. Pułaskiego 6/10, 26-600 Radom, Poland
2
Department of Applied Mechanics and Robotics, Faculty of Mechanical Engineering and Aeronautics, Rzeszow University of Technology, al. Powstańców Warszawy 8, 35-959 Rzeszów, Poland
*
Author to whom correspondence should be addressed.
Appl. Sci. 2026, 16(2), 923; https://doi.org/10.3390/app16020923
Submission received: 5 December 2025 / Revised: 8 January 2026 / Accepted: 14 January 2026 / Published: 16 January 2026

Featured Application

This automatic non-destructive method for quality inspection of packaging seals can be used in the food industry. Employing hybrid imaging and predictive models allows for fast identification of faults and prediction of a seal’s strength, reducing production losses and improving food safety.

Abstract

A method for quality inspection of food packaging based on hybrid imaging and machine-learning techniques is presented. The proposed inspection system integrates thermal and visible-light imaging, enabling detection and classification of faults such as weak seals, creases and contamination. For the purpose of the study data acquisition is automated with the use of an industrial manipulator, ensuring repeatability and consistent positioning of samples. Using the acquired images, the temperature distribution in the sealing area and selected process parameters, a predictive model for burst-pressure testing was developed. The proposed workflow includes attribute selection, hyperparameter optimization and the application of regression algorithms. The proof-of-concept results demonstrate a strong alignment between predicted and measured values, as well as high model stability. The best-performing model, ElasticNet, achieved an R2 of 0.815 and an MAE of 0.028 kgf/cm2, confirming its potential for non-destructive quality control of packaging.

1. Introduction

Food packing technology is developing and constitutes an important area of research connected with ensuring the quality and safety of food products [1]. Packaging functions include the protection of a product from external factors, facilitation of its safe transport and preservation of stability during storage. A key element determining the effectiveness of these functions is the tightness and durability of the seal responsible for being the barrier against humidity, gases and microorganisms, and thus limiting quality losses and the risk of food waste. Many factors, including the three main process parameters: temperature, time and pressure, as well as the structure of sealing tools, the packaging design, the foil’s thickness and rheological properties and the presence of contamination in the sealing area, affect the seal’s quality [2]. The provision of stable and optimal manufacturing conditions remains problematic, mostly due to the growing rates of industrial processes, the necessity of cost reduction through material modifications, as well as the pursuit of shorter operational times and lower energy consumption. In this context, seal defects and the need for full quality control constitute important technological challenges. The sealing area is considered the most critical in an elastic packaging due to the fact that it represents the region where material layers are bonded. Defects arising in this part of the construction lead to leakiness and degradation of barrier properties.
Two basic approaches: statistical control of a batch (sampling) and 100% on-line inspection, i.e., a constant monitoring of each package in real time, are used in packaging quality control. Under industrial conditions, full on-line inspection has been gaining importance, facilitating the elimination of faulty units through methods integrated into production lines that employ various imaging and measurement technologies. Visible light (VIS) inspection systems were the first technologies used for package inspection and continue to be widely applied in industrial vision systems. They are used mostly for detecting defects and contaminants [3]. Attempts have been made to apply polarized light [4] and hyperspectral imaging [5] for seal quality inspection. Three-dimensional analysis represents a promising research direction in the automation of heat-sealed package inspection [6]. However, for very thin seal layers and defects smaller than 0.2 mm, it becomes crucial to select an imaging method tailored to the specific requirements of the task, particularly considering the relationship between measurement resolution and imaging field size [7]. Achieving this balance can be especially challenging in the case of tray-type package seals. Thermal imaging cameras are also commonly used, enabling the detection of anomalies in the temperature distribution of the sealing area [8]. Moreover, due to the relatively low absorption of infrared radiation by many packaging materials and the reduced surface scattering resulting from the longer wavelength, such systems can also be used to detect subsurface defects. Thermographic non-destructive testing encompasses physically grounded approaches and advanced techniques that utilize heat conduction models or thermal analysis of multilayer structures to estimate material properties and improve the interpretability of diagnostic results [9]. Hybrid methods [10], combining several technologies in order to improve inspection precision and limit the risk of incorrect classification, constitute a new direction of research in the field of machine vision.
Standalone inspection systems allow for the effective identification of faulty products, but they do not resolve the problem of the Cost of Poor Quality—CoPQ, such as the loss of raw materials or the costs of energy consumption. To prevent this, the paradigm of quality management must shift from a reactive, end-of-process control approach to a proactive approach. The development of Quality Control (QC) systems based on machine learning methodologies to enhance food safety and quality assurance in food packaging is an emerging research area [11]. Predictive-maintenance applications have become a standard in manufacturing and have also been investigated in food-packaging machinery, with deep-learning models enabling yearly throughput prediction [12]. However, modern production process automation is increasingly shifting toward the so-called predictive quality [13], a state-of-the-art approach to data management and control aimed at predicting potential deviations before any irregularities occur. The recent review [14] indicates that packaging-related Artificial Intelligence (AI) tasks are predominantly formulated as categorical decisions—such as defect detection or product classification—rather than as continuous prediction problems. Nevertheless, inspection results can also support process improvement by providing control feedback consistent with the Digital Twin concept. In a Digital Shadow, data flows only in one direction—from the physical object to its digital model—allowing the model to be continuously updated with real-world information. In contrast, a true Digital Twin enables fully integrated, bidirectional data exchange, where information flows between the physical object and its digital counterpart [15]. As demonstrated in a study on robotic glue-dispensing stations [16], a vision-based quality metric can be incorporated into a closed-loop control scheme, consistent with the principles of a Digital Twin approach. Ongoing research focuses on the use of data fusion to increase the effectiveness and efficiency of Digital Twin systems. By effectively combining sensor data, it is possible to create more accurate and robust models that are better adapted to real-world conditions [17]. However, ensuring high-quality data used in predictive models and methods for detecting data source malfunctions remains an important issue [18]. Using a hybrid inspection system within a Digital Twin can mitigate this risk.
This study proposes a data-driven approach that leverages process parameters and inspection results to predict off-line package quality pressure tests. The approach can be applied to ongoing process optimization, enabling more responsive and informed decision-making. The novelty of the method lies in integrating on-line defect classification outputs derived from a hybrid IR-VIS imaging with process parameters.

2. Materials and Methods

To reproduce conditions close to real industrial operation, a dedicated laboratory test platform was developed for data acquisition and controlled experimentation, serving as a proof-of-concept environment for the proposed method.

2.1. Experimental Setup and Instrumentation

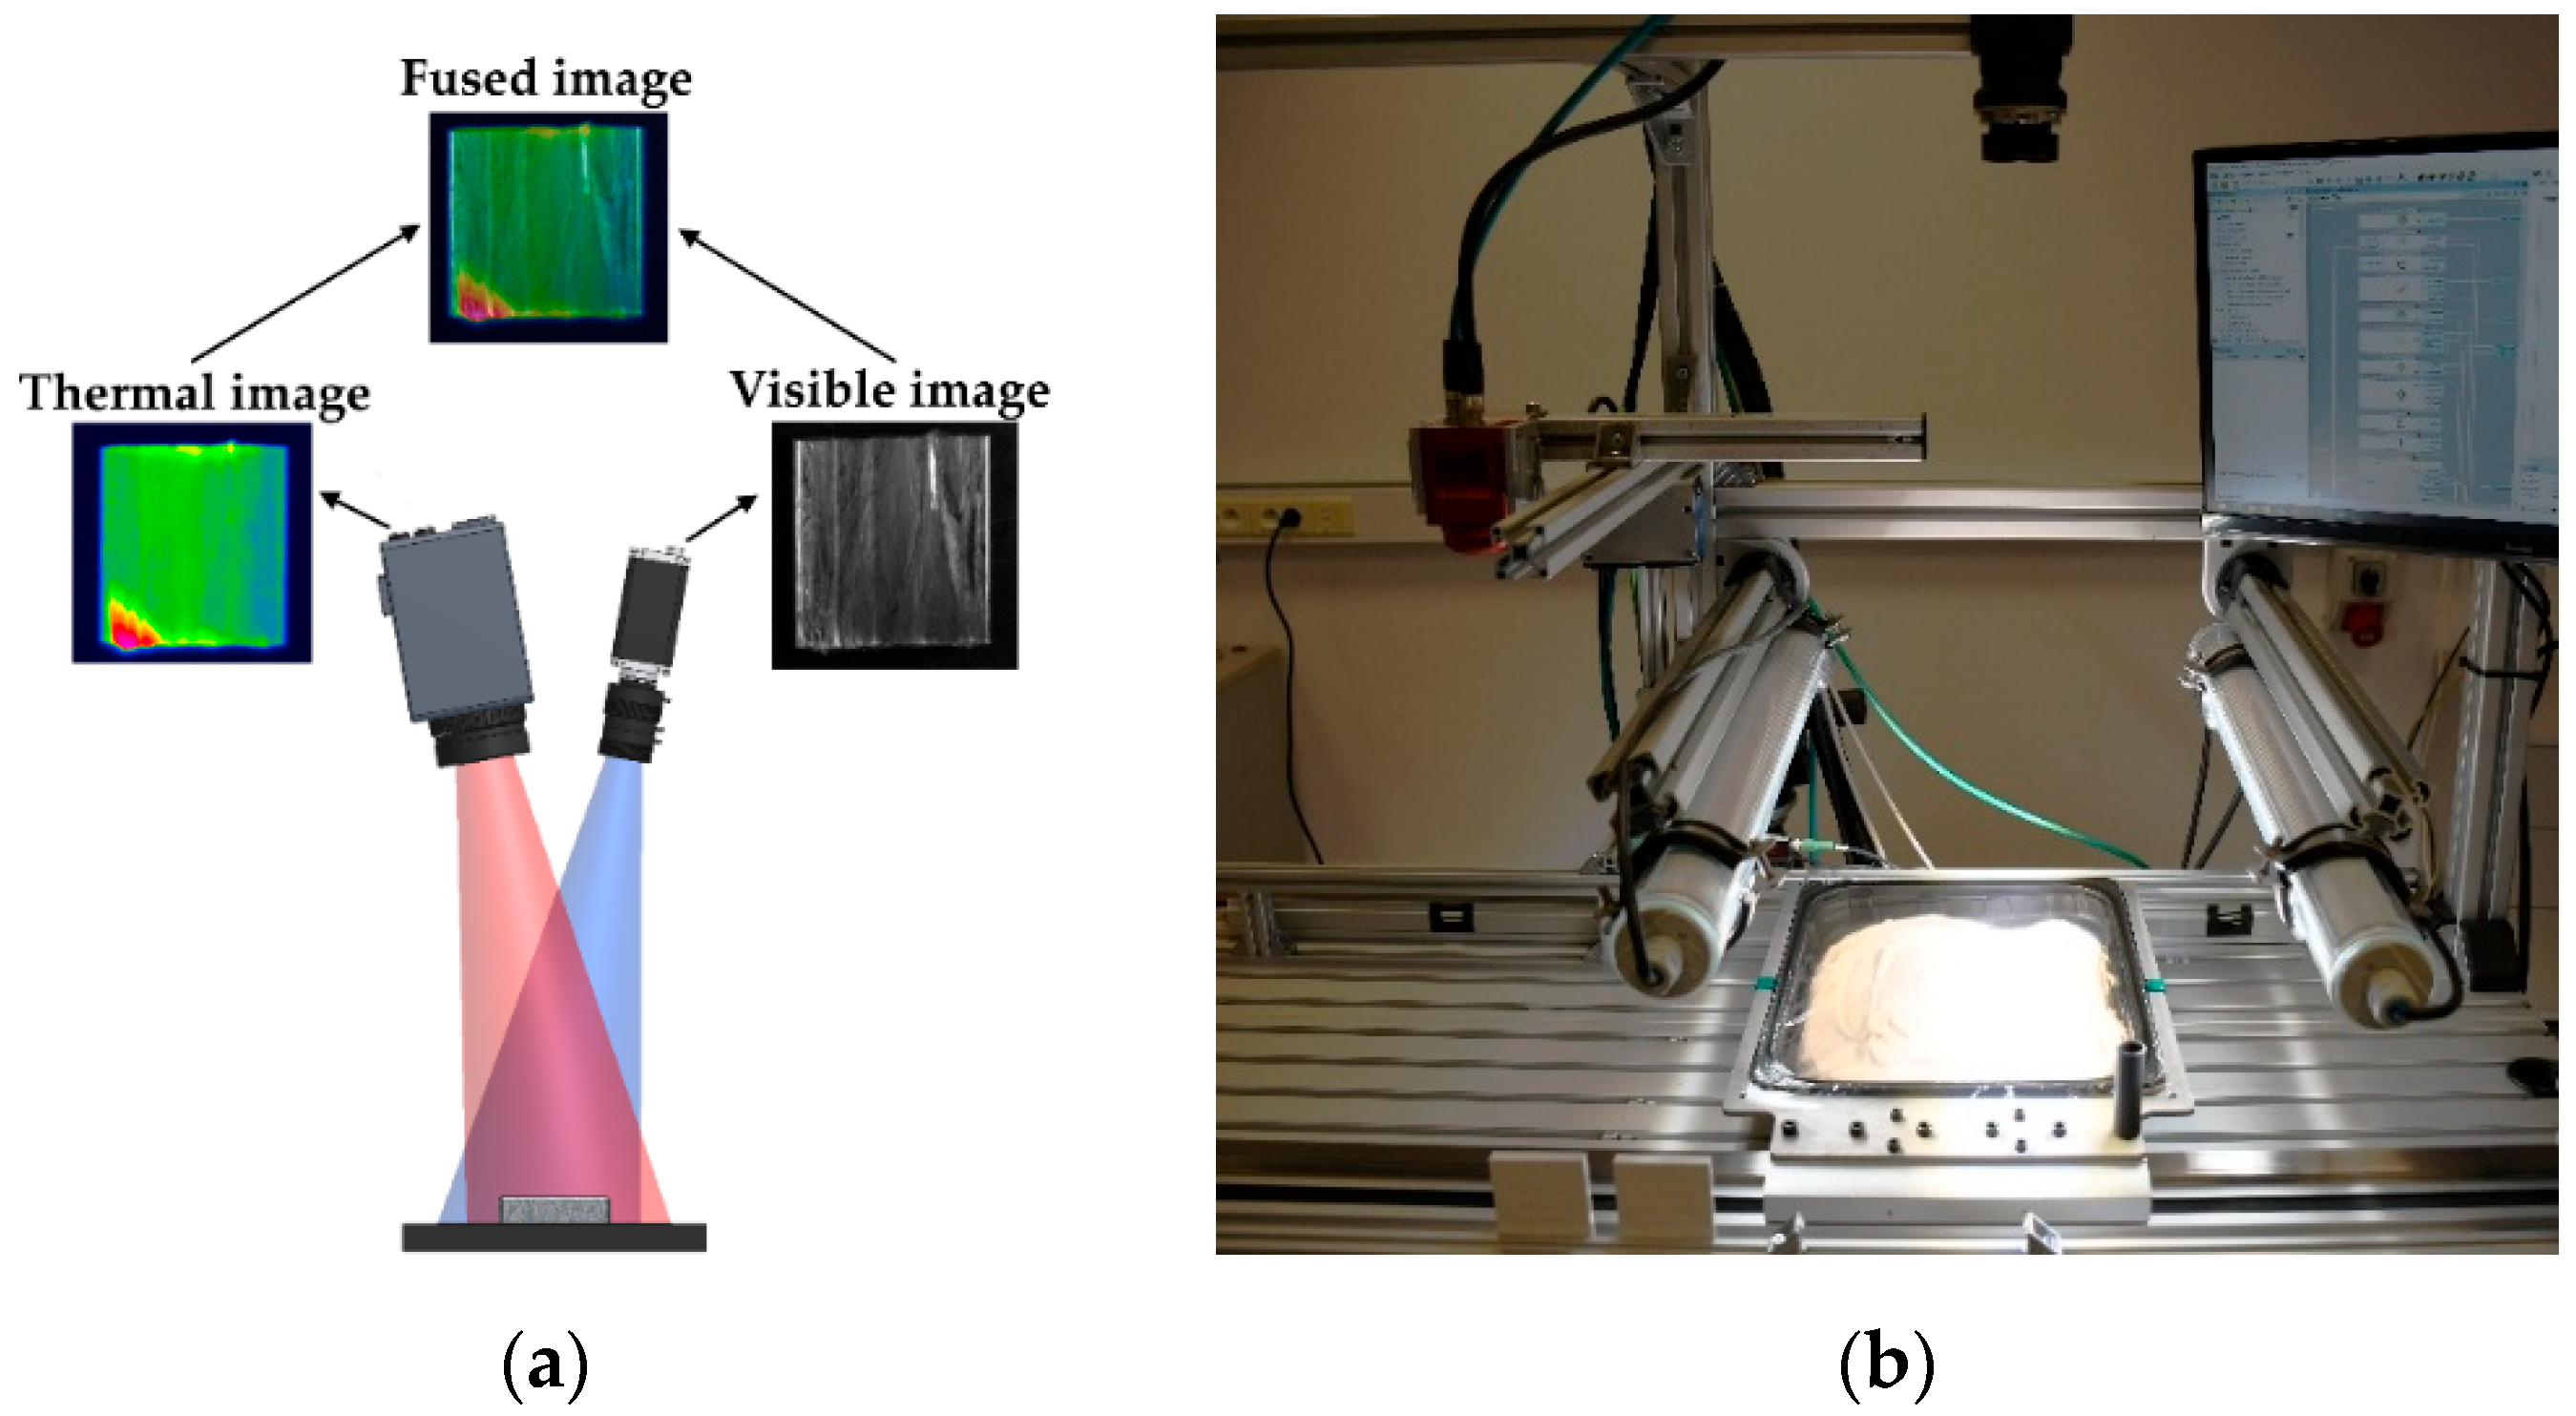
Classic machine vision systems usually use imaging in which the camera has a singular sensor with a wide spectral range. Hybrid imaging is a technology that combines different imaging modalities to produce fused images (Figure 1a), enabling, inter alia, more effective detection in non-destructive analyses and improved monitoring of structural condition [19].
For the purpose of conducting research, a station (Figure 1b) comprising a long-wave thermal imaging IR camera AT IRSX-640 (from AT, Bad Oldesloe, Germany), a line scan VIS camera of the visible spectrum raL6144 (from Basler, Ahrensburg, Germany) and a system of two illuminators is employed. Linear drive facilitates the transport of trays filled with a silicone filling into the zone of inspection with the assumed line velocity of 400 mm/s. Despite significant progress in image analysis and deep learning, effective image formation remains a fundamental determinant of machine vision performance. Obtaining images with adequate contrast and resolution requires a multidisciplinary approach that integrates optical design, illumination engineering and system-level considerations. A properly designed imaging system—encompassing the appropriate selection of the sensor, optics and illumination—is essential for ensuring the long-term reliability and stability of machine-vision applications. This is particularly important with respect to maintaining measurement quality under the wide range of disturbances that typically occur in industrial environments [20]. Inspecting moving objects on production lines requires short exposure times to avoid image blur and ensure reliable system performance [21]. Achieving high-quality images, therefore, necessitates sufficient illumination intensity and uniformity, as well as the selection of a light source whose spectral characteristics are appropriate for the target application [22]. In surface inspection tasks, shortwave illumination enhances contrast by reflecting directly from the surface, making fine defects clearly visible. However, long-wave radiation can penetrate beneath the surface, which is important for detecting contaminants embedded in the foil. Previous studies have shown significant variability in the characteristics of foreign particles [23] that can be present in the sealing zone. Therefore, in this study, broadband white light (5000 K) was chosen as a compromise solution and a general-purpose illumination method that enables the detection of a wide range of defects.
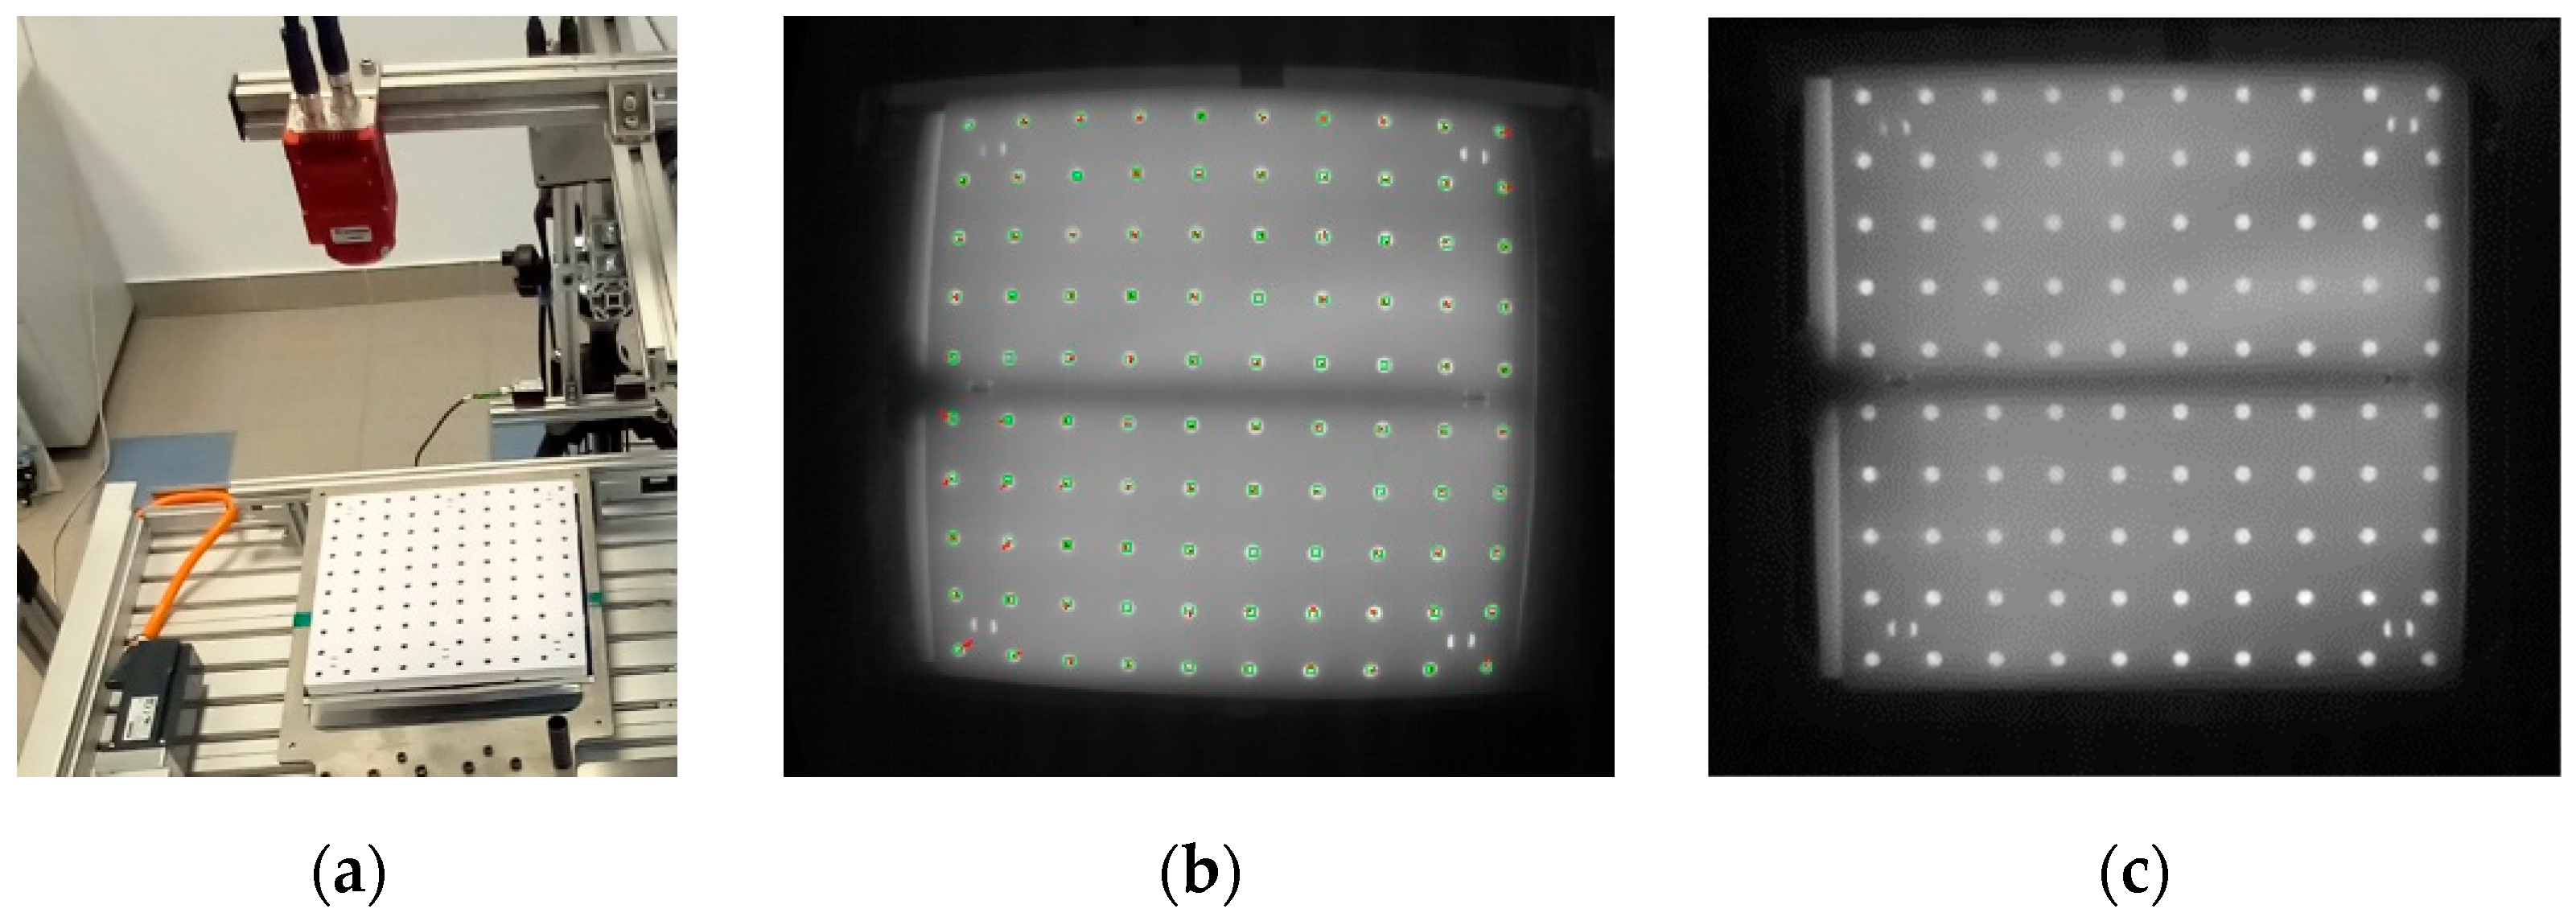
To detect and classify faults, an image-fusion method dedicated to high-throughput packaging inspection, together with a deep learning model developed in a previous study [24], was implemented in the software used in this work. The first stage of the method includes image recording. To this end, both infrared (IR) and visible (VIS) images are preliminarily processed. Due to significant optical distortions in the thermal imaging camera’s system resulting from the wide viewing angle of the lens, image correction was necessary [25]. The proposed solution requires the use of a calibration pattern whose specific points are characterized by high contrast in both the visible and infrared wavelengths. The developed pattern consists of a heating mat over which a mask with through-holes of known spacing is placed (Figure 2a). The figures below show an example thermogram with visible distortion (Figure 2b).
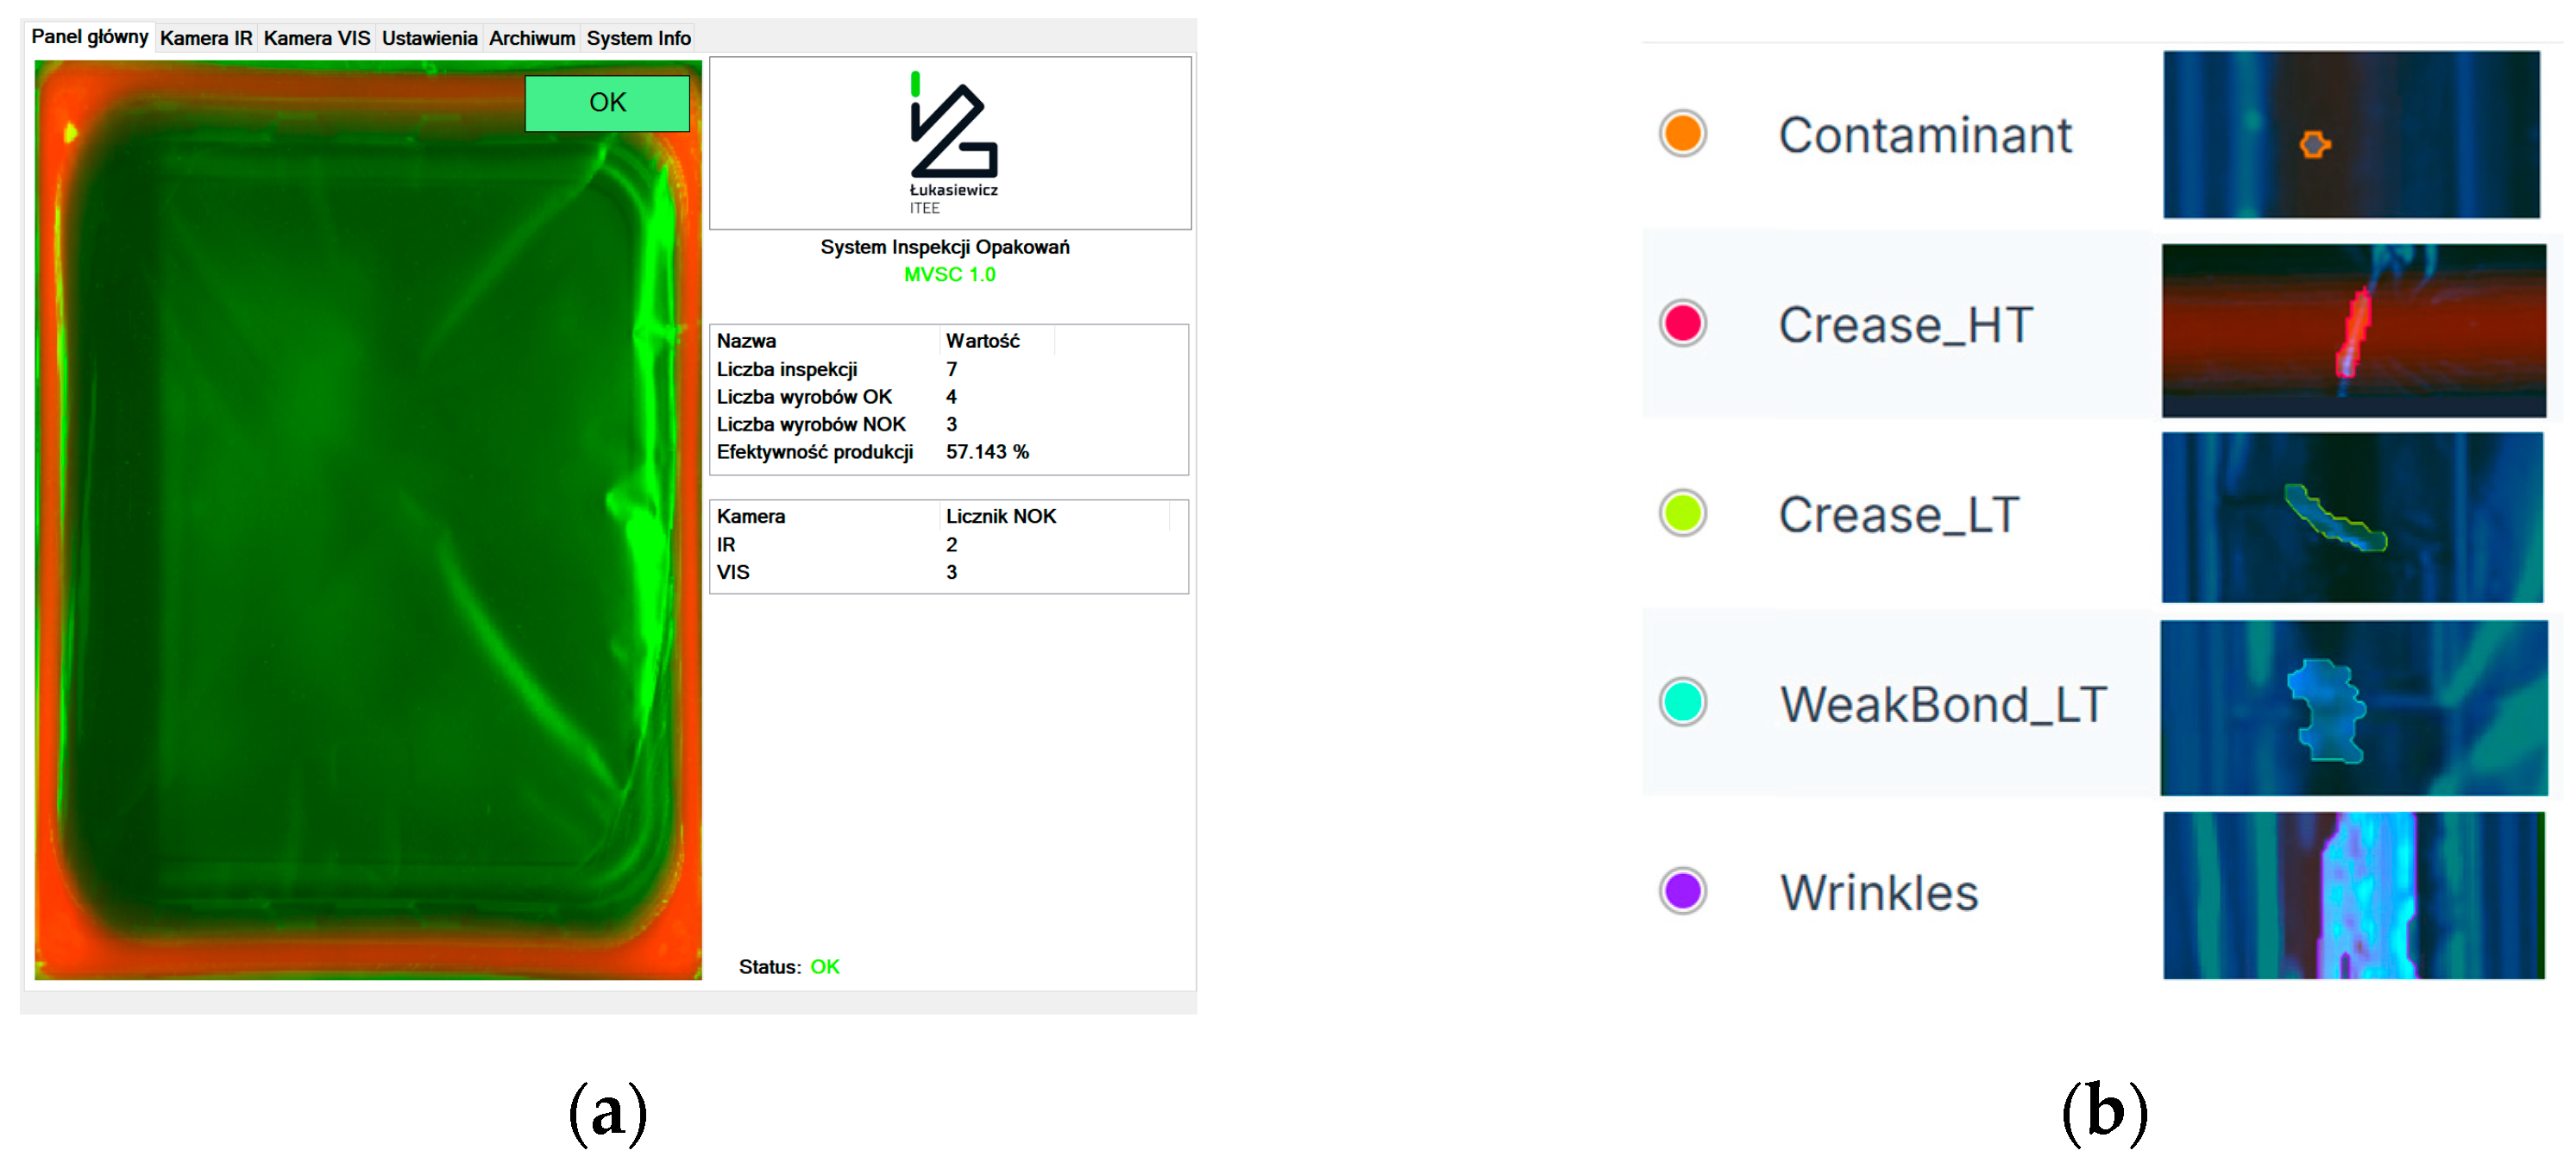
Error vectors are determined based on the recorded image, and then an image rectification map is calculated, which allows the removal of distortions (Figure 2c). The determined calibration process parameters were as follows: root-mean-square reprojection error—0.13 px and maximum reprojection error among all points—0.46 px. In the context of a small distance of observation and effective removal of optical deformation during pre-processing, the model of perspective projection is employed to globally register image mapping. This model uses a minimum of four pairs of corresponding points and guarantees straight lines in the recorded images. After the registration, the realigned images are used to generate an RGB pseudo-image. The authors applied their own method of synthesis to the information from the thermal image and monochromatic VIS image into the implemented software (Figure 3a). Figure 3b shows an example of data annotation for all of the types of defects. The model developed in a previous study that employs deep learning allows for an effective detection and classification of faults such as the following: weak seal, creases, wrinkles and contamination.
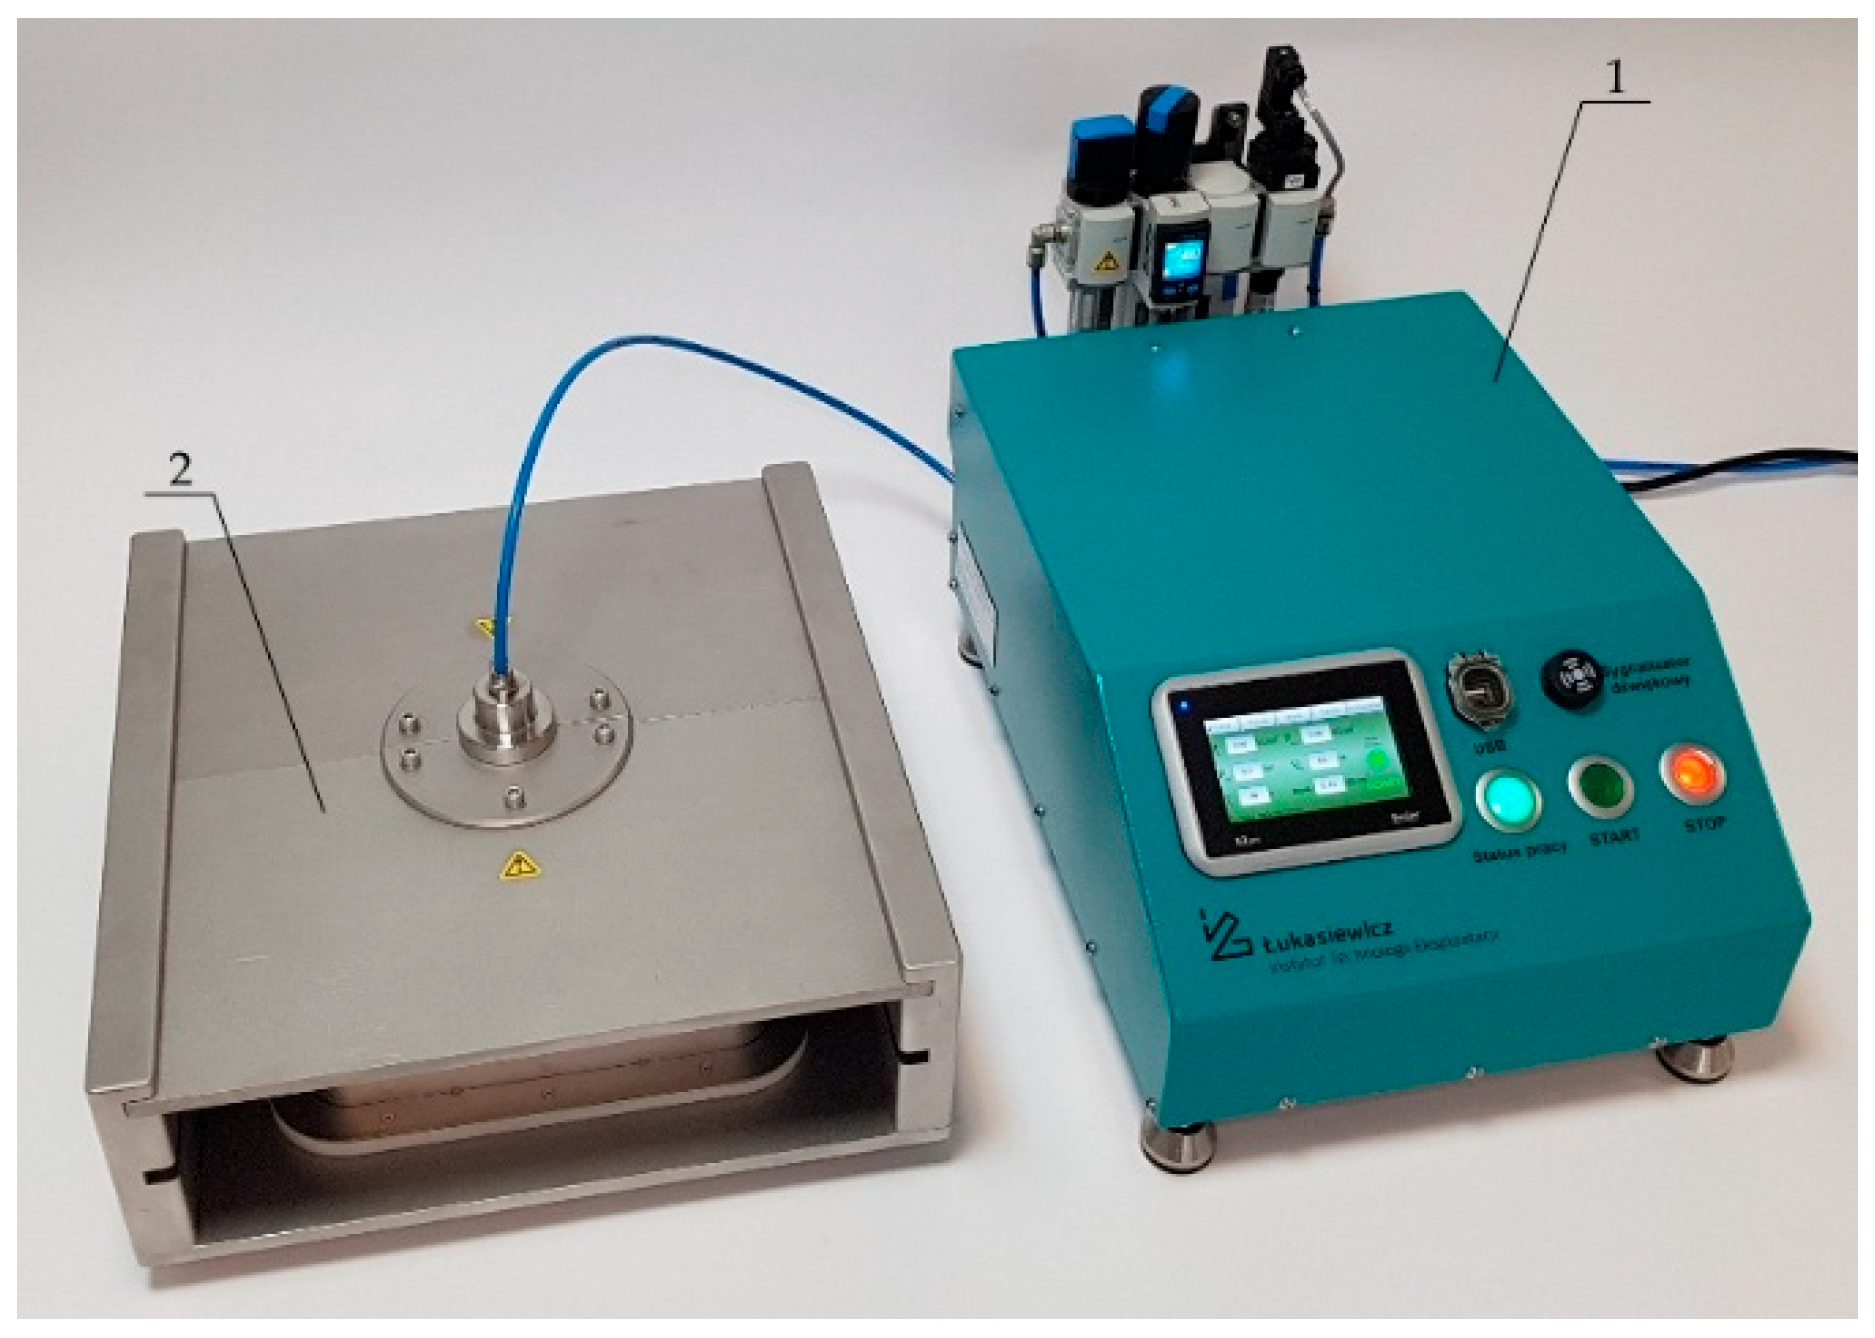
Pressure testing is one of the most frequently used methods of destructive analysis of the quality of packaging seals. It consists of a gradual increase in the pressure inside the packaging (e.g., with compressed air) until the seal bursts [26]. This method allows for a quantitative assessment of the seal’s resilience and is widely utilized in industrial practise to check the correctness of the sealing process. A tester produced by Łukasiewicz-ITEE (Radom, Poland) is employed (Figure 4).
The device is intended for off-line inspection of the correctness of the sealing process in food packaging [27]. The sealing inspection process is conducted with a destructive method consisting of introducing compressed air into the container through a probe and pressure measurement (in kg/cm2), during which the seal bursts. The measurement result is considered positive if the measured maximum pressure inside the package is greater than or equal to the assumed limit. The tray inspection process is performed routinely after every production run, as determined by the manufacturer. Trays intended for sealing have a flat rim on the top, to which a thin foil is attached during the thermal sealing process, ensuring a tight and durable seal. The basic technical parameters of the sealing foil used are presented in Table 1.
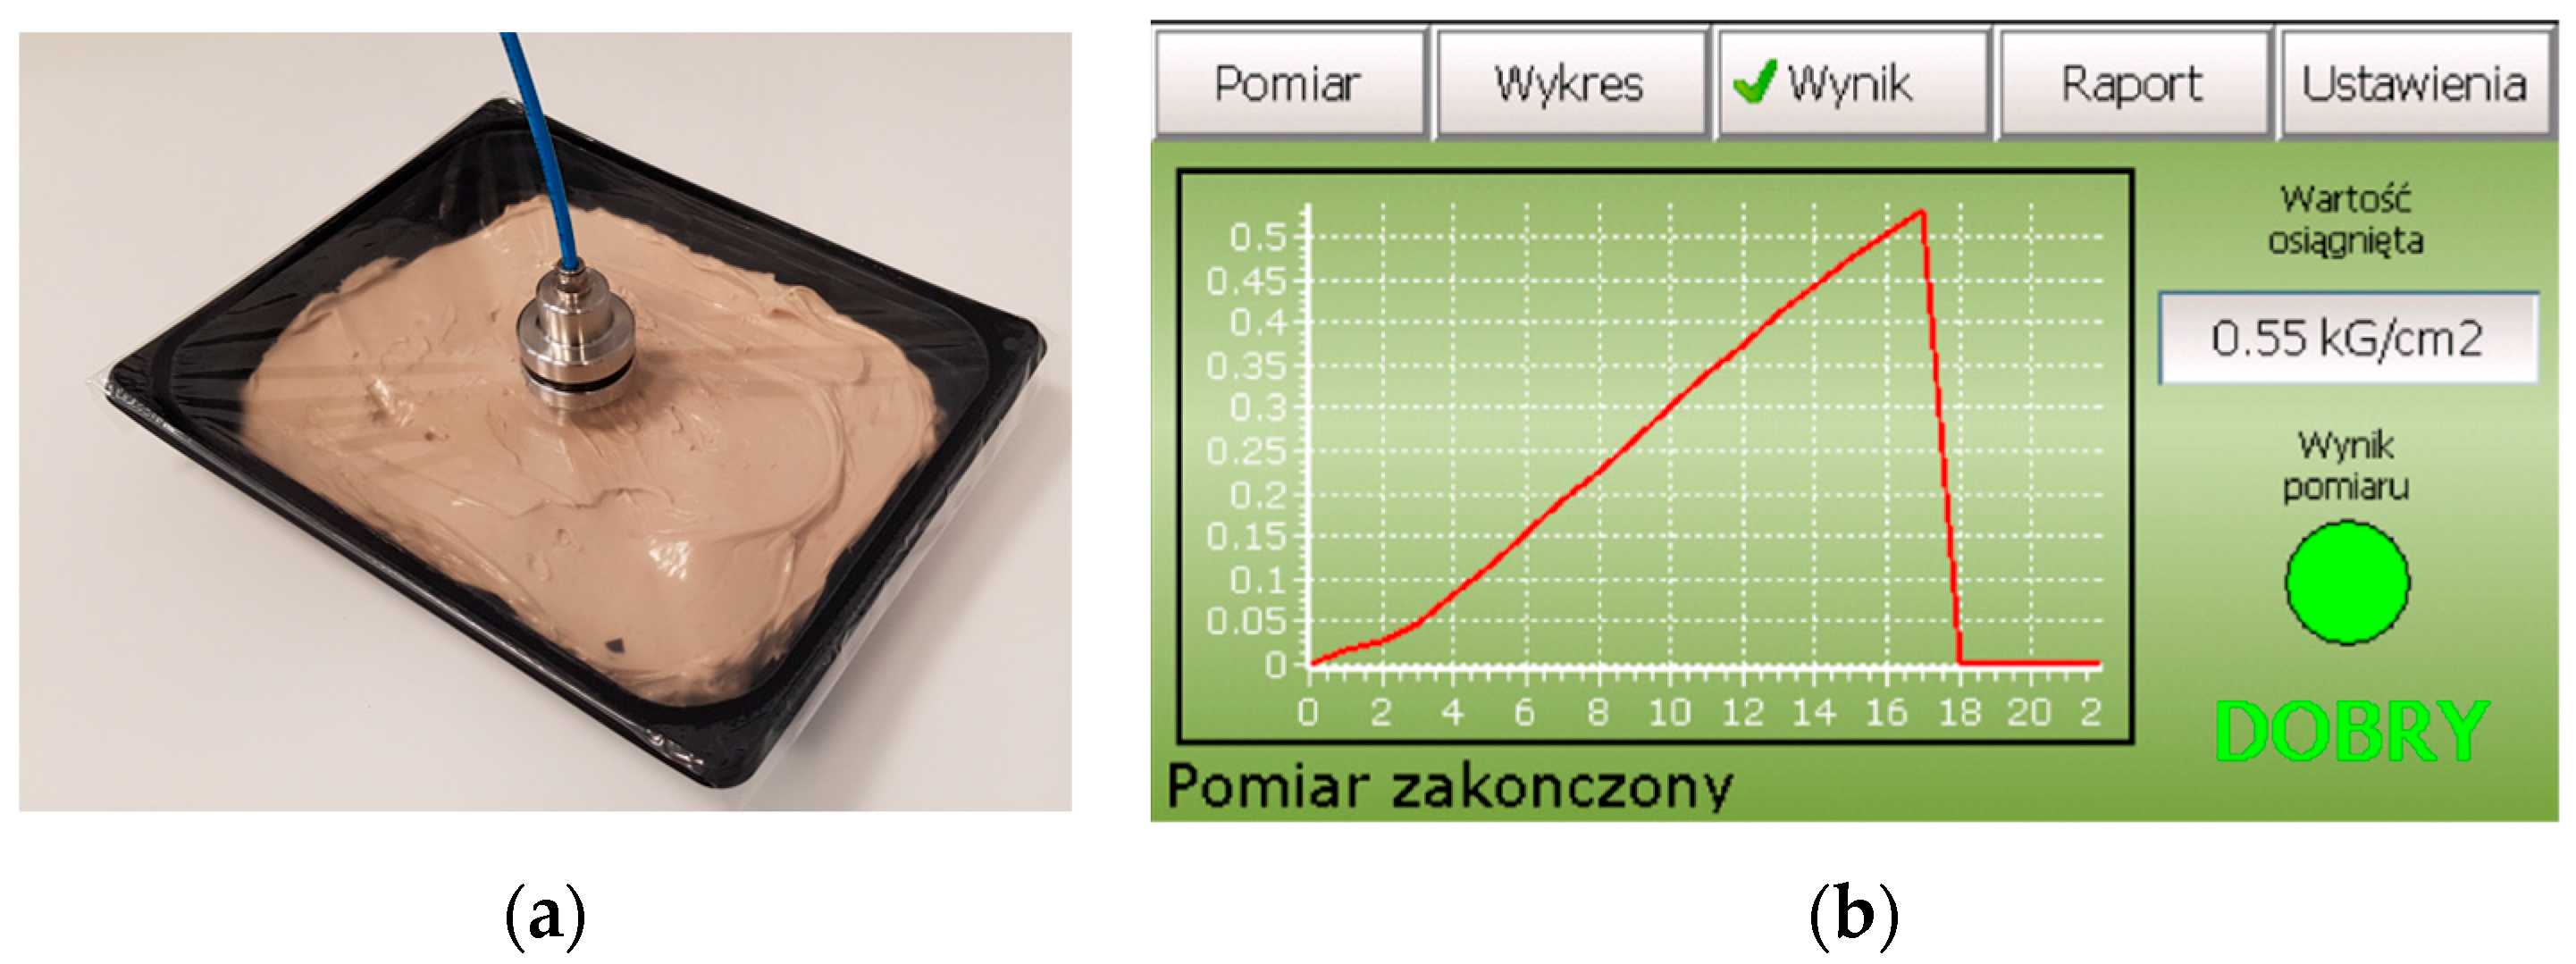
A tray prepared for testing with a probe mounted (Figure 5a) is placed between the upper and lower plates of the actuator module. During the test, pressure changes inside the package are measured to determine the maximum value at which the seal breaks. A sample screenshot from the package tester’s operator panel, showing the measurement results, is shown in Figure 5b.
The measurement results are positive if the working pressure in the packaging exceeds the assumed acceptance threshold (set value 0.45 kgf/cm2). Such products should be considered correctly manufactured with respect to the seal strength. A negative measurement result means that the working pressure is below the acceptance threshold. To complete the test, it is necessary to automatically detect a pressure drop from the maximum point on the graph by the pressure limit value (set value 0.2 kgf/cm2). Samples that did not meet this condition were removed from the database during the data cleaning stage.

2.2. Data Acquisition and Preprocessing

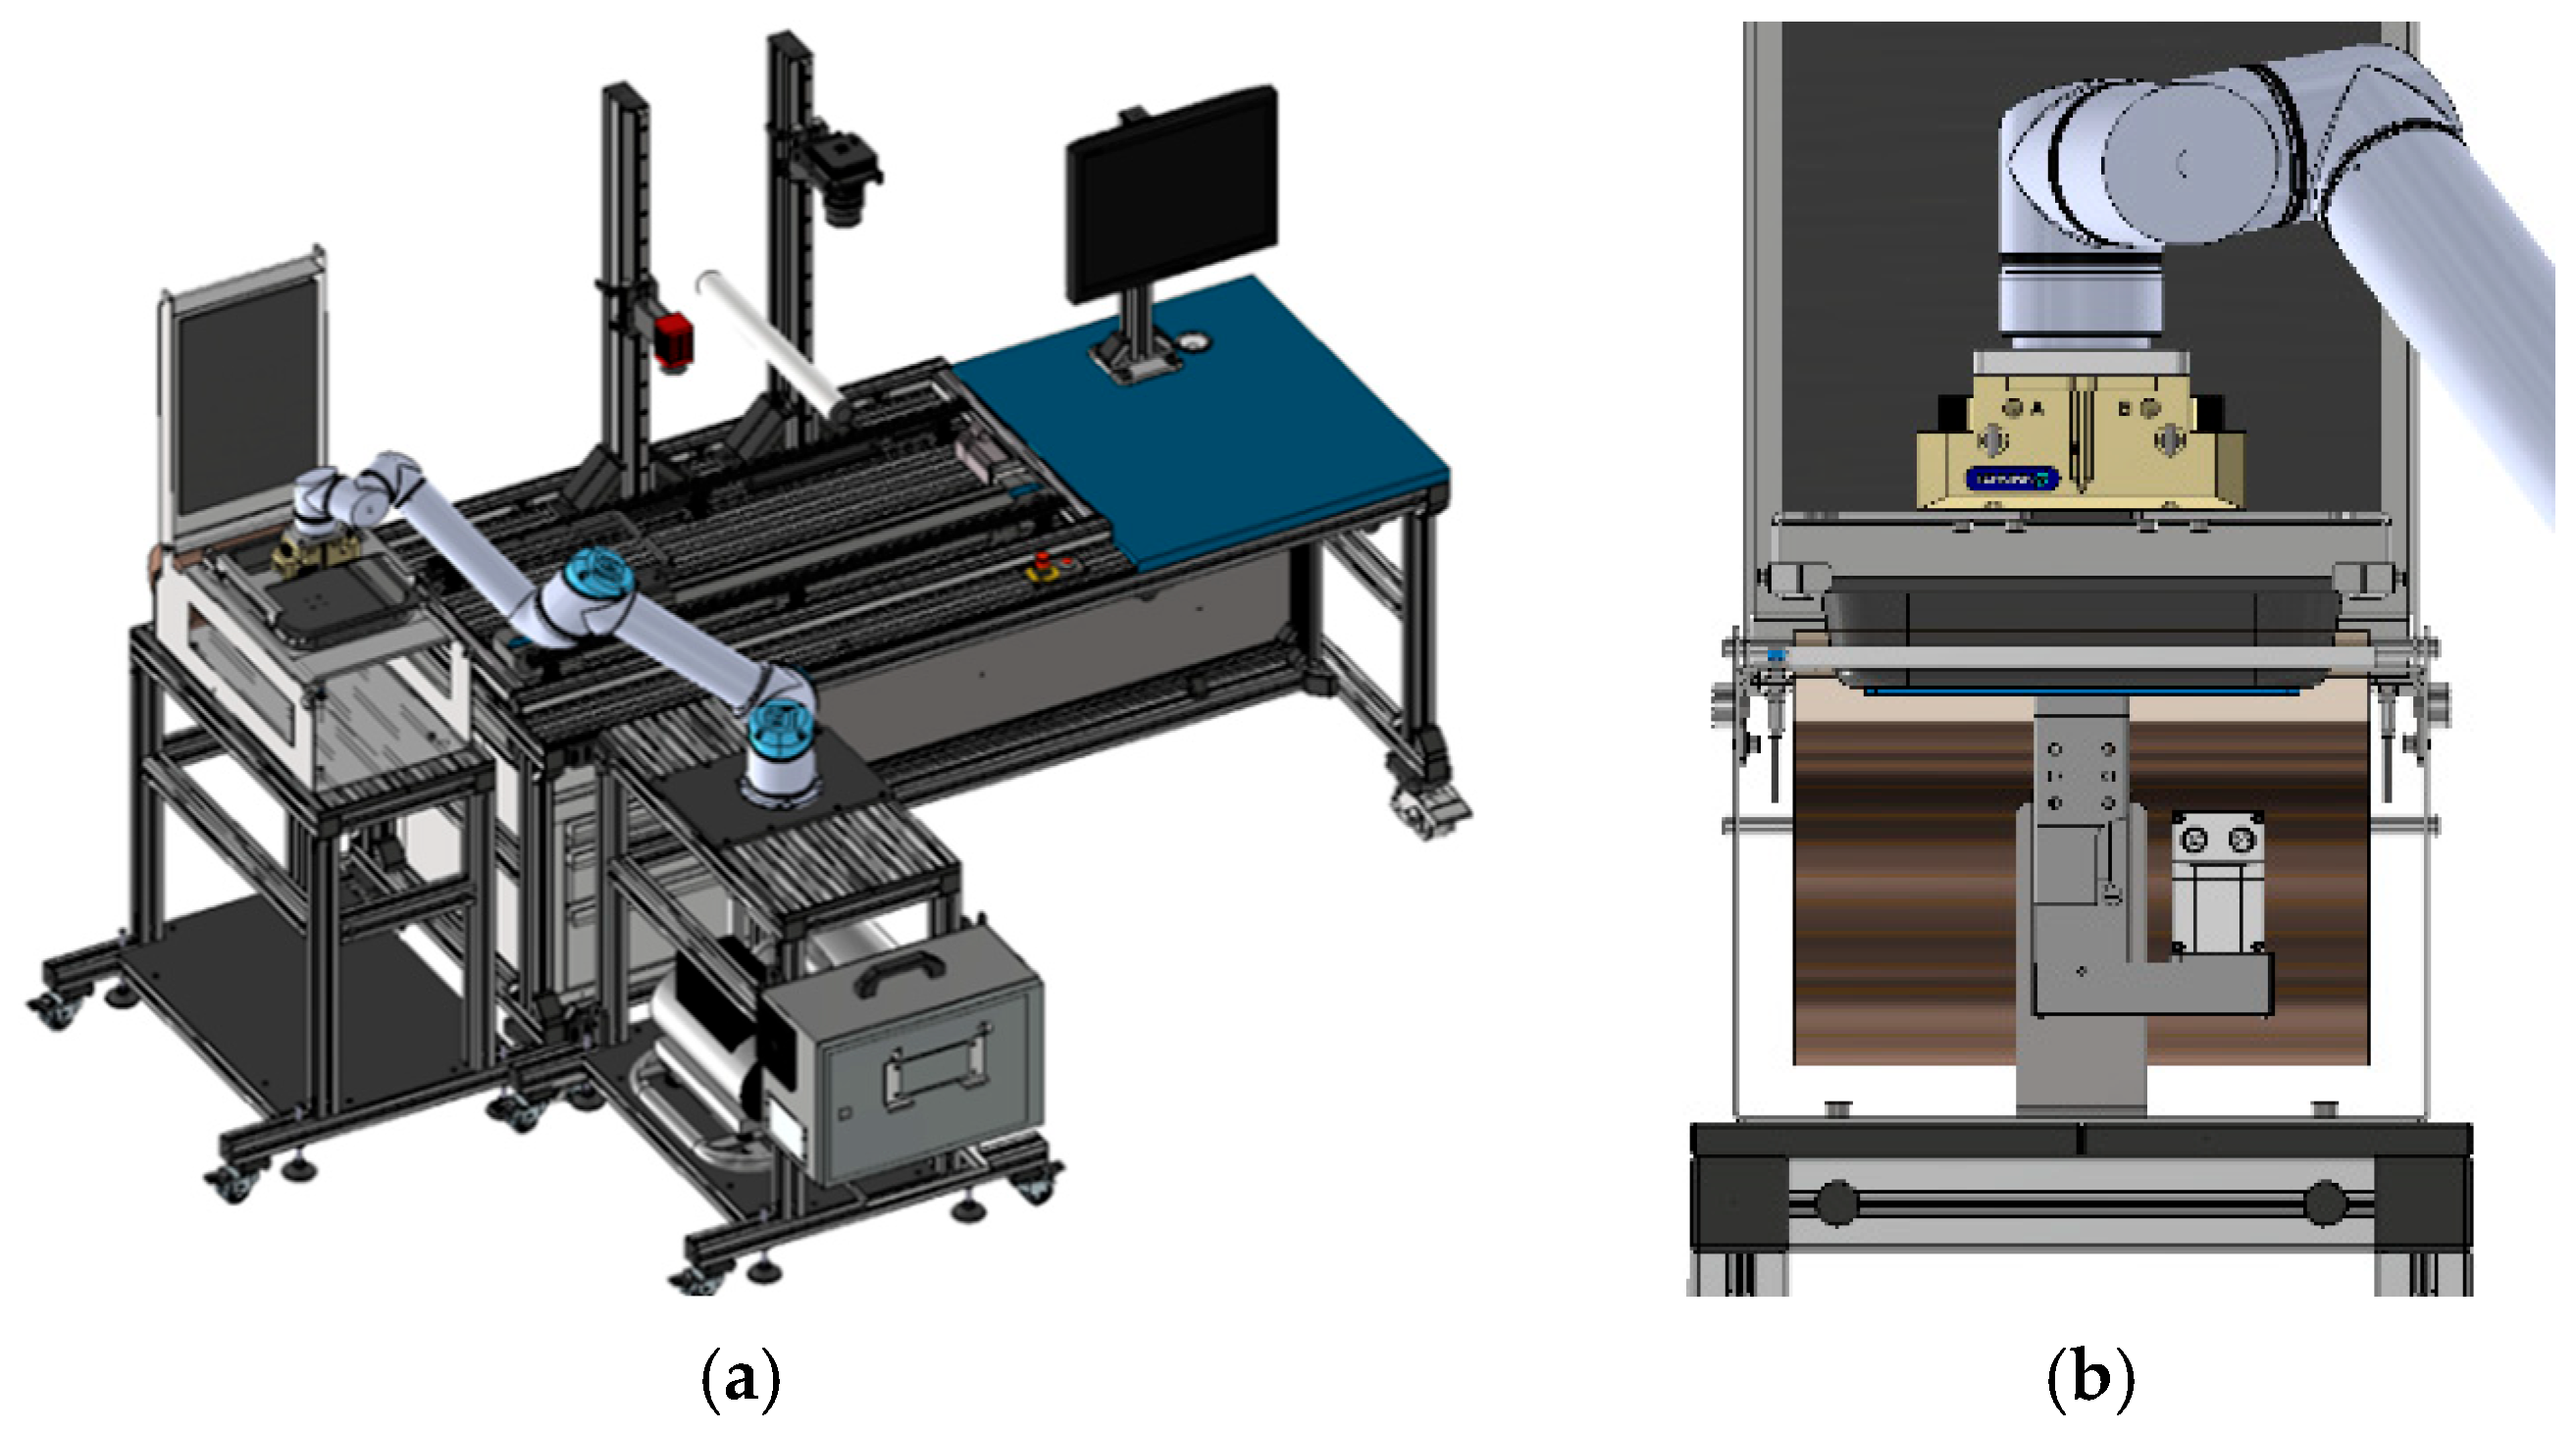
At the first stage of the development of the method for predicting seal quality, in order to acquire the required learning data amount, an industrial manipulator is integrated into the test station (Figure 6a), which ensures repeatability in the sample transport.
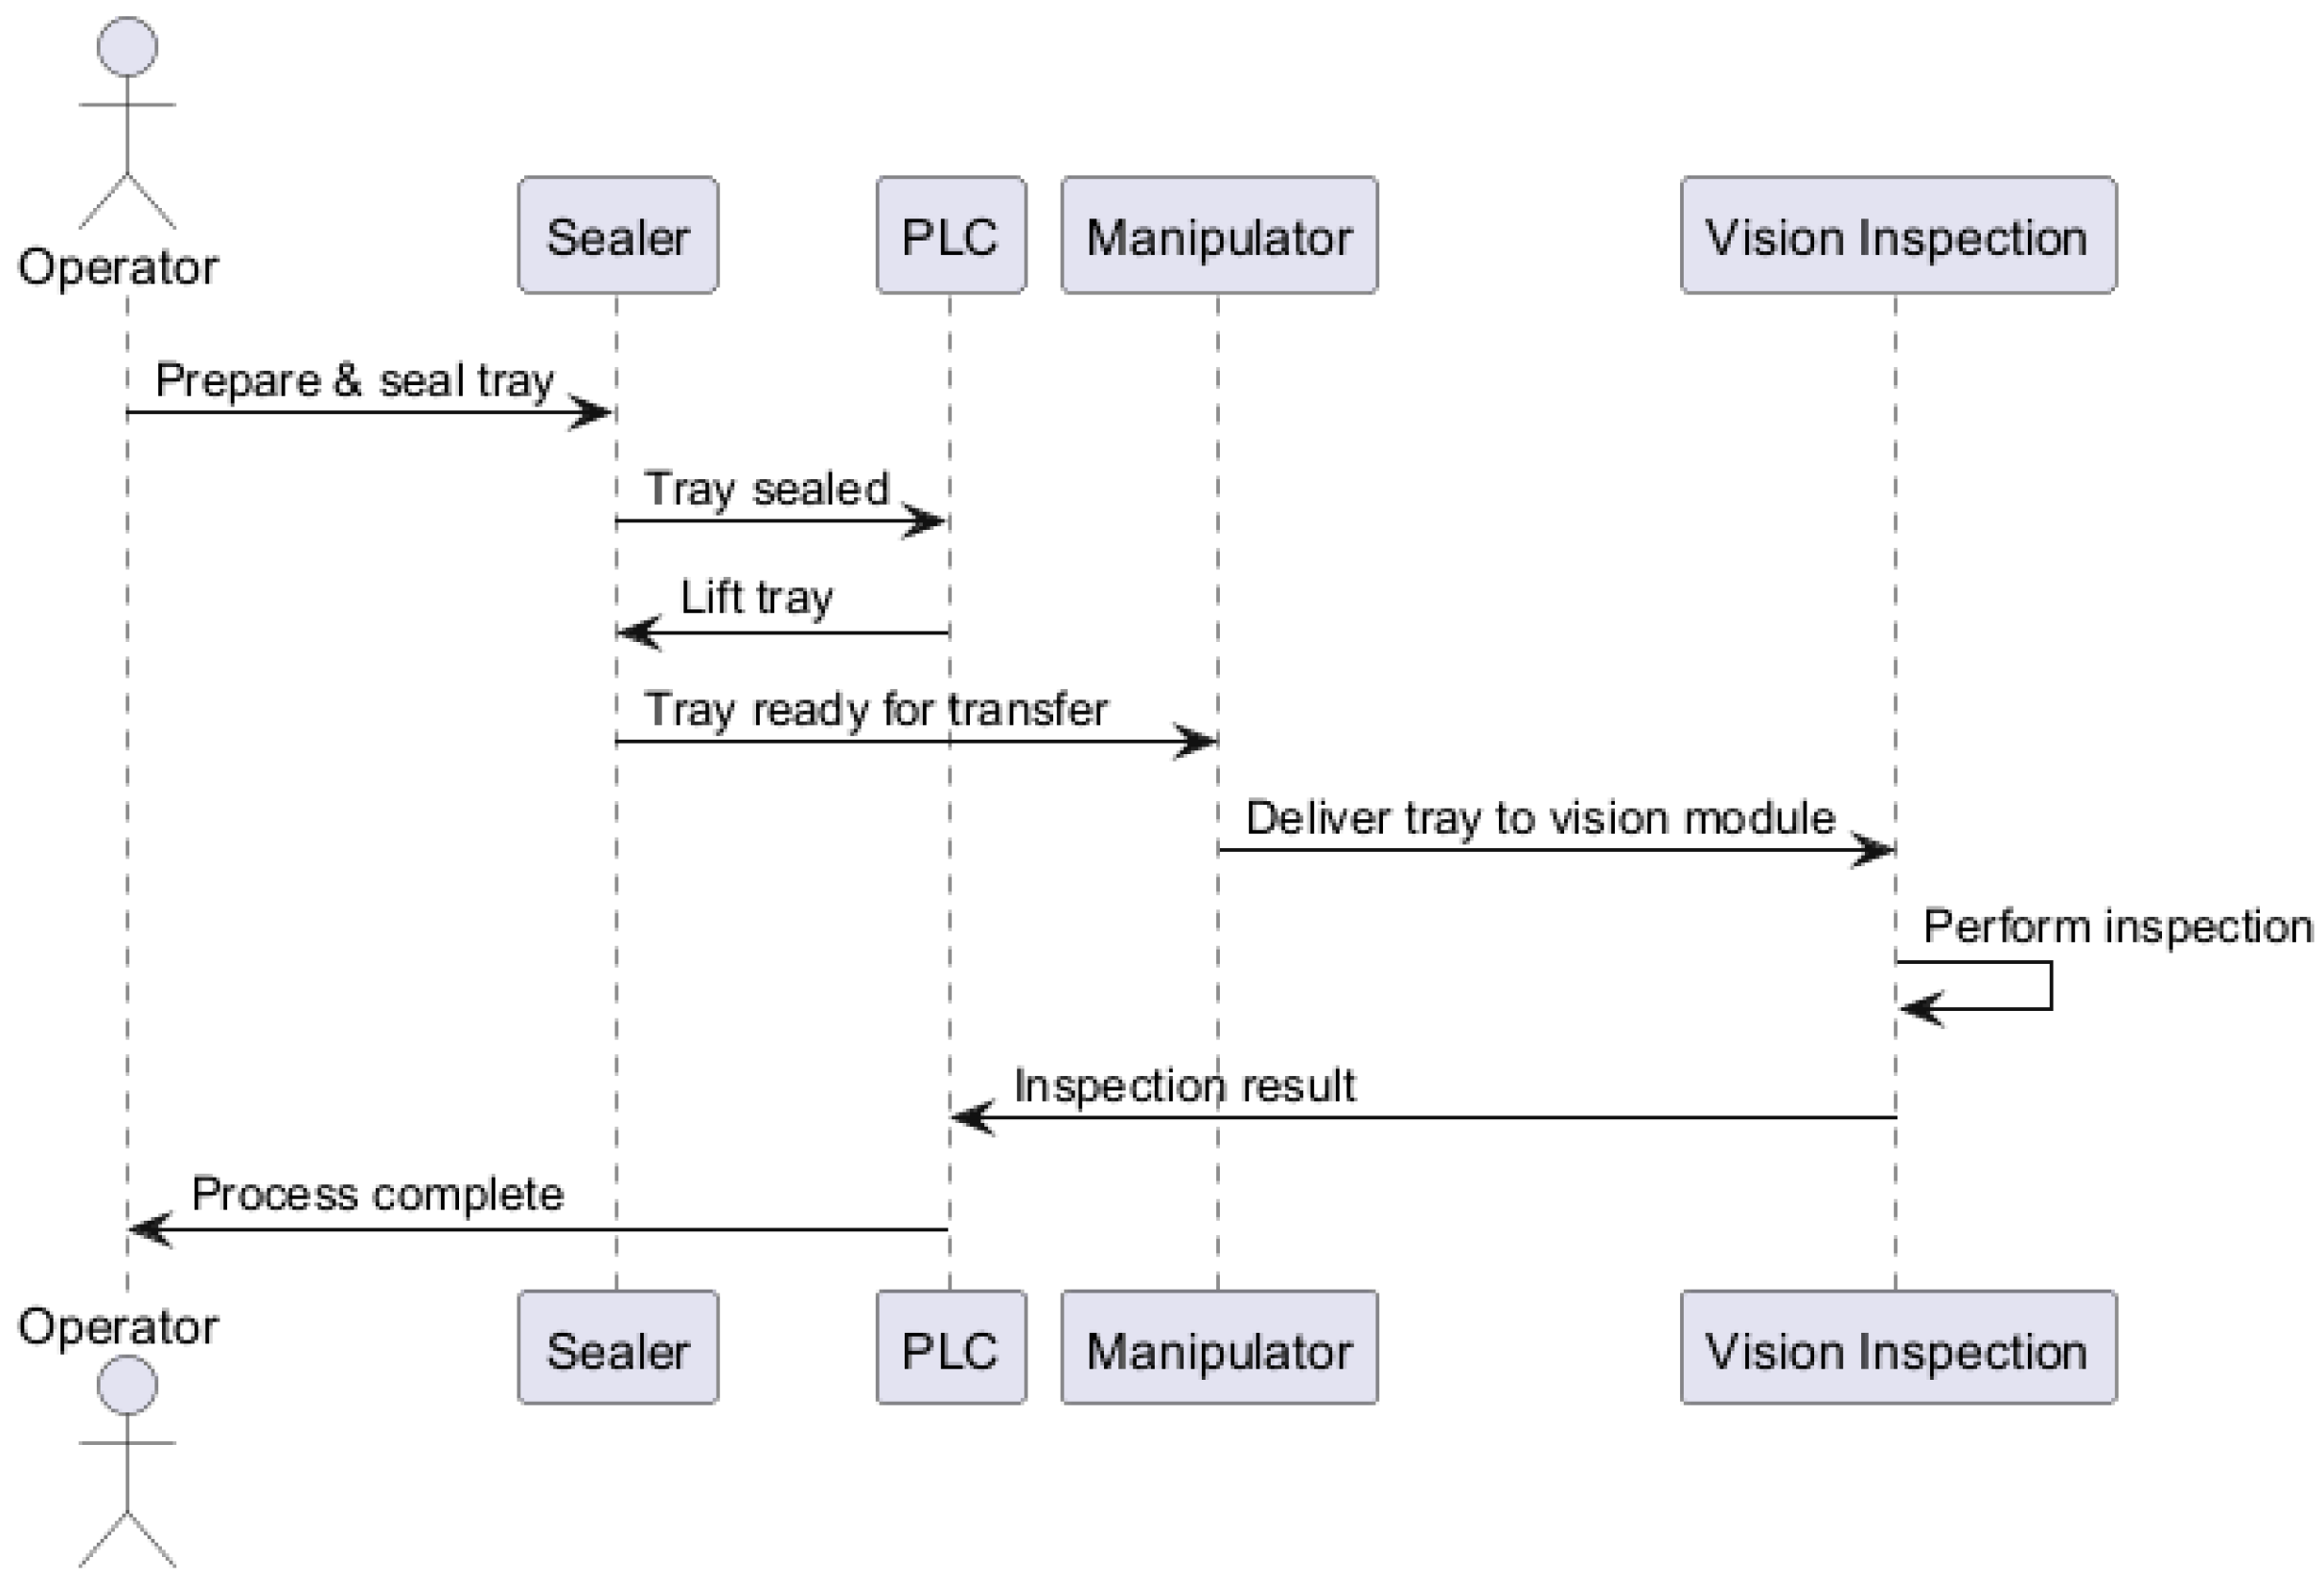
The test platform comprises three main modules: a sealer equipped with an actuator (Figure 6b), a manipulator and a stand for hybrid image inspection. Each module performs a time-determined function in the automated operational cycle controlled with the use of the PLC system. In order to achieve high time resolution and precise time measurement, the following components run on a fast task cycle to allow a resolution of 1 ms. Since the sealer is controlled manually, there is a need to visually indicate the sealing time for the operator to perform as many repeatable seals as possible. The sealing time is counted starting the moment of locking the sealer, and after a set amount of time, the indicator lamp is lit and the operator must immediately open the sealer, and both the closing and opening of the sealer’s cover are monitored with sensors. The following manipulation is performed by a robotic arm. All times set or collected in the system are measured in the PLC module. Figure 7 illustrates the overall process flow for data acquisition in the PLC-controlled hybrid imaging stand.
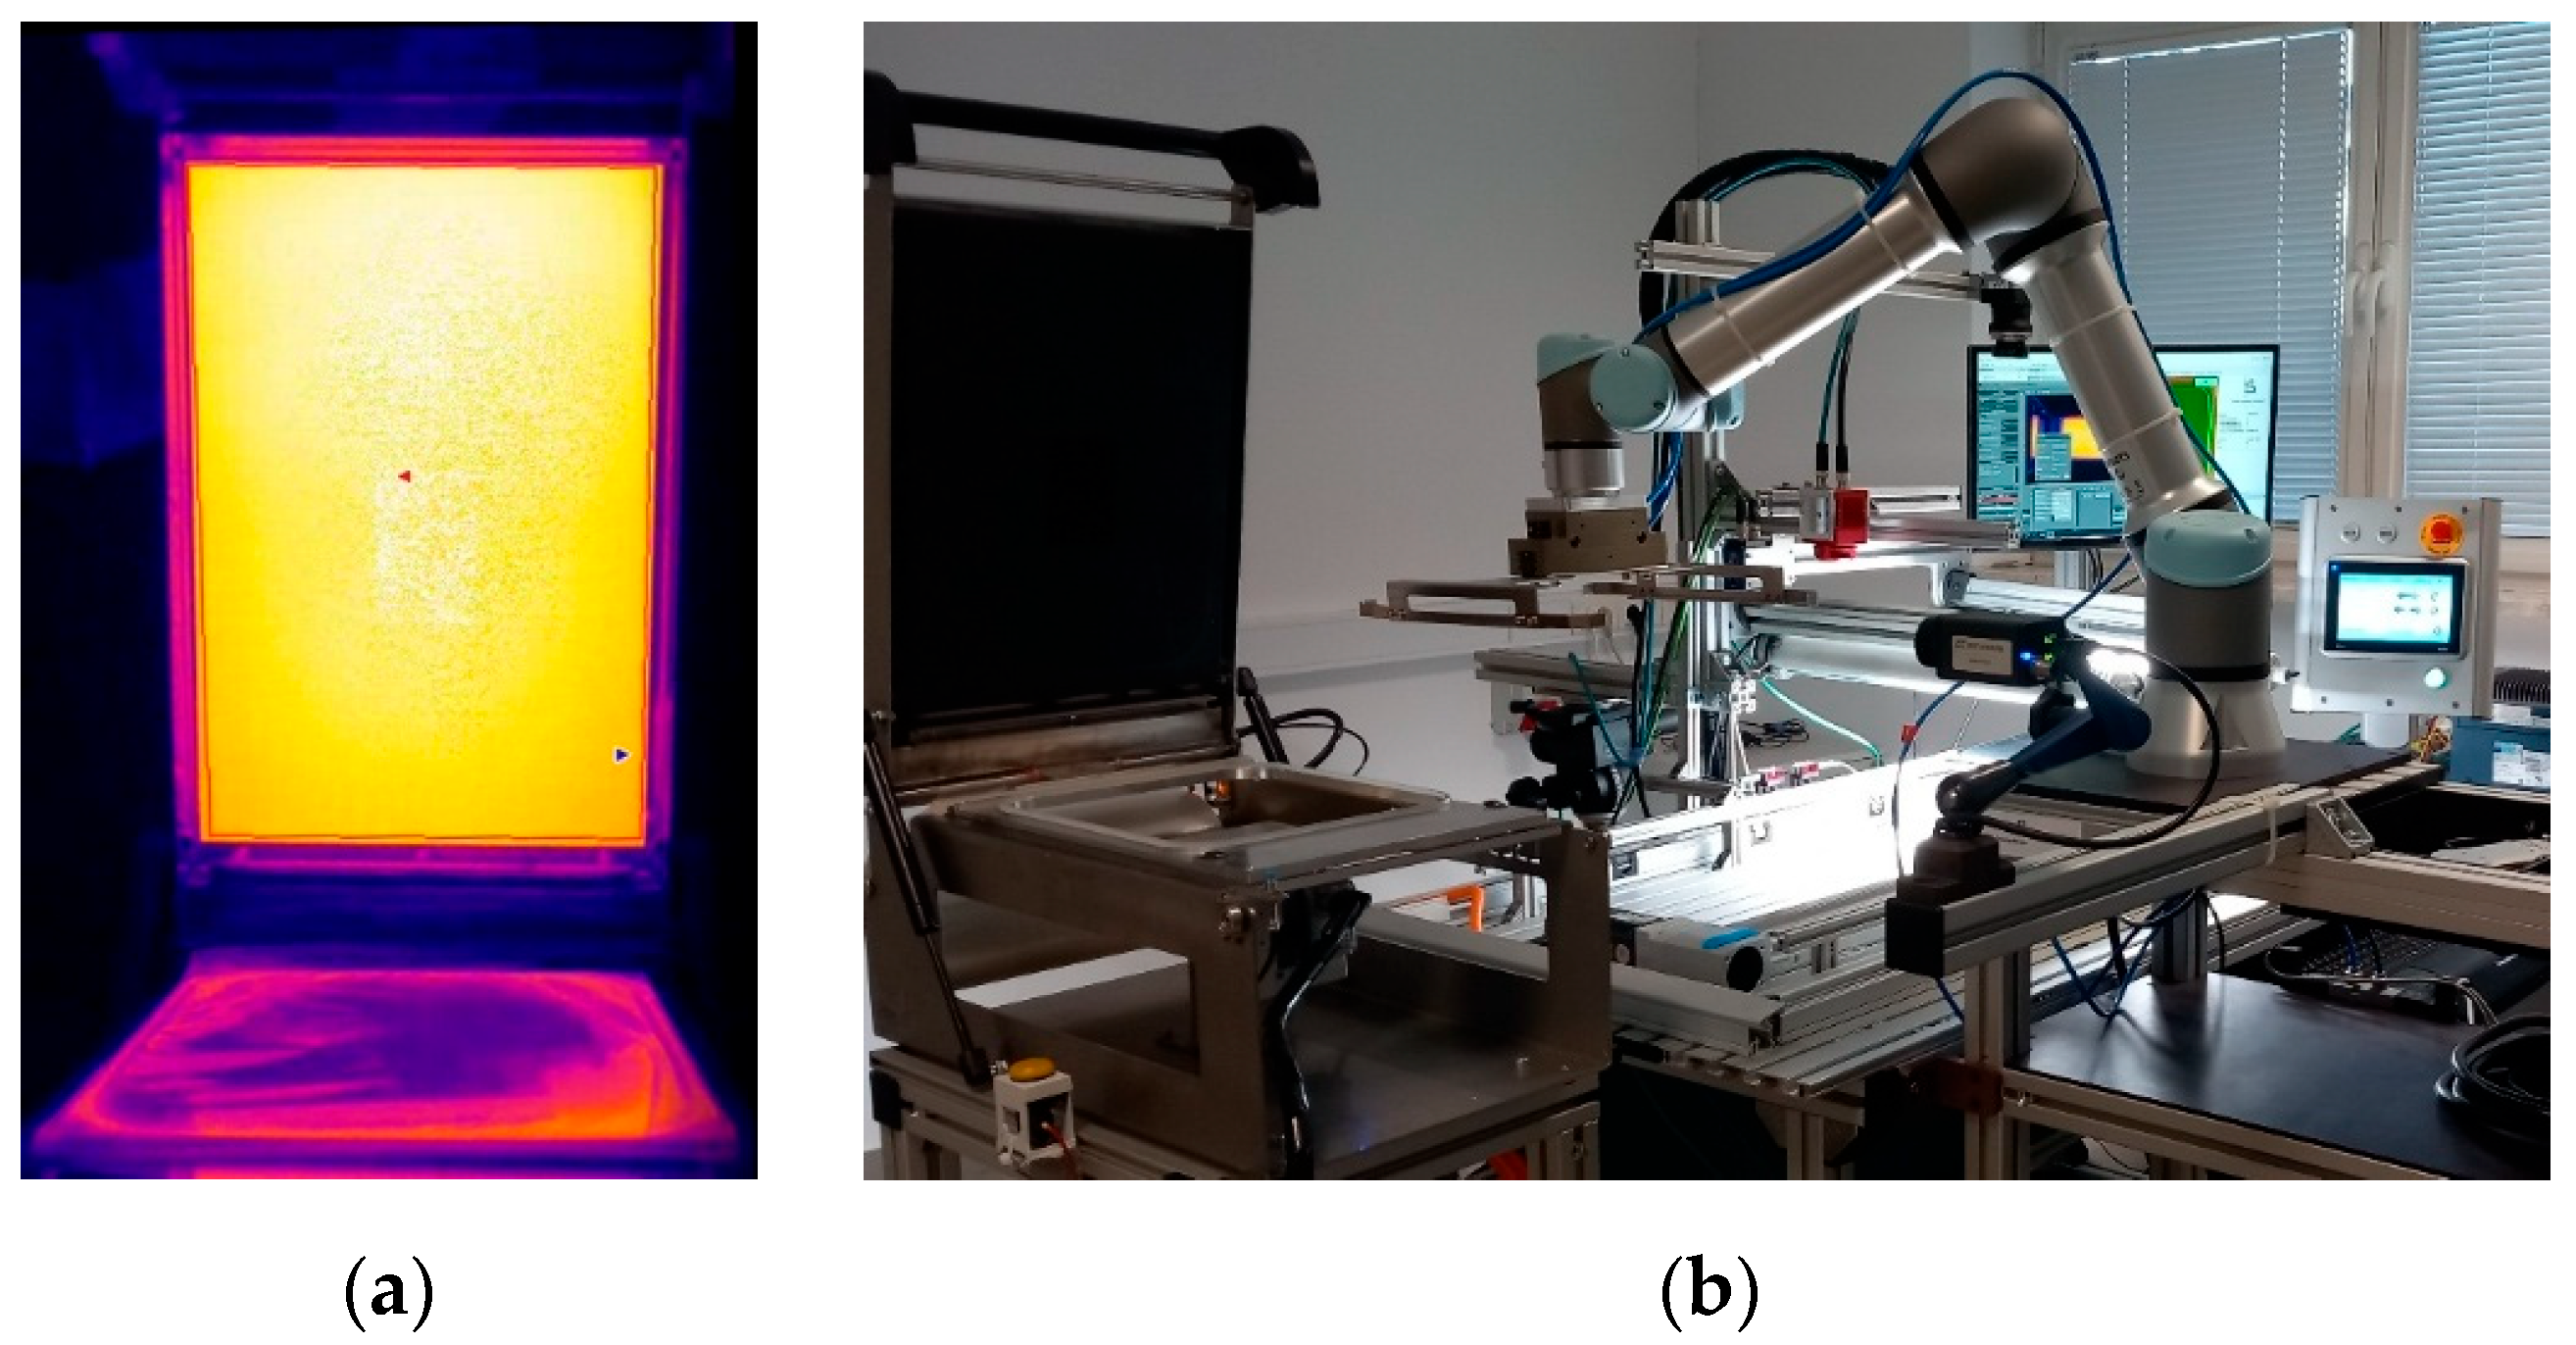
After the required time passes, the operator opens the cover and the sensor in the back part of the body registers its full opening, starting the automatic vision inspection. An actuator integrated with the sealer module lifts the tray, which is transferred by the manipulator and precisely seated in a carriage slot. The system includes the reflection sensors, which generate signals for a precise triggering of cameras and for performing the seal quality inspection. Additionally, the temperature distribution of the heating plate (Figure 8a) is recorded with the use of a A35 thermal camera (from FLIR, Wilsonville, OR, USA) (Figure 8b) directly after sealing.
Through the automation of data acquisition, the images are recorded at the assumed interval after sealing, ensuring conditions close to the relevant environment. In total, 118 samples were collected and subsequently classified according to sealing time:
  • UH—below 1950 ms (23 samples).
  • GH—correct sealing time from 1950 ms to 2050 ms (51 samples).
  • OH—above 2050 ms (44 samples).
The process times measured by the PLC are summarized in Table 2. The parameter Tacq denotes the thermogram acquisition time, measured from the moment the sealing process is completed, which is critical for ensuring the repeatability of seal temperature measurements. The parameter Tw represents the sealing time recorded by the PLC.
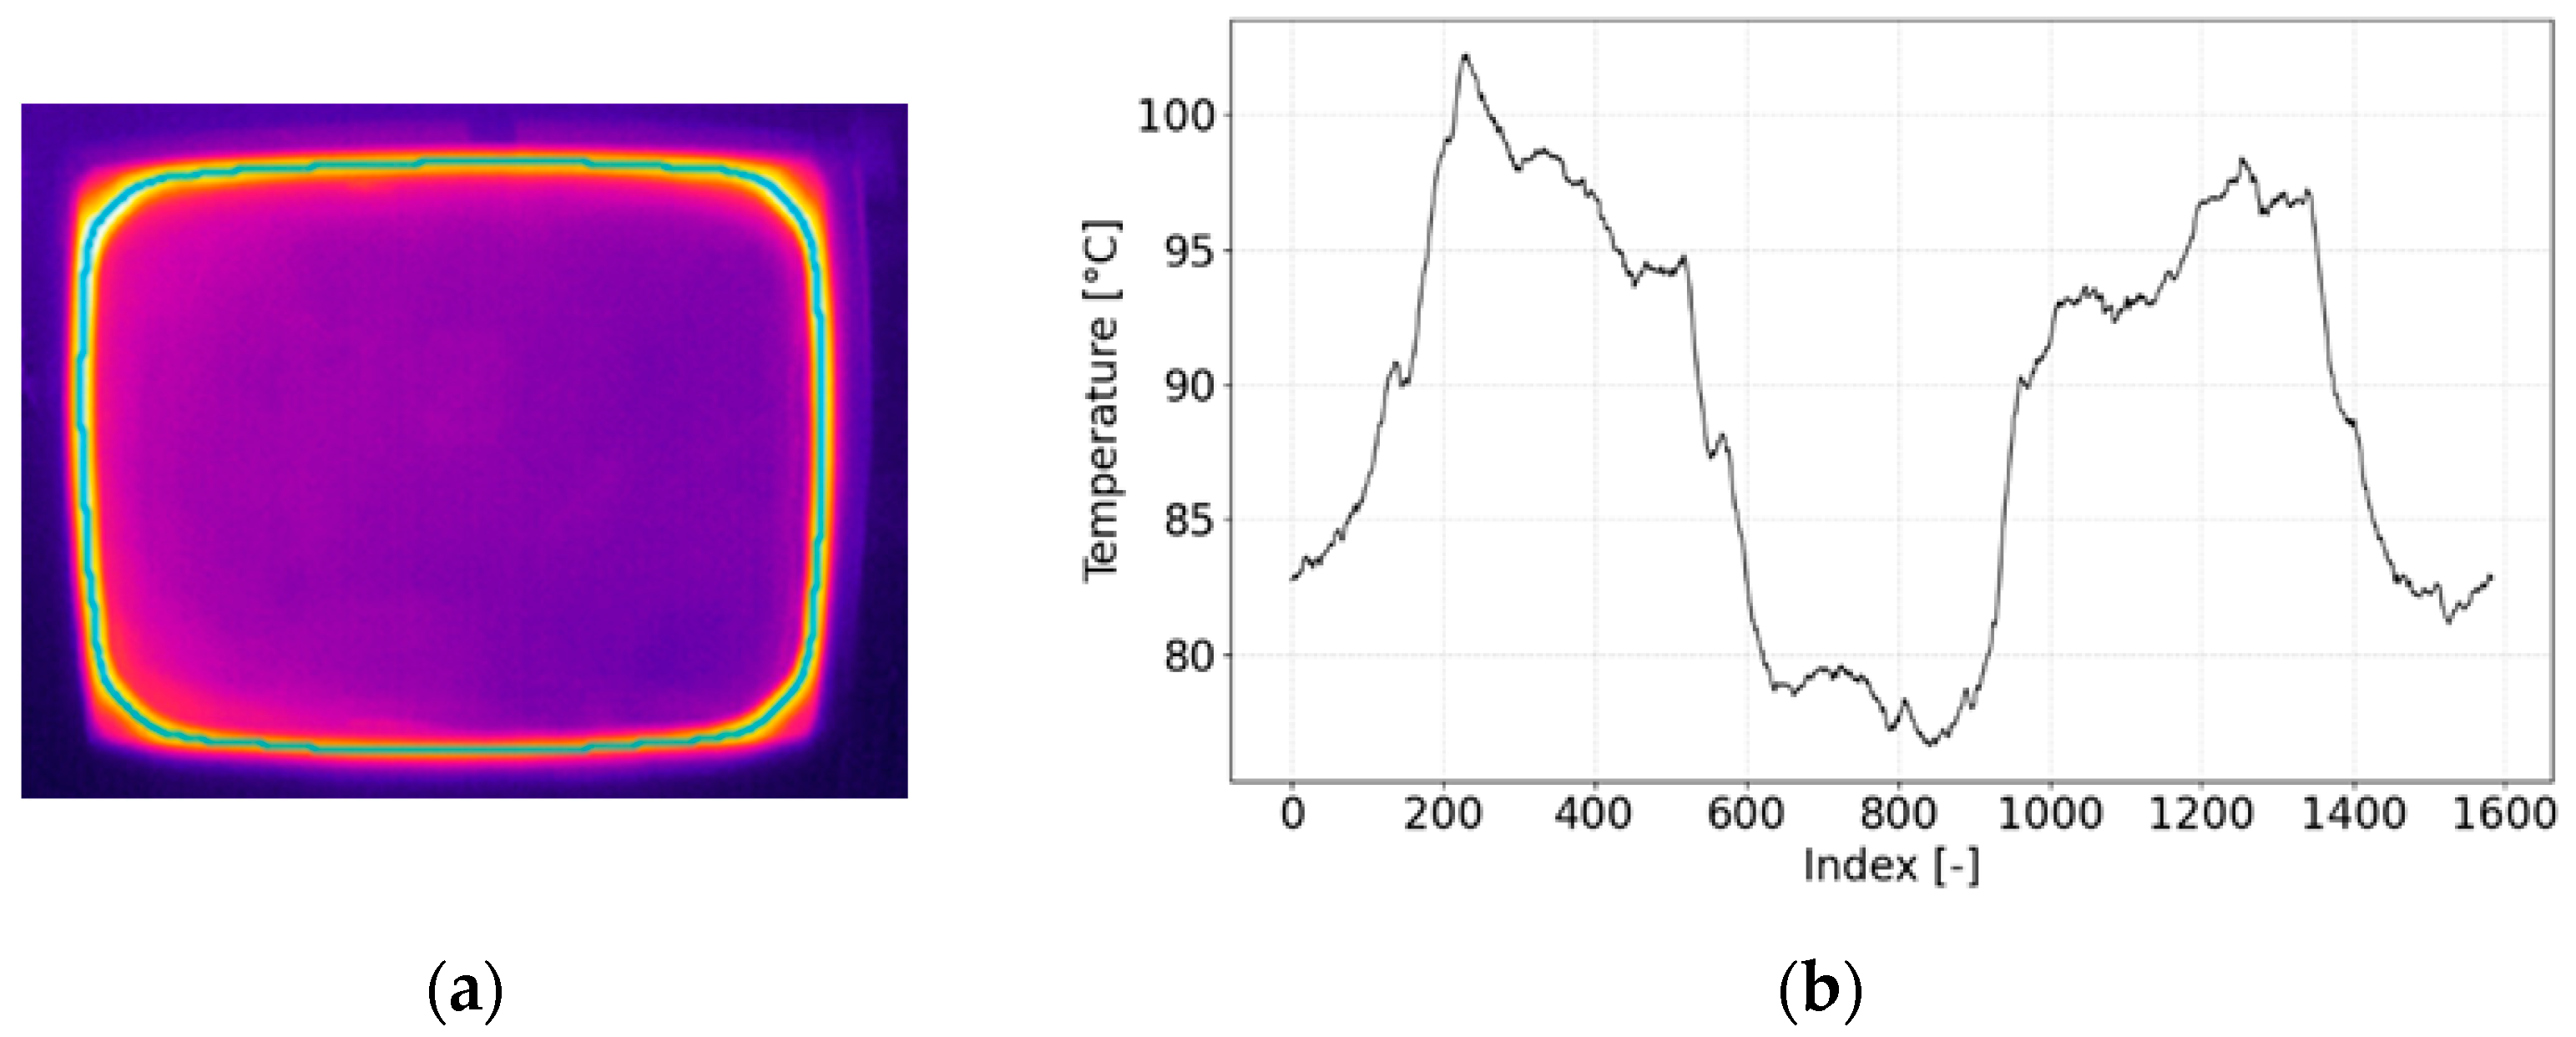
Every test, except the recorded images, is described with a metadata file containing the parameters of the inspection system and the sealing process. Based on the analysis of the recorded images, the defects of a given class are detected, which are over 50 px, corresponding to an area larger than 1 mm2. In addition, the temperature profile of the sealing area (Figure 9a—green) is determined and analyzed by ridge detection [28]. Due to the use of a manual sealer, considerable periodic temperature differences can be observed in the diagram (Figure 9b), resulting from uneven pressing and non-uniform temperature distribution across the heating plate. While practical for laboratory-scale data generation, the manual sealer introduces variability in clamping pressure and alignment, creating controlled noise in the dataset and allowing the model’s robustness to be evaluated under non-ideal, real-world-like conditions.
Due to operator errors and failed burst-pressure tests, the dataset underwent a filtering procedure. Following data cleaning, the resulting dataset comprised 66 samples, each characterized by a defined set of process parameters and corresponding quality inspection outcomes. Each sample has a unique identifier (ID) and is characterized with the following variables: Result—result of a pressure test, hTime—sealing time, mTemp—average heating plate temperature, tempAVG, tempMIN and tempMAX—values of, respectively, the average, minimum and maximum temperatures in the sealing area profile.
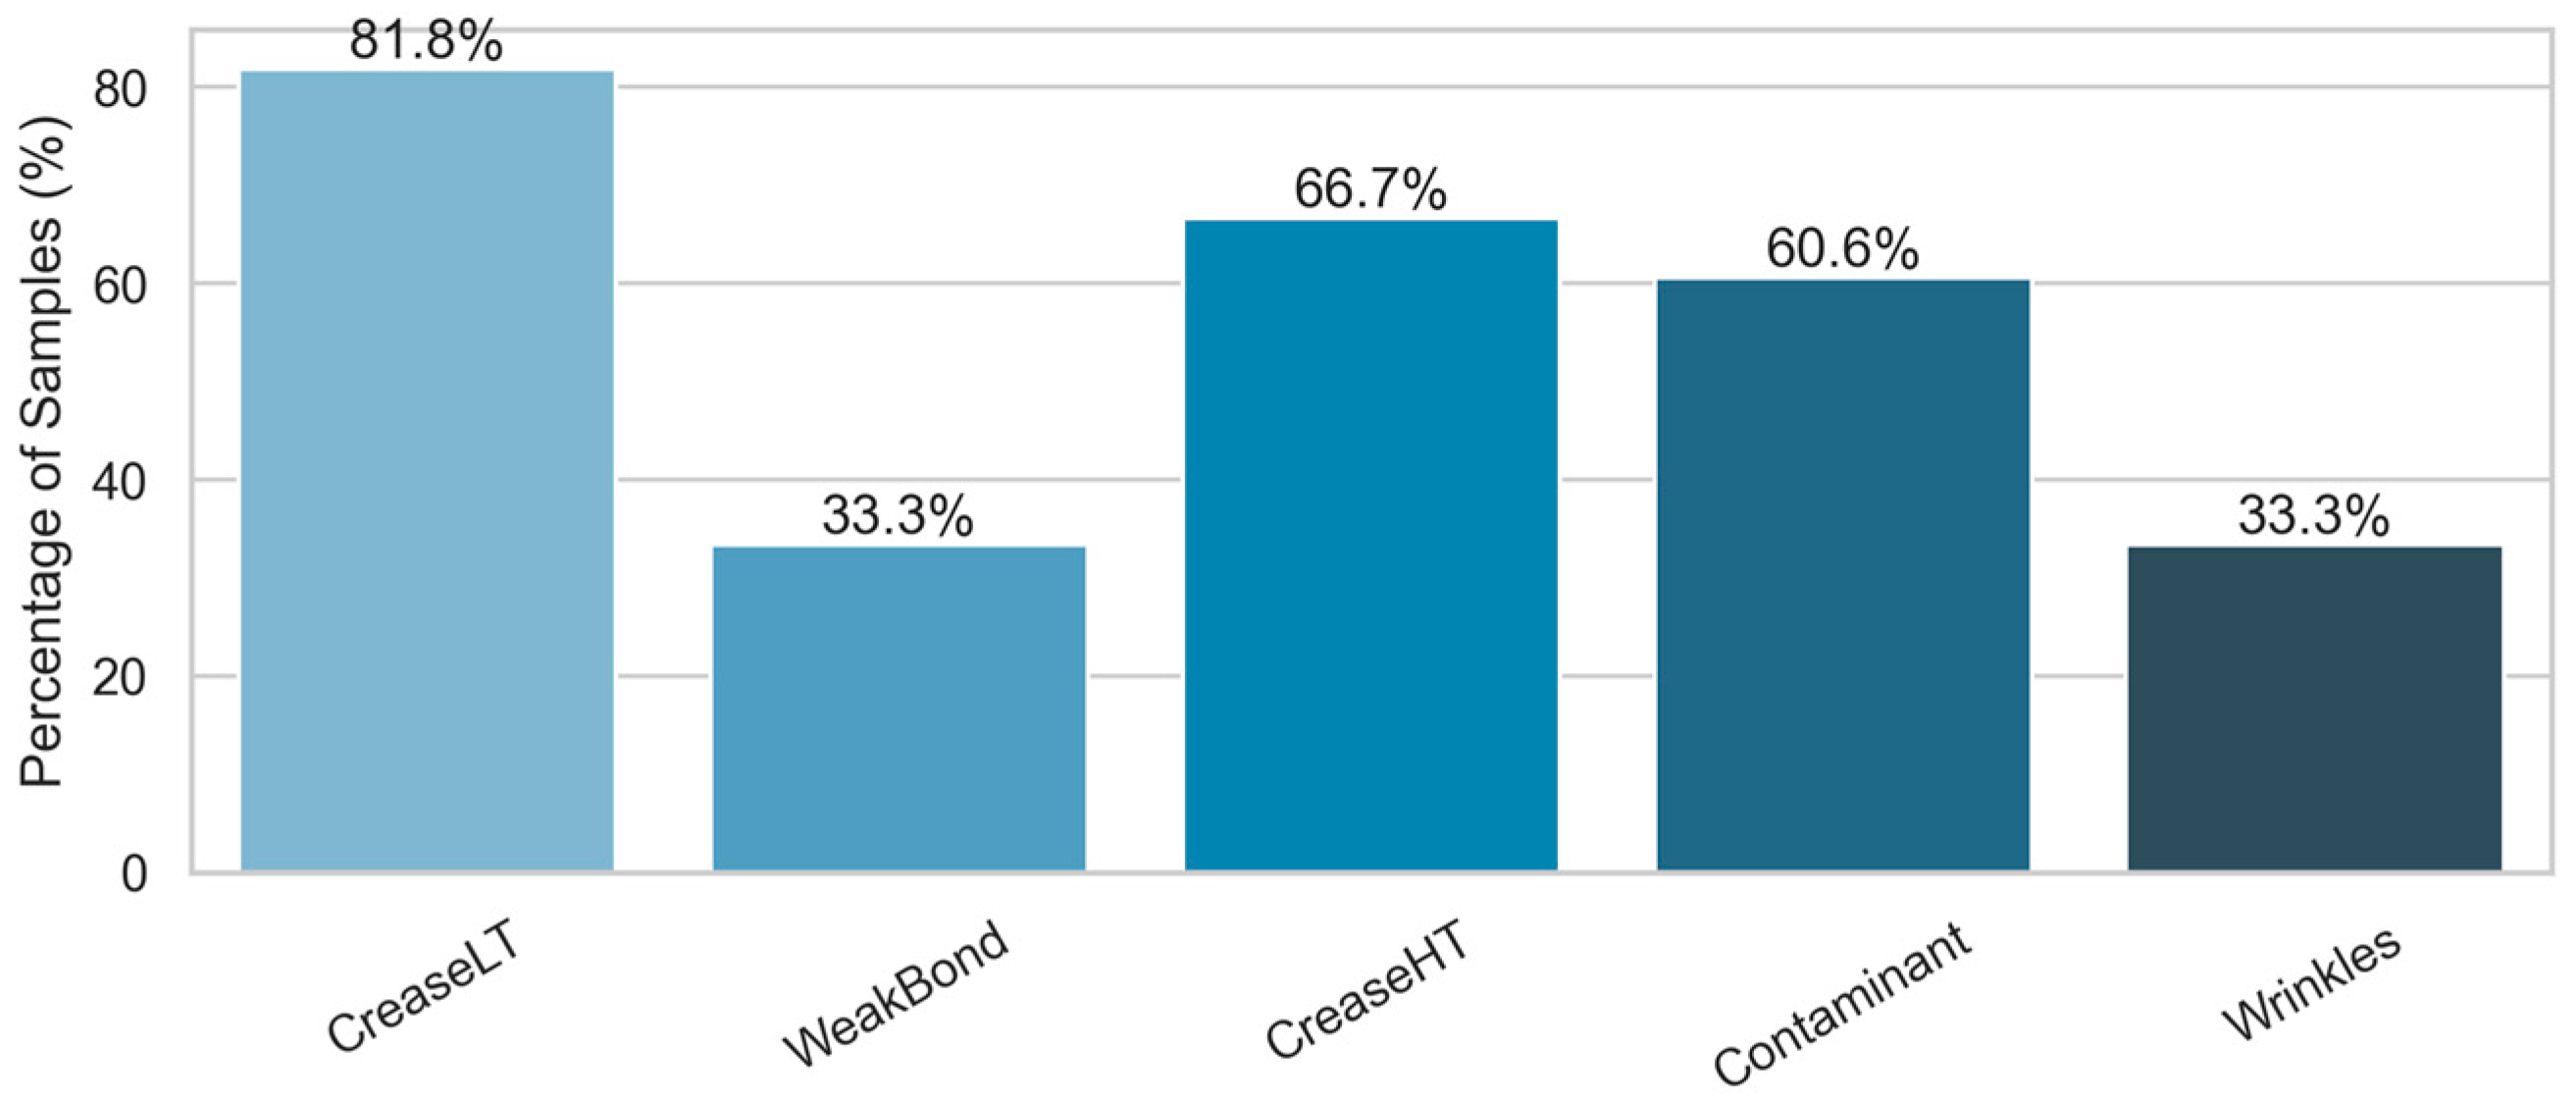
Additionally, the results of vision inspection, including numerical assessment of faults: CreaseLTScore, WeakBondScore, CreaseHTScore, ContaminantScore and WrinklesScore, as well as the TotalScore indicator, the combined result of the seal quality assessment, are recorded for each sample. The distribution of defects is presented in Figure 10.
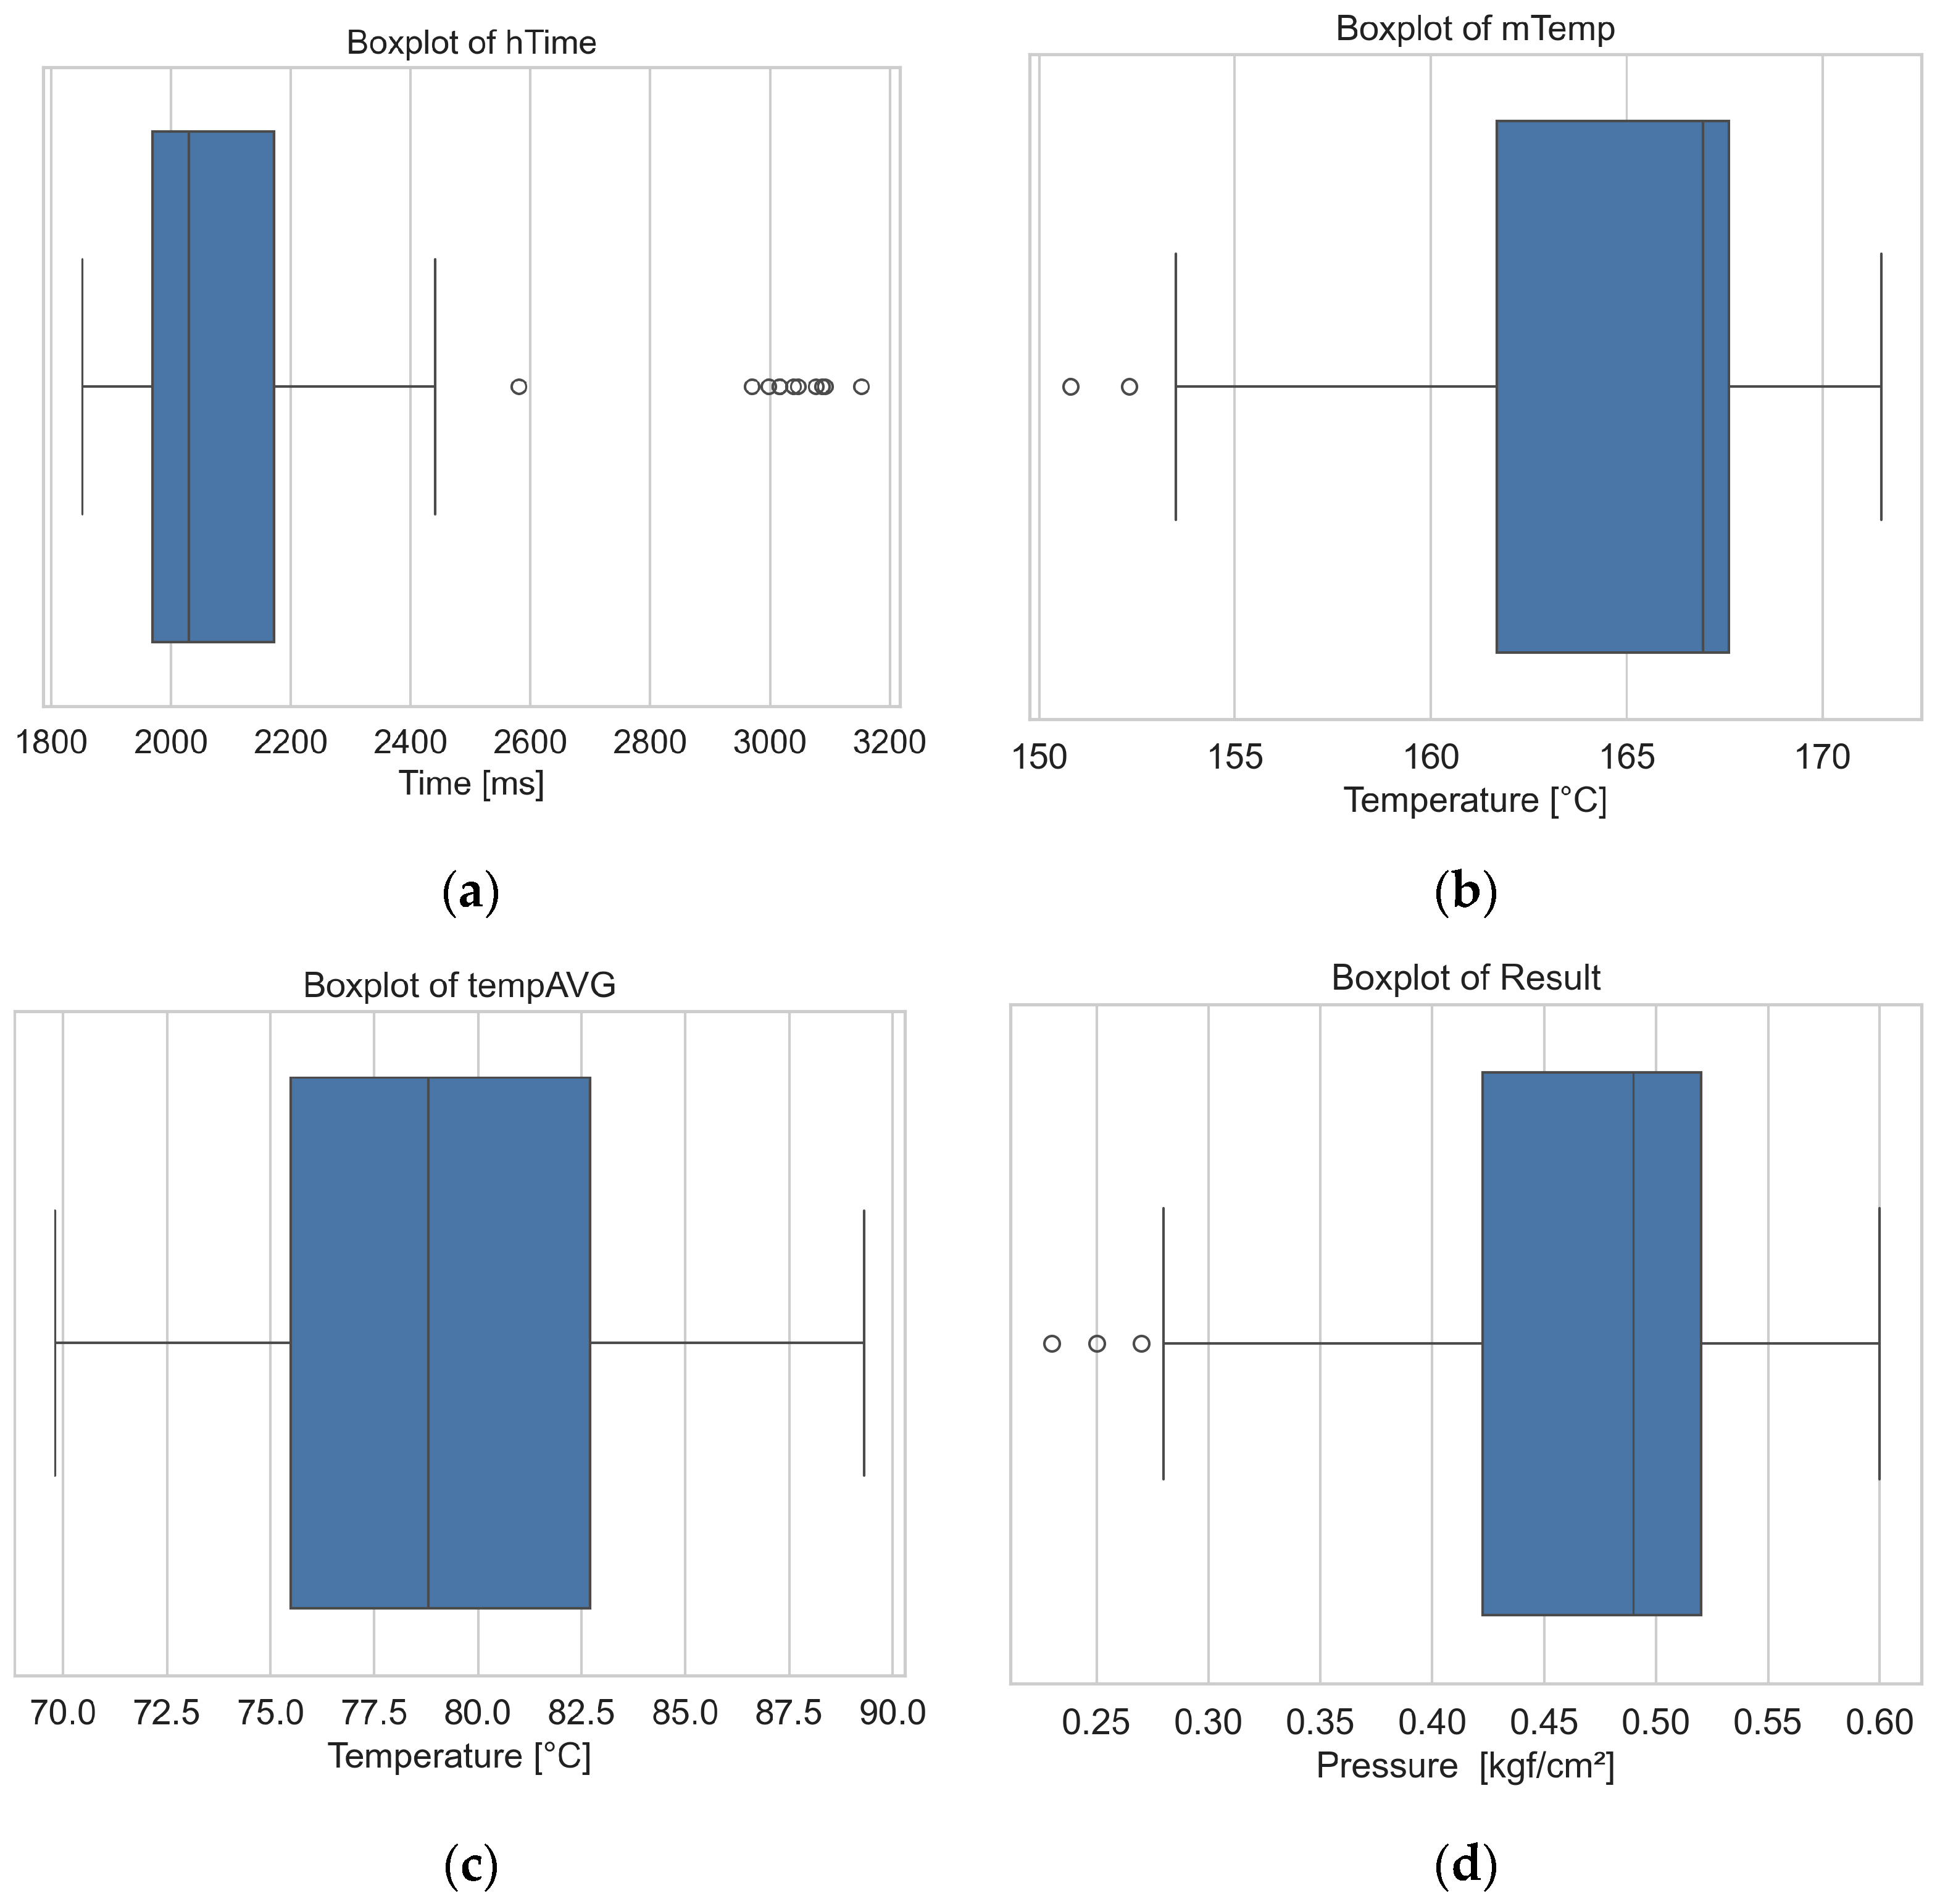
Selected parameters from the final dataset are presented in the box plots (Figure 11). The boxes represent the quartiles, while the whiskers indicate the remaining data range, excluding points classified as outliers (circles) based on the interquartile-range criterion [29].
The presented distributions allow for the identification of highly variable process parameters and for the determination of the values of these variations. Graphic analysis also facilitates a comparison of the ranges and medians of the analyzed parameters.
In the manual sealing process, 2 s nominal time is ensured. In order to check the effect of sealing time changes on the seal quality, a series of samples is made using a sealing time of 3 s. In parallel, a series of test seals is produced for a wide temperature gradient from 150 °C to 172 °C. The perforation values of pressure test connections are assumed to be the metric of the seal quality.

2.3. Predictive Quality Modeling

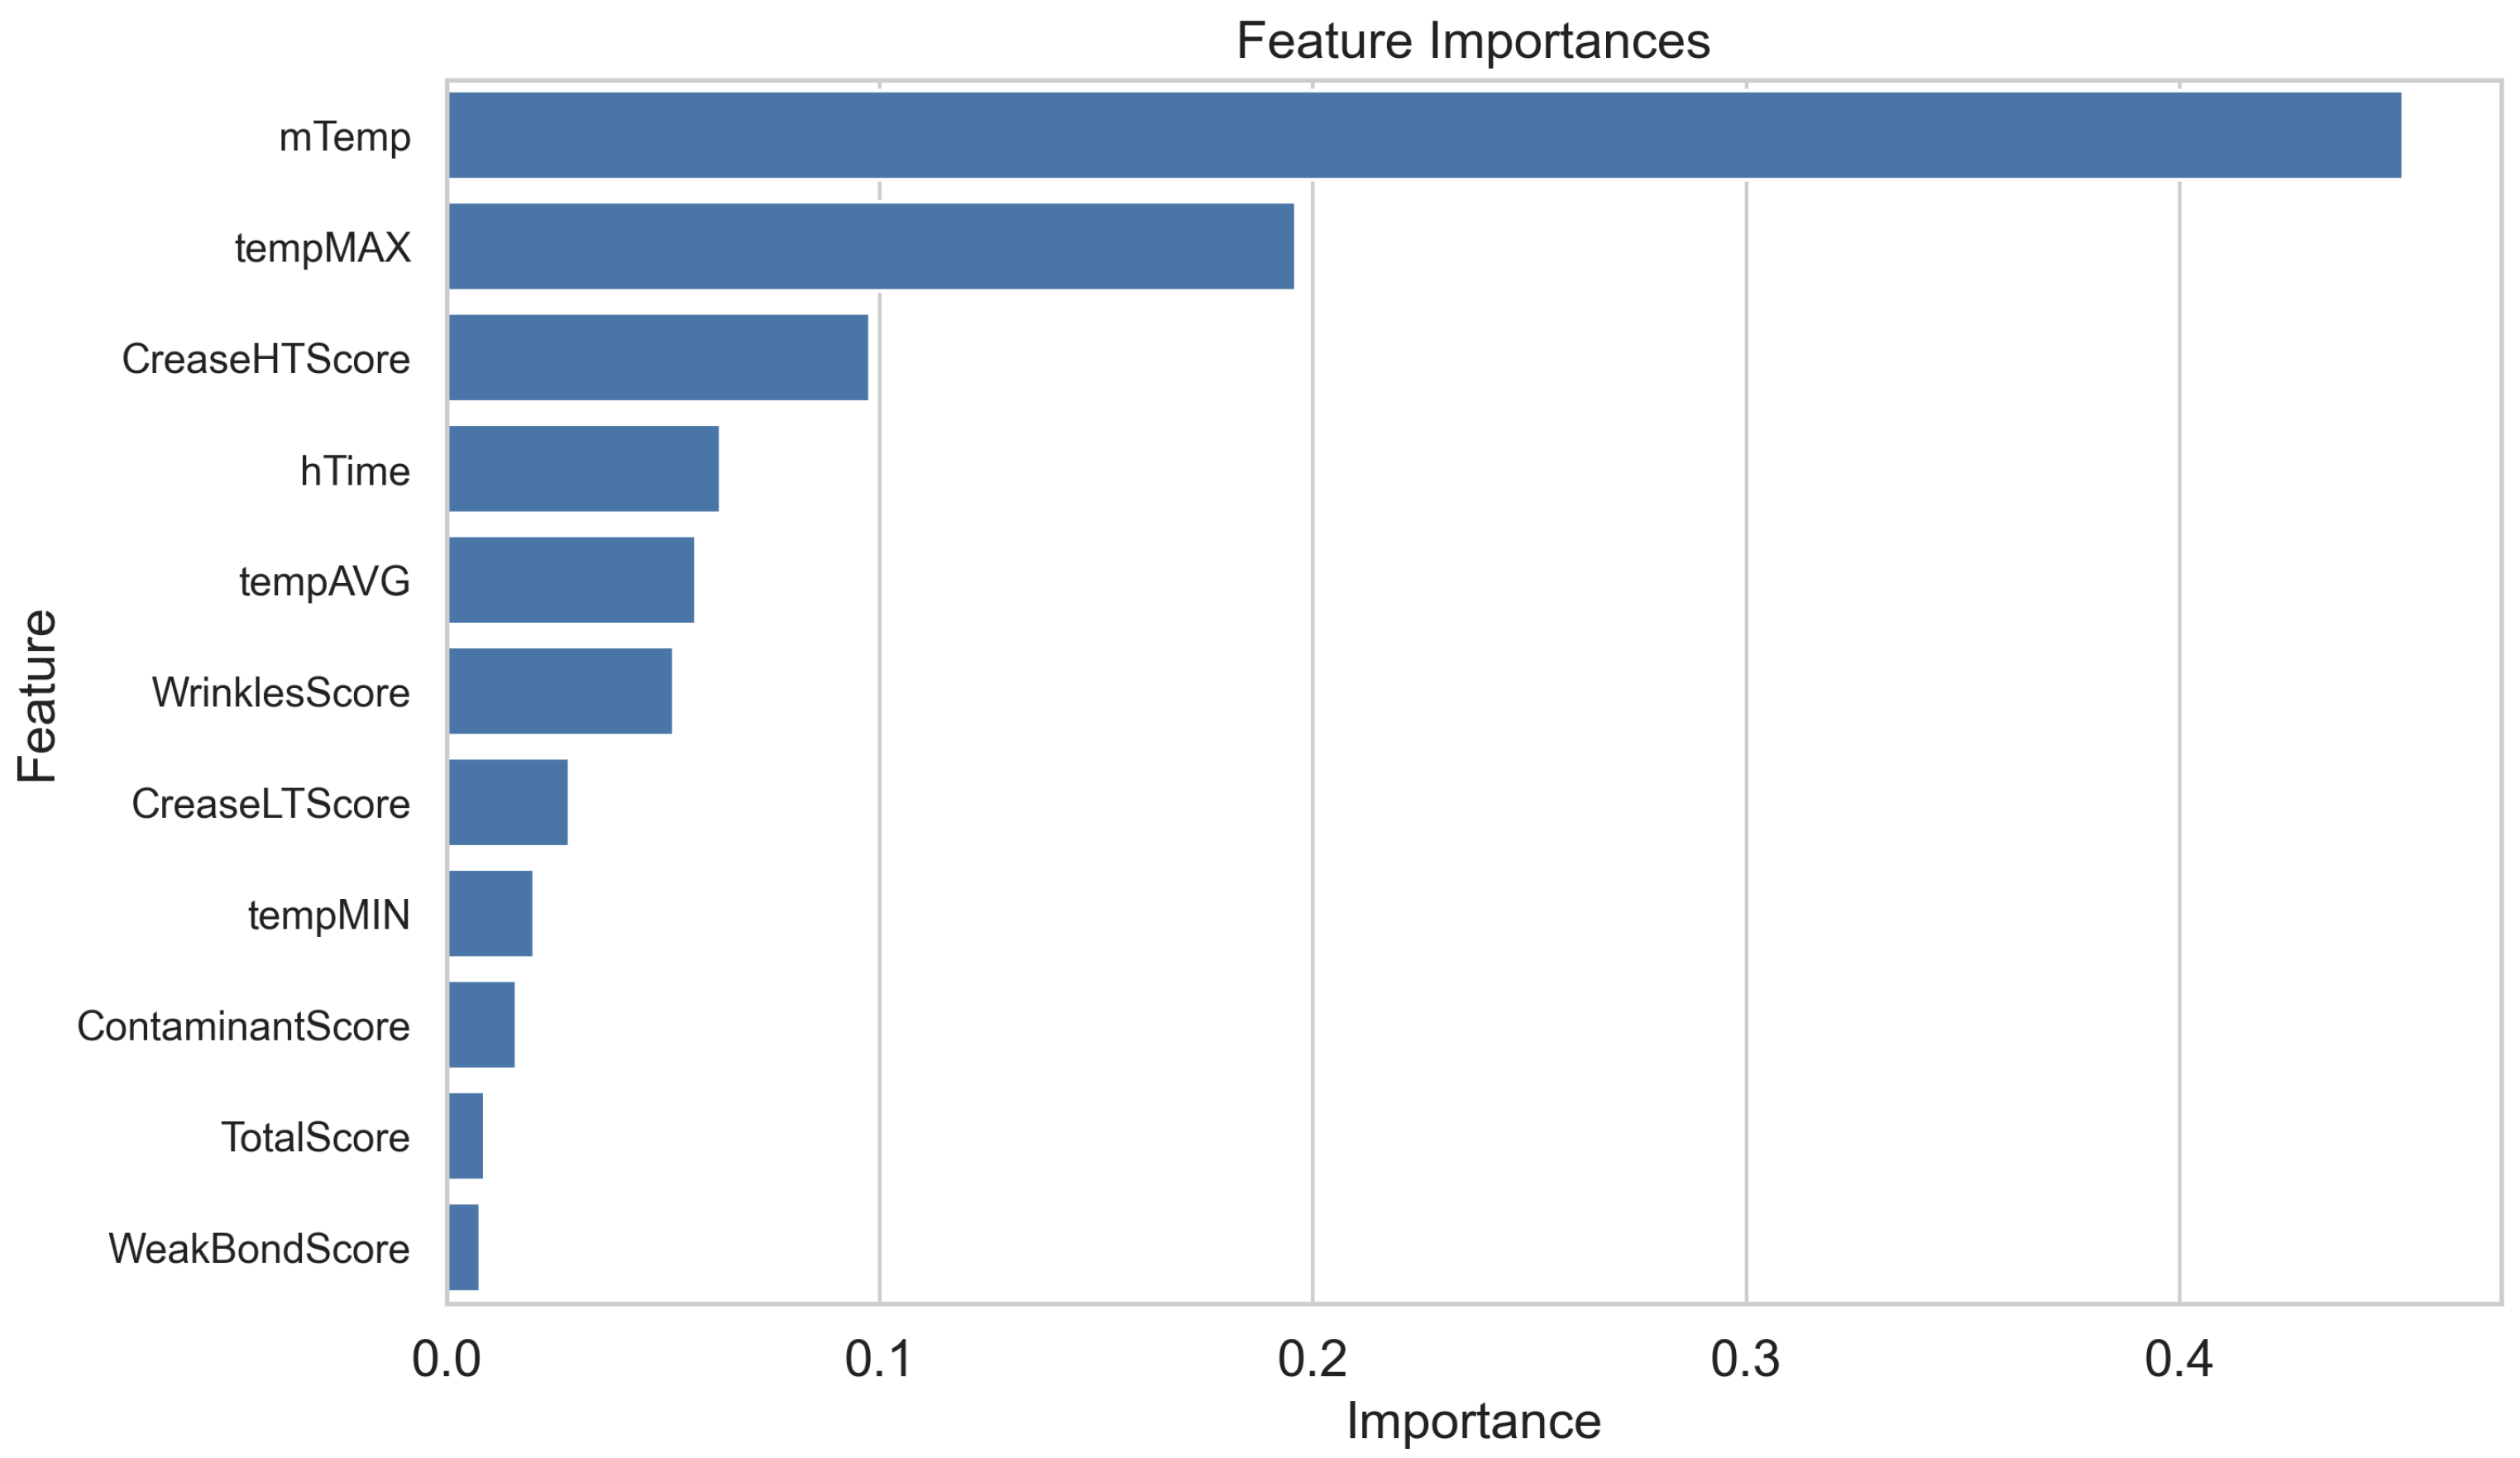
In order to develop a predictive model of the process, a multi-stage approach is used, including feature selection, hyperparameter tuning and comparison of the qualities of different regression algorithms. Before the modeling, the most important variables (Figure 12) are selected by means of the RFE (Recursive Feature Elimination) method with the baseline estimator Random Forest Regressor [30]. This approach iteratively eliminates the least important qualities, helping to select a subset of variables most important for the prediction of the target value.
The process begins with splitting the dataset into training and test subsets using a standard train–test split procedure that preserves randomness, with an 80/20 partition ratio applied. Following the guidance provided in [31], a set of classic regression methods—commonly applied in early-stage studies due to their stability, interpretability and suitability for small datasets—was employed, including:
  • Ridge Regression—a linear model with L2 regularization, reducing variability and counteracting over-learning [32],
  • Lasso Regression—regression with L1 regularization, conducive to the elimination of unimportant predictors [33],
  • Elastic Net—an L1 and L2 combination, integrating the advantages of the Ridge and Lasso methods [34],
  • Support Vector Regression (SVR)—a nonlinear model based on kernel functions, effective with complex dependencies and strong generalization ability [35],
  • Random Forest Regressor—a team model employing the aggregation of many decision trees, resilient to information overload and allowing for the estimation of the variables’ importance [36].
For each model, hyperparameters are tuned within a nested cross-validation framework [37]. The inner loop uses three-fold K-Fold cross-validation (KFold, splits = 3) to perform an exhaustive Grid Search for optimal hyperparameters (GridSearchCV). The generalization performance of the tuned models is then estimated in the outer loop using fivefold K-Fold cross-validation (KFold, splits = 5), which provides an unbiased assessment of model performance.

3. Results

Based on RFE, the four most important features selected for modeling were mTemp, tempMAX, CreaseHTScore and hTime. Table 3 compares the performance of five regression models in predicting the Result value, assessed with the following error metrics: MAE (Mean Absolute Error), RMSE (Root Mean Squared Error) and R2 coefficient of determination. ElasticNet, characterized by the lowest Mean Absolute Error (MAE = 0.028 kgf/cm2) and, simultaneously, the highest coefficient of determination (R2 = 0.815), showed the best performance. This means that this model best fits the data and predicts the target values with the lowest deviation.
To further assess the stability and uncertainty of the best-performing model (ElasticNet), a bootstrap analysis [38] was conducted. Bootstrap resampling (1000 iterations) was applied to the entire dataset. This procedure enabled estimation of the variability of the model’s performance metrics and the corresponding confidence intervals.
The confidence intervals (Table 4) show that the Mean Absolute Error in the model’s prediction remains low, indicative of small deviations between the predicted and actual values. Simultaneously, the R2 coefficient of determination proves the high accordance of the predictions with the observational data, confirming the model’s stability under the conditions of bootstrap sampling. Therefore, the ElasticNet model is characterized by both good alignment and high reliability.
To further test the possibility of using only features from the IR-VIS inspection system in the following test, based on Recursive Feature Elimination, the four most important features selected for modeling were tempAVG, tempMAX, CreaseHTScore and WrinklesScore. Table 5 compares the performance of five regression models in predicting the Result value. Among the evaluated models, only the Lasso regression achieved a meaningful level of predictive accuracy (R2 = 0.407). Although this does not indicate a highly accurate prediction, it shows that the Lasso regression explains a notable fraction of the variance compared to the other evaluated models.
This suggests that Lasso may be a promising candidate for further research, especially if the dataset is expanded in future studies, as models with L1 regularization often benefit from larger sample sizes.

4. Discussion

This investigation focuses on the potential of integrating process data with inspection results obtained from the hybrid IR-VIS system to support decision-making in expert systems. The promising outcomes presented in this study should be interpreted as proof-of-concept findings. Validation on a substantially larger dataset constitutes the next essential step toward confirming the reliability and generalizability of the proposed modeling approach. The comparatively good performance of the ElasticNet model can be attributed to its hybrid regularization mechanism, which combines the feature-selection capability of Lasso with the robustness of Ridge regression in handling correlated predictors. This behavior is consistent with the characteristics of industrial process data, where strong correlations between parameters are common. Although the model relies strongly on process-related variables—particularly the temperature of the sealing element and the seal-profile temperature captured by the thermal camera—a noticeable contribution of vision-based inspection scores is also observed. Features such as CreaseHTScore show promising potential for enhancing model performance once a larger training dataset becomes available. This indicates that visual information may complement process parameters more effectively in future, data-rich scenarios. Nevertheless, comprehensive verification of the solution’s effectiveness requires evaluation on a considerably larger number of samples, which will be undertaken during the pilot implementation of the hybrid inspection system under real production conditions. At the current stage, the model does not yet account for variations in process parameters or material properties. Due to the limited size of the available dataset, several parameters were intentionally kept constant. Although the initial feature space comprised eleven variables, it was reduced to the four most influential ones, enabling the tests of classical regression techniques typically used in early-stage analytical studies.
Future research will incorporate more advanced machine-learning algorithms, such as XGBoost [39] and stacking-based ensemble methods [40], which are expected to enhance predictive accuracy and improve the system’s resilience to data variability. Additional process variables directly obtained from the industrial sealing machine will also be integrated to better reflect real production conditions and increase the adaptive capabilities of the system. Moreover, the model will be further extended to account for variability in packaging materials, including differences in foil characteristics and their influence on rheological properties. As the dataset grows, additional work will focus on developing an enhanced defect-detection and classification model, as well as refining the scoring algorithm and the weighting scheme for individual defect types. An equally important aspect concerns the reliability of data annotation. Ensuring annotation consistency is essential for maintaining data quality. As part of the ongoing development and deployment of the inspection system—and in preparation for future deep-learning models—a comprehensive assessment of annotation reproducibility and reliability will be carried out, including the application of Krippendorff’s coefficient.

5. Conclusions

Industrial heat-sealing processes are susceptible to various disturbances, including foil misalignment, wear of sealing components and variability in packaging material quality. Each of these factors may lead to defects that compromise the final product and generate additional costs associated with refunds and material waste. The hybrid inspection system applied in this study provides complementary and partially redundant information, which is particularly valuable for detecting process anomalies. The integration of multimodal data enhances predictive performance and enables a more reliable assessment of seal quality. Furthermore, implementing continuous, 100% on-line inspection reduces the risk of material losses far more effectively than conventional offline statistical tests, which are typically performed at hourly intervals. It is worth pointing out that in many industrial scenarios packaging machines operate as closed systems, making it difficult to access accurate real-time process parameters. In such cases, only machine setpoints are available, and these—due to limited control precision—do not constitute a fully reliable data source. Under these constraints, the use of inspection system outputs becomes particularly valuable for process optimization, especially when new packaging materials are introduced. Statistical insights derived from the inspection system can substantially shorten machine setup procedures and help minimize material waste.
The introduced concept is the predictive loopback mechanism, in which inspection outputs are fed back into the process to adjust operational parameters. This represents an important step toward realizing a Digital Twin of the sealing process. Such a feedback-driven approach enables ongoing prediction and early detection of defects, as well as identification of their underlying causes. The combination of machine-vision data and machine-learning algorithms facilitates proactive parameter optimization. In the long term, this strategy forms the basis for transitioning toward a predictive production model, where inspection and control systems operate in an integrated, intelligent and self-improving manner. Ultimately, the overarching goal is to reduce sealing time and lower process temperature while maintaining the required seal strength. Achieving this will not only improve production efficiency but also deliver significant energy savings, offering both economic and environmental benefits.

Author Contributions

Conceptualization, A.B., P.G., W.M. and J.M.; methodology, A.B., P.G. and P.C.; software, P.G. and J.M.; validation, P.G. and J.M.; formal analysis, J.M. and A.B.; investigation, P.G. and P.C.; resources, J.M. and W.M.; data curation, P.G.; writing—original draft preparation, P.G., P.C. and W.M.; writing—review and editing, A.B. and P.C.; visualization, P.G. and P.C.; supervision, J.M. and W.M.; project administration, A.B., J.M. and P.G.; funding acquisition, A.B., P.G. and J.M. All authors have read and agreed to the published version of the manuscript.

Funding

This study was partially funded by the Polish Ministry of Science and Higher Education as a part of the Implementation Doctorate Programme.

Institutional Review Board Statement

Not applicable.

Informed Consent Statement

Not applicable.

Data Availability Statement

The data presented in this study are available on request from the corresponding author. The data are not publicly available due to privacy.

Conflicts of Interest

The authors declare no conflicts of interest.

References

  1. D’Almeida, A.P.; de Albuquerque, T.L. Innovations in Food Packaging: From Bio-Based Materials to Smart Packaging Systems. Processes 2024, 12, 2085. [Google Scholar] [CrossRef]
  2. Ilhan, I.; Turan, D.; Gibson, I.; Klooster, R. Understanding the factors affecting the seal integrity in heat sealed flexible food packages: A review. Packag. Technol. Sci. 2021, 34, 321–337. [Google Scholar] [CrossRef]
  3. Banús, N.; Boada, I.; Xiberta, P.; Toldrà, P.; Bustins, N. Deep Learning for the Quality Control of Thermoforming Food Packages. Sci. Rep. 2021, 11, 21887. [Google Scholar] [CrossRef]
  4. Inspecting Transparent Materials for Material Defects—Vision Development Module. NI.com. 2024. Available online: https://www.ni.com/en/shop/data-acquisition-and-control/add-ons-for-data-acquisition-and-control/what-is-vision-development-module/inspecting-transparent-materials-for-material-defects.html (accessed on 7 October 2025).
  5. Benouis, M.; Medus, L.D.; Saban, M.; Ghemougui, A.; Rosado-Muñoz, A. Food Tray Sealing Fault Detection in Multi-Spectral Images Using Data Fusion and Deep Learning Techniques. J. Imaging 2021, 7, 186. [Google Scholar] [CrossRef]
  6. Case Study: 3D Vision Automates Inspection of Heat-Sealed Bags in Food Processing Industry. Manufacturing.net. 2017. Available online: https://www.manufacturing.net/home/article/13164990/case-study-3d-vision-automates-inspection-of-heatsealed-bags-in-food-processing-industry (accessed on 7 October 2025).
  7. Sioma, A. 3D Imaging Methods in Quality Inspection Systems. Proc. SPIE 2019, 11176, 111760L. [Google Scholar] [CrossRef]
  8. Guillot, V. Infrared Thermography for Seal Defects Detection on Packaged Products: Unbalanced Machine Learning Classification with Iterative Digital Image Restoration. Electron. Lett. Comput. Vis. Image Anal. 2023, 22, 35–51. [Google Scholar] [CrossRef]
  9. Hao, Z.; Chen, Y.; Yu, Z.; Qian, Y.; Zhao, L. Thermal Imaging-Based Defect Detection Method for Aluminum Foil Sealing Using EAC-Net. Appl. Sci. 2025, 15, 9964. [Google Scholar] [CrossRef]
  10. Sioma, A. Vision System in Product Quality Control Systems. Appl. Sci. 2023, 13, 751. [Google Scholar] [CrossRef]
  11. Chhetri, K.B. Applications of Artificial Intelligence and Machine Learning in Food Quality Control and Safety Assessment. Food Eng. Rev. 2024, 16, 1–21. [Google Scholar] [CrossRef]
  12. Brunelli, L.; Masiero, C.; Tosato, D.; Beghi, A.; Susto, G.A. Deep learning-based production forecasting in manufacturing: A packaging equipment case study. Procedia Manuf. 2019, 38, 248–255. [Google Scholar] [CrossRef]
  13. Cutulenco, G.; Ciceri, M.; Biron, J. Predictive Quality: The Future of Quality in Manufacturing. 2021. Available online: https://acerta.ai (accessed on 7 October 2025).
  14. Liakos, K.G.; Athanasiadis, V.; Bozinou, E.; Lalas, S.I. Machine Learning for Quality Control in the Food Industry: A Review. Foods 2025, 14, 3424. [Google Scholar] [CrossRef]
  15. Szybicki, D.; Muszyńska, M.; Pietruś, P.; Burghardt, A.; Kurc, K. Creating Digital Twins of Robotic Stations Using a Laser Tracker. Electronics 2024, 13, 4271. [Google Scholar] [CrossRef]
  16. Smart Monitoring and Automated Real-Time Visual Inspection of Sealant Application (SMART-VIStA), Final Project Report. 25 March 2023. Available online: https://apps.dtic.mil/sti/citations/trecms/AD1198843 (accessed on 5 January 2026).
  17. Cao, Y. Multisensor Data Fusion-Driven Digital Twins in Computer Numerical Control Machining: A Review. Machines 2025, 13, 921. [Google Scholar] [CrossRef]
  18. Rodríguez, F.; Chicaiza, W.D.; Sánchez, A.; Escaño, J.M. Updating Digital Twins: Methodology for Data Accuracy Quality Control Using Machine Learning Techniques. Comput. Ind. 2023, 151, 103958. [Google Scholar] [CrossRef]
  19. Cheng, Y.; Deng, Y.; Cao, J.; Xiong, X.; Bai, L.; Li, Z. Multi-Wave and Hybrid Imaging Techniques: A New Direction for Nondestructive Testing and Structural Health Monitoring. Sensors 2013, 13, 16146–16190. [Google Scholar] [CrossRef]
  20. Adamczyk, J.; Sioma, A. Automatization of Workspace Control Based on ToF Technology. Proc. SPIE 2018, 10808, 108081E. [Google Scholar] [CrossRef]
  21. Cinal, M.; Sioma, A.; Lenty, B. The Quality Control System of Planks Using Machine Vision. Appl. Sci. 2023, 13, 9187. [Google Scholar] [CrossRef]
  22. Waśniowska, J.; Sioma, A. Modelling the Interaction of Illuminations with a Sensor Matrix Used in Vision Systems. Appl. Sci. 2023, 13, 10641. [Google Scholar] [CrossRef]
  23. Linowska, B.; Garbacz, P. Hyperspectral Imaging System for Food Safety Inspection. In Automation 2023: Key Challenges in Automation, Robotics and Measurement Techniques; Szewczyk, R., Zieliński, C., Kaliczyńska, M., Bučinskas, V., Eds.; Lecture Notes in Networks and Systems; Springer: Cham, Switzerland, 2023; Volume 630, pp. 204–211. [Google Scholar]
  24. Garbacz, P. A Target-Oriented Image Fusion Method for Quality Inspection of Heat-Sealed Packages. In Progress in Pattern Classification and Machine Learning; Kurzynski, M., Wozniak, M., Burduk, R., Eds.; Lecture Notes in Networks and Systems; Springer: Cham, Switzerland, 2025; Volume 1557, pp. 20–29. [Google Scholar] [CrossRef]
  25. Madejski, G.; Zbytniewski, S.; Kurowski, M.; Gradolewski, D.; Kaoka, W.; Kulesza, W.J. Lens Distortion Measurement and Correction for Stereovision Multi-Camera System. Eng. Proc. 2024, 82, 85. [Google Scholar] [CrossRef]
  26. Ajji, A.; Jalali Dil, E.; Saffar, A.; Kanani Aghkand, Z. Chapter 3. Seal Quality and Performance Evaluation Methods. In Heat Sealing in Packaging: Materials and Process Considerations; De Gruyter: Berlin, Germany; Boston, MA, USA, 2023; pp. 31–48. [Google Scholar]
  27. Czajka, P.; Mizak, W.; Mężyk, J. Device for Inspection of Thermally Sealed Pouches. Technol. I Autom. Montażu (Assem. Tech. Technol.) 2025, 128, 36–49. [Google Scholar] [CrossRef]
  28. Pietrzkiewicz, P. Image Analysis Techniques for Industrial Inspection Systems; Adaptive Vision. 2020. Available online: https://www.adaptive-vision.com/download/mvg.pdf (accessed on 7 October 2025).
  29. Seabron, Comparing Distributions. Available online: https://seaborn.pydata.org/ (accessed on 5 January 2026).
  30. Gregorutti, B.; Michel, B.; Saint-Pierre, P. Correlation and variable importance in random forests. Stat Comput. 2017, 27, 659–678. [Google Scholar] [CrossRef]
  31. Othman, S.; Mavani, N.R.; Hussain, M.A.; Abd Rahman, N.; Ali, J.M. Artificial Intelligence-Based Techniques for Adulteration and Defect Detections in Food and Agricultural Industry: A Review. J. Agric. Food Res. 2023, 12, 100590. [Google Scholar] [CrossRef]
  32. Hastie, T. Ridge Regularization: An Essential Concept in Data Science. Technometrics 2020, 62, 1–21. [Google Scholar] [CrossRef] [PubMed]
  33. Bhattacharyya, J. LASSO Regression—A Procedural Improvement. Psychology 2025. Preprint. [Google Scholar] [CrossRef]
  34. Erp, S.; Oberski, D.; Mulder, J. Shrinkage priors for Bayesian penalized regression. J. Math. Psychol. 2019, 89, 31–50. [Google Scholar] [CrossRef]
  35. Almansour, K.; Alsaab, H.O. Machine learning analysis and simulation of pharmaceutical drying process based on prediction of concentration distribution and mass transfer. Sci. Rep. 2025, 15, 38325. [Google Scholar] [CrossRef]
  36. Liaw, A.; Wiener, M. Classification and Regression by RandomForest. R News 2002, 12, 18–22. [Google Scholar]
  37. Varma, S.; Simon, R. Bias in Error Estimation When Using Cross-Validation for Model Selection. BMC Bioinform. 2006, 7, 91. [Google Scholar] [CrossRef]
  38. Steyerberg, E.W.; Harrell, F.E., Jr.; Borsboom, G.J.J.M.; Eijkemans, M.J.C.; Vergouwe, Y.; Habbema, J.D.F. Internal Validation of Predictive Models: Efficiency of Some Procedures for Logistic Regression Analysis. J. Clin. Epidemiol. 2001, 54, 774–781. [Google Scholar] [CrossRef]
  39. Wen, H.-T.; Wu, H.-Y.; Liao, K.-C. Using XGBoost Regression to Analyze the Importance of Input Features Applied to an Artificial Intelligence Model for the Biomass Gasification System. Inventions 2022, 7, 126. [Google Scholar] [CrossRef]
  40. Aboneh, T.; Rorissa, A.; Srinivasagan, R. Stacking-Based Ensemble Learning Method for Multi-Spectral Image Classification. Technologies 2022, 10, 17. [Google Scholar] [CrossRef]
Figure 1. Hybrid imaging system: (a) image fusion, (b) model version of IR-VIS inspection system.
Applsci 16 00923 g001
Figure 2. IR Camera calibration: (a) calibration target, (b) raw image, (c) corrected image.
Applsci 16 00923 g002
Figure 3. Image fusion: (a) RGB pseudo-image, (b) selected areas ROI.
Applsci 16 00923 g003
Figure 4. Pressure tester for packaging: 1—control-measurement module, 2—executive module.
Applsci 16 00923 g004
Figure 5. Sample test (a) photos before the test; (b) pressure measurement graph.
Applsci 16 00923 g005
Figure 6. Test station 3D model: (a) overview, (b) sealing module.
Applsci 16 00923 g006
Figure 7. Process flow of data acquisition.
Applsci 16 00923 g007
Figure 8. Thermal data acquisition: (a) thermogram of the heating plate; (b) thermal camera.
Applsci 16 00923 g008
Figure 9. The determination of a seal’s temperature profile: (a) thermogram, (b) diagram.
Applsci 16 00923 g009
Figure 10. Distribution of defects in the final dataset.
Applsci 16 00923 g010
Figure 11. The distribution of selected process variables: (a) sealing time, (b) average temperature of the plate, (c) average temperature of the seal, (d) result of pressure test.
Applsci 16 00923 g011
Figure 12. Feature importance from RandomForest.
Applsci 16 00923 g012
Table 1. Technical parameters of the foil used for welding.
ParameterValueRemarks
MaterialPET/PP
Width265 mm
Thickness52 µmTolerance +/−10%
Seal strength >15 N/15 mmDIN 55529
Sealing temperature140–220 °CRecommended range
Table 2. Statistical data of laboratory tests performed.
ParameterMeanStd. DeviationMedianMinimumMaximum
Tacq [ms]866117866986178678
Tw [ms]2121305202018523152
Table 3. Model comparison (input features mTemp, tempMAX, CreaseHTScore and hTime).
ModelMAE [kgf/cm2]RMSE [kgf/cm2]R2 [-]
ElasticNet0.0280.0370.815
Ridge0.0290.0370.814
Lasso0.0290.0380.809
SVR0.0290.0380.805
RandomForest0.0390.0480.686
Table 4. The confidence intervals for the metrics of the model’s quality prediction.
Metric95% Confidence Interval
MAE0.015—0.025 [kgf/cm2]
R20.850—0.954 [-]
Table 5. Model comparison (input features tempAVG, tempMAX, CreaseHTScore and WrinklesScore).
ModelMAE [kgf/cm2]RMSE [kgf/cm2]R2 [-]
Lasso0.0520.0660.407
ElasticNet0.0610.0720.295
RandomForest0.0590.0750.232
Ridge0.0650.0850.018
SVR0.0670.087−0.028
Disclaimer/Publisher’s Note: The statements, opinions and data contained in all publications are solely those of the individual author(s) and contributor(s) and not of MDPI and/or the editor(s). MDPI and/or the editor(s) disclaim responsibility for any injury to people or property resulting from any ideas, methods, instructions or products referred to in the content.