Article

Design of Wireless Passive Multi-Grid CSRR-SIW Sensor for Temperature and Pressure Monitoring

1
School of Mechanical Engineering, Nanjing University of Science and Technology, Nanjing 210094, China
2
China North Industries Group Corporation Limited, No. 214 Research Institute, Bengbu 233000, China
*
Author to whom correspondence should be addressed.
Appl. Sci. 2026, 16(2), 803; https://doi.org/10.3390/app16020803
Submission received: 16 November 2025 / Revised: 16 December 2025 / Accepted: 9 January 2026 / Published: 13 January 2026
(This article belongs to the Special Issue Advances in Development and Application of Perception Sensors)

Abstract

To measure temperature and pressure parameters in harsh environments such as those with high temperature and high pressure, a wireless and passive multi-grid Complementary Split-Ring Resonator and substrate integrated waveguide (MG-CSRR-SIW) structure for a temperature and pressure sensor based on microwave scattering principles and high-temperature co-fired ceramic (HTCC) technology is proposed. It can measure temperature within 25–1200 °C and pressure within 0–300 kPa. The structural design of the sensor by using high-frequency electromagnetic simulation software contributes to a linear relationship between the measured parameters and the sensor’s return loss (S11). Furthermore, the performance validation of the proposed sensor is implemented by sensor fabrication and experimentation. The test results show that the proposed sensor exhibits good performance of reliability and linearity. The temperature sensitivity is 199.33 kHz/°C and 379.75 kHz/°C in the temperature ranges of 25–475 °C and 475–1200 °C, respectively. In addition, the pressure sensitivity reaches 235.5 kHz/kPa at 800 °C. The maximum relative measurement error is 2.2% and 1.45% in regard to temperature and pressure, respectively.

1. Introduction

In the harsh environment of high temperature and high pressure during the operation of spacecraft [1,2,3], accurate acquisition of parameters such as temperature and pressure in key areas such as the skin, engine, and gas turbine can provide guarantees for the selection of spacecraft materials, structural design, and protective measures [4,5]. In recent years, due to difficulties in deployment, complex and messy wiring, poor high-temperature resistance of connection solder joints, and power supply issues, wired active sensors have encountered challenges [6,7]. As a result, wireless passive non-contact measurement methods have gained widespread attention in the field of high-temperature and high-pressure sensing [8].
In recent years, the CSRR structure has gained significant attention due to its unique ability to simultaneously exhibit negative permittivity and negative permeability. It is proved that the CSRR structure has convergence and band-stop effects for improving the gain and radiation performance of resonators and facilitating the emergence of absorption peaks. Zhang et al. [9] designed an improved semicircular CSRR-SIW structure sensor by employing alumina ceramic material for temperature measurement in the range of 25–1200 °C. The sensor achieves sensitivities of 106.67 kHz/°C and 437.5 kHz/°C in the low and high-temperature regions, respectively, significantly enhancing the sensitivity coefficient of the sensor. Beria et al. [10] introduced a microwave sensor that combines a defected ground interdigitated capacitor (DG-IDC) with a pentagonal CSRR to enhance sensitivity for permittivity detection. The strong coupling between the two resonators increased electric-field concentration, improving sensitivity and measurement accuracy. The sensor achieved a high normalized sensitivity of 3.5%, with measurement errors of 3.2% for ε′ and 3.12% for ε″, demonstrating its effectiveness for precise chemical sample characterization. Furthermore, researchers worldwide have optimized the electromagnetic performance of CSRR structures and achieved stronger coupled electromagnetic resonance by introducing additional splits or increasing resonant rings to form multi-grid structures. This approach enables stronger coupled electromagnetic resonance [11,12], significantly enhancing sensor sensitivity to dielectric changes while improving signal transmission and sensing capabilities. In addition, the field concentration of split-ring and multi-ring structures additionally facilitates sensor miniaturization due to the smaller size of the same inter-ring coupling effect.
This technique has been validated in material detection and liquid dielectric constant measurement [13]. Liu et al. [14] designed a sub-wavelength multi-split grid resonant sensor for microwave detection, achieving a peak electric field strength of 105 V/m. This design strengthened the sensor’s sensitivity by 1.3 times compared to conventional complementary split-ring resonator sensors. Hosseini et al. [15] developed a split-ring multi-grid resonant microwave sensor for real-time, non-contact monitoring of fermentation processes. By integrating a U-shaped structure into the split-ring resonator and coupling it with the resonator’s gap region, the electric field distribution was significantly improved, resulting in a 100% improvement in overall sensor sensitivity. Abdulkarim et al. [16] designed a hexagonal split-ring grid resonant sensor for fuel adulteration detection. The sensor utilizes a grid structure composed of three resonators arranged in parallel, enabling the detection of subtle changes in the dielectric constant of the system. Yu et al. [17] introduced an open composite split-ring grid resonant sensor for measuring the dielectric constant of liquid samples. The sensor featured a hexagonal outer ring and a rectangular inner ring to achieve higher electric field intensity. Compared to similar sensors, this design improved average sensitivity by 0.88%. Buragohain et al. [18] presented a differential hexagonal split-ring grid resonant sensor for measuring the dielectric constant of organic liquids. The sensor incorporated a pair of hexagonal split-ring resonators symmetrically placed on both sides of the transmission line. This arrangement achieved excellent field concentration over a compact surface area and an extended lateral interaction length, ensuring improved power transmission to the resonator. The sensor demonstrated a sensitivity of up to 246.68 and a measurement error as low as 1.15%. Muhammad et al. [19] proposed a dual-negative square resonant cavity-shaped split ring grating sensor for detecting the type and thickness of materials. It features high sensitivity, high Q factor, and good absorption characteristics. The Q quality factors at 2.88 GHz and 3.5 GHz frequency bands can reach 1413.29 and 1140.16, respectively. Therefore, it is meaningful for us to investigate how to combine the multi-grid structure and CSRR-SIW structure for wireless passive temperature and pressure sensors.
In this paper, to our best knowledge, the main contribution is that this is a first attempt to input a multi-grid structure into CSRR-SIW structure by additional splits or increasing resonant rings for a wireless high-temperature and pressure HTCC sensor. This novel structure is expected to acquire stronger coupled electromagnetic resonance, stronger coupled electromagnetic resonance, more sensitivity to dielectric changes, and sensor miniaturization due to the field concentration effect. This paper is organized as follows. The proposed system architecture and principle are presented in Section 2 including the equivalent circuit by ADS simulation and model and simulation using COMSOL 6.3 and HFSS 14.0 software. The initial geometric parameter determination of the sensor structure is based on the ADS simulation. In Section 3, the electromagnetic and resonant frequency simulation for the final geometric parameters of the sensor structure is identified. In Section 4, the sensor preparation is implemented. Finally, to verify the performance of the proposed sensor structure, experiments in regards to temperature and pressure evaluation and wireless performance are carried out. Lastly, we conclude this paper and discuss future work in Section 5.

2. The Circuit Design of the MG-CSRR-SIW Structure

2.1. The Design Procedure of the Wireless MG-CSRR-SIW Model

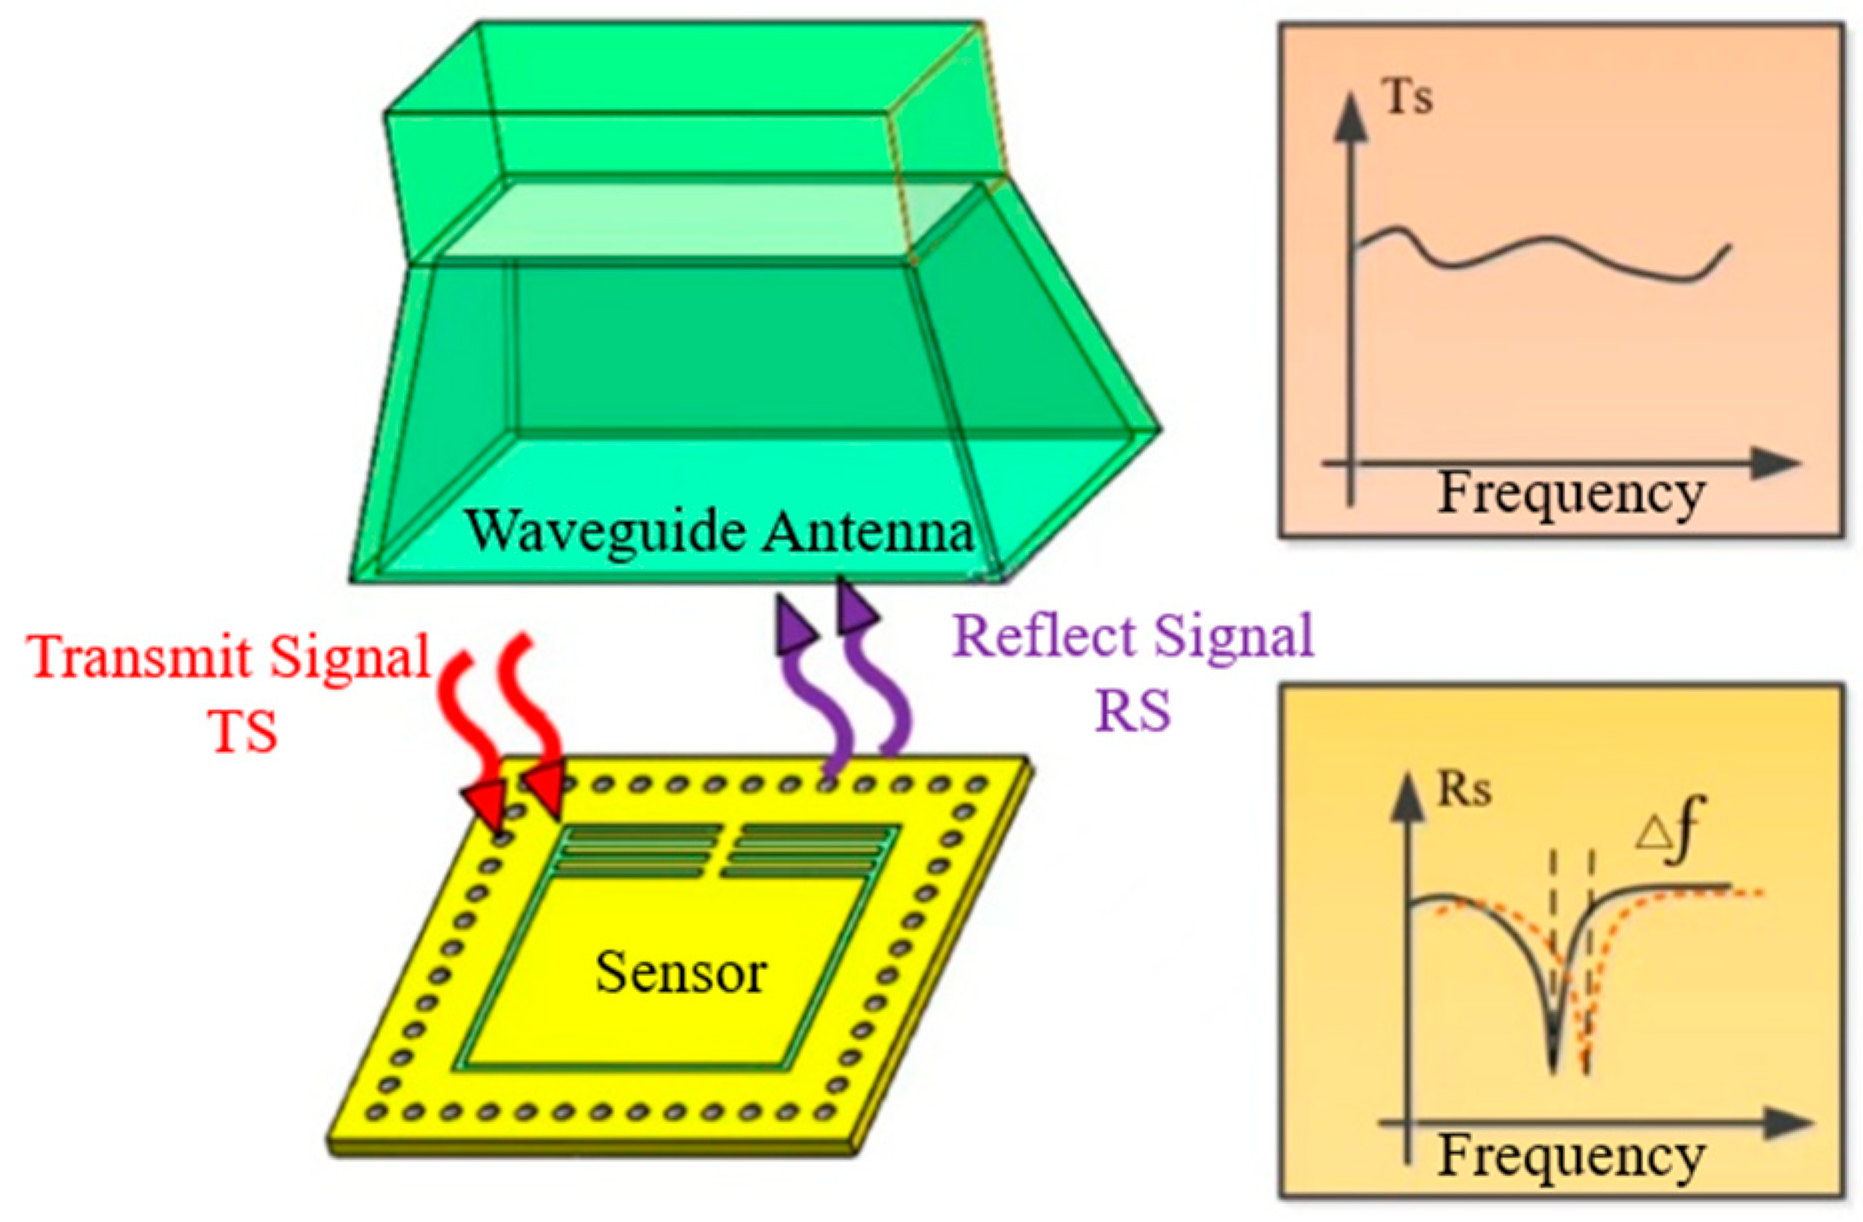
The wireless passive sensor operates on microwave scattering. As the interrogation antenna emits a broadband signal, non-resonant frequencies are directly reflected. In this process, if the signal at the sensor’s intrinsic resonance excites standing waves and dissipates energy, a dip in reflection is produced. The resonant frequency obtained from the return loss (S11) curve shifts with environmental changes as illustrated in Figure 1. In the figure, Ts and Rs are the transmit signal and reflect signal respectively, and Δ f represents the resonant frequency. The complementary split-ring resonator exhibits negative permittivity and strong electromagnetic field confinement within specific microwave bands. The proposed MG-CSRR-SIW introduces multiple concentric ring elements to enhance inter-ring coupling and field concentration. The SIW is a planar waveguide formed by two rows of metallized vias and metal layers on both sides of a dielectric substrate. The SIW maintains the propagation characteristics of a rectangular waveguide while featuring compact size, low cost, and simple fabrication. In the dominant TE10 mode, the SIW provides an efficient and stable electromagnetic coupling platform for the MG-CSRR-SIW structure.
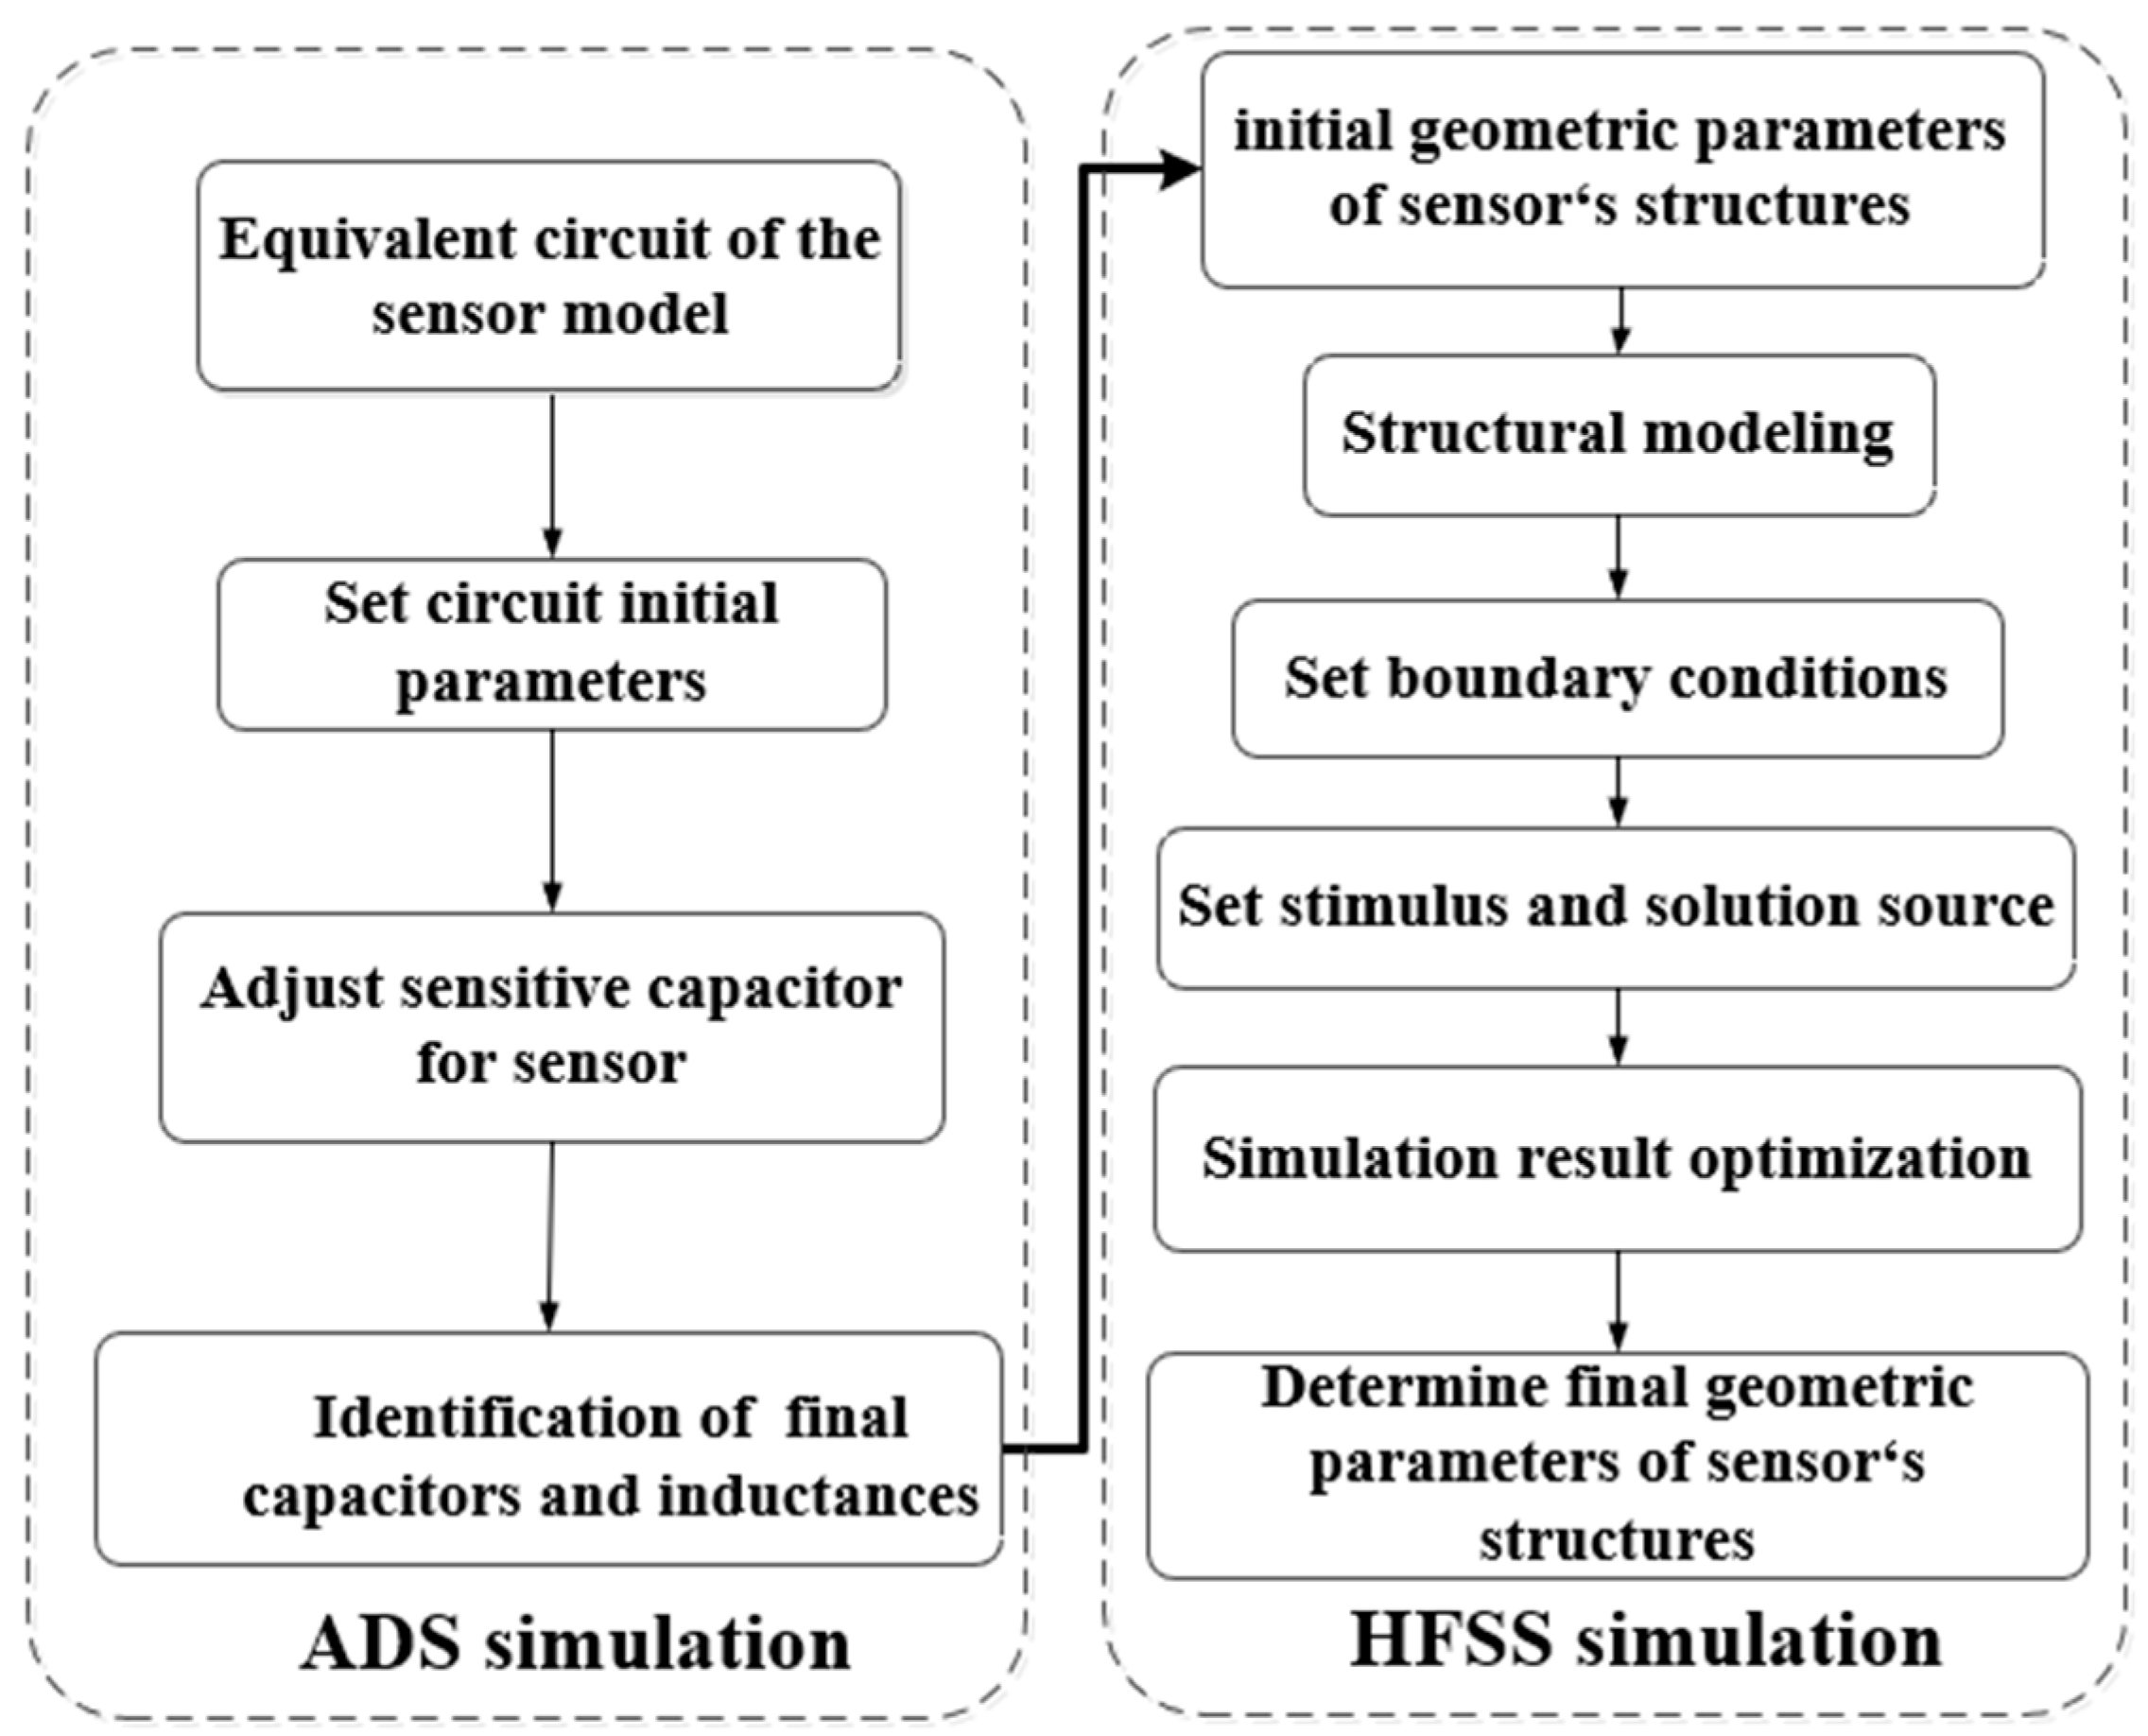
The structural design of the MG-CSRR-SIW sensor includes Advanced Design System (ADS) simulation and High Frequency Structure Simulator (HFSS) simulation, as shown in Figure 2. The first stage is engaged for simulating and verifying the equivalent circuit of the model by the analysis of the equivalent circuit and characteristic signal parameters in advanced design system (ADS2017). In this process, to achieve pressure or temperature sensing, we can adjust and optimize sensing capacitors and finally identify the electrical value of them. The initial physical parameters of inductances and capacitors can be calculated by the definition calculation of inductances and capacitors. Relying on these physical parameters, the dimensional area parameters of the MG-CSRR-SIW sensor structure can be designed initially for next optimization in HFSS. Then, aiming at the optimization objective of the S11 curve and electromagnetic characteristics for meeting the measurement of pressure or temperature in HFSS simulation, it is engaged for optimizing and determining the final dimensional parameters of sensor structure based on the initial dimensional parameters of the MG-CSRR-SIW sensor structure from ADS simulation. In this process, it undergoes structural modeling, boundary condition setting, stimulus source setting, solution value setting, simulation, result optimization, and final dimensional parameter identification. After that, we acquire the final parameters of the sensor structure and are devoted to making sensor preparations by using the HTCC procedure.

2.2. Equivalent Circuit Design of the Sensor

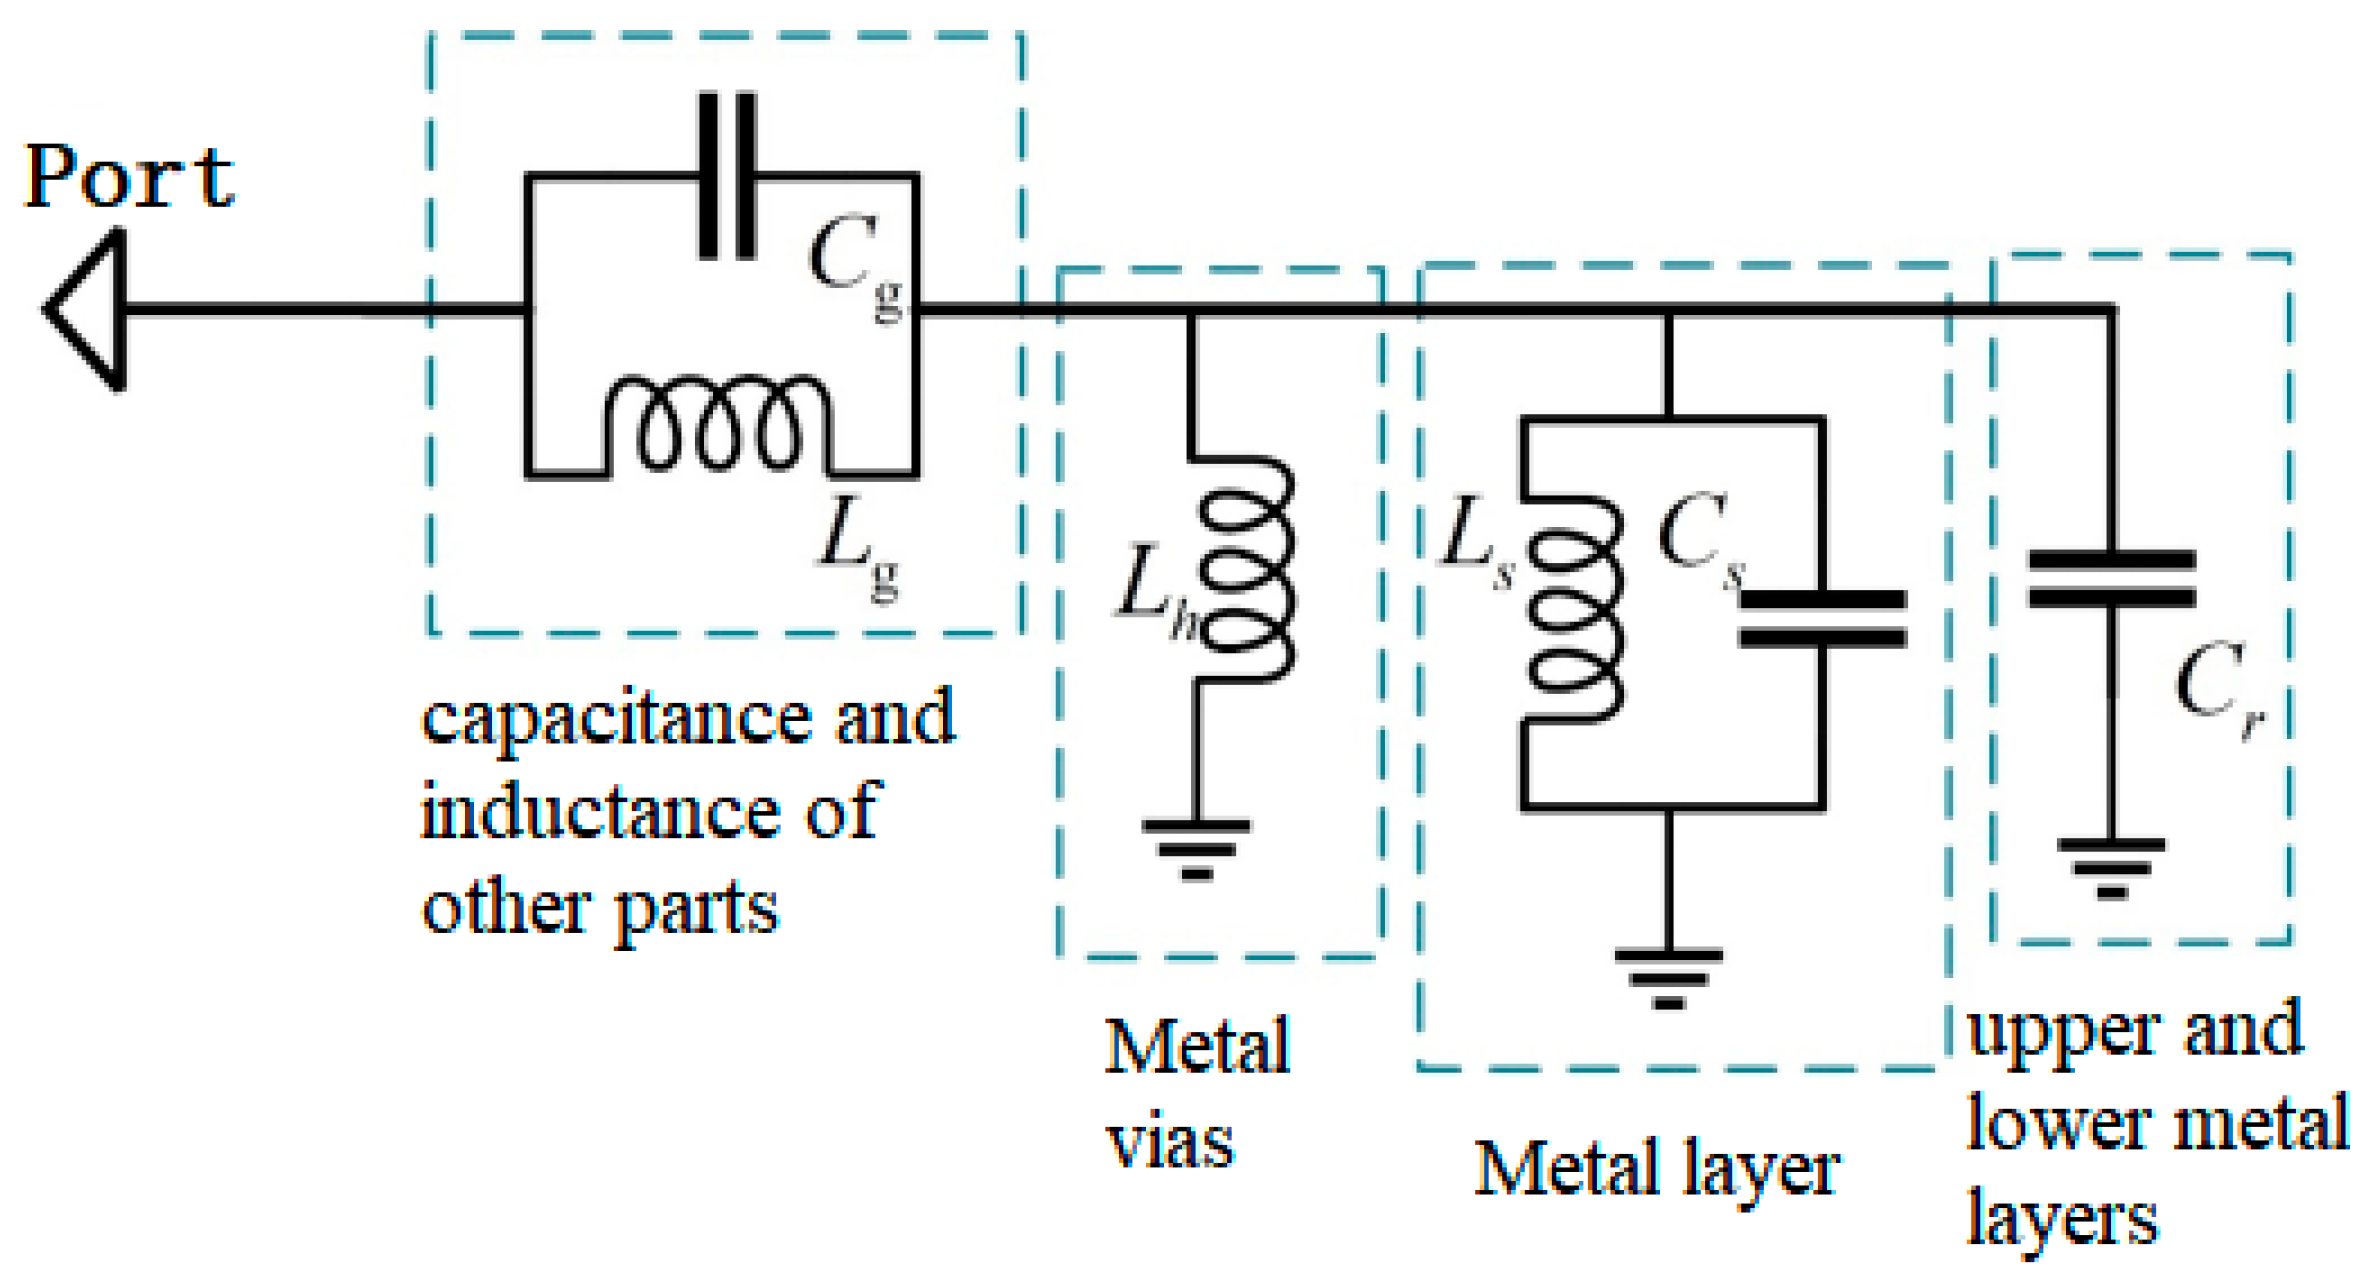
The basic structure of the proposed sensor consists of a ceramic substrate, a metal layer, and metal vias. The upper metal layer is printed with a multi-grid pattern. When an external excitation electromagnetic signal enters the surface of the metal layer vertically, an electromagnetic field is generated around the metal grid pattern, leading to resonance phenomena. The metal vias realize transmission characteristics by rectangular waveguides, preventing leakage of electromagnetic wave energy and interference from the external electromagnetic environment. The upper and lower metal layers of the multi-grid structural sensor, as well as the gaps on both sides of the metal grid pattern, are equivalent to capacitors C r and C s . The closed metal pattern and the sidewall metal vias are equivalent to inductors L s and L h . The capacitance and inductance of other parts are represented as C g and L g , respectively. Equivalent circuit of the MG-CSRR-SIW structure is shown in Figure 3.
The resonant frequency f r of the MG-CSRR-SIW sensor can be defined as
f r = 1 2 π ( L g + L h + L s L h L s ) [ C g ( C s + C r ) C g + C s + C r ]
The magnitudes of each equivalent capacitance value can be represented as
C equ = ε r ε 0 A e d
where ε 0 , ε r , A e , and d represent the vacuum permittivity, relative permittivity of the ceramic substrate, equivalent area of the capacitor electrode, and equivalent distance between the capacitor electrodes, respectively.
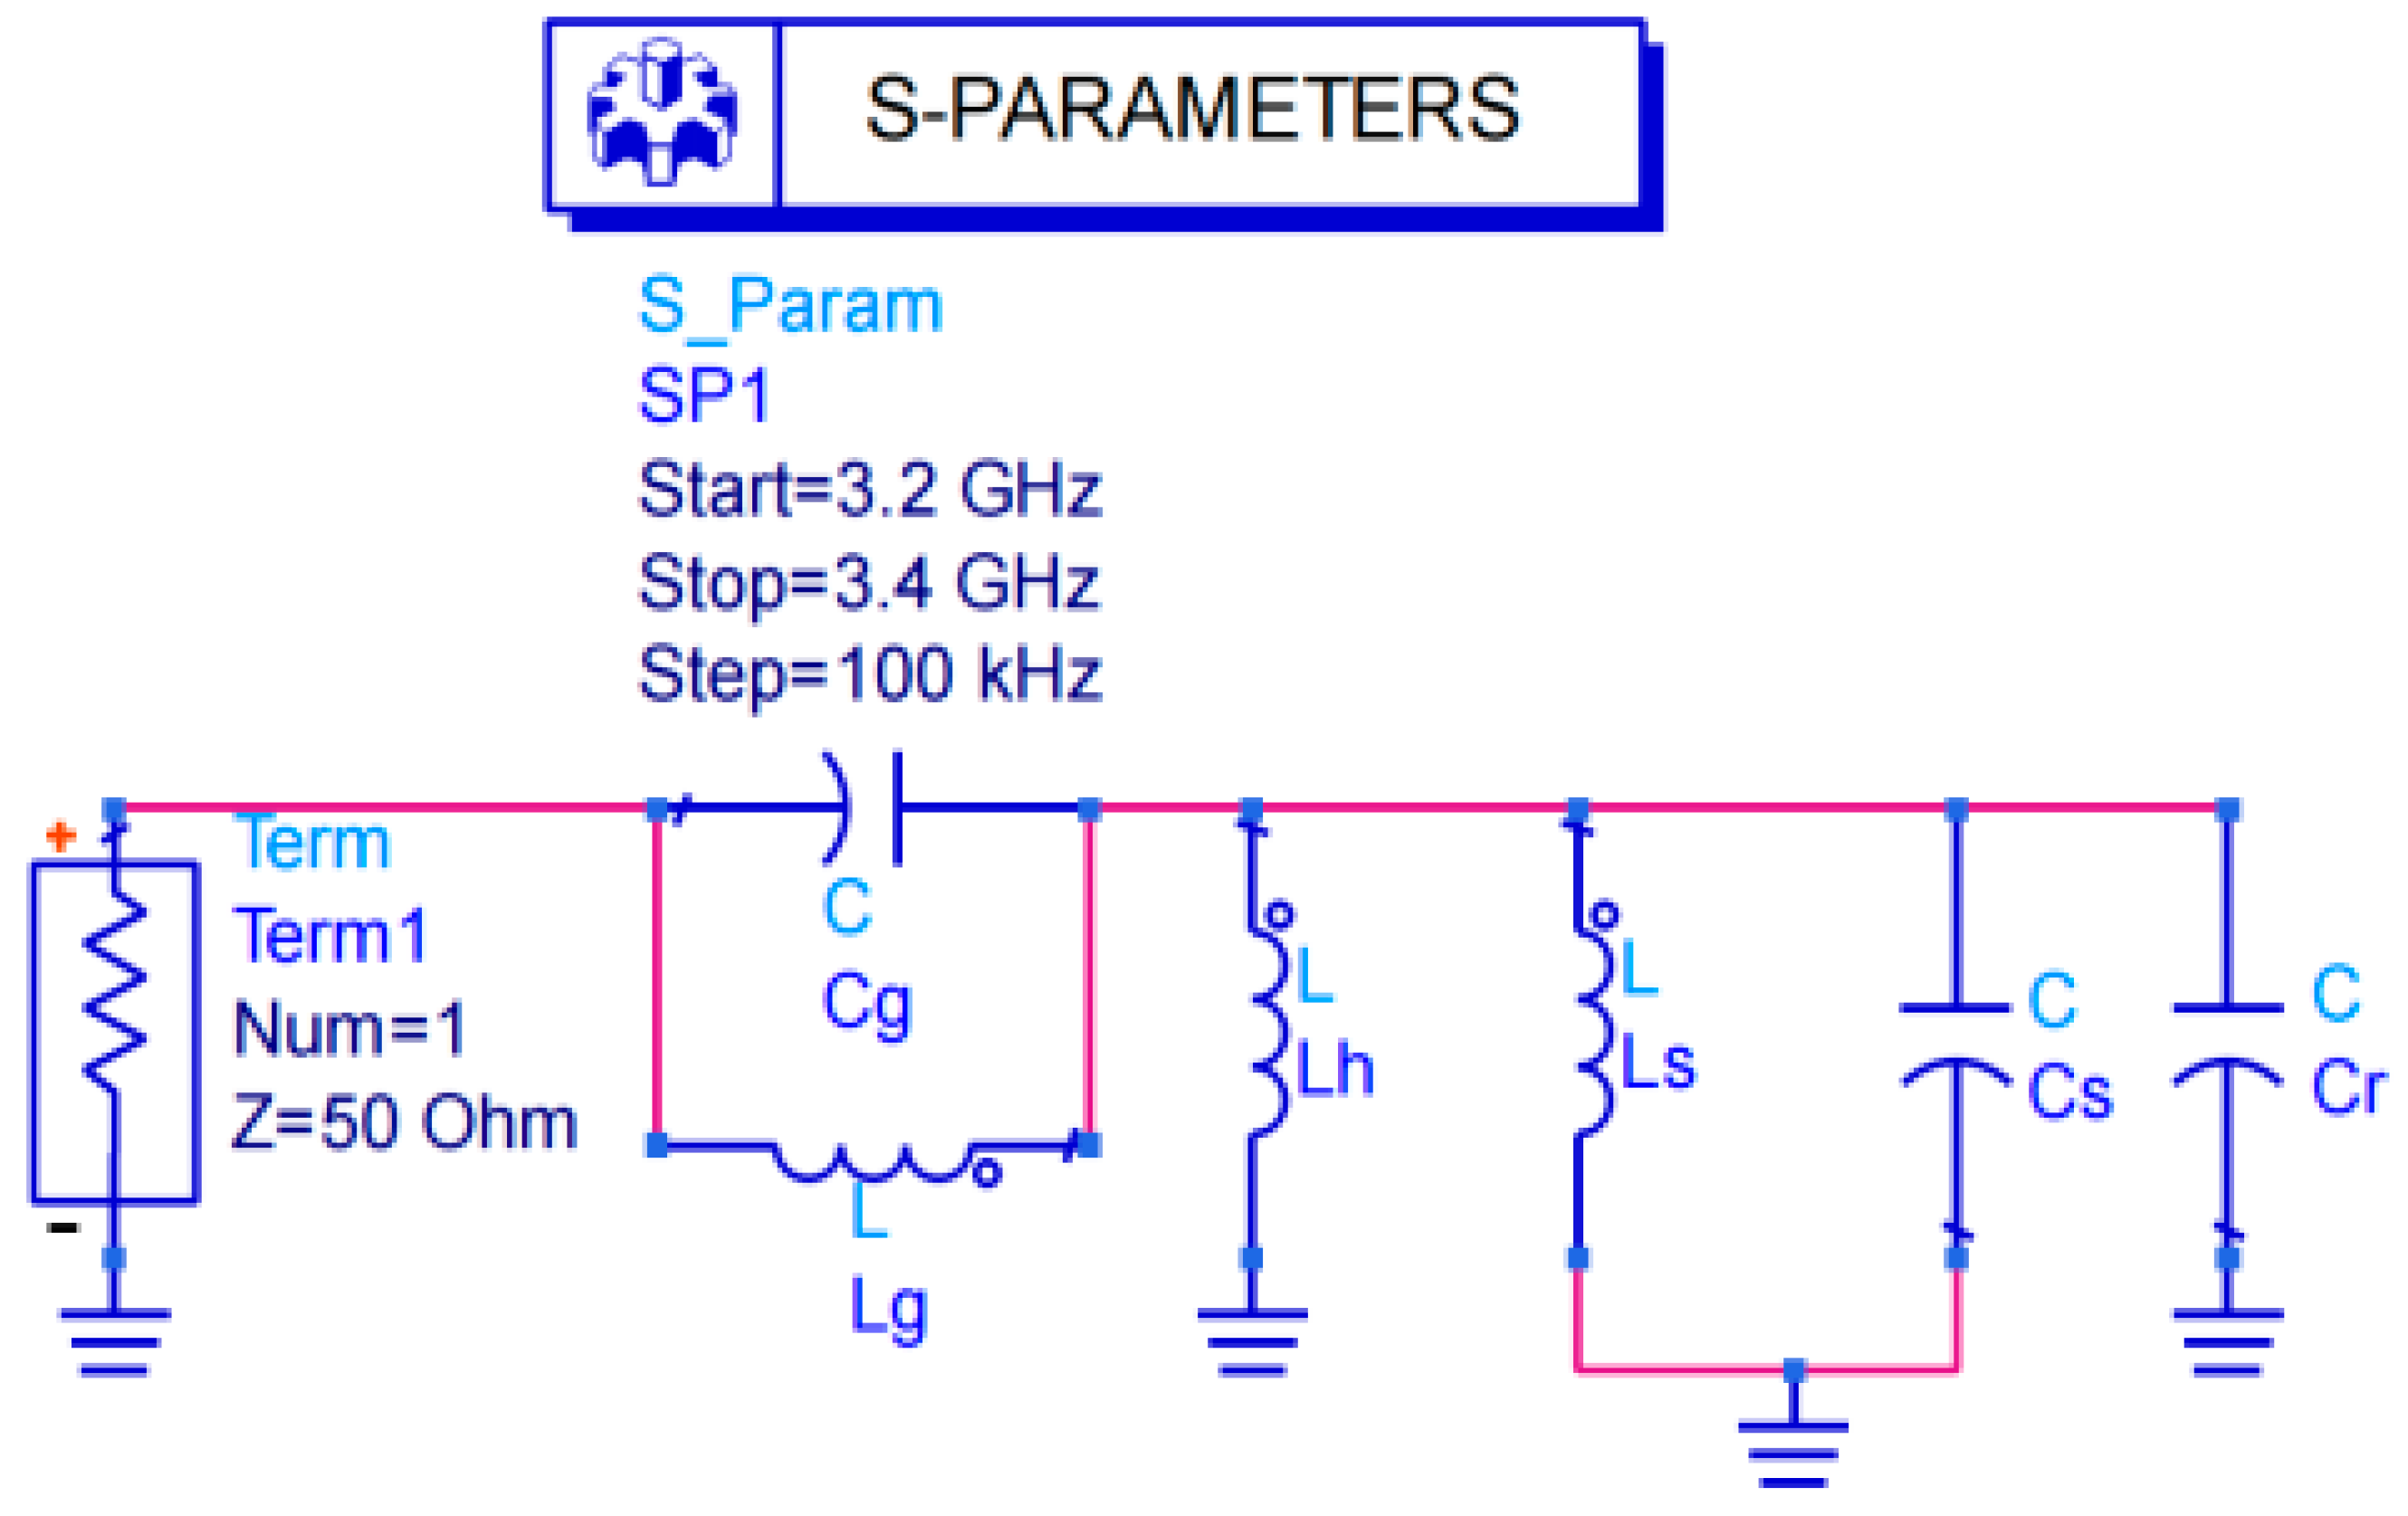
When the ambient temperature changes, the relative permittivity of the ceramic substrate also changes, leading to a shift in the resonant frequency of the sensor. A cavity structure is incorporated into the ceramic substrate. As the external pressure changes, the cavity undergoes slight deformation, altering the equivalent area and electrode spacing of the capacitor. To validate the effectiveness of equivalent circuit analysis and assess how variations in equivalent capacitance affect sensor resonance, simulation is conducted by ADS2017 software. As shown in Figure 4, the circuit is modeled and the parameter values of the circuit elements are finally identified as follows: Cg = 0.02 pF, Cs = 0.03 pF, Cr = 0.02 pF, Lg = 0.1 μH, Lh = 0.1 μH, Ls = 0.1 μH.

2.3. Equivalent Circuit Analysis of the Sensor

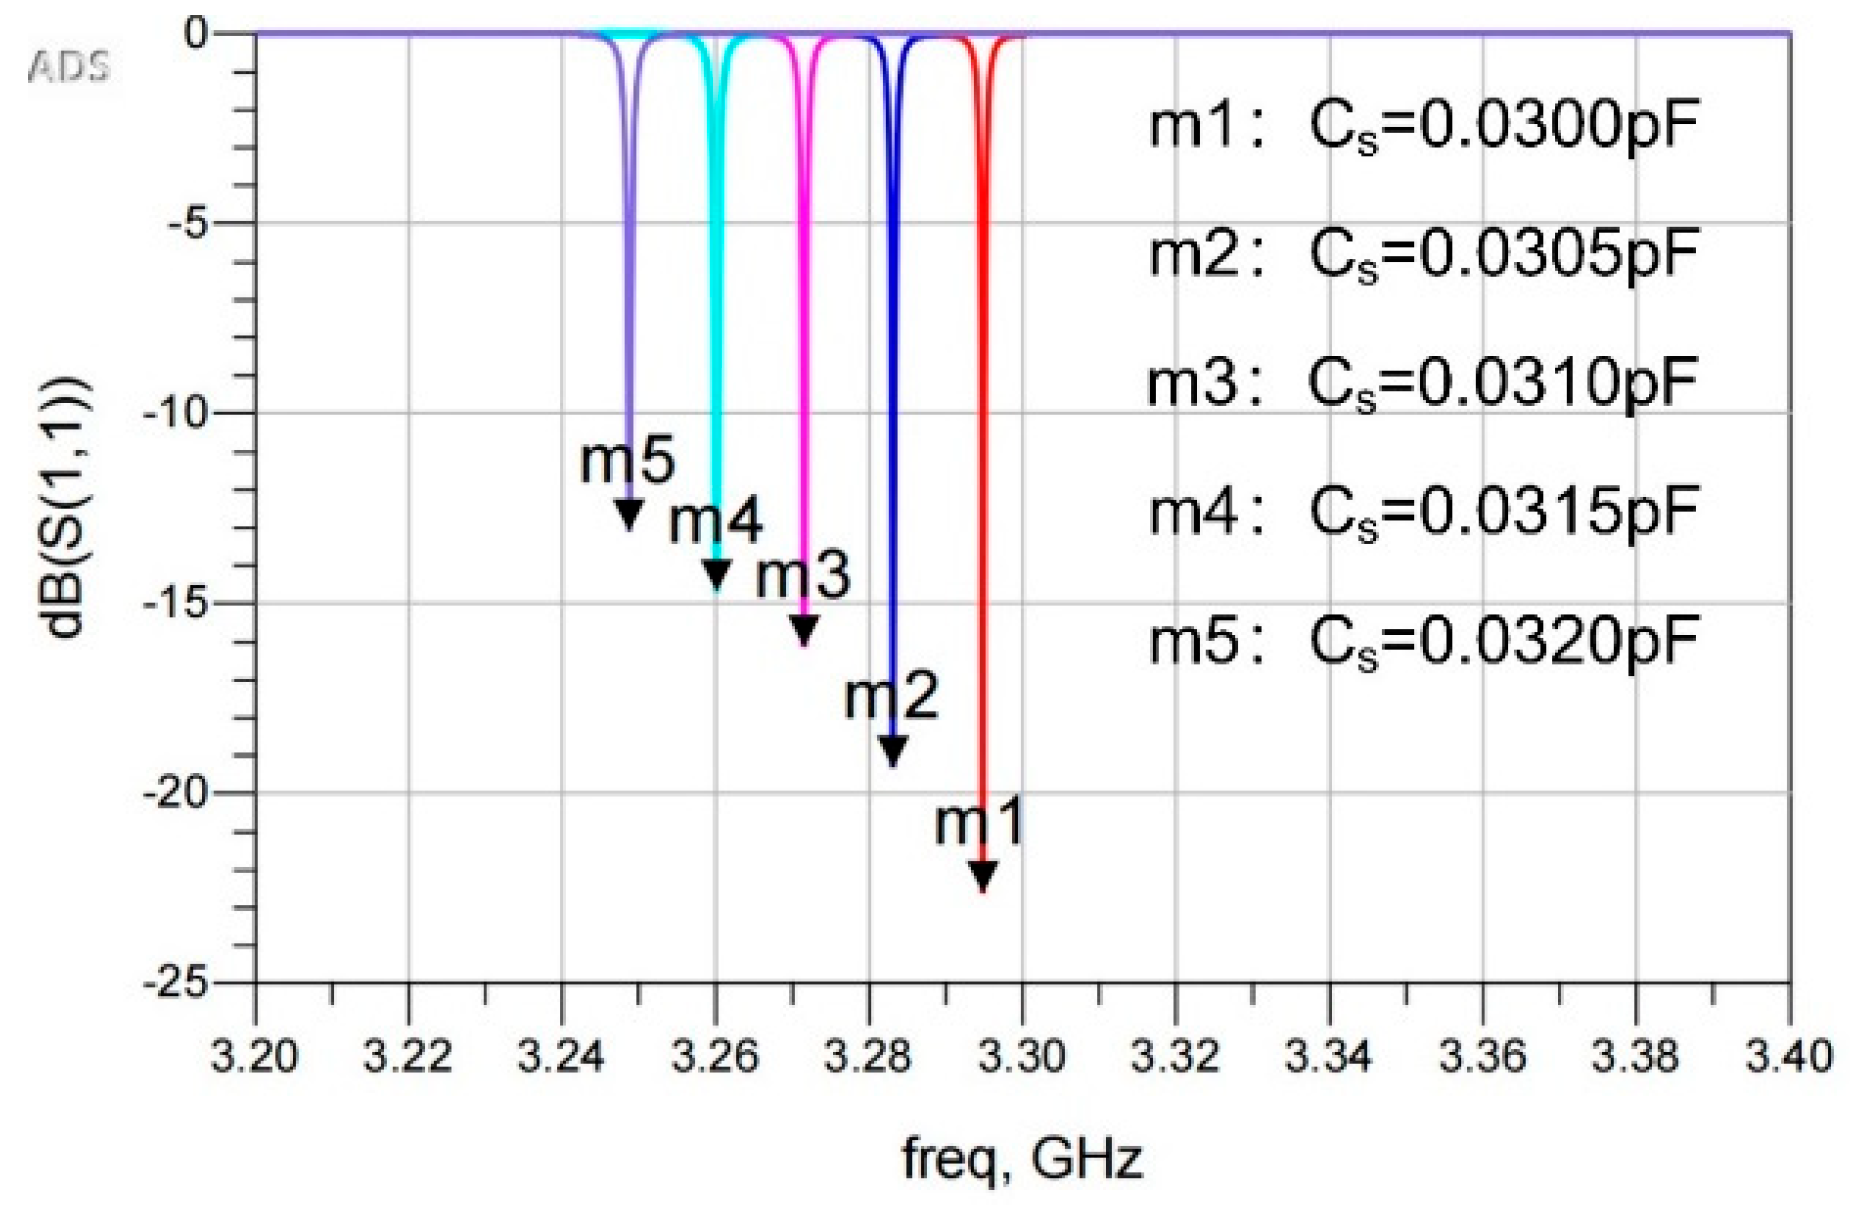
The main factors contributing to resonant frequency deviation are changes in the terms of equivalent capacitance ( C s ) and inductance ( L s ) of the metal pattern section. As the value of C s varies from 0.03 pF to 0.032 pF in increments of 0.0005 pF along with other constant parameters, simulation results are depicted in Figure 5. As the capacitance C s increases, the resonant frequency gradually decreases from 3.295 GHz to 3.249 GHz, with relatively consistent magnitudes of frequency deviation observed across each increment of C s . This indicates that changes in capacitance cause resonant frequency shifts, and a stable relationship exists between them.
Simulation results show that variations in equivalent capacitance and inductance cause consistent and predictable shifts in the resonant frequency. This principle can be applied in sensor design. For example, in temperature sensing, changes in the dielectric constant of the ceramic substrate affect the equivalent capacitance, resulting in resonant frequency shifts. By establishing a quantitative relationship between temperature and frequency shift, temperature can be measured. Similarly, in pressure sensing, incorporating a cavity in the substrate allows pressure-induced deformations to alter the capacitance structure, shifting the resonant frequency. Quantifying this shift enables pressure detection.

3. Design and Simulation Analysis of the MG-CSRR-SIW Temperature and Pressure Sensor

3.1. The Initial Geometric Parameter Determination of Sensor Structure Based on the ADS Simulation

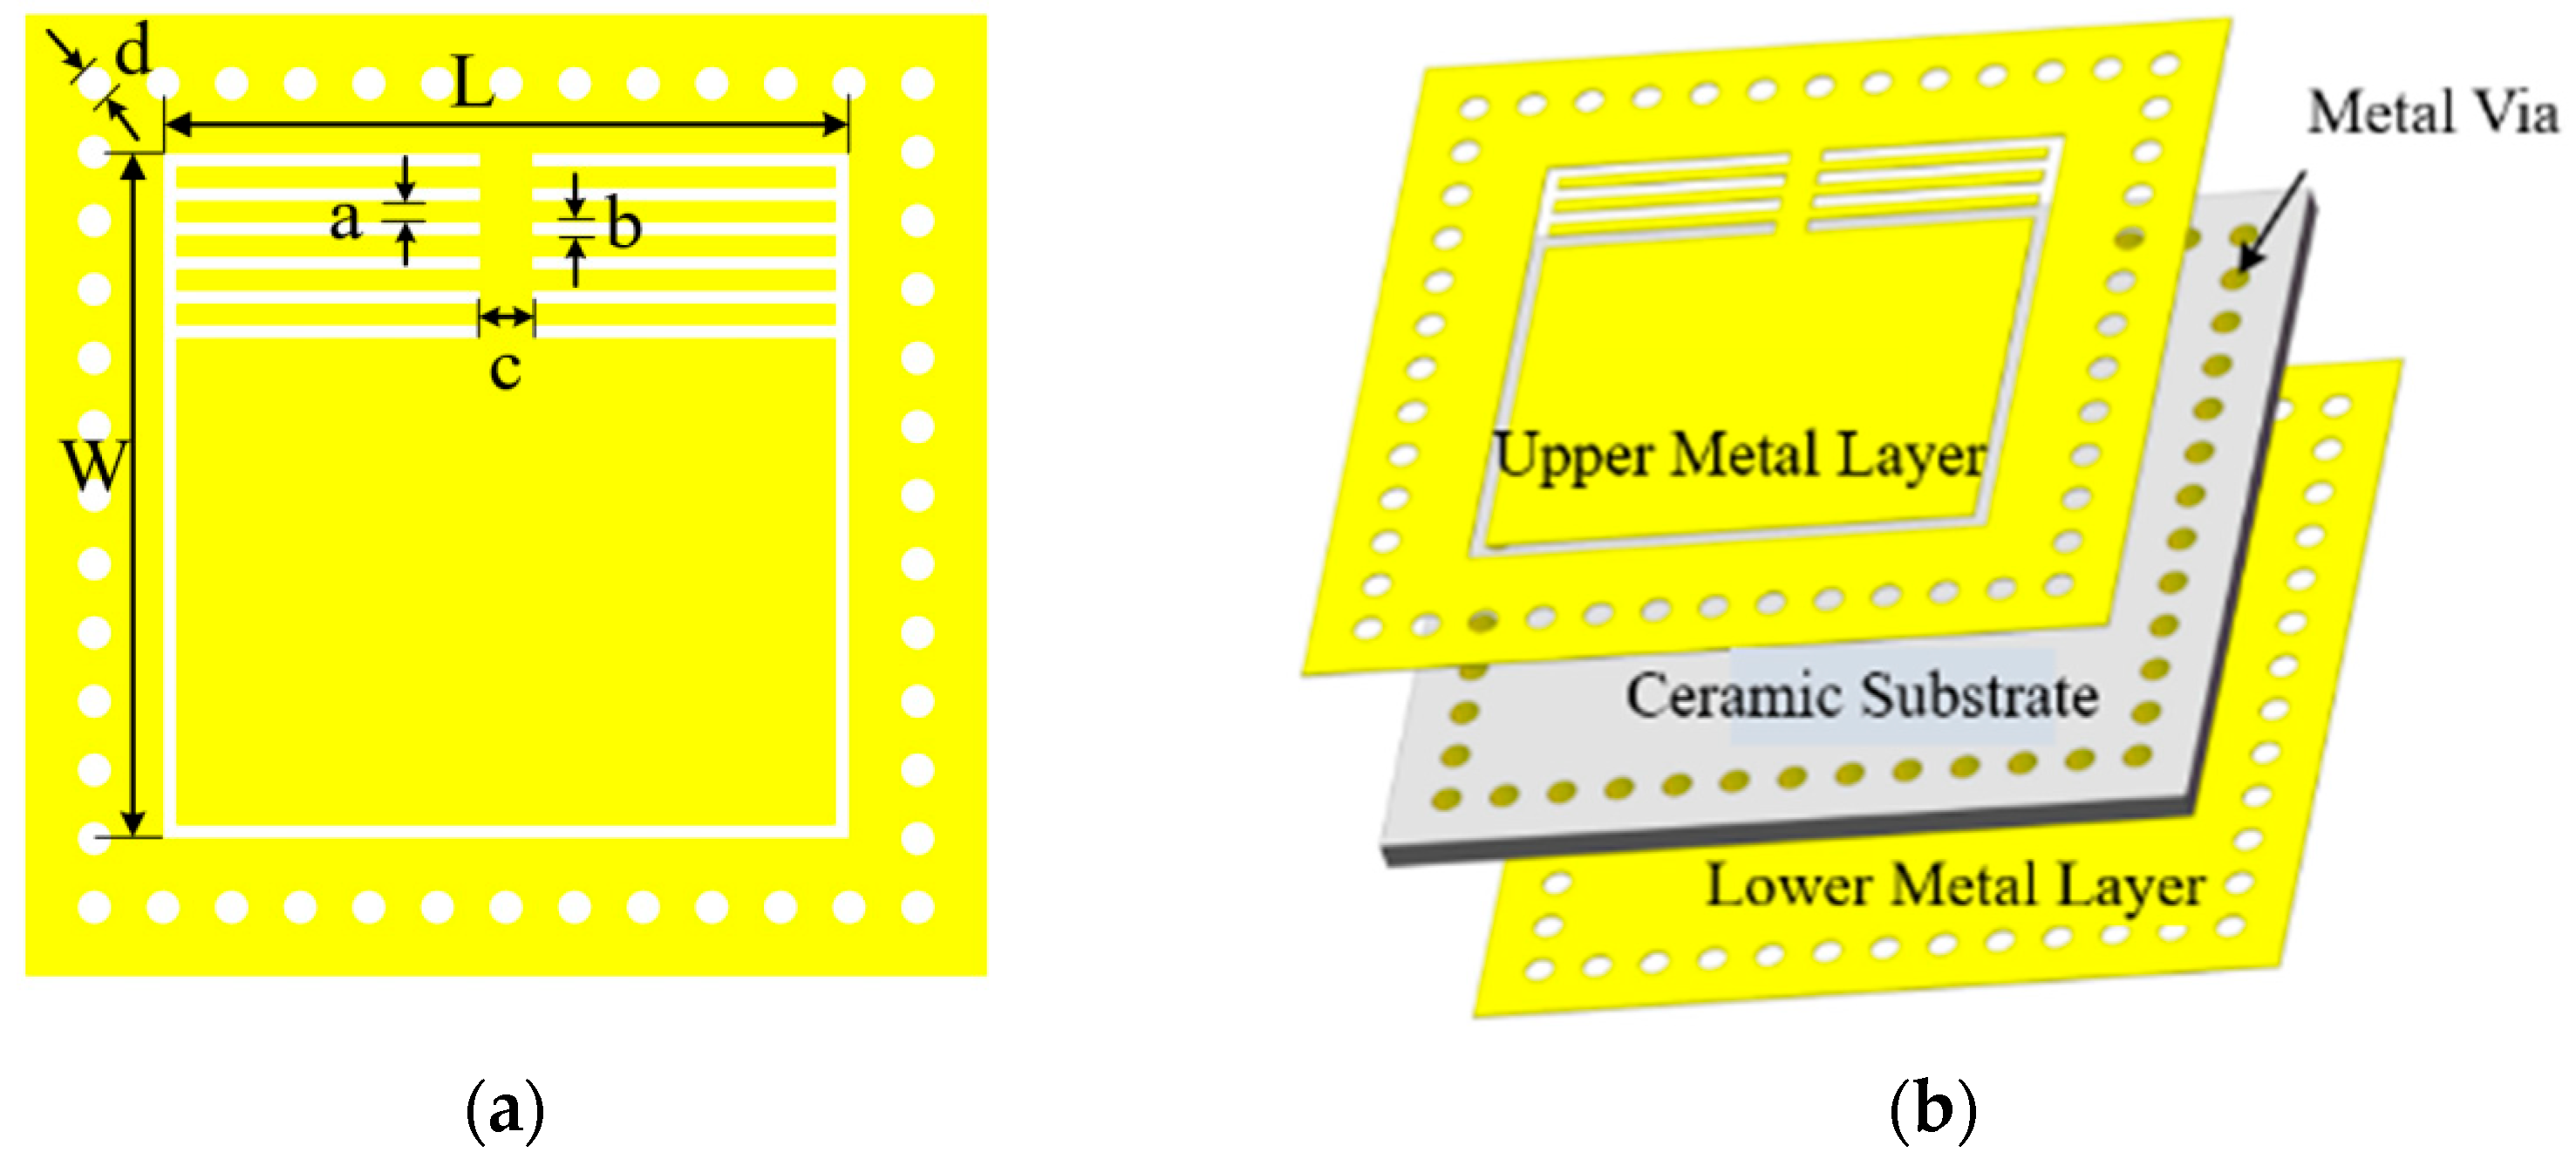
The design of the MG-CSRR-SIW sensor structure is shown in Figure 6. It consists of a ceramic substrate, a metal layer, and metal vias. The upper metal layer is printed with an MG-CSRR-SIW pattern. As an external excitation electromagnetic signal enters the surface of the metal layer vertically, an electromagnetic field is generated around the metal grid pattern, leading to resonance phenomena. The metal vias realize transmission characteristics by rectangular waveguides, preventing leakage of electromagnetic wave energy and interference from the external electromagnetic environment. The metal layer structure parameters on the sensor include the diameter of the metal via ( d ), the total length of the grid ( L ), the total width of the grid ( W ), the gap between the grids ( a ), the width of the grid ( b ), and the distance between the grids on both sides ( c ).
The substrate material selection is essential for detecting temperature and pressure parameters in high-temperature environments. In general, the substrate material should have the characteristics of high melting point, good insulation properties, stable mechanical strength at elevated temperatures, and certain thermal conductivity. Furthermore, the cost of materials, manufacturing complexity, and availability should be also considered. Both zirconia and silicon carbide ceramic substrates exhibit advantages such as high hardness, high melting point, heat resistance, and chemical stability. However, their relatively high costs and susceptibility to alkaline corrosion remain difficult challenges to overcome. Alumina and silicon nitride ceramic substrates also demonstrate excellent performance under high-temperature conditions, but they face issues of high cost and processing difficulties. Compared to other ceramic materials, toughened ceramics offer superior toughness and crack resistance, though they sacrifice some hardness and high-temperature performance, along with relatively higher costs. As a crystalline material, sapphire maintains stable performance under high temperatures and boasts good transparency, and possesses high hardness, making it widely used in optical and electronic fields. However, its high price and significant brittleness limit its application scope and development. As an inorganic non-metallic material, alumina ceramic exhibits an excellent balance of all properties and factors, which is an ideal choice for the substrate. The purity of alumina ceramics can be divided into 99%, 96%, and 92%. Of these, 99% alumina contains fewer other oxides and impurities, resulting in more stable performance, higher hardness, and better corrosion resistance.
The alumina raw porcelain tiles with a fixed thickness of 100 μm are produced by the manufacturer. Ten layers of these green tiles stacked contribute to a final substrate thickness of 1 mm after HTCC technology according to the simulation of Section 3.2 and experiments. Tungsten is selected for the upper and lower metal layers and metal vias with a metal layer thickness of 50 μm.
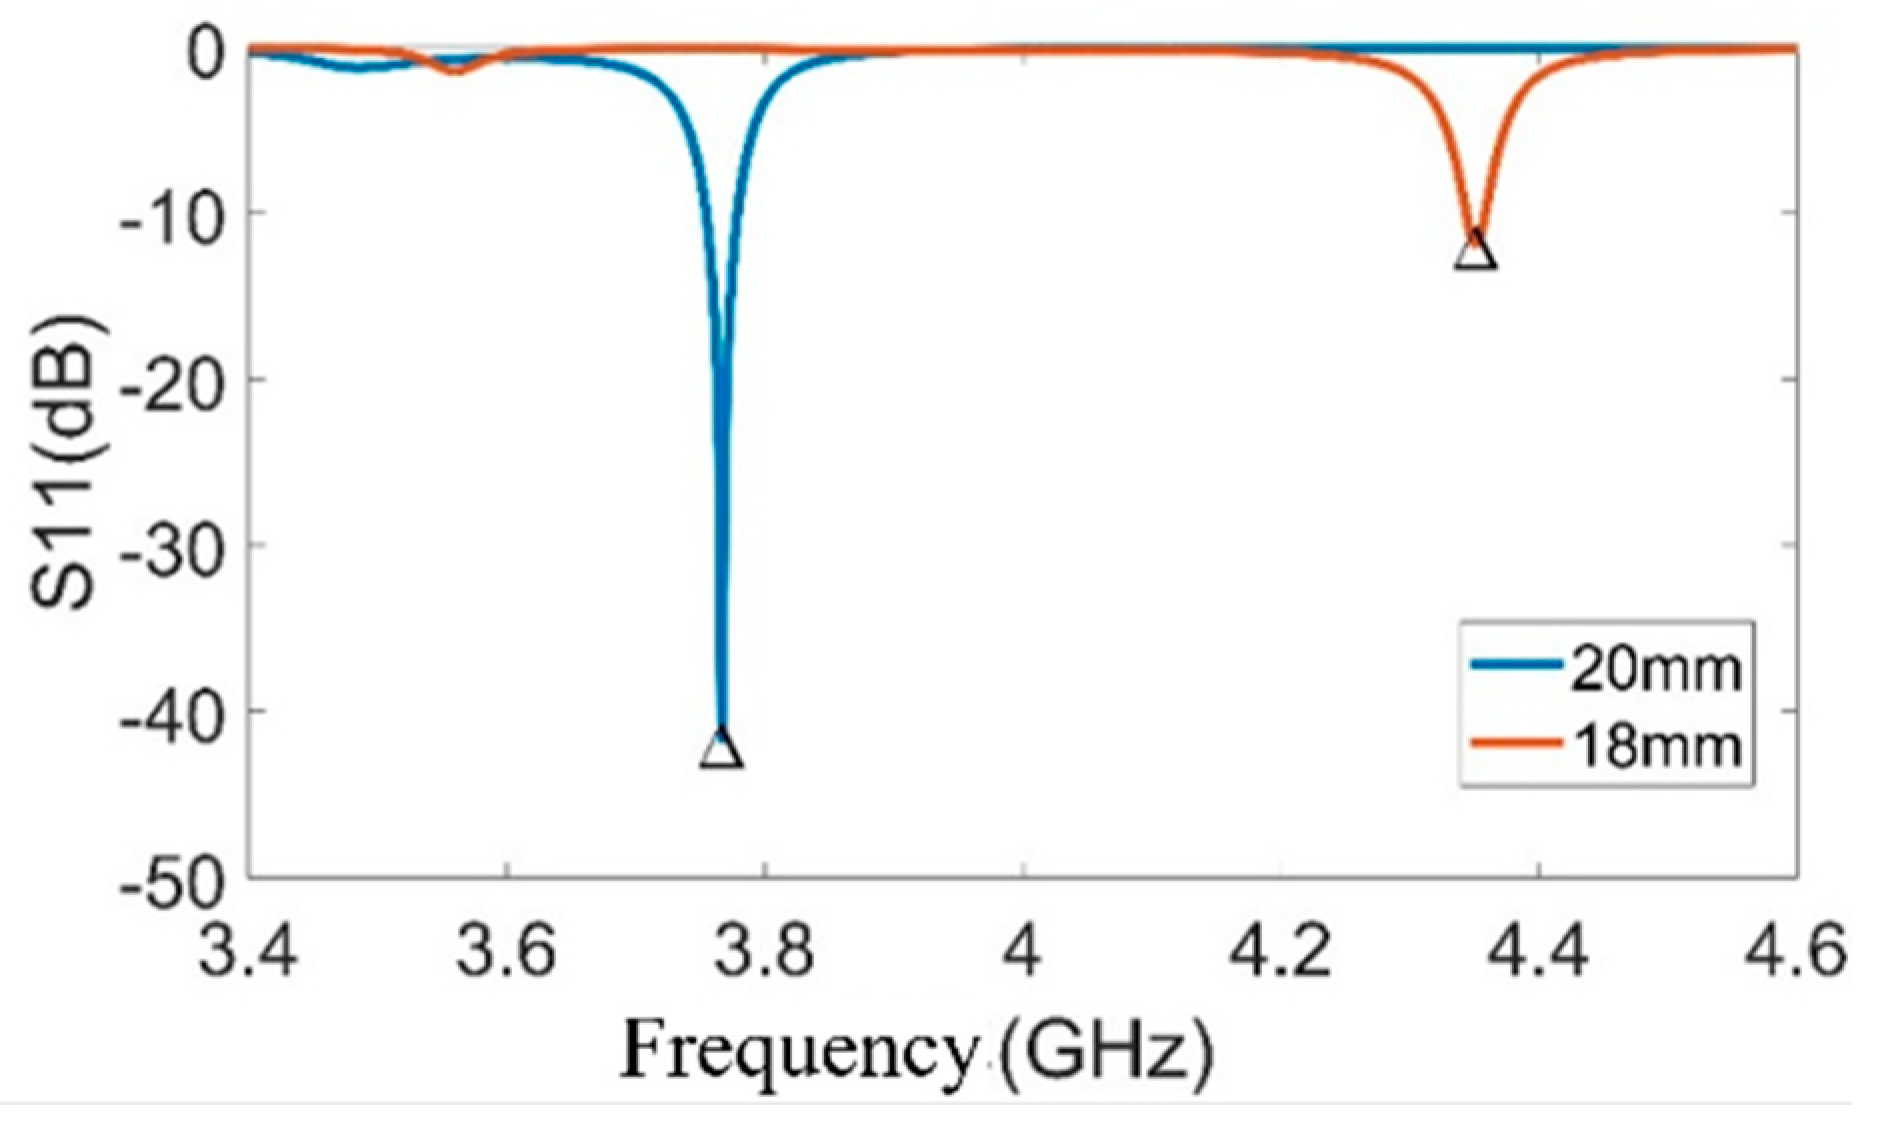
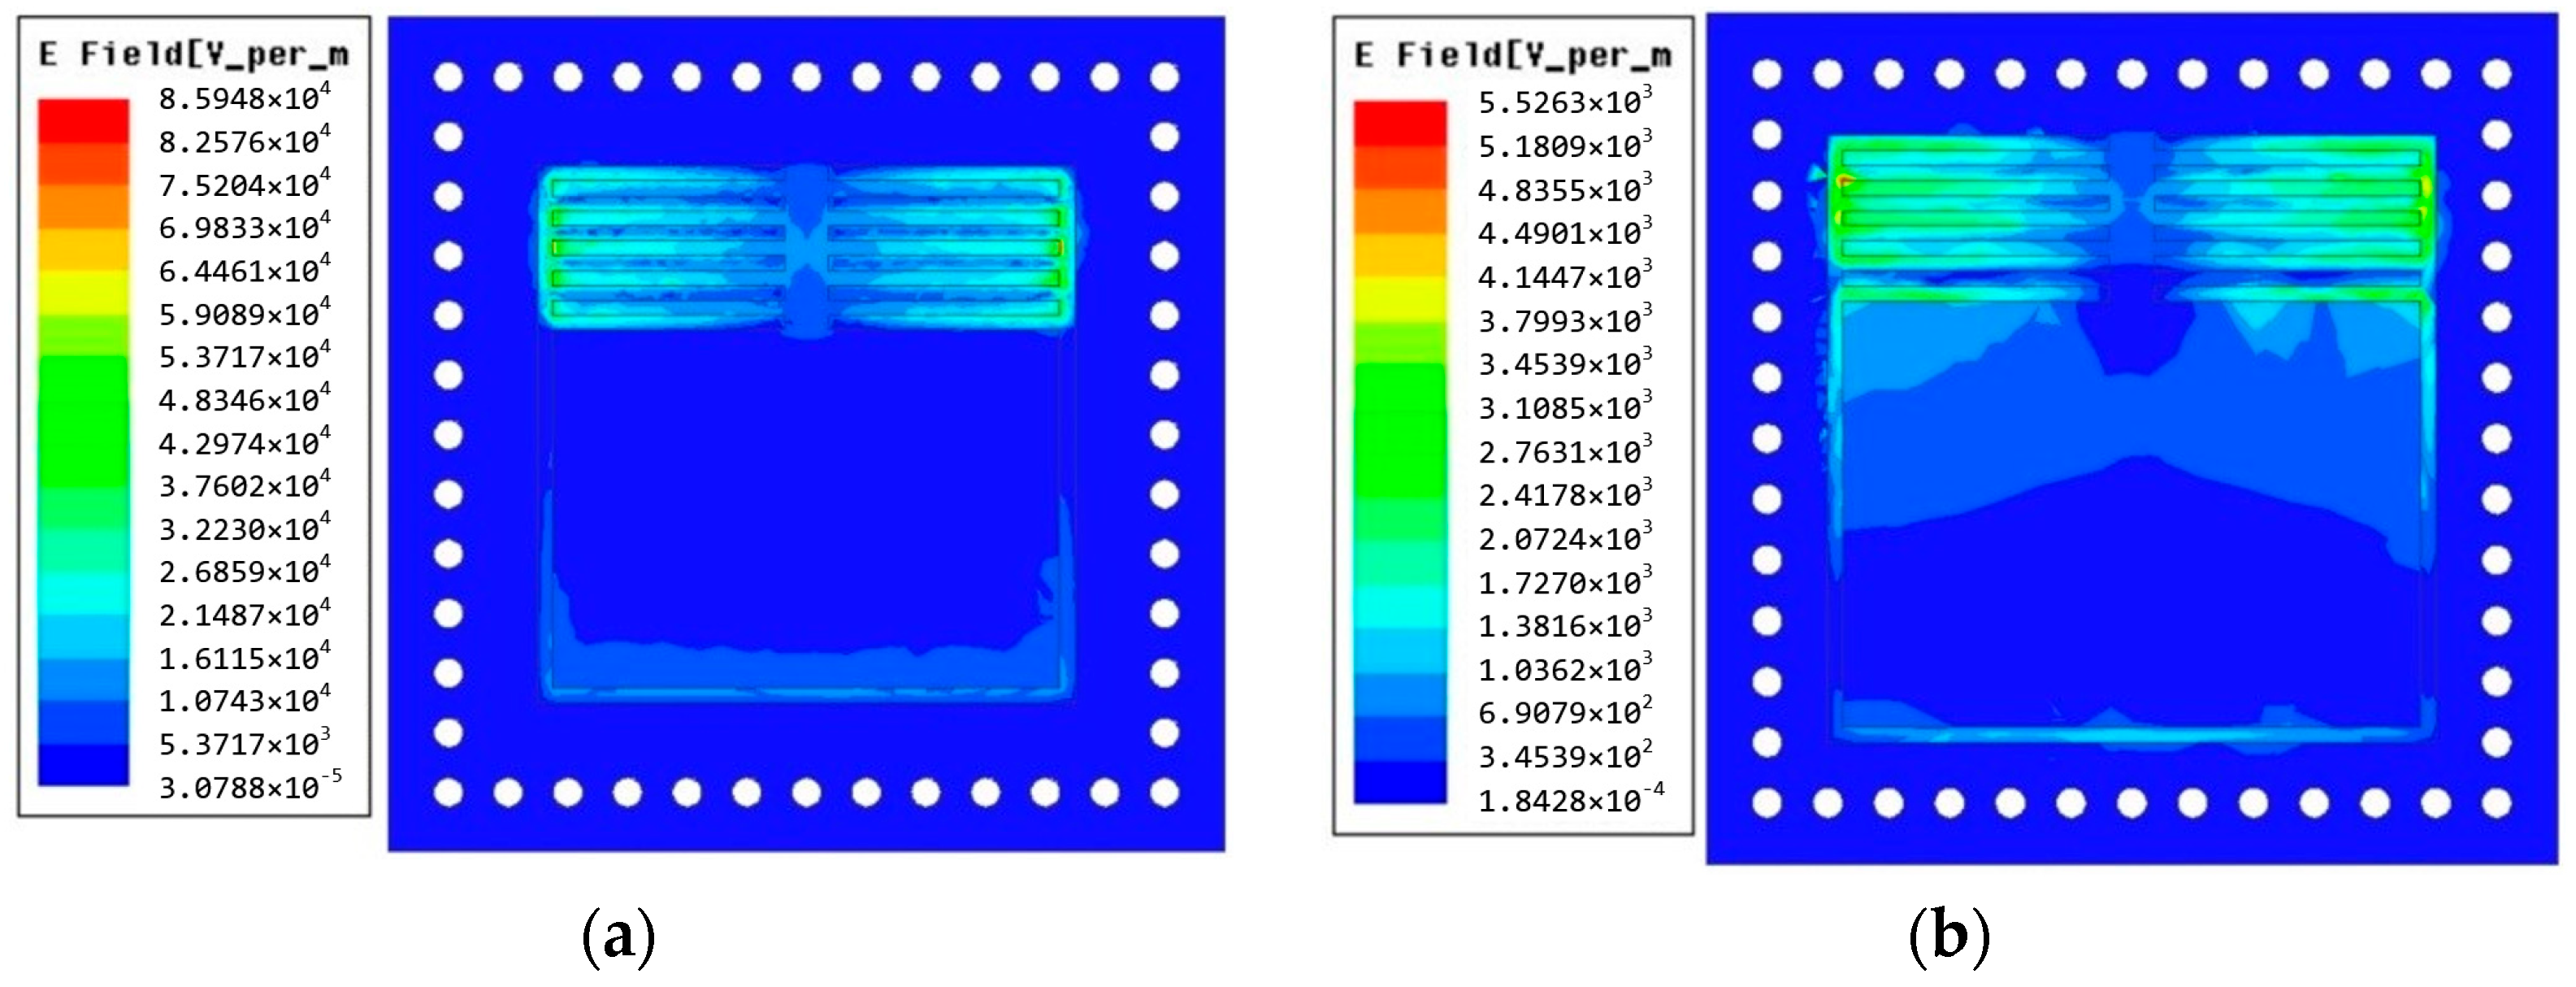
To initiate the parameters of the sensor, we firstly investigate the S11 curves of sensors with different grid numbers, grid gaps, grid widths, and grid distances on both sides, respectively. Finally, we identify initial parameters for the sensor as 6 grid lines, a 0.5 mm grid gap, a 0.5 mm grid width, and a 1.5 mm distance between grids on both sides. To differentiate the reflection coefficient curves of the temperature and pressure sensors when both are operating simultaneously, the resonant frequencies of the two sensors are adjusted by changing the total length and width of the grid structure. This adjustment enables the distinction between the temperature and pressure sensors. When the total length and width are 20 mm and 18 mm, respectively, the reflection coefficient (S11) curves and electric field distribution of the two sensors are as shown in Figure 7 and Figure 8. The cavity structure is placed directly below the heads of the grids to achieve a larger resonant frequency shift.

3.2. The Influence of Temperature on the Resonant Frequency of the Sensor

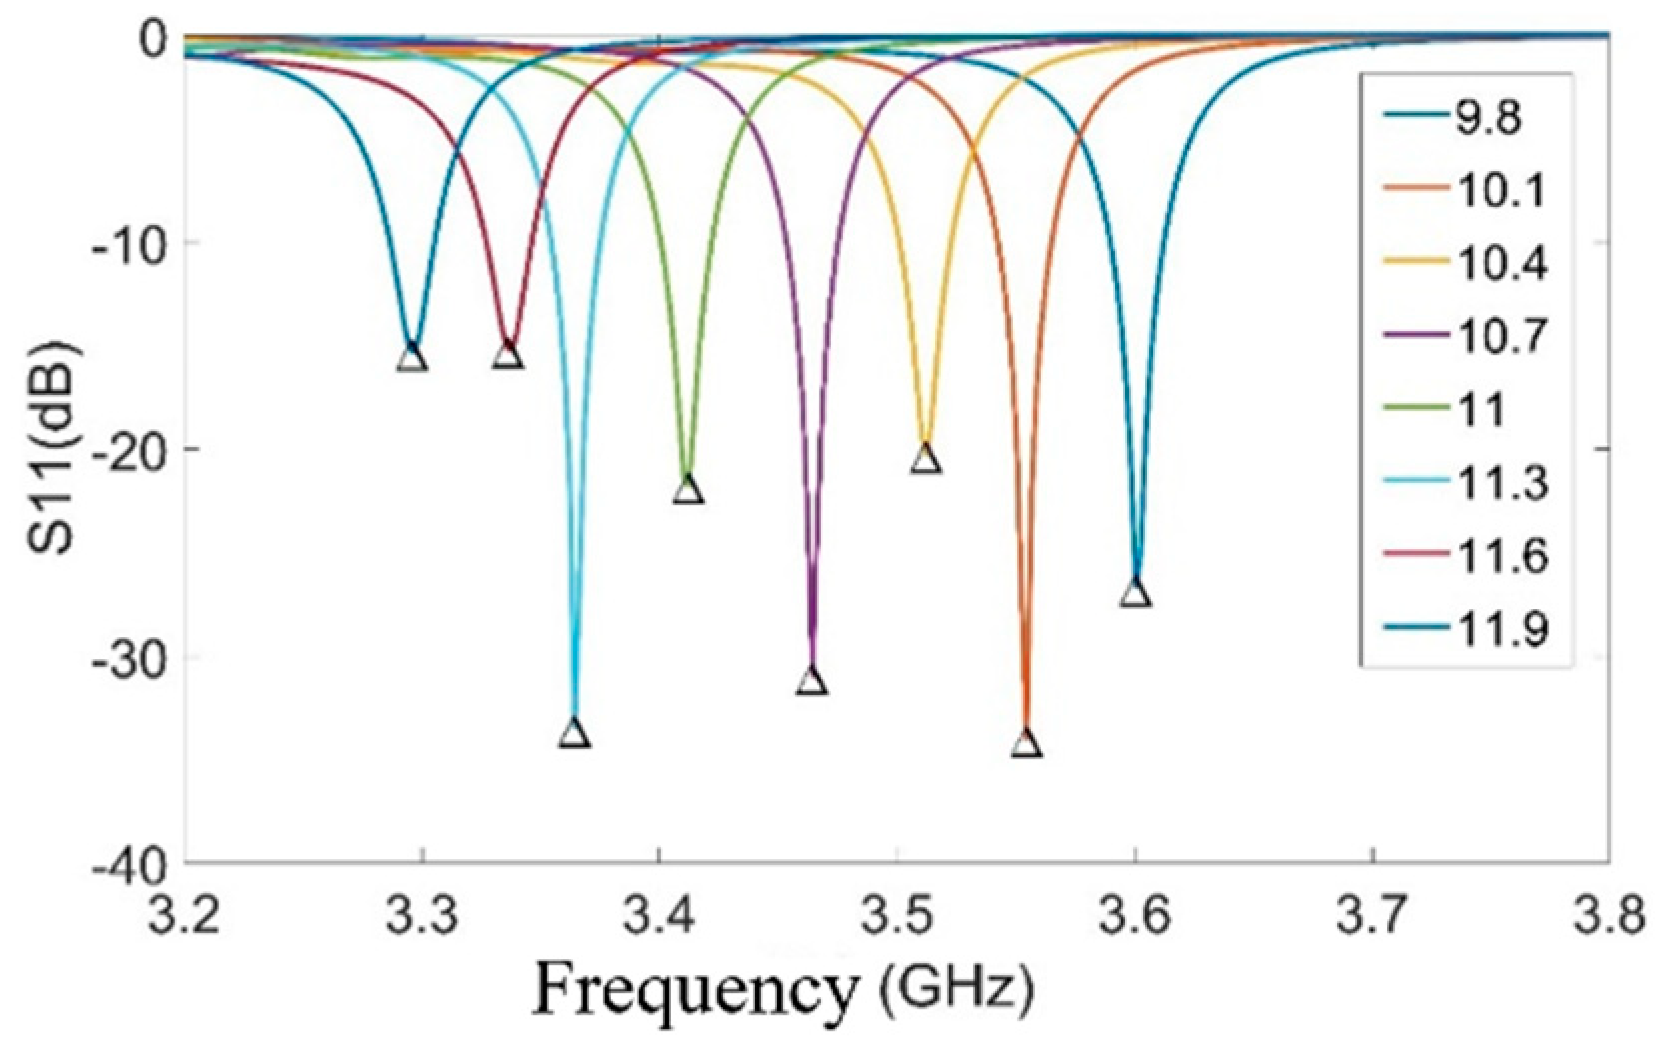
Temperature variations can significantly influence the properties of the substrate material, with thermal expansion potentially causing deformation and altering the material’s dielectric constant. In this study, alumina ceramic is chosen as the substrate material, characterized by a thermal expansion coefficient of 7.7 × 10⁻⁶ °C−1. Thermal simulations performed using COMSOL 6.3 indicate that a temperature increase of 800 °C results in a volume expansion of the substrate by approximately 3 × 10⁻⁷ times, which is negligible. In the simulation, the dielectric constant is treated as a variable, ranging from 9.8 to 11.9, with a step size of 0.3. The resulting variation in the sensor’s resonant frequency is illustrated in Figure 9. As the dielectric constant increases, the sensor’s resonant frequency decreases continuously. The linearity of the dielectric constant–frequency variation curve is 96.1%, indicating a strong linear relationship between the resonant frequency shift and the dielectric constant change.
The values in the dielectric constant between the two plates in the equivalent capacitance varies as the change of temperature in the dielectric constant of the sensor ceramic substrate, ultimately leading to a change in the equivalent capacitance value. According to the above analysis, the thermal electric coupling mechanism of the sensor is shown in Figure 10. As the temperature increases, the dielectric constant of the ceramic substrate increases as the temperature does, the equivalent capacitance value in the equivalent circuit of the sensor increases, and the resonant frequency of the sensor decreases accordingly.

3.3. The Influence of Pressure on the Resonant Frequency of the Sensor

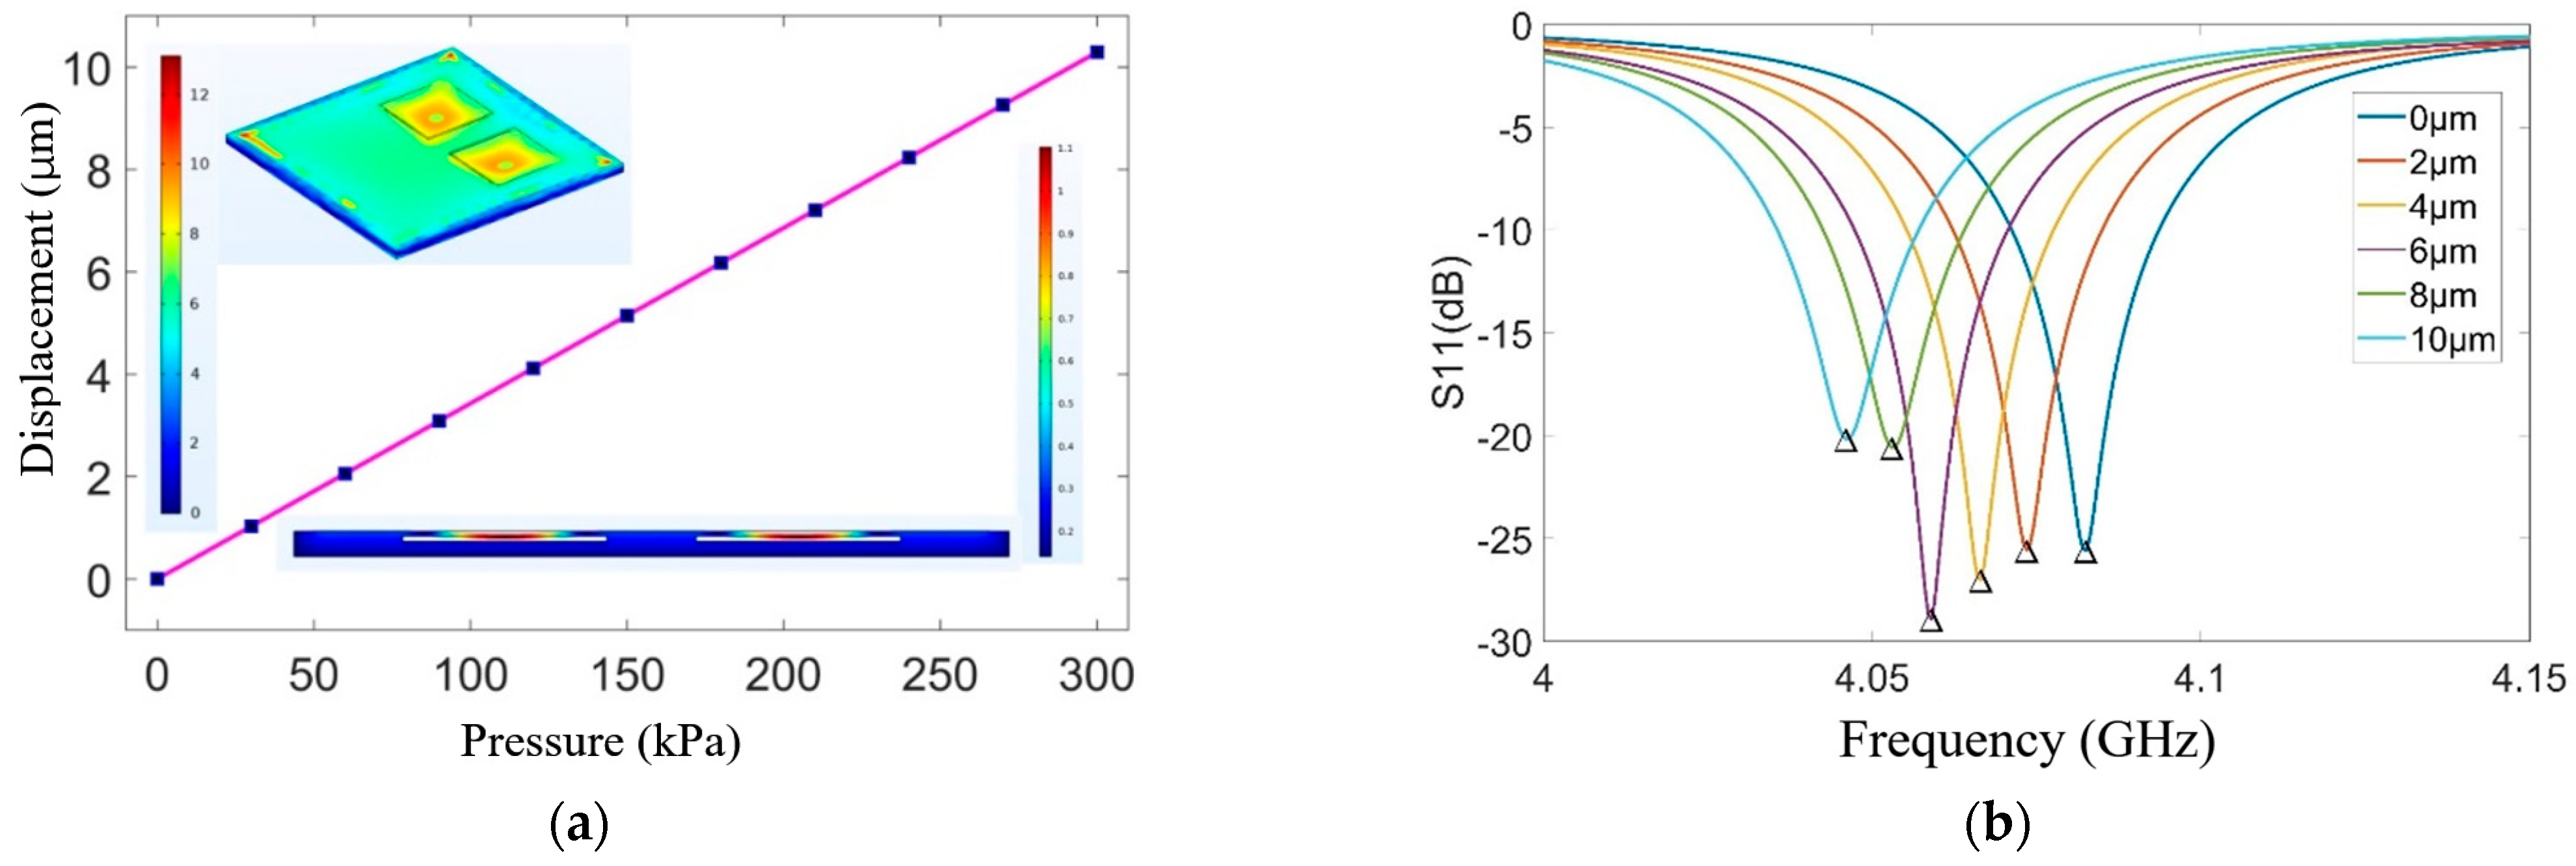
The Young’s modulus of the ceramic substrate material is 380 GPa, the Poisson’s ratio is 0.24, and the loss tangent is 0.001. The sensor structure is modeled and simulated using COMSOL 6.3, with a uniform pressure applied to the upper surface. The relationship between the deformation of the cavity structure and the pressure variation is shown in Figure 11a.
The simulation results show a linear relationship between the deformation of the cavity structure and the surface pressure. To further investigate the relationship between pressure variation and resonant frequency shift, the deformation of the cavity structure is set as a variable in HFSS 14.0, ranging from 0 μm to 10 μm with a step size of 2 μm. The variation in the resonant frequency of the sensor is shown in Figure 11b.
As the deformation of the sensor’s cavity structure increases, its resonant frequency continuously decreases. The linearity of the deformation–frequency variation curve is 97.4%, indicating a strong linear relationship between the resonant frequency shift and the deformation of the cavity structure.
As electromagnetic waves are on the sensor for excitation, the equivalent capacitance of the sensor mainly contains two components: one is the equivalent capacitance between the grid metal strips, and the other is the equivalent capacitance between the upper and lower metal layers of the entire sensor. As the sealed cavity deforms under pressure, the distance between the upper and lower metal layers and the thickness of the air medium change, which causes a variation in the sensor’s equivalent capacitance, leading to a shift in the sensor’s resonant frequency. The change in the equivalent capacitance due to the variation in the sealed cavity, denoted as C 0 , can be expressed by the Formula (3):
C 0 = ε 0 w l h + 2 t ε s
In this formula, ε 0 and ε s represent the dielectric constant of the vacuum and the relative dielectric constant of the ceramic substrate material, respectively. l is the width of the cavity, w is the length of the cavity, h is the height of the sealed cavity, and t is the thickness of the sensitive membrane. The deformation d at the center of the sealed cavity, as a function of pressure P , can be expressed by the Formula (4):
d = 3 P × m 4 ( 1 v 2 ) 16 E · t 3
In this formula, v and E represent the Poisson’s ratio and Young’s modulus of the ceramic substrate material, respectively. When external pressure is applied, the capacitance C P of the sensor can be expressed as:
C P = C 0 2 d h + 2 t ε s tan 1 ( 2 d h + 2 t ε s )
To simplify the equation, a new coefficient δ is defined as (6):
δ = 2 d h + 2 t ε s
Therefore, the sensor capacitance can be simplified as:
C p = C 0 δ tan 1 δ C 0 ( 1 + δ 3 )
A new coefficient λ is defined as:
λ = δ 3 P = 1 3 × 2 h + 2 t ε s × 3 w 2 l 2 ( 1 v 2 ) 16 E t 3
Based on the above equations, the resonant frequency of the sensor can be expressed by the Formula (9):
f P = 1 2 π L P · C P = 1 2 π L P · C 0 ( 1 + λ 3 ) f 0 ( 1 + λ P ) 1 2
Based on the above theoretical analysis, the pressure-sensitive mechanism of the sensor is shown in Figure 12. As pressure is applied to the sensor, the thickness of the embedded sealed cavity deforms, which in turn affects the sensor’s equivalent capacitance value and ultimately results in a change in the sensor’s resonant frequency. Furthermore, the resonant frequency of the sensor is approximately linearly related to the applied external pressure, indicating that the designed structure can be used for pressure parameter measurement.

4. Wireless Passive MG-CSRR-SIW Temperature and Pressure Sensor Fabrication and Testing

4.1. Sensor Fabrication

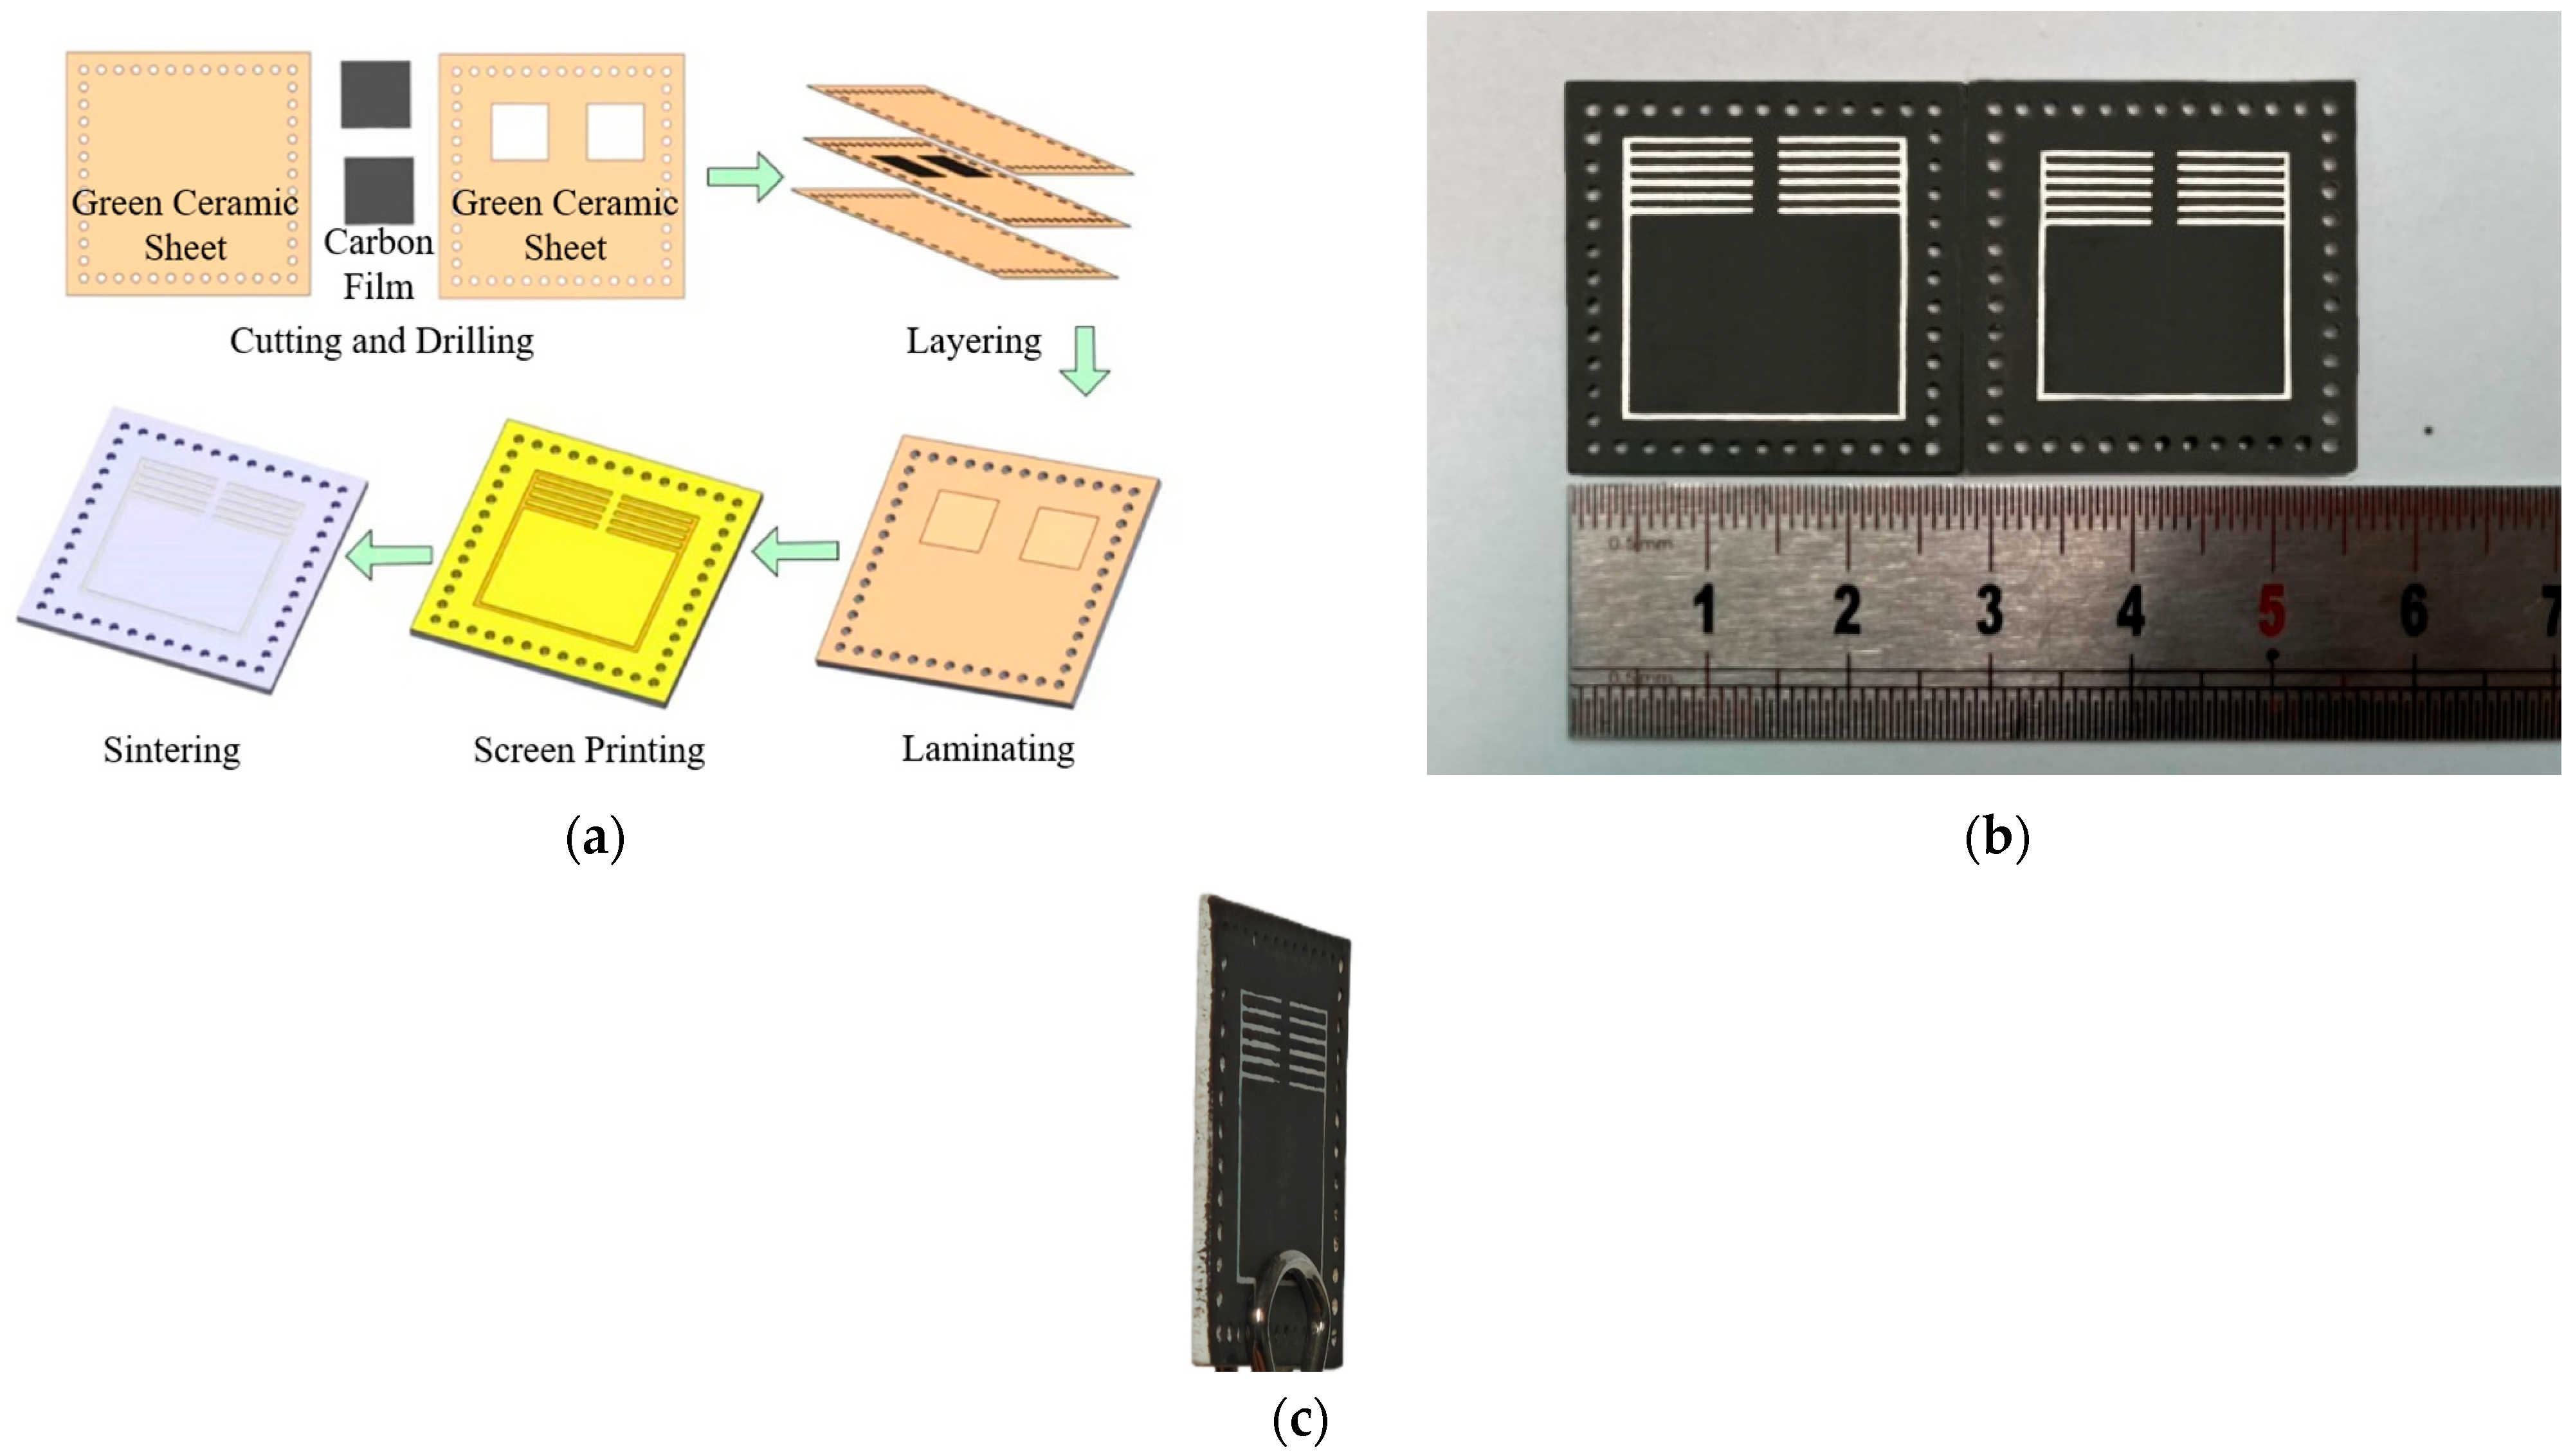
The fabrication process of the MG-CSRR-SIW temperature and pressure sensor is shown in Figure 13a. First, a laser engraving machine is used to cut and punch the green ceramic sheet according to the sensor’s size and structure. Next, a laminating machine applies pressure at 3000 psi (1 psi = 6.89 kPa) and 60 °C for 10 min to the stacked green ceramic sheets. Then, a metal pattern is printed using a screen printing machine. Finally, the sensor is sintered in a high-temperature muffle furnace. The pressure sensor contains an internal cavity structure. To prevent the sensor from collapsing during lamination and sintering, filling carbon film in the cavity structure can solve this problem. Carbon film made by high-temperature pyrolysis and carbonization of carbon with the same thickness as the raw porcelain is selected to fill the cavity structure. At room temperature, the properties of carbon are stable, and the carbon film can provide good support for the cavity structure. As high-temperature sintering is carried out, the carbon film will react with gases such as oxygen and hydrogen to generate gases such as CO2 and CH4, which overflow from the pores of the unsintered raw porcelain strip and also provide support for the cavity. The physical image of the fabricated temperature and pressure sensor is shown in Figure 13b,c.

4.2. Sensor Testing

4.2.1. Temperature Testing

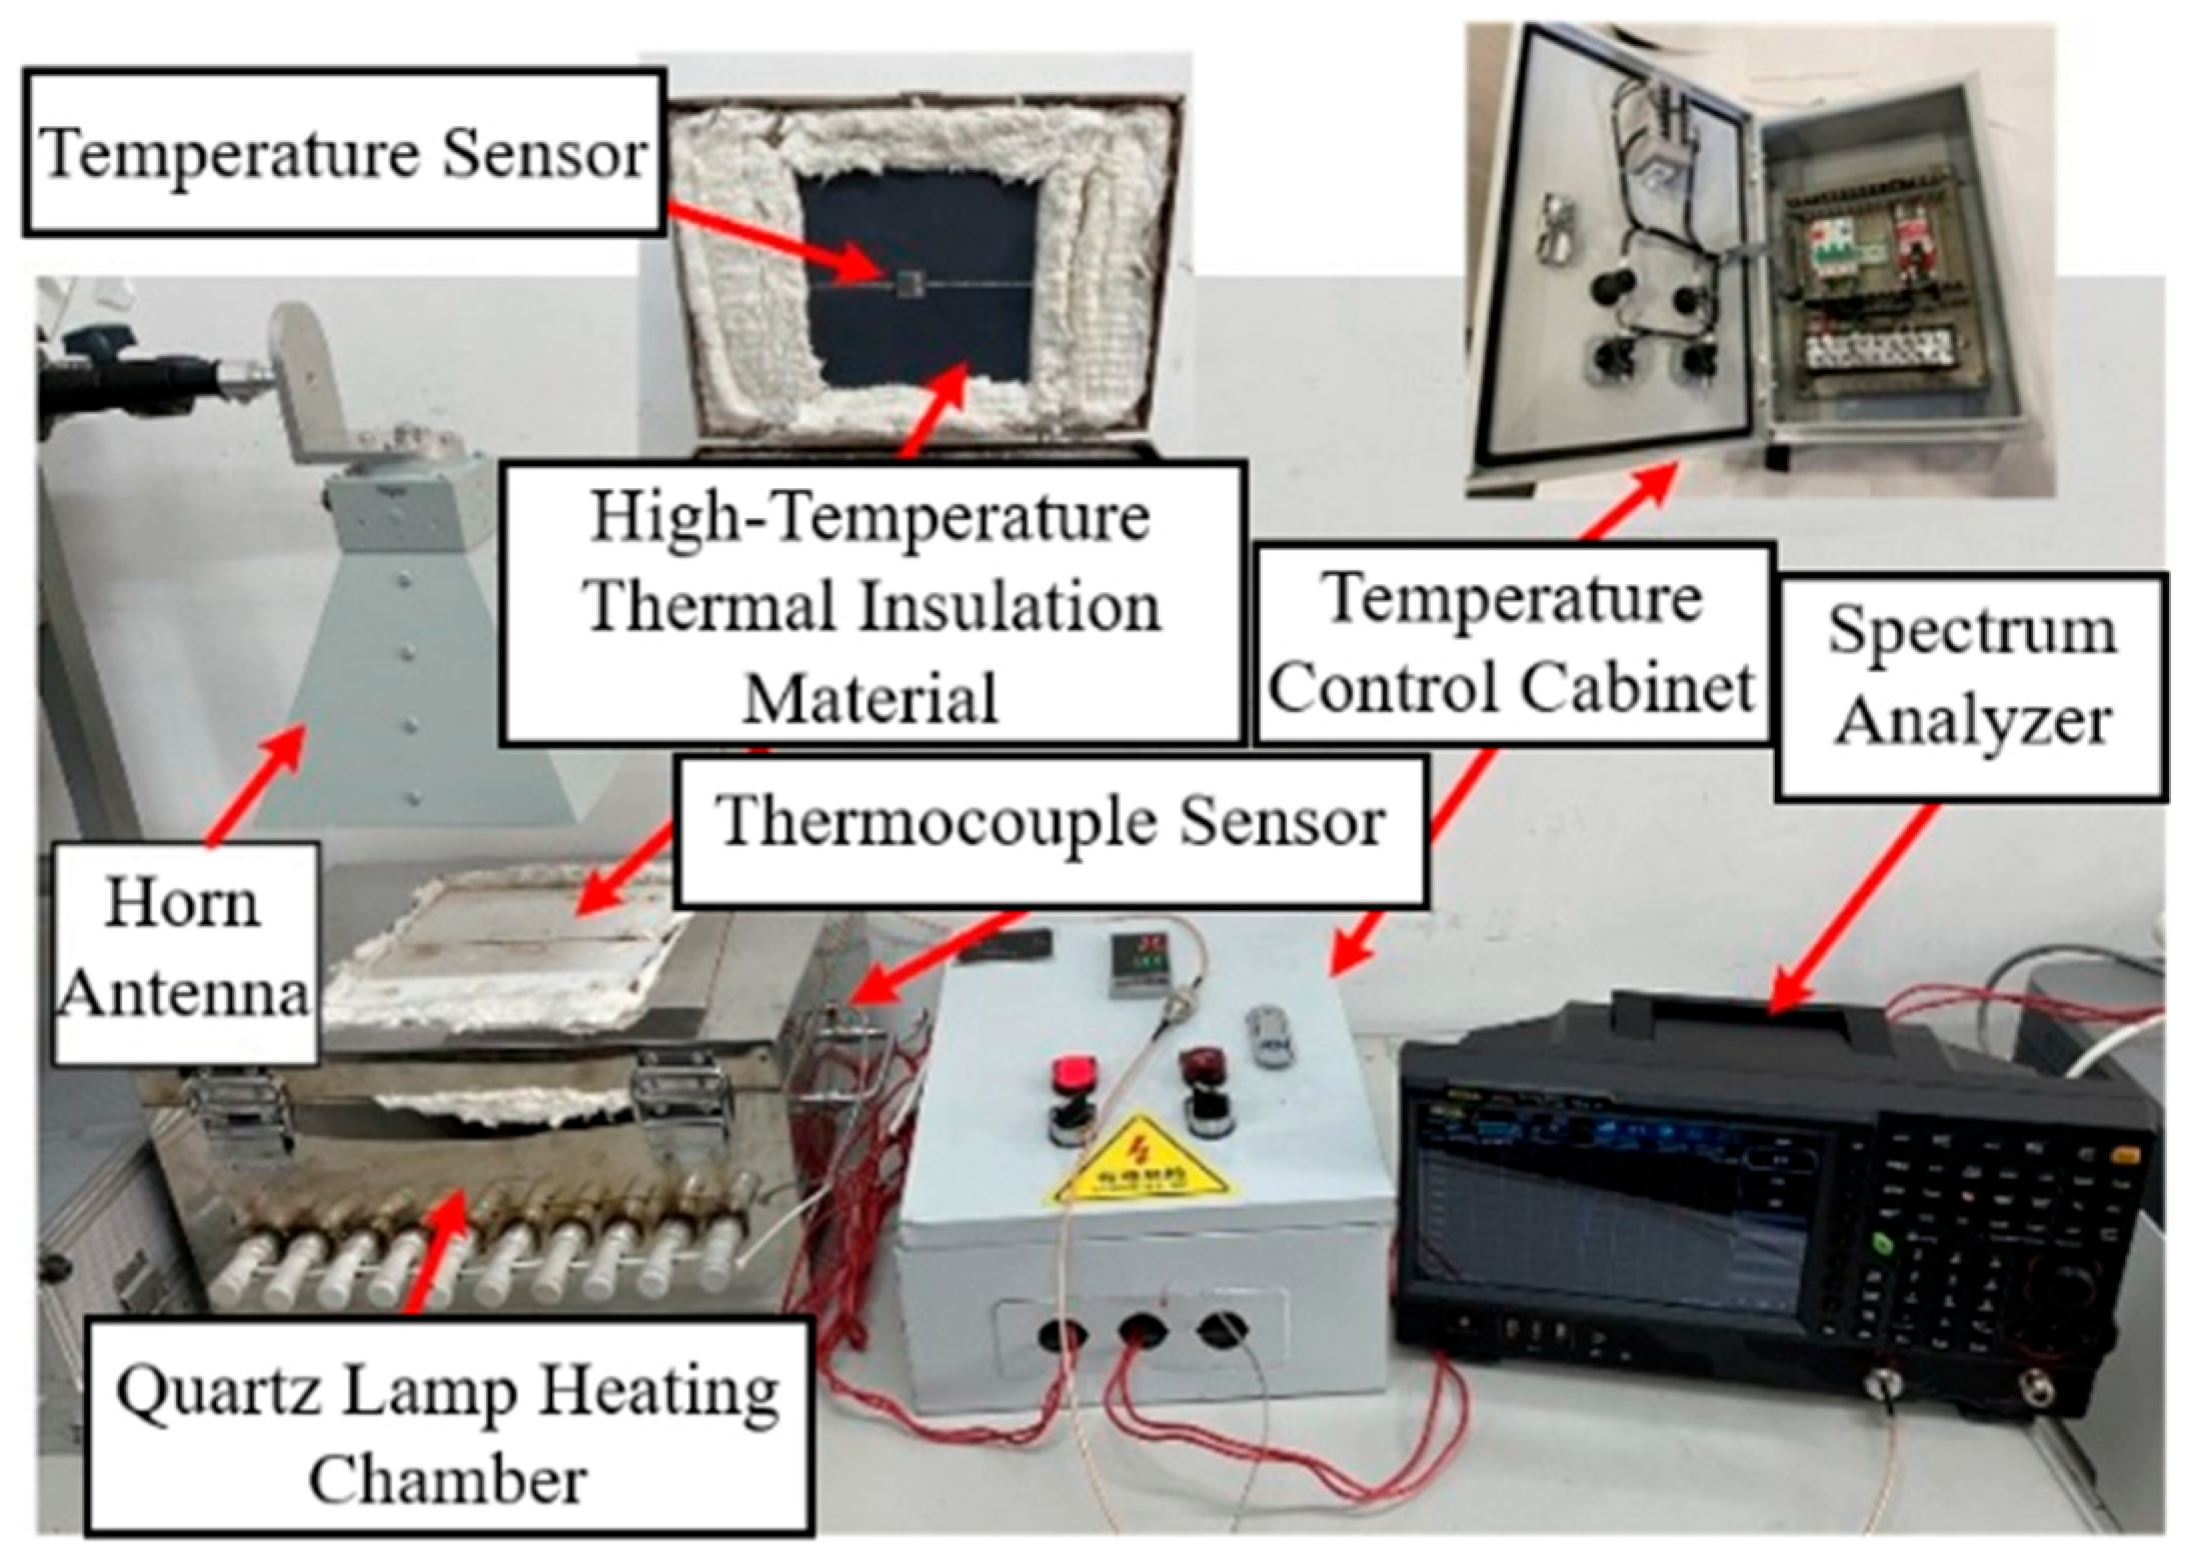
The temperature testing platform consists of the MG-CSRR-SIW temperature sensor, interrogating antenna, spectrum analyzer, and heating device. The connection diagram is shown in Figure 14. The quartz lamp heating device consisting of a quartz lamp heating chamber and a temperature control cabinet can simulate high-temperature environments. The chamber, made of high-strength stainless steel, contains ten far-infrared quartz heating lamps at the bottom as heating elements. Its interior is lined with high-temperature asbestos to minimize heat loss, and the top is insulated with a rigid ceramic fiber tile, commonly used in aerospace thermal protection, to replicate operational conditions. A high-precision thermocouple beneath the insulation monitors the temperature in real time. The quartz lamps convert visible and near-infrared radiation into far-infrared heat, offering compact size, high power, rapid heating, and temperatures up to 1200 °C. The temperature control cabinet connecting to the lamps and thermocouple adopts PID control to maintain temperatures within ±1 °C.
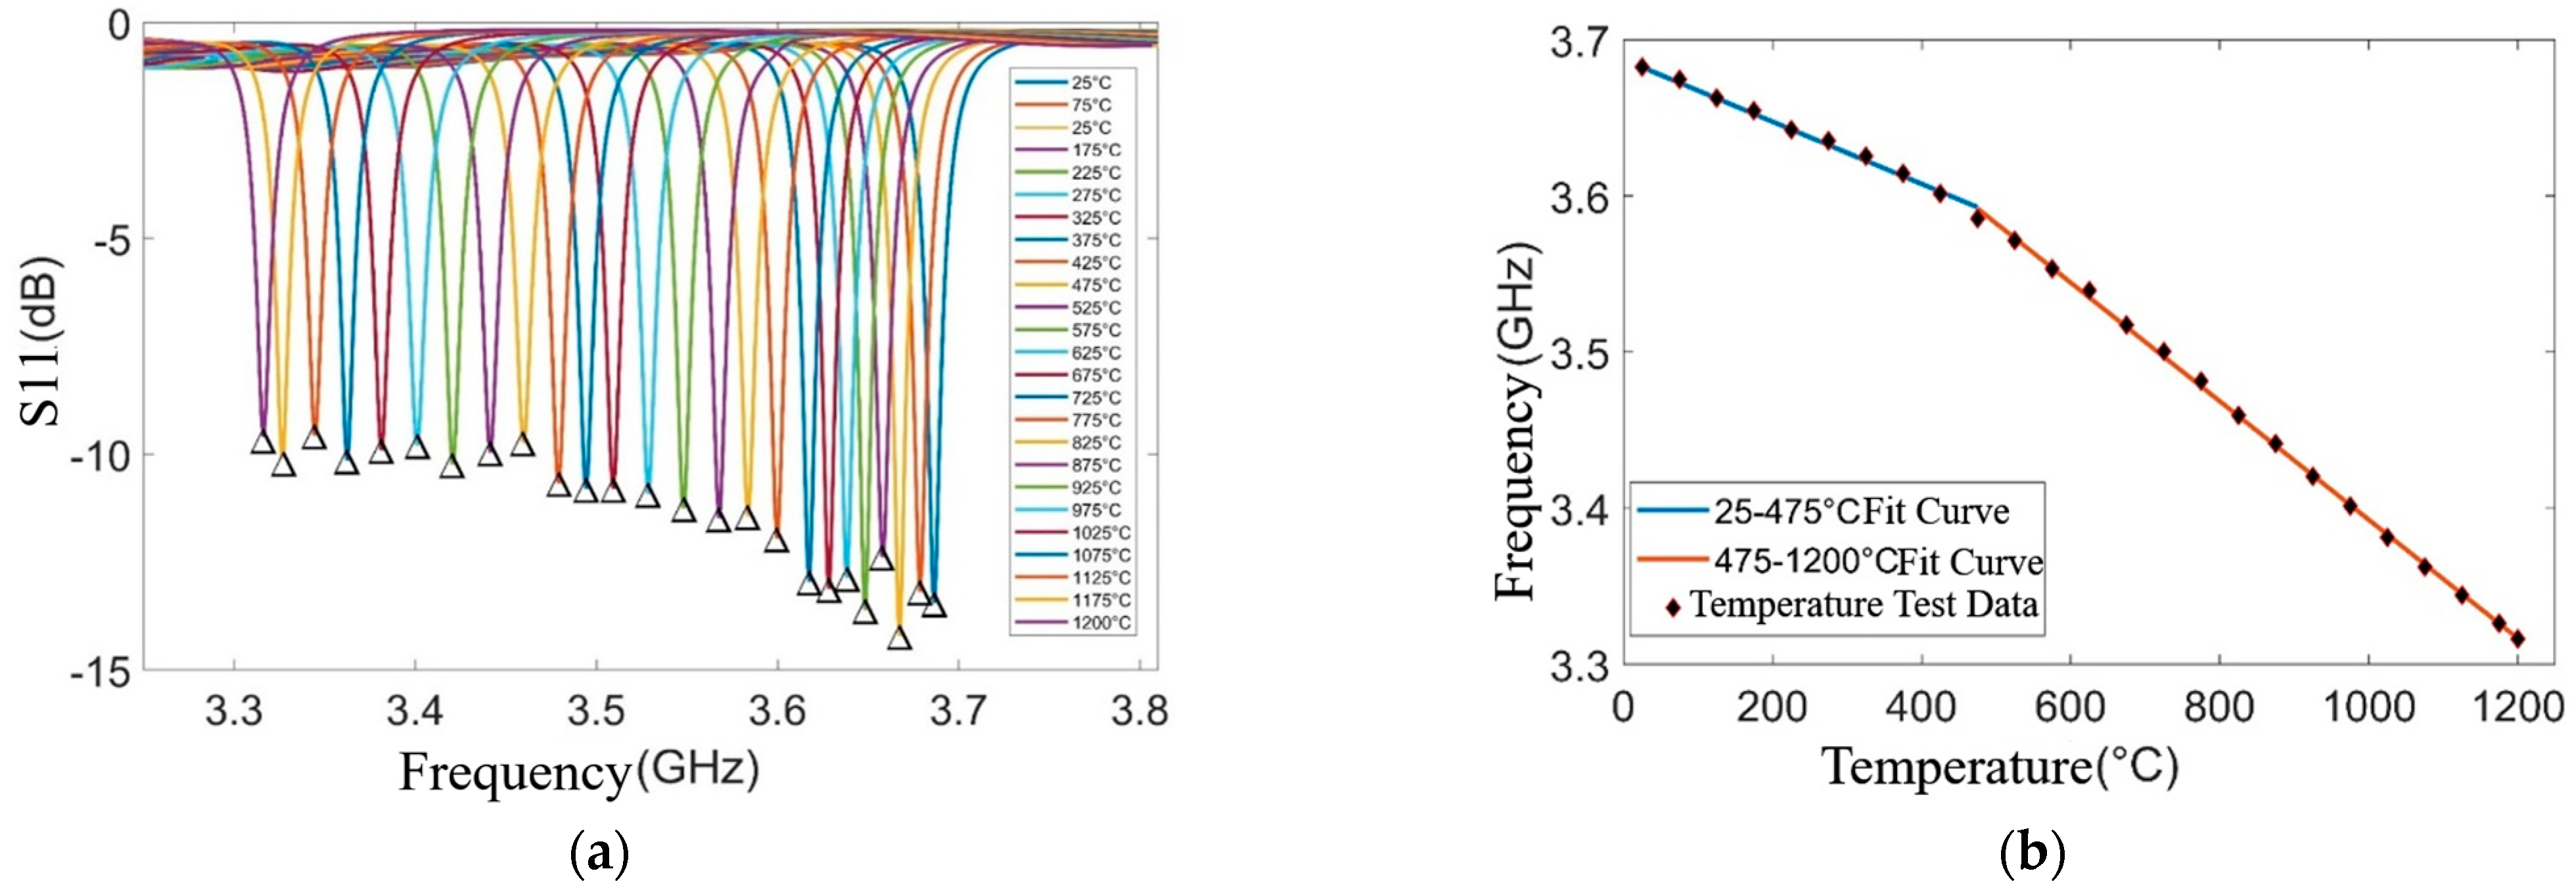
The sensor is adhered to the heated surface of the thermal protection material using high-temperature adhesive (resistant to 1200 °C) to align its measurements with the thermocouple sensors. The adhesion process involves curing at 25–30 °C for 12 h, followed by vacuum heating at 100 °C for 2 h and 150 °C for an additional 2 h to ensure secure bonding. The heating device raises the temperature of the chamber from 25 °C to 1200 °C. At every 50 °C increment, the heating is paused, and after a 10 min insulation period, the corresponding S11 parameter is recorded using a spectrum analyzer. The S11 curves for all temperature points are shown in Figure 15a. The resonant frequency decreases with increasing temperature due to the rise in the dielectric constant of the sensor substrate, which aligns with the simulation results. The resonant frequency of each curve is extracted and linearly fitted to generate the temperature–frequency curve, as shown in Figure 15b. The sensor exhibits a sensitivity of 199.33 kHz/°C in the low-temperature range and 379.75 kHz/°C in the high-temperature range. The corresponding linear fitting results for both regions are given in Equation (10).
Ft = 0.00019933 * T + 3.6874 ( 25 475 ° C ) Ft = 0.00037975 * T + 3.7723 ( 475 1200 ° C )
To evaluate the measurement accuracy of the MG-CSRR-SIW temperature sensor, a high-precision thermocouple is used to calibrate the designed sensor. Table 1 presents the measuring values of both sensors at various temperatures. The results show that the maximum relative error across all temperature points does not exceed 2.2%, demonstrating the sensor’s suitability for temperature monitoring applications.

4.2.2. Pressure Testing

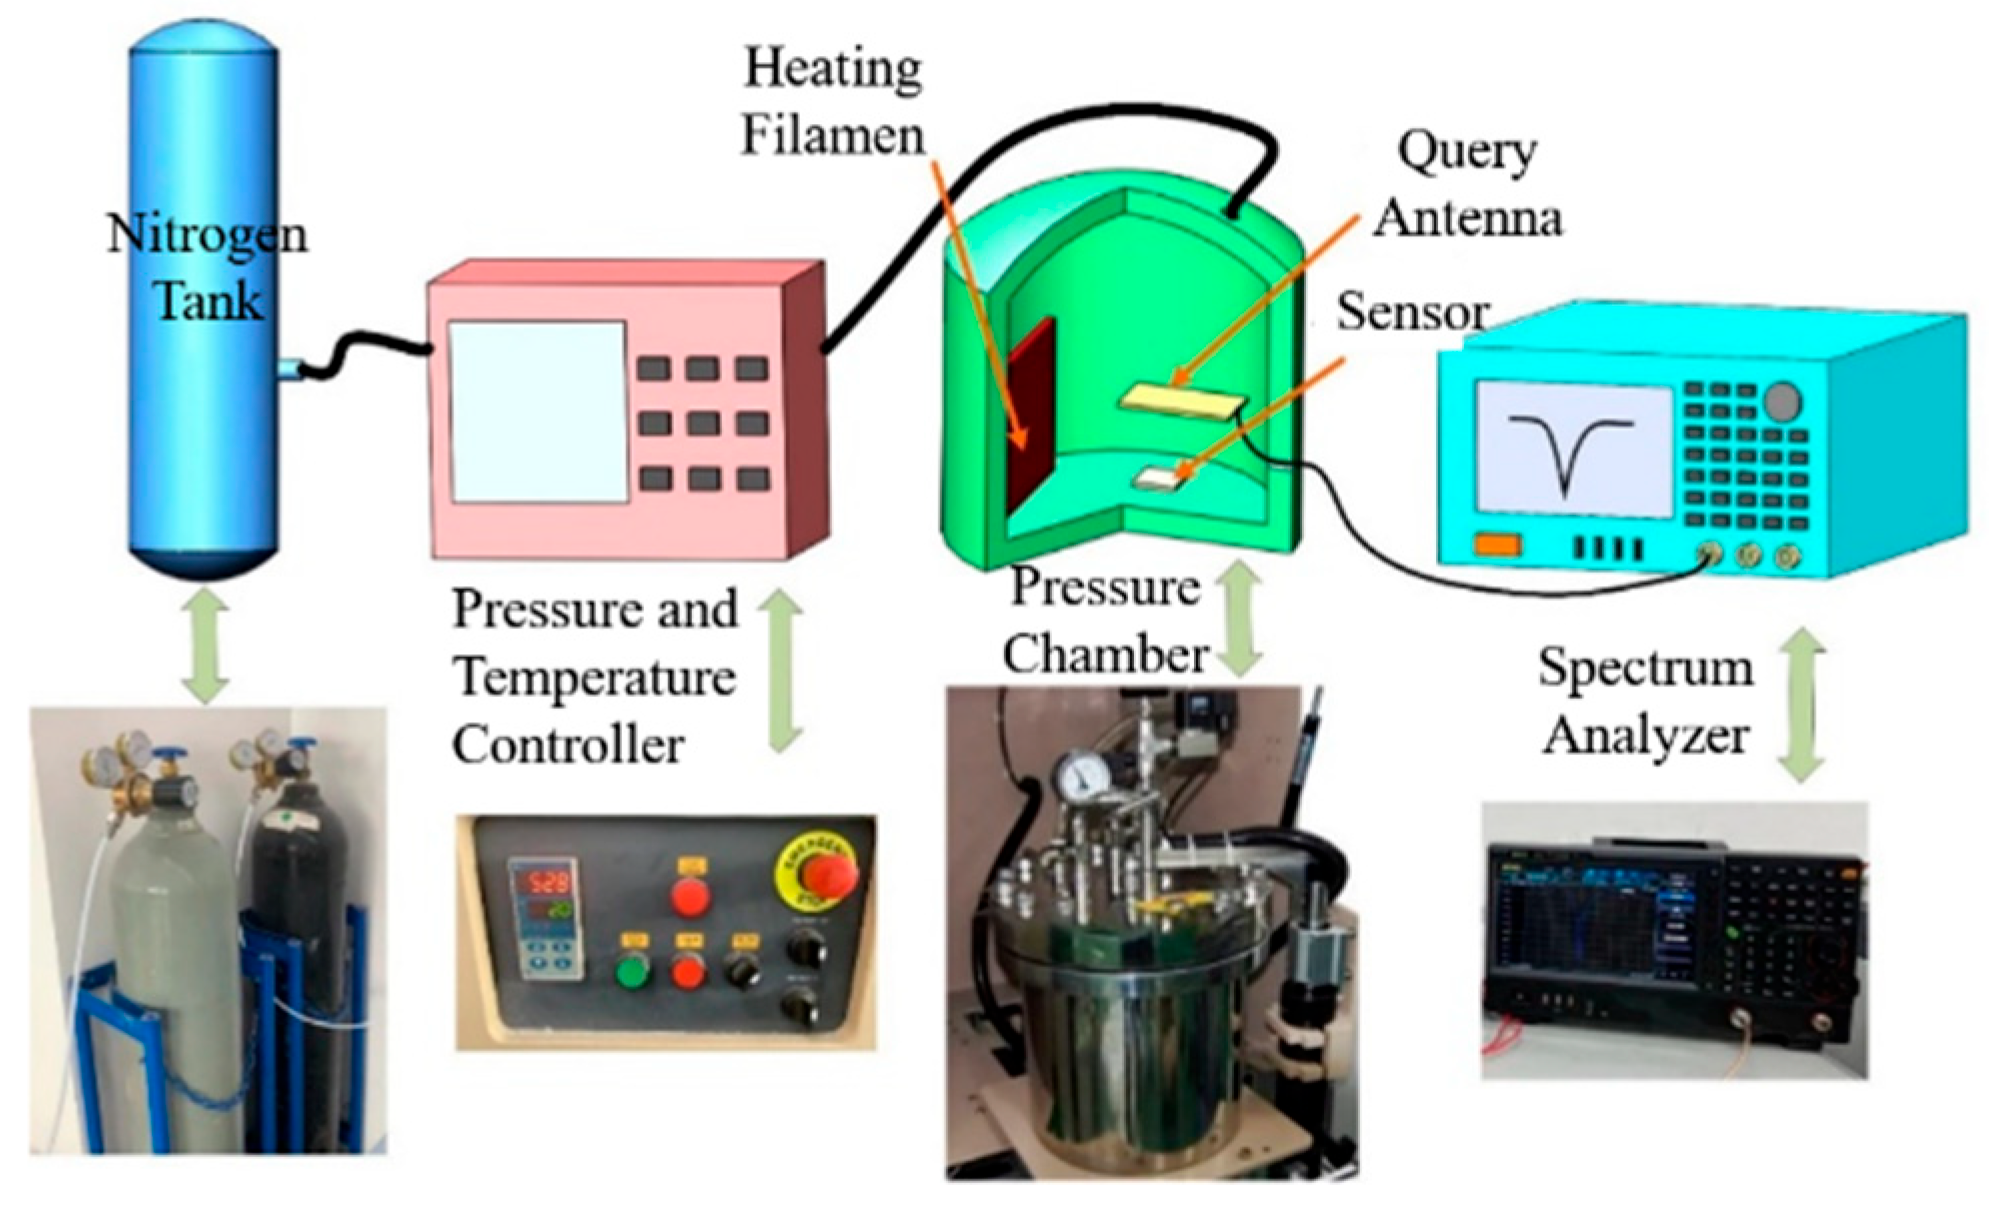
The pressure testing platform consists of a nitrogen cylinder, pressure controller, pressure chamber, MG-CSRR-SIW pressure sensor, interrogation antenna, and spectrum analyzer. The schematic diagram of the platform is shown in Figure 16.
The nitrogen is selected as the pressurizing gas due to its inert nature, which prevents chemical reactions with other substances and ensures high operational safety. The nitrogen cylinder stores high-pressure nitrogen and provides a stable gas supply to the testing platform, maintaining consistent pressure in the testing process. The pressure chamber is a sealed enclosure that isolates the internal environment from external conditions. By inputting high-pressure nitrogen into the chamber, a stable controlled high-pressure environment is established.
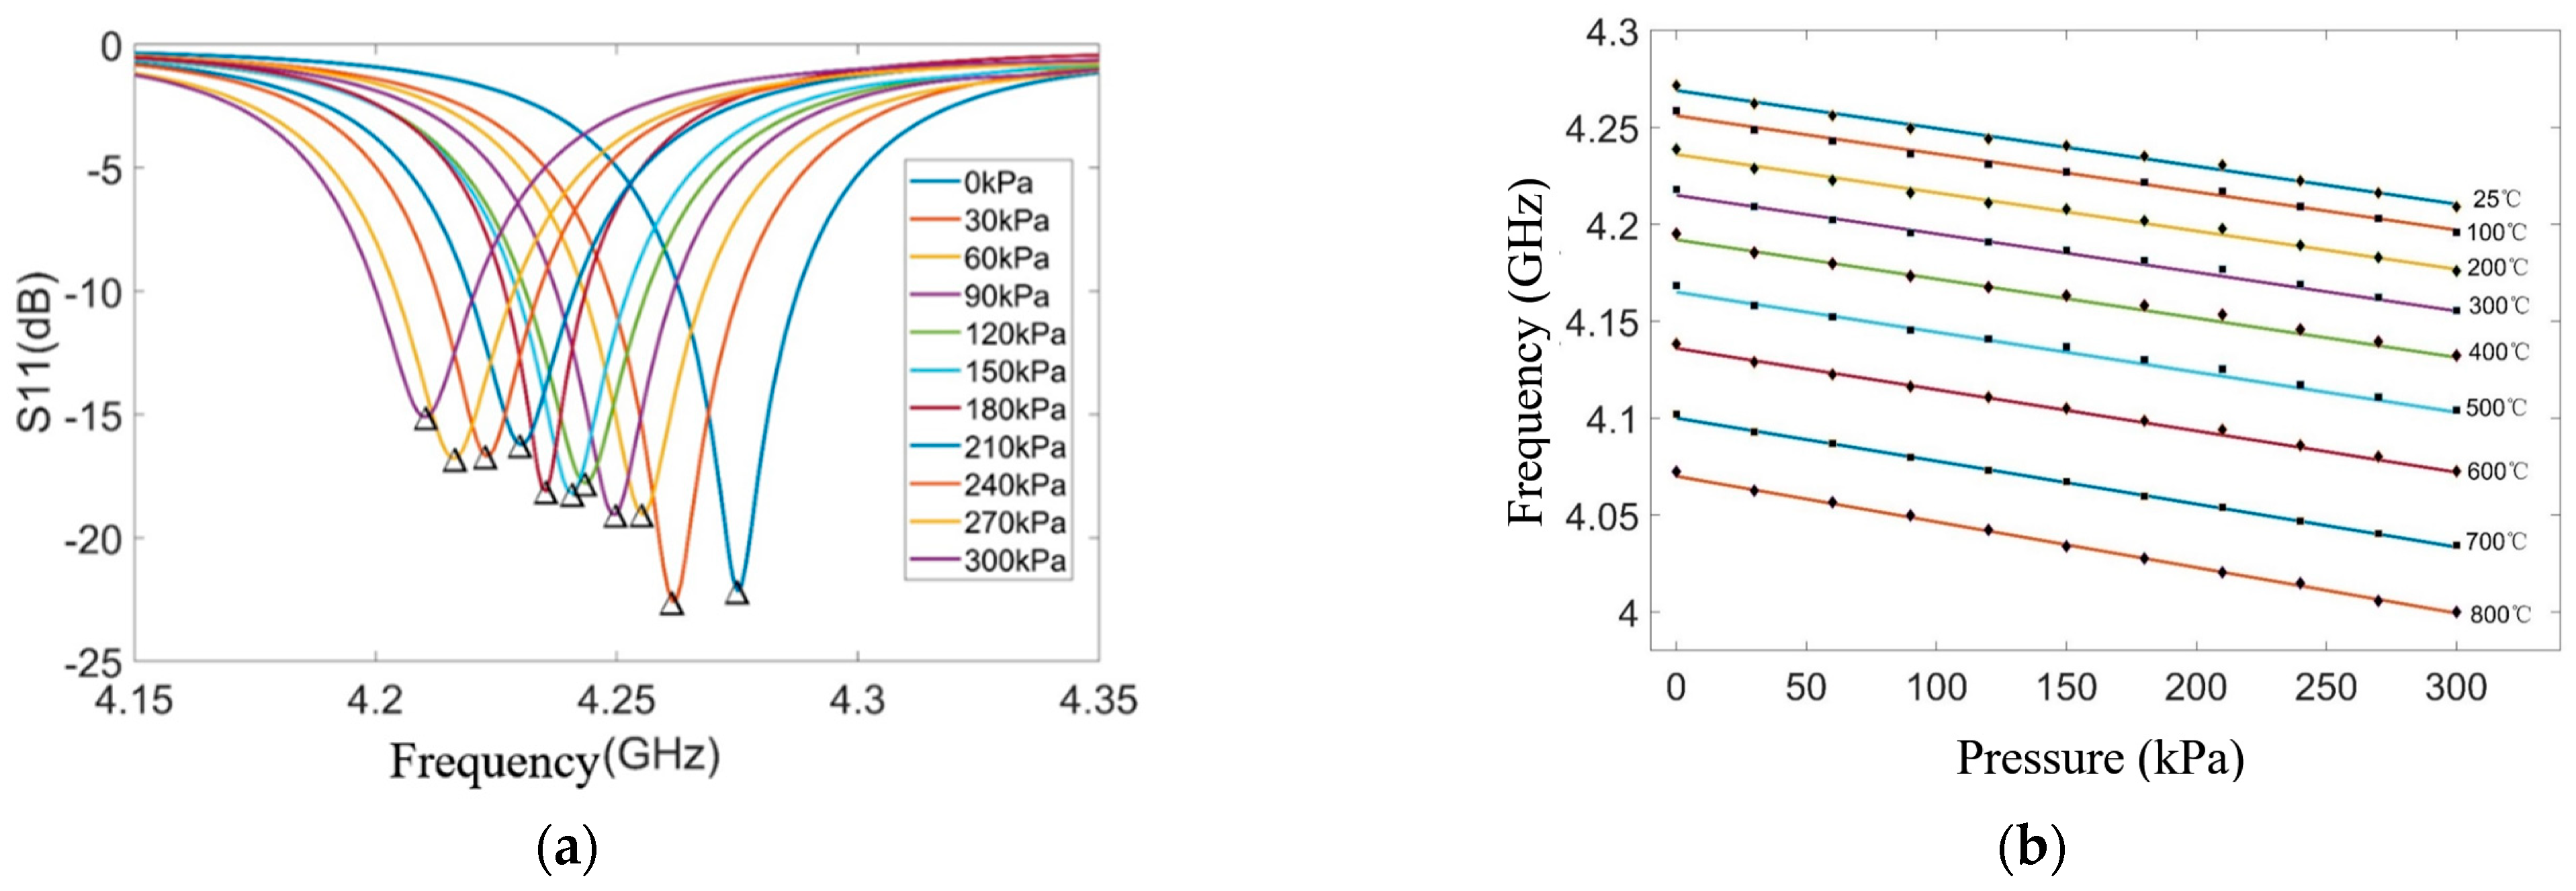
The pressure and temperature controllers adjust the nitrogen flow rate based on feedback from pressure sensors and regulate the internal temperature using data from the temperature sensors. The pressure controller is adjusted to gradually increase the pressure inside the chamber from 0 kPa to 300 kPa. At each 30 kPa increment, pressurization is paused, and the pressure is maintained for 2 min. A spectrum analyzer is used to record the S11 parameters in corresponding to each pressure point. The S11 curves’ results are shown in Figure 17a. The resonant frequency decreases continuously with increasing pressure, which is consistent with the simulation results. The resonant frequency of each curve is extracted and linearly fitted to generate the pressure–frequency curve, with resonant frequencies corresponding to different pressure points under various temperature conditions (25 °C, 100 °C, etc.) extracted at 100 °C intervals. The resonant frequencies of the pressure sensor at different temperature conditions are then linearly fitted, resulting in fitting curves for nine different temperature conditions, as shown in Figure 17b. At a temperature of 800 °C, the pressure sensor exhibits a sensitivity of 235.5 kHz/kPa.
To evaluate the measurement accuracy of the proposed sensor, the built-in pressure sensor of the pressure controller is used to calibrate the designed sensor. The pressure is increased from 0 kPa to 300 kPa in 50 kPa intervals, maintaining a constant temperature of 800 °C, and after holding the pressure for 2 min, the measured frequencies are obtained using a spectrum analyzer. These frequencies are then used in the pressure fitting curve for the specific temperature condition to obtain the measured pressure. Table 2 presents the measurement values of both sensors at various pressure levels. The results show that the maximum measurement error does not exceed 1.45% at all pressure points, demonstrating the sensor’s suitability for pressure detection applications.
We have also provided a performance comparison between the proposed sensor and other existing sensors. As shown in Table 3, compared with conventional temperature and pressure sensors, the proposed sensor exhibits superior scattering parameters, enhanced transmission-based sensing performance, and higher sensitivity.

4.2.3. Repeatability Testing

In order to characterize the dispersion and randomness of the temperature sensor’s measurement results and to analyze whether the sensor can operate stably, repeatability tests are conducted. Repeatability error refers to the degree of variation between measurement results as the same quantity is measured multiple times under the same conditions and along the same direction. The quantitative expression of repeatability can be represented by the standard deviation σ of the measured data, and its calculation formula is shown in Equation (11):
σ = i = 1 n ( y i y ¯ ) 2 n 1
In this equation, n represents the total number of measurements, y i is the result of the i -th measurement, and y ¯ is the average of all measurement results.
To characterize the dispersion, randomness, and stability of the temperature and pressure measurement results, repeatability tests were conducted on the sensor. Three measurements were conducted at the range from 25 °C to 1200 °C with a step interval of 100 °C. As temperature was 800 °C, three pressure measurements were taken at the range of 0–300 kPa with a step interval of 30 kPa. After each 30 kPa increased in pressure or each 100 °C increased in temperature, the measurement was maintained for 2 min and the corresponding resonant frequency of the sensor was recorded. The mean and standard deviation of the resonant frequency measured at the same pressure or temperature were then calculated. The resonant frequencies collected at all pressure or temperature points, along with the calculated averages and standard deviations, are shown in Table 4. It can be observed that the standard deviation of the three measurements at the same pressure or temperature condition is small, which indicates that the designed sensor exhibits good repeatability.

5. Conclusions and Discussion

This paper presents a novel MG-CSRR-SIW structure for temperature and pressure sensor design based on the HTCC process, which can achieve temperature measurement in the range of 25~1200 °C and pressure measurement in the range of 0~300 kPa. Firstly, the working principle and equivalent circuit of the sensor are analyzed, and the sensor size structure and surface metal pattern are determined through simulation. Then, the physical production of the sensor is completed using the HTCC process, and finally experimental tests are conducted to determine the actual performance of the sensor. The tests show that both the temperature sensor and the pressure sensor have good stability and linearity. The temperature sensitivities are 199.33 kHz/°C and 379.75 kHz/°C at the temperature ranges of 25–475 °C and 475–1200 °C, respectively, while the pressure sensitivity reaches 235.5 kHz/kPa at 800 °C. The maximum relative measurement errors of the temperature and pressure sensors are 2.2% and 1.45%, respectively. In comparison to a temperature and pressure sensor based on a traditional CSRR structure, the MG-CSRR-SIW sensor has better scattering parameters, transmission sensing performance, high sensitivity, small size, and light weight. In the future, we can improve the performance of anti-interference, long-distance signal transmission, multi-parameter measurement, and manufacturing process optimization.

Author Contributions

Conceptualization, methodology, funding acquisition, and writing—original draft preparation, J.J. and T.D. Curation, formal analysis, review and writing—review and editing, J.J. and K.Q. Resources, investigation, software, and validation, H.W., L.Q., S.G. and P.G. All authors have read and agreed to the published version of the manuscript.

Funding

This research was funded by the Fundamental Research Funds for the Central Universities under Grant 309181A8804 and Grant 30919011263, in part by Postgraduate Research and Practice Innovation Program of Jiangsu Province under Grant SJCX24_0143 and SJCX25_0183.

Institutional Review Board Statement

Not applicable.

Informed Consent Statement

Not applicable.

Data Availability Statement

Data are contained within the article.

Conflicts of Interest

Author Peng Gao was employed by the company China North Industries Group Corporation Limited. The remaining authors declare that the research was conducted in the absence of any commercial or financial relationships that could be construed as a potential conflict of interest.

References

  1. Rodriguez-Cassola, M.; Prats, P.; Schulze, D.; Tous-Ramon, N.; Steinbrecher, U.; Marotti, L.; Nannini, M.; Younis, M.; Lopez-Dekker, P.; Zink, M.; et al. First Bistatic Spaceborne SAR Experiments With TanDEM-X. Geosci. Remote Sens. Lett. IEEE 2012, 9, 33–37. [Google Scholar] [CrossRef]
  2. Wang, X.; Gao, X.; Zhang, Z.; Cheng, L.; Ma, H.; Yang, W. Advances in modifications and high-temperature applications of silicon carbide ceramic matrix composites in aerospace: A focused review. J. Eur. Ceram. Soc. 2021, 41, 4671–4688. [Google Scholar] [CrossRef]
  3. Yan, A.; Feng, X.; Hu, Y.; Lai, C.; Cui, J.; Chen, Z.; Miyase, K.; Wen, X. Design of a Triple-Node-Upset Self-Recoverable Latch for Aerospace Applications in Harsh Radiation Environments. IEEE Trans. Aerosp. Electron. Syst. 2020, 56, 1163–1171. [Google Scholar] [CrossRef]
  4. Haque, M.M.; Sheikder, C.; Hu, Q. Exploiting the Phenomena of Performance Degradation Distribution for Reliability Evaluation of Aerospace Engines. In Proceedings of the 2022 IEEE Conference on Interdisciplinary Approaches in Technology and Management for Social Innovation (IATMSI), Gwalior, India, 21–23 December 2022; IEEE: New York, NY, USA, 2022; pp. 1–5. [Google Scholar]
  5. Bhar, I.; Mandal, N. A review on advanced wireless passive temperature sensors. Measurement 2022, 187, 110255. [Google Scholar] [CrossRef]
  6. Wang, Y.S.; Zhang, C.C.; Yang, S.Y.; Li, Y.; Zheng, R.; Cai, H.; Zhang, Y.; Zhao, N.; Kang, Z.; Guo, Y.; et al. In Situ Integration of High-Temperature Thin-Film Sensor for Precise Measurement of Heat Flux and Temperature on Superalloy Substrate. IEEE Sens. J. 2023, 23, 17932–17941. [Google Scholar] [CrossRef]
  7. Wang, J.Y.; Tian, W.; Wang, Y.; Zhou, H.; He, Y.; Wang, Y.; Li, T. Micromachined Thermocouple for Rapid Detection of Ultrahigh Heat Flux at High Temperature. IEEE Trans. Ind. Electron. 2022, 69, 2099–2106. [Google Scholar] [CrossRef]
  8. Wilson, W.C.; Atkinson, G.M. Passive Wireless Sensor Applications for NASA’s Extreme Aeronautical Environments. IEEE Sens. J. 2014, 14, 3745–3753. [Google Scholar] [CrossRef]
  9. Zhang, L.L.; Su, S.J.; Xu, F.J.; Ren, T.; Xiong, J. High Sensitivity SIW-CSRR Temperature Sensor Based on Microwave Scattering. IEEE Sens. J. 2023, 23, 13900–13908. [Google Scholar] [CrossRef]
  10. Beria, Y.; Das, G.S.; Buragohain, A.; Kalita, P.P.; Doloi, T. Sensitivity Enhancement Enabled by Strongly Coupled DG-IDC Structure With CSRR for Permittivity Detection. IEEE Sens. J. 2025, 25, 21503–21511. [Google Scholar] [CrossRef]
  11. Hallil, H.; Bahoumina, P.; Pieper, K.; Zhang, Q.; Coquet, P.; Pichonat, E.; Happy, H.; Dejous, C.; Lachaud, J.L.; Rebiere, D.; et al. Differential Passive Microwave Planar Resonator-Based Sensor for Chemical Particle Detection in Polluted Environments. IEEE Sens. J. 2019, 19, 1346–1353. [Google Scholar] [CrossRef]
  12. Wu, Y.; Pecorella, G.R.; Verderame, G.; Annicchiarico, D.; Galhena, T.; Hodge, S.; Joyce, H.J.; Livreri, P.; Lombardo, A. Microwave Gas Sensor Based on Graphene Aerogels. IEEE Sens. J. 2023, 23, 19282–19289. [Google Scholar] [CrossRef]
  13. Han, X.; Peng, P.; Fu, C.; Qiao, L.; Ma, Z.; Liu, K.; Zhang, S. Highly Integrated Improved Hexagonal CSRR-Based Fluid Sensor for Complex Dielectric Parameter Detection. IEEE Sens. J. 2024, 24, 20559–20570. [Google Scholar] [CrossRef]
  14. Liu, W.N.; Yang, X.W.; Niu, Y.T.; Sun, H. Improve planar multiple split-ring sensor for microwave detection applications. Sens. Actuators A Phys. 2019, 297, 111542. [Google Scholar] [CrossRef]
  15. Hosseini, N.; Baghelani, M. Selective Real-Time Non-Contact Multi-Variable Water-Alcohol-Sugar Concentration Analysis during Fermentation Process using Microwave Split-Ring Resonator Based Sensor. Sens. Actuators A Phys. 2021, 325, 112695. [Google Scholar] [CrossRef]
  16. Abdulkarim, Y.; Dalgac, Ş.; Alkurt, F.; Muhammadsharif, F.F.; Awl, H.N.; Saeed, S.R.; Altıntaş, O.; Li, C.; Bakır, M.; Karaaslan, M.; et al. Utilization of a triple hexagonal split ring resonator (SRR) based metamaterial sensor for the improved detection of fuel adulteration. J. Mater. Sci. Mater. Electron. 2021, 32, 6891–6896. [Google Scholar] [CrossRef]
  17. Yu, J.; Liu, G.; Cheng, Z.; Song, Y.; You, M. Design of OCSRR-Based Differential Microwave Sensor for Microfluidic Applications. IEEE Sens. J. 2022, 22, 21489–21497. [Google Scholar] [CrossRef]
  18. Buragohain, A.; Das, G.S.; Beria, Y. Highly sensitive differential Hexagonal Split Ring Resonator sensor for material characterization. Sens. Actuators A Phys. 2023, 363, 114704. [Google Scholar] [CrossRef]
  19. Khalil, M.A.; Yong, W.H.; Islam, M.T.; Hoque, A.; Islam, M.S.; Leei, C.C.; Soliman, M.S. Double-negative metamaterial square enclosed QSSR for microwave sensing application in S-band with high sensitivity and Q-factor. Sci. Rep. 2023, 13, 7373. [Google Scholar] [CrossRef]
  20. Su, S.; Xu, F.; Zhang, L.; Liu, S.; Ren, T. Design and Research of SIW Wireless Passive High-Temperature and Pressure Sensor. IEEE Sens. J. 2023, 23, 27921–27930. [Google Scholar] [CrossRef]
  21. Sui, G.; Li, X.; Yang, C.-H.; Kumar, M. Development and Performance Study of a Wireless Passive Temperature Sensor Based on Polymer-Derived Ceramic Composites-PZT Thin Film. IEEE Sens. J. 2025, 25, 12659–12667. [Google Scholar] [CrossRef]
  22. Guo, W.; Lu, Y.-C.; Gao, B.; Qiao, Y.; Wu, D.; Feng, R.; Tan, Q. Design of Metamaterial High-Temperature Pressure Sensor Based on HTCC Ceramic Substrate. IEEE Sens. J. 2025, 25, 11176–11184. [Google Scholar] [CrossRef]
  23. Li, B.; Shen, J.; Han, H.; Zhang, J.; Gao, Y.; Xuan, F. Design and 3-D Printing-Assisted Fabrication of Microwave Resonator-Based Passive Wireless Sensors for Simultaneous Measuring High Temperatures and Pressures. IEEE Sens. J. 2024, 24, 27205–27217. [Google Scholar] [CrossRef]
Figure 1. Schematic diagram of wireless transmission principle of microwave scattering-based device.
Applsci 16 00803 g001
Figure 2. The structure design process of MG-CSRR-SIW sensor.
Applsci 16 00803 g002
Figure 3. Equivalent circuit of MG-CSRR-SIW structure.
Applsci 16 00803 g003
Figure 4. The circuit schematic in ADS2017 software for circuit simulation.
Applsci 16 00803 g004
Figure 5. The simulation S11 plot when varying the parameter value of C s .
Applsci 16 00803 g005
Figure 6. Schematic diagram of MG-CSRR-SIW sensor. (a) upper metal layer. (b) three-dimensional structure of sensor.
Applsci 16 00803 g006
Figure 7. S11 curves for sensors with different total grid lengths.
Applsci 16 00803 g007
Figure 8. Surface electric field distribution diagrams for MG-CSRR-SIW with (a) grid lengths of 18 mm for pressure and (b) grid lengths of 20 mm for temperature.
Applsci 16 00803 g008
Figure 9. S11 curves of MG-CSRR-SIW sensor for temperatures with different substrate dielectric constants.
Applsci 16 00803 g009
Figure 10. Temperature sensitive mechanism.
Applsci 16 00803 g010
Figure 11. (a) Relationship between surface pressure and displacement for MG-CSRR-SIW pressure sensor; (b) S11 Curves for MG-CSRR-SIW structural pressure sensors at different cavity displacement levels.
Applsci 16 00803 g011
Figure 12. Pressure sensitive mechanism.
Applsci 16 00803 g012
Figure 13. (a) Schematic diagram of MG-CSRR-SIW sensor fabrication process; (b) Photograph of MG-CSRR-SIW sensor; (c) Cross section of the sensor.
Applsci 16 00803 g013
Figure 14. Schematic diagram of the temperature testing platform.
Applsci 16 00803 g014
Figure 15. The relationship among S11, temperature, and frequency. (a) S11 curves for MG-CSRR-SIW sensor at different temperatures; (b) Linear fitting of temperature-frequency within different temperature ranges.
Applsci 16 00803 g015
Figure 16. Schematic diagram of the pressure testing platform.
Applsci 16 00803 g016
Figure 17. The relationship among S11, temperature, and frequency. (a) S11 curves for MG-CSRR-SIW pressure sensor at different pressure levels; (b) Linear fitting of the pressure-frequency at different temperatures.
Applsci 16 00803 g017
Table 1. Measurement error analysis of MG-CSRR-SIW sensor for temperature.
Calibration Temperature (°C)Measured Frequency
(GHz)
Measured Temperature (°C)Relative Measurement Error (%)
2003.64803197.51.25
3003.62657305.21.73
4003.60591408.82.20
5003.58405495.70.86
6003.54729592.51.25
7003.50601701.20.17
8003.46523808.61.08
9003.42775907.30.81
10003.39380996.70.33
11003.355111098.60.13
12003.319031193.60.53
Table 2. Measurement error analysis of MG-CSRR-SIW sensor for pressure.
Calibration Pressure/kPaMeasured Frequency/GHzMeasured Pressure/kPaRelative Measurement Error/%
04.069930/
504.0580650.40.80
1004.04624100.90.90
1504.03479149.30.46
2004.02358198.31.45
2504.01082250.30.12
3003.99836303.71.23
Table 3. The comparison between proposed sensor and other sensors for temperature and pressure.
Sensor TypeMaterialParameterRangeHighest
Sensitivity
TransmissionRef.
Microwave scattering sensorAl2O3Temperature25 °C to 1200 °C437.5 kHz/°CWireless passive[10]
Microwave scattering sensorSiCTemperature Pressure25 °C to 1000 °C
0 to 700 kPa
63.216 kHz/°C
228.571 kHz/kPa
Wireless passive[20]
LC-sensorPolymer-derived ceramics (PDC) and lead zirconium titanate (PZT)Temperature25 °C to 825 °C−0.439 kHz/°CWireless passive[21]
Microwave resonant sensorAl2O3 ceramicsTemperature Pressure25 °C to 1200 °C
0 to 800 kPa
248.05 kHz/°C
103.52 kHz/kPa
Wireless passive[22]
Microwave resonator sensorAl2O3 ceramicsTemperature Pressure20 °C to 600 °C
0 to 400 kPa
125.219 kHz/°C
121.575 kHz/kPa
Wireless passive[23]
Table 4. Temperature and pressure sensor repeatability data analysis table.
Temperature
(°C)
#1
(GHz)
#2
(GHz)
#3
(GHz)
Mean
(GHz)
Standard DeviationPressure
(kPa)
#1
(GHz)
#2
(GHz)
#3
(GHz)
Mean (GHz)Standard Deviation
253.68263.67973.68253.68161.82 × 10−404.06994.06964.06994.06981.18 × 10−4
1253.66263.65983.66243.66161.62 × 10−4304.06174.06134.06114.06142.55 × 10−4
2253.64253.64013.64193.64151.22 × 10−4604.05424.053814.05384.05391.98 × 10−4
3253.62553.62323.62483.62451.08 × 10−4904.04844.047984.04804.04812.13 × 10−4
4253.60153.59953.60073.60058.56 × 10−41204.04344.042794.04254.04293.63 × 10−4
5253.57153.56983.57073.57066.66 × 10−41504.03874.037834.03764.03804.83 × 10−4
6253.53943.53763.53563.53751.91 × 10−41804.03344.032524.03254.03284.35 × 10−4
7253.50043.49883.49653.49852.03 × 10−42104.02774.026484.02684.02705.32 × 10−4
8253.45943.45873.45473.45763.02 × 10−42404.02074.019474.01984.02005.52 × 10−4
9253.42043.42273.42013.42101.65 × 10−42704.01454.014104.01434.01431.90 × 10−4
10253.38133.38083.37643.37953.29 × 10−43004.00724.007144.00674.00701.79 × 10−4
11253.34433.34813.34113.34454.47 × 10−4
12003.31633.31623.31383.31541.76 × 10−4
Disclaimer/Publisher’s Note: The statements, opinions and data contained in all publications are solely those of the individual author(s) and contributor(s) and not of MDPI and/or the editor(s). MDPI and/or the editor(s) disclaim responsibility for any injury to people or property resulting from any ideas, methods, instructions or products referred to in the content.