Article

Machine Learning-Enabled Wearable Piezoelectric Acoustic Sensor for Real-Time Breast Abnormality Detection

1
School of Sciences, Hubei University of Technology, Wuhan 430068, China
2
Department of Statistics, University of California, Berkeley, CA 94720, USA
3
BioScience Division, Lawrence Berkeley National Laboratory, Berkeley, CA 94720, USA
4
R&D Division, JS Nanotechnologies, LLC, Fremont, CA 94538, USA
5
Department of Physics, University of California, Berkeley, CA 94720, USA
*
Author to whom correspondence should be addressed.
These authors contributed equally to this work.
Appl. Sci. 2026, 16(12), 6126; https://doi.org/10.3390/app16126126
Submission received: 5 April 2026 / Revised: 19 April 2026 / Accepted: 24 April 2026 / Published: 17 June 2026
(This article belongs to the Special Issue Advances in Development and Application of Perception Sensors)

Featured Application

The proposed wearable piezoelectric sensing system, integrated with machine learning-based signal classification, provides a flexible and compact platform for detecting mechanical heterogeneity in soft materials. This approach is well-suited for applications requiring noninvasive and continuous monitoring, including wearable biomedical sensing, soft tissue characterization, and human–machine interfaces. By enabling real-time analysis of pulse–echo signals through data-driven algorithms, the system offers potential for early-stage anomaly screening in controlled environments, as well as applications in smart prosthetics and adaptive robotic skins. Although demonstrated here as a proof of concept under phantom conditions, the framework can be extended to more complex biological systems and integrated into portable or wireless sensing platforms for future real-world deployment.

Abstract

In contemporary society, breast health has become a significant public health concern, particularly among women. According to statistics from the World Health Organization, both the incidence and mortality rates of breast tumors have steadily increased in recent years. Therefore, effective early-stage screening and postoperative monitoring are essential for maintaining breast health. However, conventional clinical diagnostic modalities are typically bulky, operationally complex, and unsuitable for continuous real-time monitoring, which limits their use in portable and everyday health management applications. To address these limitations, this study proposes a machine learning-integrated wearable piezoelectric sensing platform as an auxiliary tool for breast health assessment. The device consists of a PDMS matching layer embedded with flexible silver nanowires, a P(VDF-TrFE) piezoelectric layer, and a multi-channel low-noise signal acquisition circuit. It is capable of acquiring acoustic echo signals from tissue-mimicking environments and automatically evaluating signal validity using a convolutional neural network (CNN). By integrating piezoelectric sensing with deep learning-based signal analysis, the proposed system achieves a signal-to-noise ratio exceeding 70 dB and a real-time classification accuracy above 96% under controlled conditions. These results demonstrate that the platform provides a compact, portable, and intelligent approach for wearable sensing of mechanical heterogeneity and highlight its potential for future development in continuous biomedical monitoring technologies.

1. Introduction

Breast cancer remains one of the most prevalent malignancies affecting women worldwide, with incidence rising and the age of onset decreasing, making early detection and longitudinal monitoring critical for improving clinical outcomes [1,2]. Conventional clinical imaging modalities, including mammography, ultrasonography, magnetic resonance imaging (MRI), and positron emission tomography (PET), provide strong diagnostic capabilities, but are constrained by high cost, dependence on specialised infrastructure, and limited suitability for continuous real-time monitoring in daily-life settings [3,4].
Recent advances in wearable electronics and flexible biointegrated systems have created unprecedented opportunities for continuous physiological monitoring and early anomaly detection [5,6,7,8]. In particular, wearable ultrasound technology has emerged as a promising approach for non-invasive deep-tissue interrogation, with expanding applications in disease diagnosis, intervention guidance, and long-term health monitoring. Recent studies have shown that artificial intelligence-empowered ultrasound tissue characterization is advancing disease diagnosis, therapy monitoring, and intervention guidance, while progress in wearable ultrasound technology is further broadening its application potential in continuous monitoring scenarios [9,10]. Wearable ultrasound and acoustic sensors can interrogate deep tissues non-invasively [11], enabling applications in cardiovascular monitoring, tissue mechanics assessment, and motion tracking [12,13,14]. Compared with rigid probes, flexible acoustic devices achieve better conformal contact with biological tissues [15], thereby improving signal coupling efficiency and measurement stability [16,17]. Nonetheless, maintaining a high signal-to-noise ratio (SNR) and reliable signal acquisition remains a critical challenge for wearable acoustic sensing systems [18], as motion artefacts, environmental fluctuations, and biological variability can significantly degrade signal quality [19,20].
Mechanically, differences between normal and abnormal tissues in elasticity, density, and microstructure lead to variations in acoustic impedance and echo characteristics [21], providing a basis for detecting tissue heterogeneity via acoustic sensing [22]. However, extracting reliable and discriminative features from weak and noisy echo signals remains a major challenge for wearable platforms [23]. Traditional approaches often rely on manual interpretation or simplistic signal processing, limiting robustness and scalability [24]. Meanwhile, rapid advances in artificial intelligence for ultrasound tissue characterization have demonstrated substantial potential in disease diagnosis, intervention guidance, and therapy monitoring. In particular, machine learning, especially convolutional neural networks (CNNs), has shown strong capability in automatically extracting features and classifying complex time-series and biomedical signals [25,26], and its integration with wearable sensors has improved signal interpretation and data-driven decision support [27]. Nevertheless, most existing studies focus on high-level classification or diagnostic tasks; the more fundamental issue of signal reliability, namely distinguishing valid measurements from corrupted signals, remains underexplored, especially in wearable acoustic sensing systems [28,29].
In this work, we present a machine learning-assisted wearable piezoelectric acoustic sensing platform for breast tissue monitoring, with a specific emphasis on robust echo signal acquisition and validity assessment. The system integrates a flexible P(VDF-TrFE)-based piezoelectric sensor array, silver nanowire electrodes, a PDMS acoustic matching layer, and a multistage low-noise analogue front end, forming a compact and conformal sensing interface. To address signal instability, we introduce a CNN-based module to automatically identify valid and corrupted echo signals before further analysis, thereby improving overall signal reliability. The key contributions of this study are: (1) integrating a flexible piezoelectric sensing array with machine learning-based signal classification; (2) developing a hardware–software co-designed system for pulse-echo signal acquisition and interpretation; and (3) demonstrating robust classification of mechanical heterogeneity under controlled conditions.
Using controlled experiments across multiple media and breast tissue-mimicking phantoms, we demonstrate stable signal acquisition with high SNR and consistent sensitivity to mechanical heterogeneity. Rather than targeting clinical diagnosis, this study establishes a proof-of-concept framework for reliable signal acquisition and validation in wearable acoustic sensing systems, providing a scalable foundation for future intelligent health monitoring applications.

2. Materials and Methods

2.1. Sensor Design and Materials

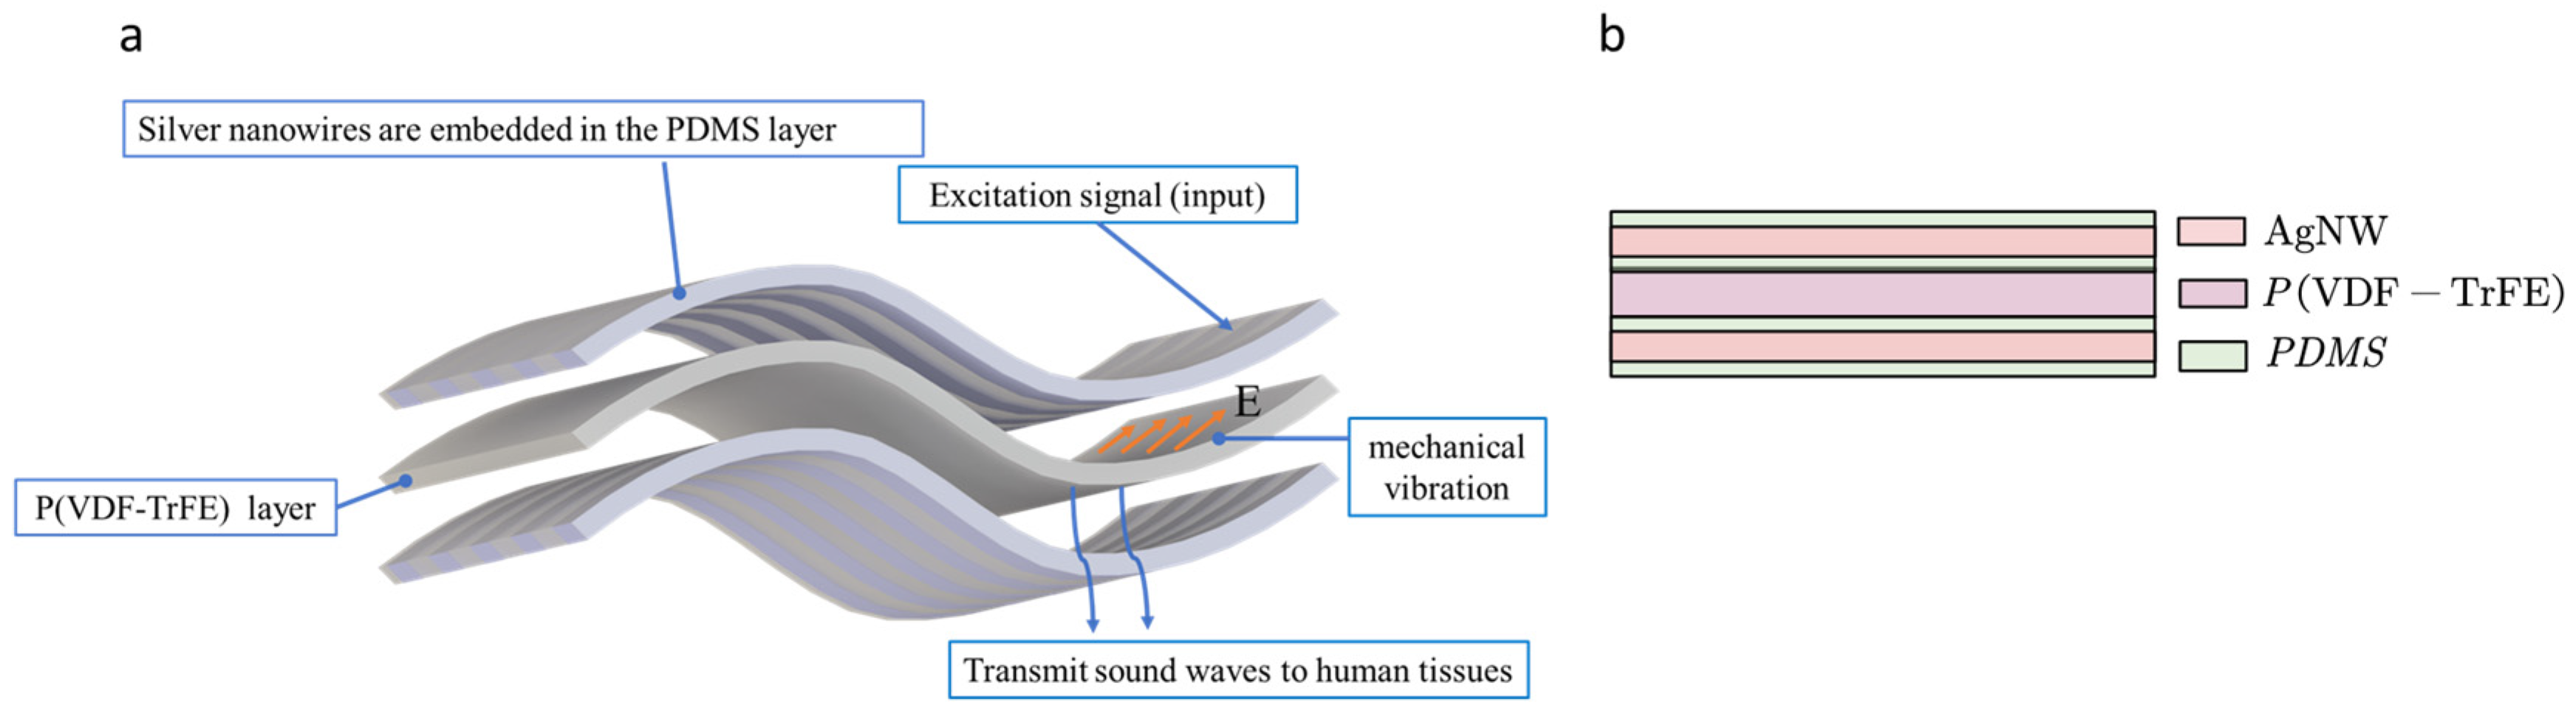
The flexible device comprises a P(VDF-TrFE)-based piezoelectric array, silver nanowire electrodes, and a PDMS substrate [30]. The P(VDF-TrFE) layer serves as the active piezoelectric component and offers several advantages, including high flexibility and conformability, a suitable piezoelectric response for wearable applications, and compatibility with large-area, low-temperature fabrication, making it an attractive material for flexible piezoelectric sensors [31,32]. Meanwhile, piezoelectric materials remain an active area of research, particularly in the development of lead-free alternatives and performance optimization, which provides a broader context for this work [33,34]. The AgNW network enables mechanical compliance and wearable operation, while the PDMS substrate provides softness and elasticity, improving conformal contact with the body surface and mitigating mechanical damage during deformation [35,36]. The overall three-dimensional architecture of the device is shown in Figure 1a, and its cross-sectional configuration is shown in Figure 1b.

2.2. Signal Acquisition and Circuit Design

The sensor array was connected to a multichannel low-noise analog front end. Each channel employed an MCP6022 differential amplifier (manufactured by Microchip Technology Inc., Chandler, AZ, USA) for preamplification, followed by a home-made band-pass filter (20–500 kHz) to suppress environmental noise. A MCP6023 rail-to-rail operational amplifier (manufactured by Microchip Technology Inc., Chandler, AZ, USA) buffered the DAC output, ensuring uniform excitation of the piezoelectric elements. Signals were digitized using a home-made 16-bit ADC integrated in a microcontroller unit (MCU) at a 500 kS/s sampling rate. The MCU controlled sequential channel switching, timing, and data transmission to the host PC for processing. The circuit connection is shown in Supplementary Materials Figures S1 and S2.

2.3. Acoustic Measurement Setup

Ultrasonic experiments were conducted in water, rigid substrates, and ex vivo biological tissue models (e.g., chicken egg samples) used as soft-tissue analogues. The egg-based model provides heterogeneous internal structures, including shell, membrane, and fluid regions, which partially mimic acoustic impedance variations in biological tissues [37,38,39,40].

2.4. CNN-Based Signal Analysis

To further improve signal interpretation and reliability, raw echo signals were organized into time-domain tensors and fed into a convolutional neural network (CNN) consisting of three convolutional layers with ReLU activation and one fully connected classification layer [41]. The network classified signals as valid or corrupted. Training employed the Adam optimizer with a learning rate of 0.001, using cross-entropy loss for 1000 iterations [42]. Data were split into training, validation, and test sets at a 6:2:2 ratio, maintaining class balance. The specific training parameters are shown in Table 1.
In this study, the cross-entropy loss function was used and is defined as follows [43]:
L = 1 N y i log p i + 1 y i log 1 p i
where N is the batch size, yi is the ground-truth label of sample i (1 for abnormal and 0 for normal), and pi is the predicted probability that the sample is abnormal [44].
All materials, code, and protocols are available upon reasonable request. No human or animal subjects were directly involved in this study. Ethical approval was not required.

3. Results

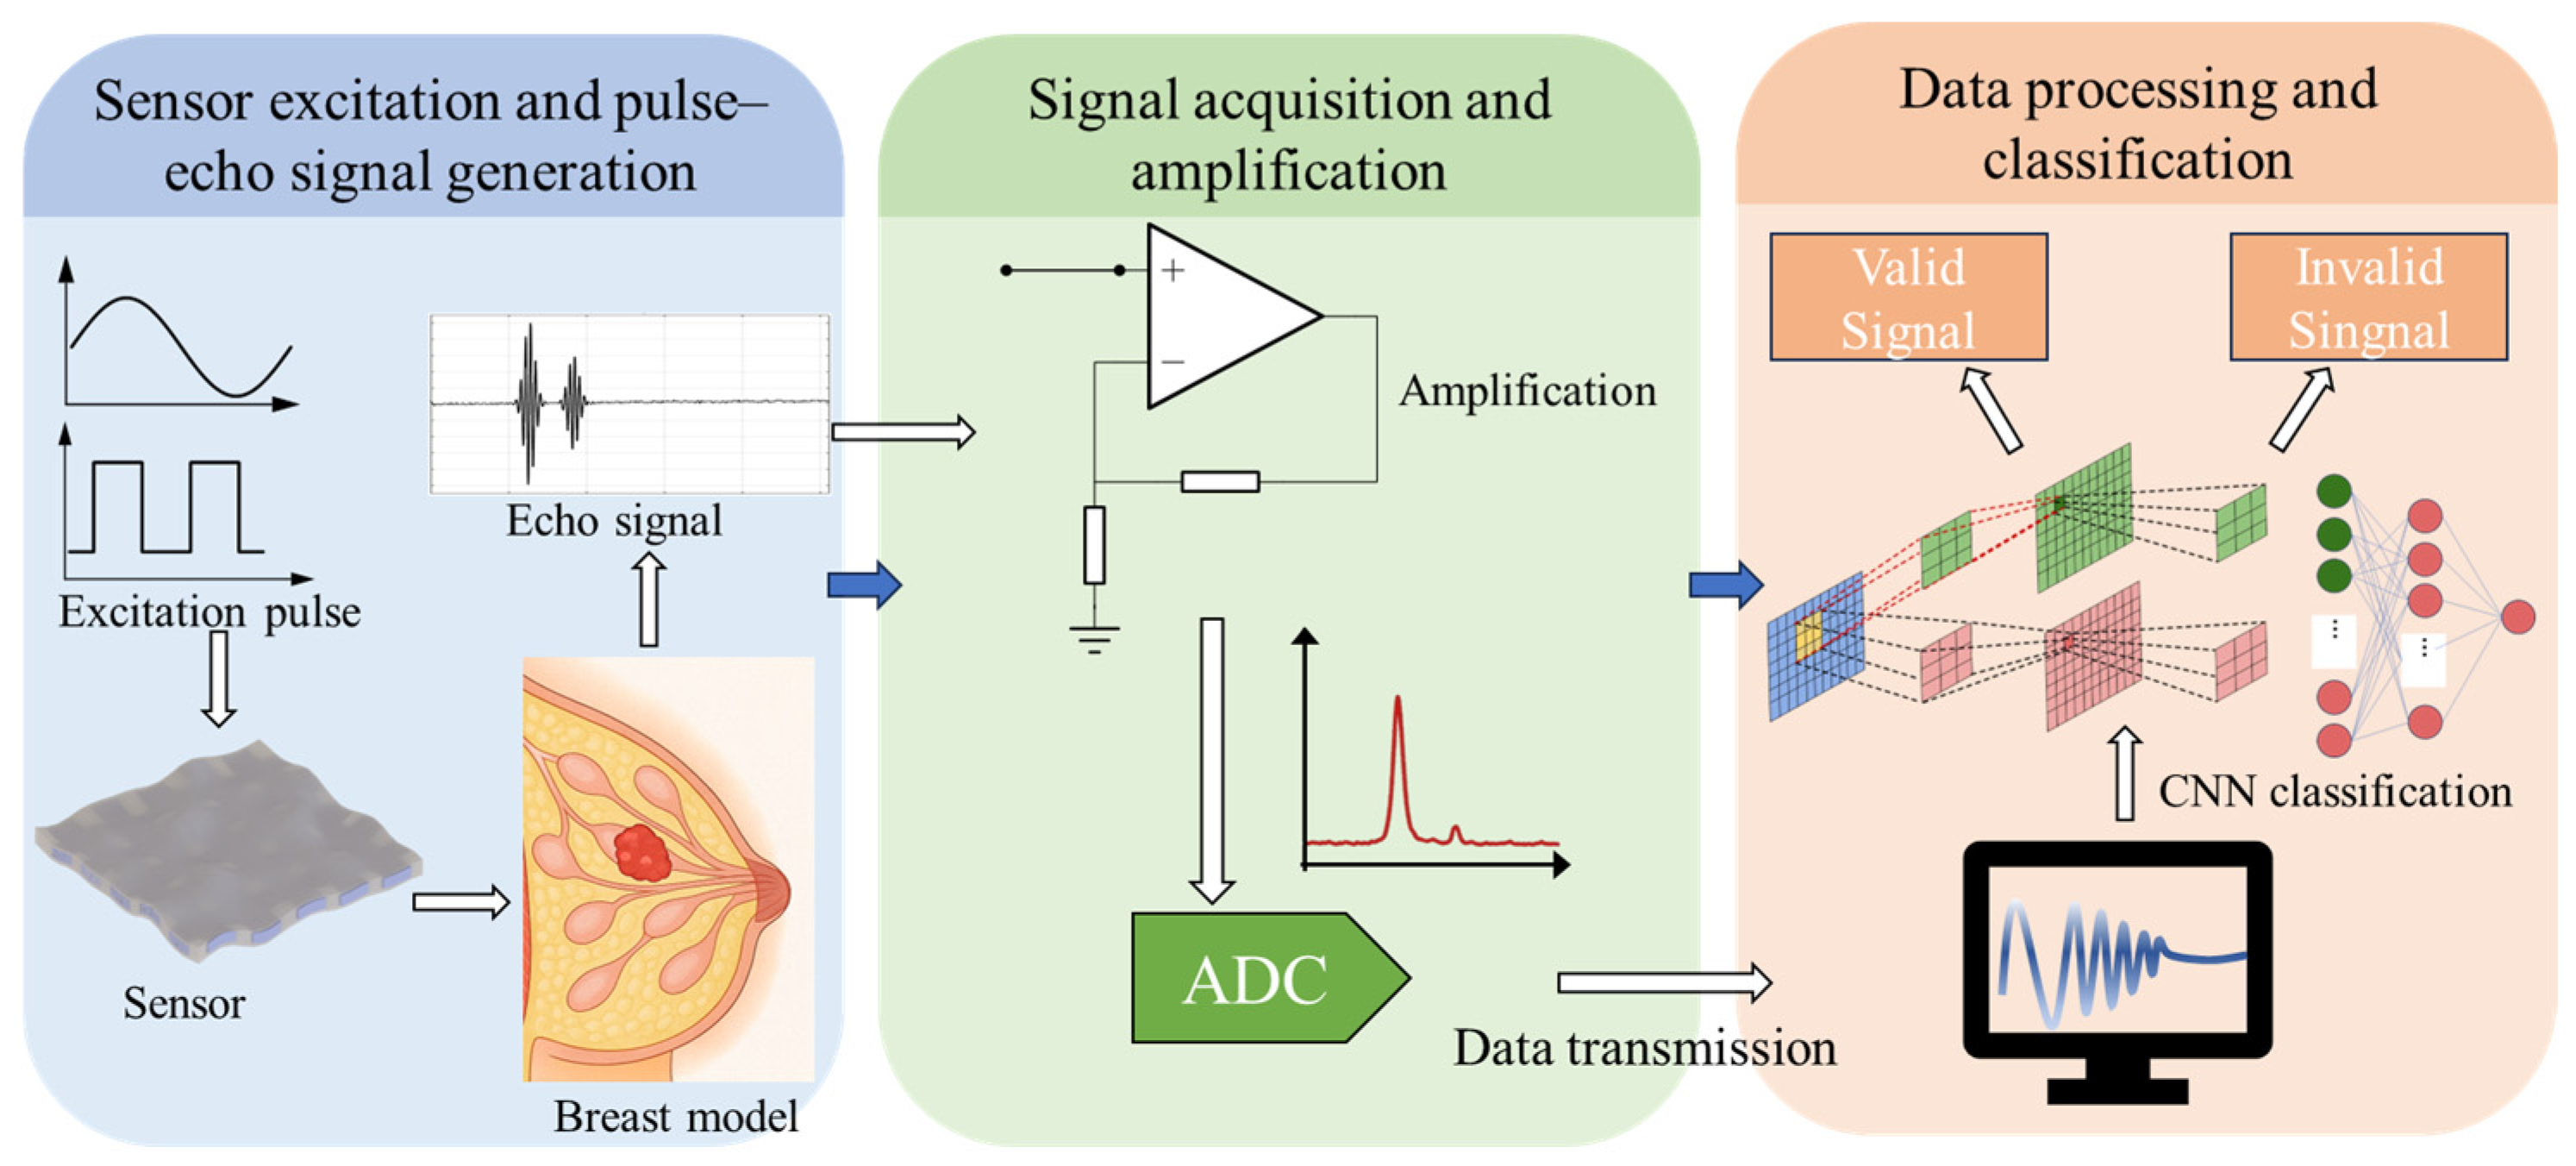
The complete workflow of this study is illustrated in Figure 2. First, excitation signals generated by the DAC are used to drive the sensor to emit ultrasonic waves, thereby obtaining echo signals from human tissues. The echo signals are then acquired by the ADC, and a convolutional neural network is further employed to classify the signals into valid and invalid categories.

3.1. Signal Acquisition Performance and System Stability

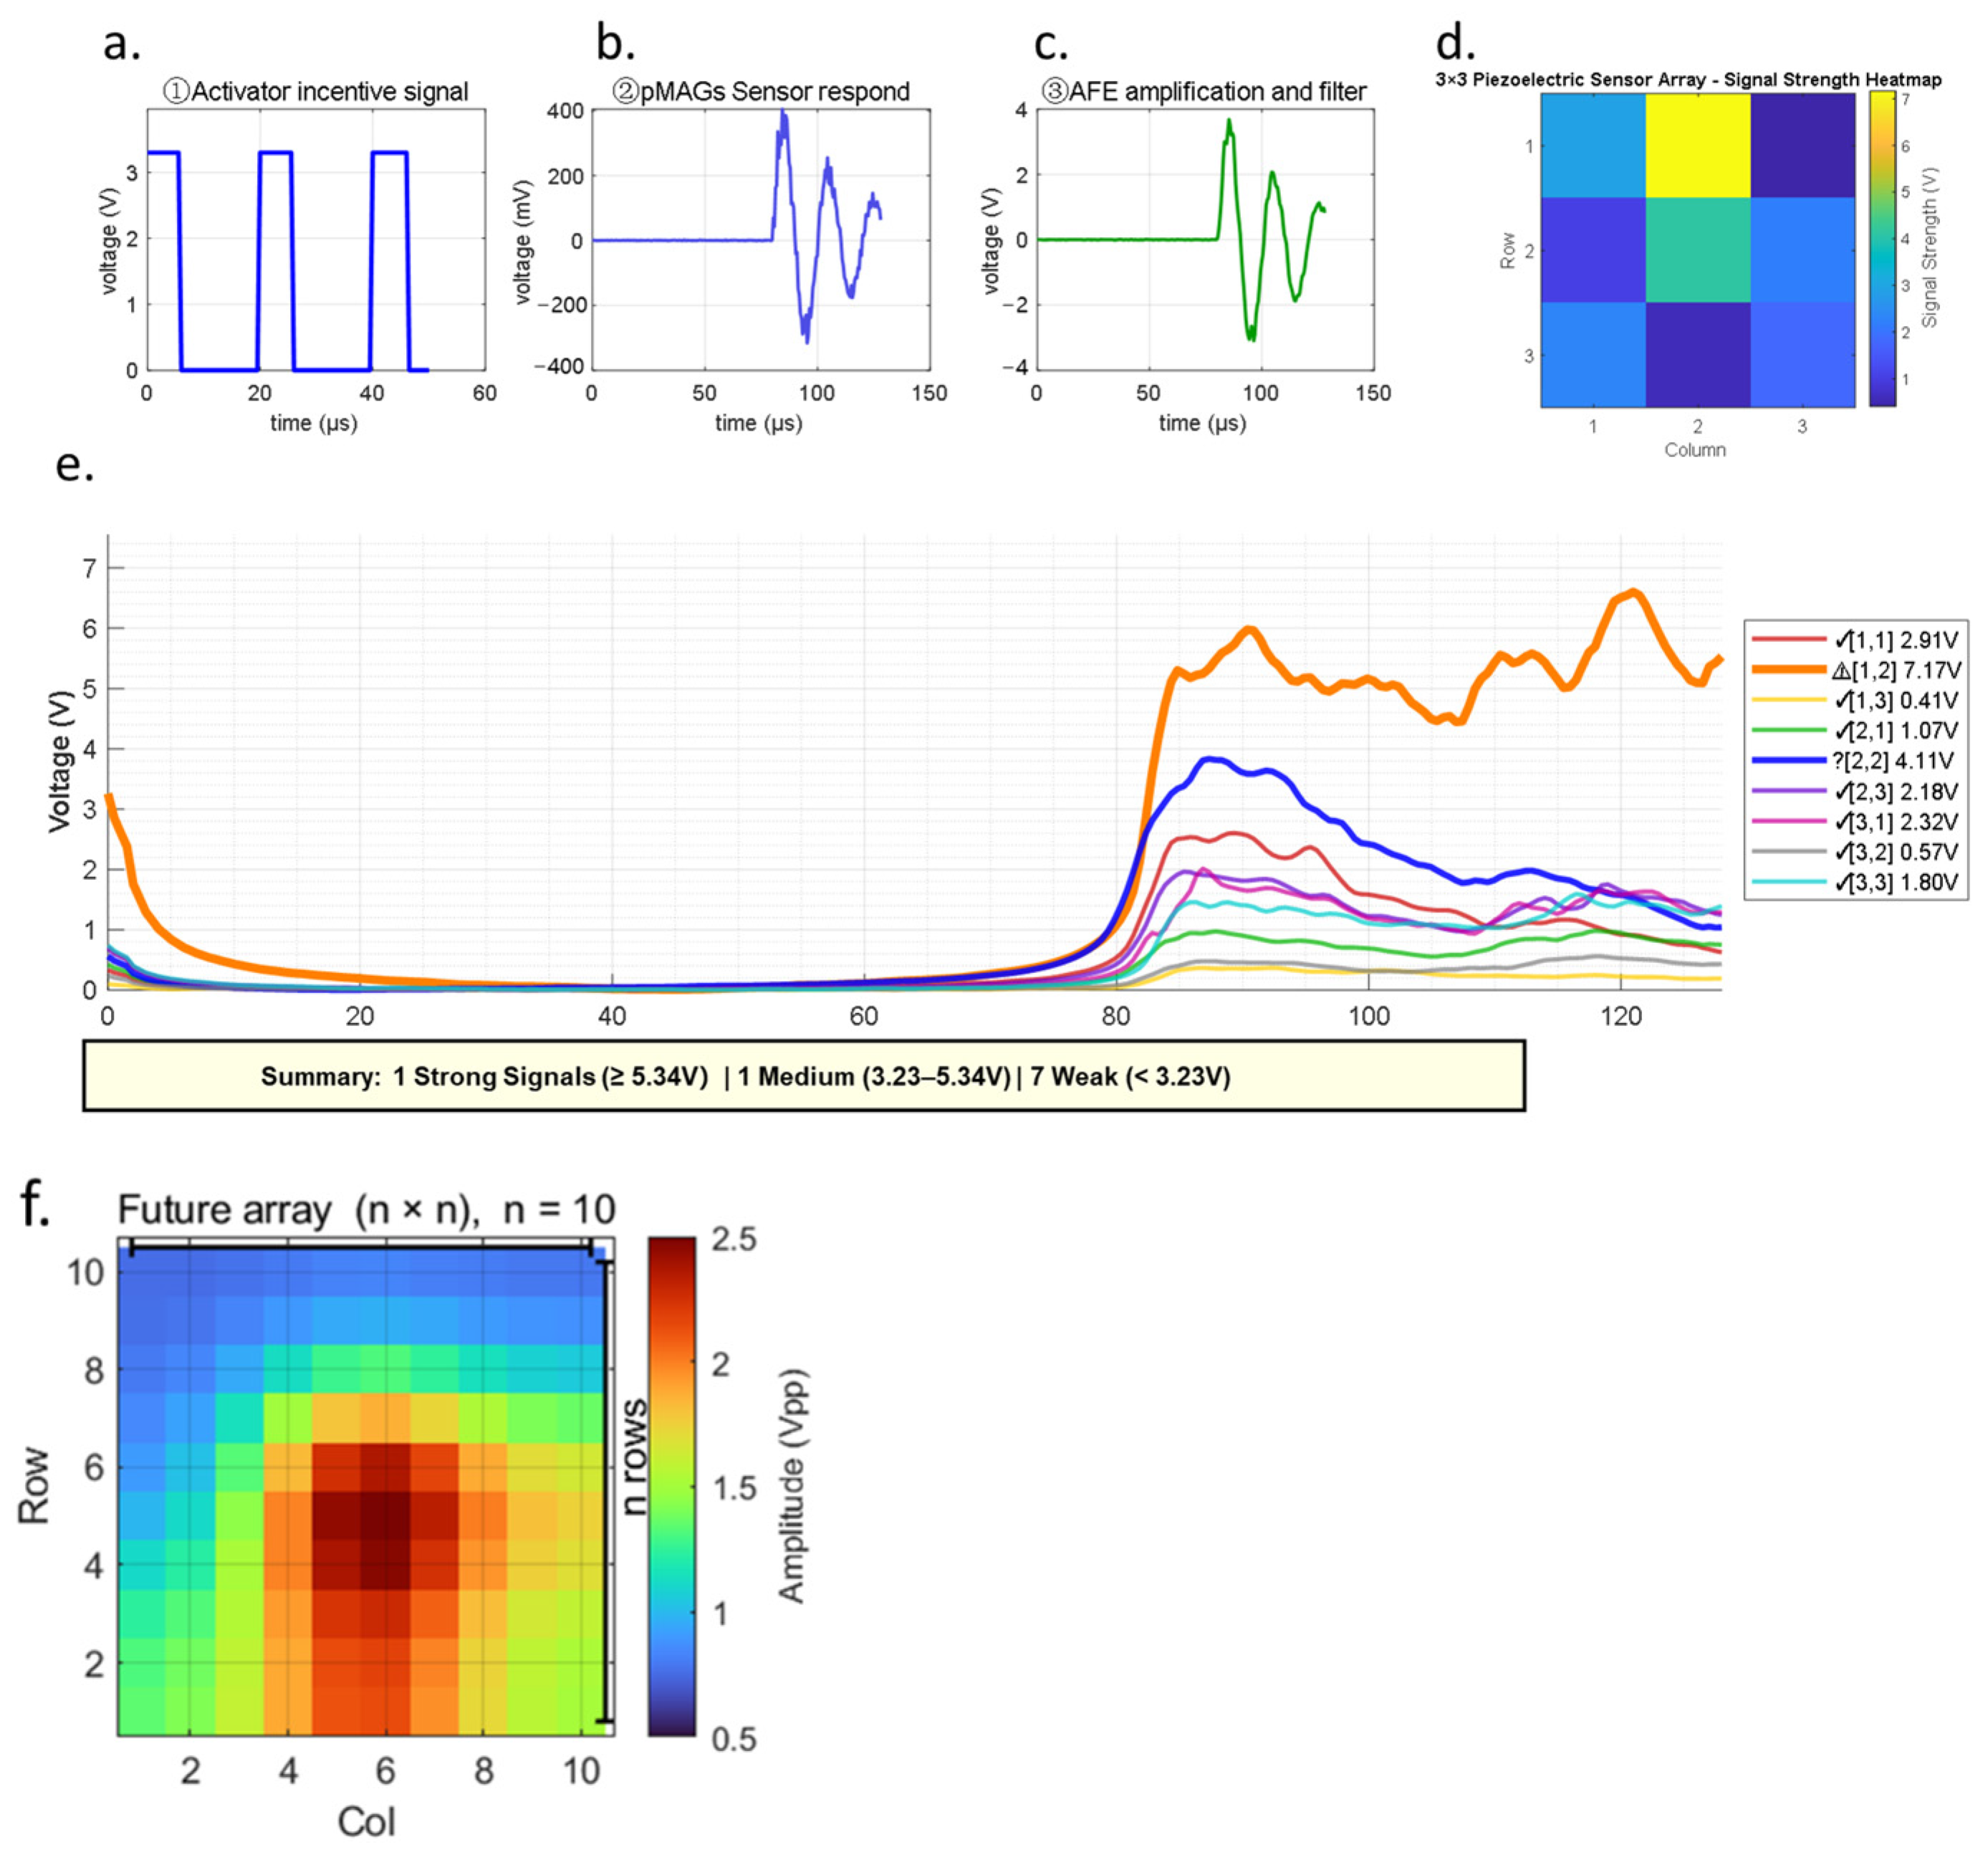
The performance of the sensing system was first evaluated in terms of signal acquisition and stability, followed by multichannel assessment using a 3 × 3 sensor array, as shown in Figure 3a–e. The system successfully achieved synchronized excitation, signal acquisition, and spatial mapping across all channels.
The resulting amplitude heatmaps reveal clear spatial variation in echo intensity, enabling localization of abnormal regions. Simulation results for a larger 10 × 10 array (Figure 3f) indicate that increasing array density can further improve spatial resolution without significant signal degradation.
These results demonstrate the scalability of the proposed system and its potential for high-resolution, large-area acoustic sensing applications.
In Figure 3a, the DAC module generates a square-wave excitation signal with a frequency of 180 kHz and an amplitude of approximately 3.3 V. This periodic waveform serves as the driving signal to induce mechanical vibration and acoustic responses in the piezoelectric array. When the excitation is applied to the sensor, a pulsed echo response is produced through the inverse piezoelectric effect, as shown in Figure 3b. The resulting echo signal has an amplitude in the microvolt-to-millivolt range and therefore cannot be directly digitized without appropriate signal conditioning.
To analyze these extremely weak bioacoustic signals, the analog front end (AFE) provides a high-gain, low-noise signal conditioning stage. Through cascaded amplification and subsequent digital enhancement, the system achieves a total gain of approximately 80 dB, effectively raising microvolt-level echo signals above the quantization threshold of the 16-bit ADC. This process enables the system to reliably resolve subtle backscatter variations above the system noise floor.
After amplification and band-pass filtering through the AFE, the output signal exhibits a stable oscillatory waveform with peak amplitudes around ±4 V, as shown in Figure 3c. This indicates that the echo signals from the piezoelectric elements have been effectively captured and conditioned by the low-noise amplification stage. Using the sampled data from all array elements, a 3 × 3 amplitude heatmap can be generated, as illustrated in Figure 3d. Color contrast reveals spatial variations in response amplitude, with a pronounced anomaly detected at the first row, second column, suggesting the presence of abnormal tissue. The digitized waveform shown in Figure 3e corresponds to signals acquired with a 16-bit ADC at a 500 kS/s sampling rate.
On this basis, Figure 3f further demonstrates the scalability of the array design toward an n × n configuration (here n = 10). The expanded heatmap indicates that higher-density arrays can provide improved spatial resolution and enhanced sensitivity, making them well-suited for large-area echo imaging and multipoint sensing applications. Overall, these simulations verify that the developed piezoelectric sensor array offers stable excitation, effective signal extraction, and good inter-channel consistency, thereby establishing a scalable foundation for future high-density piezoelectric sensing systems [45].

3.2. Acoustic Response Under Different Media

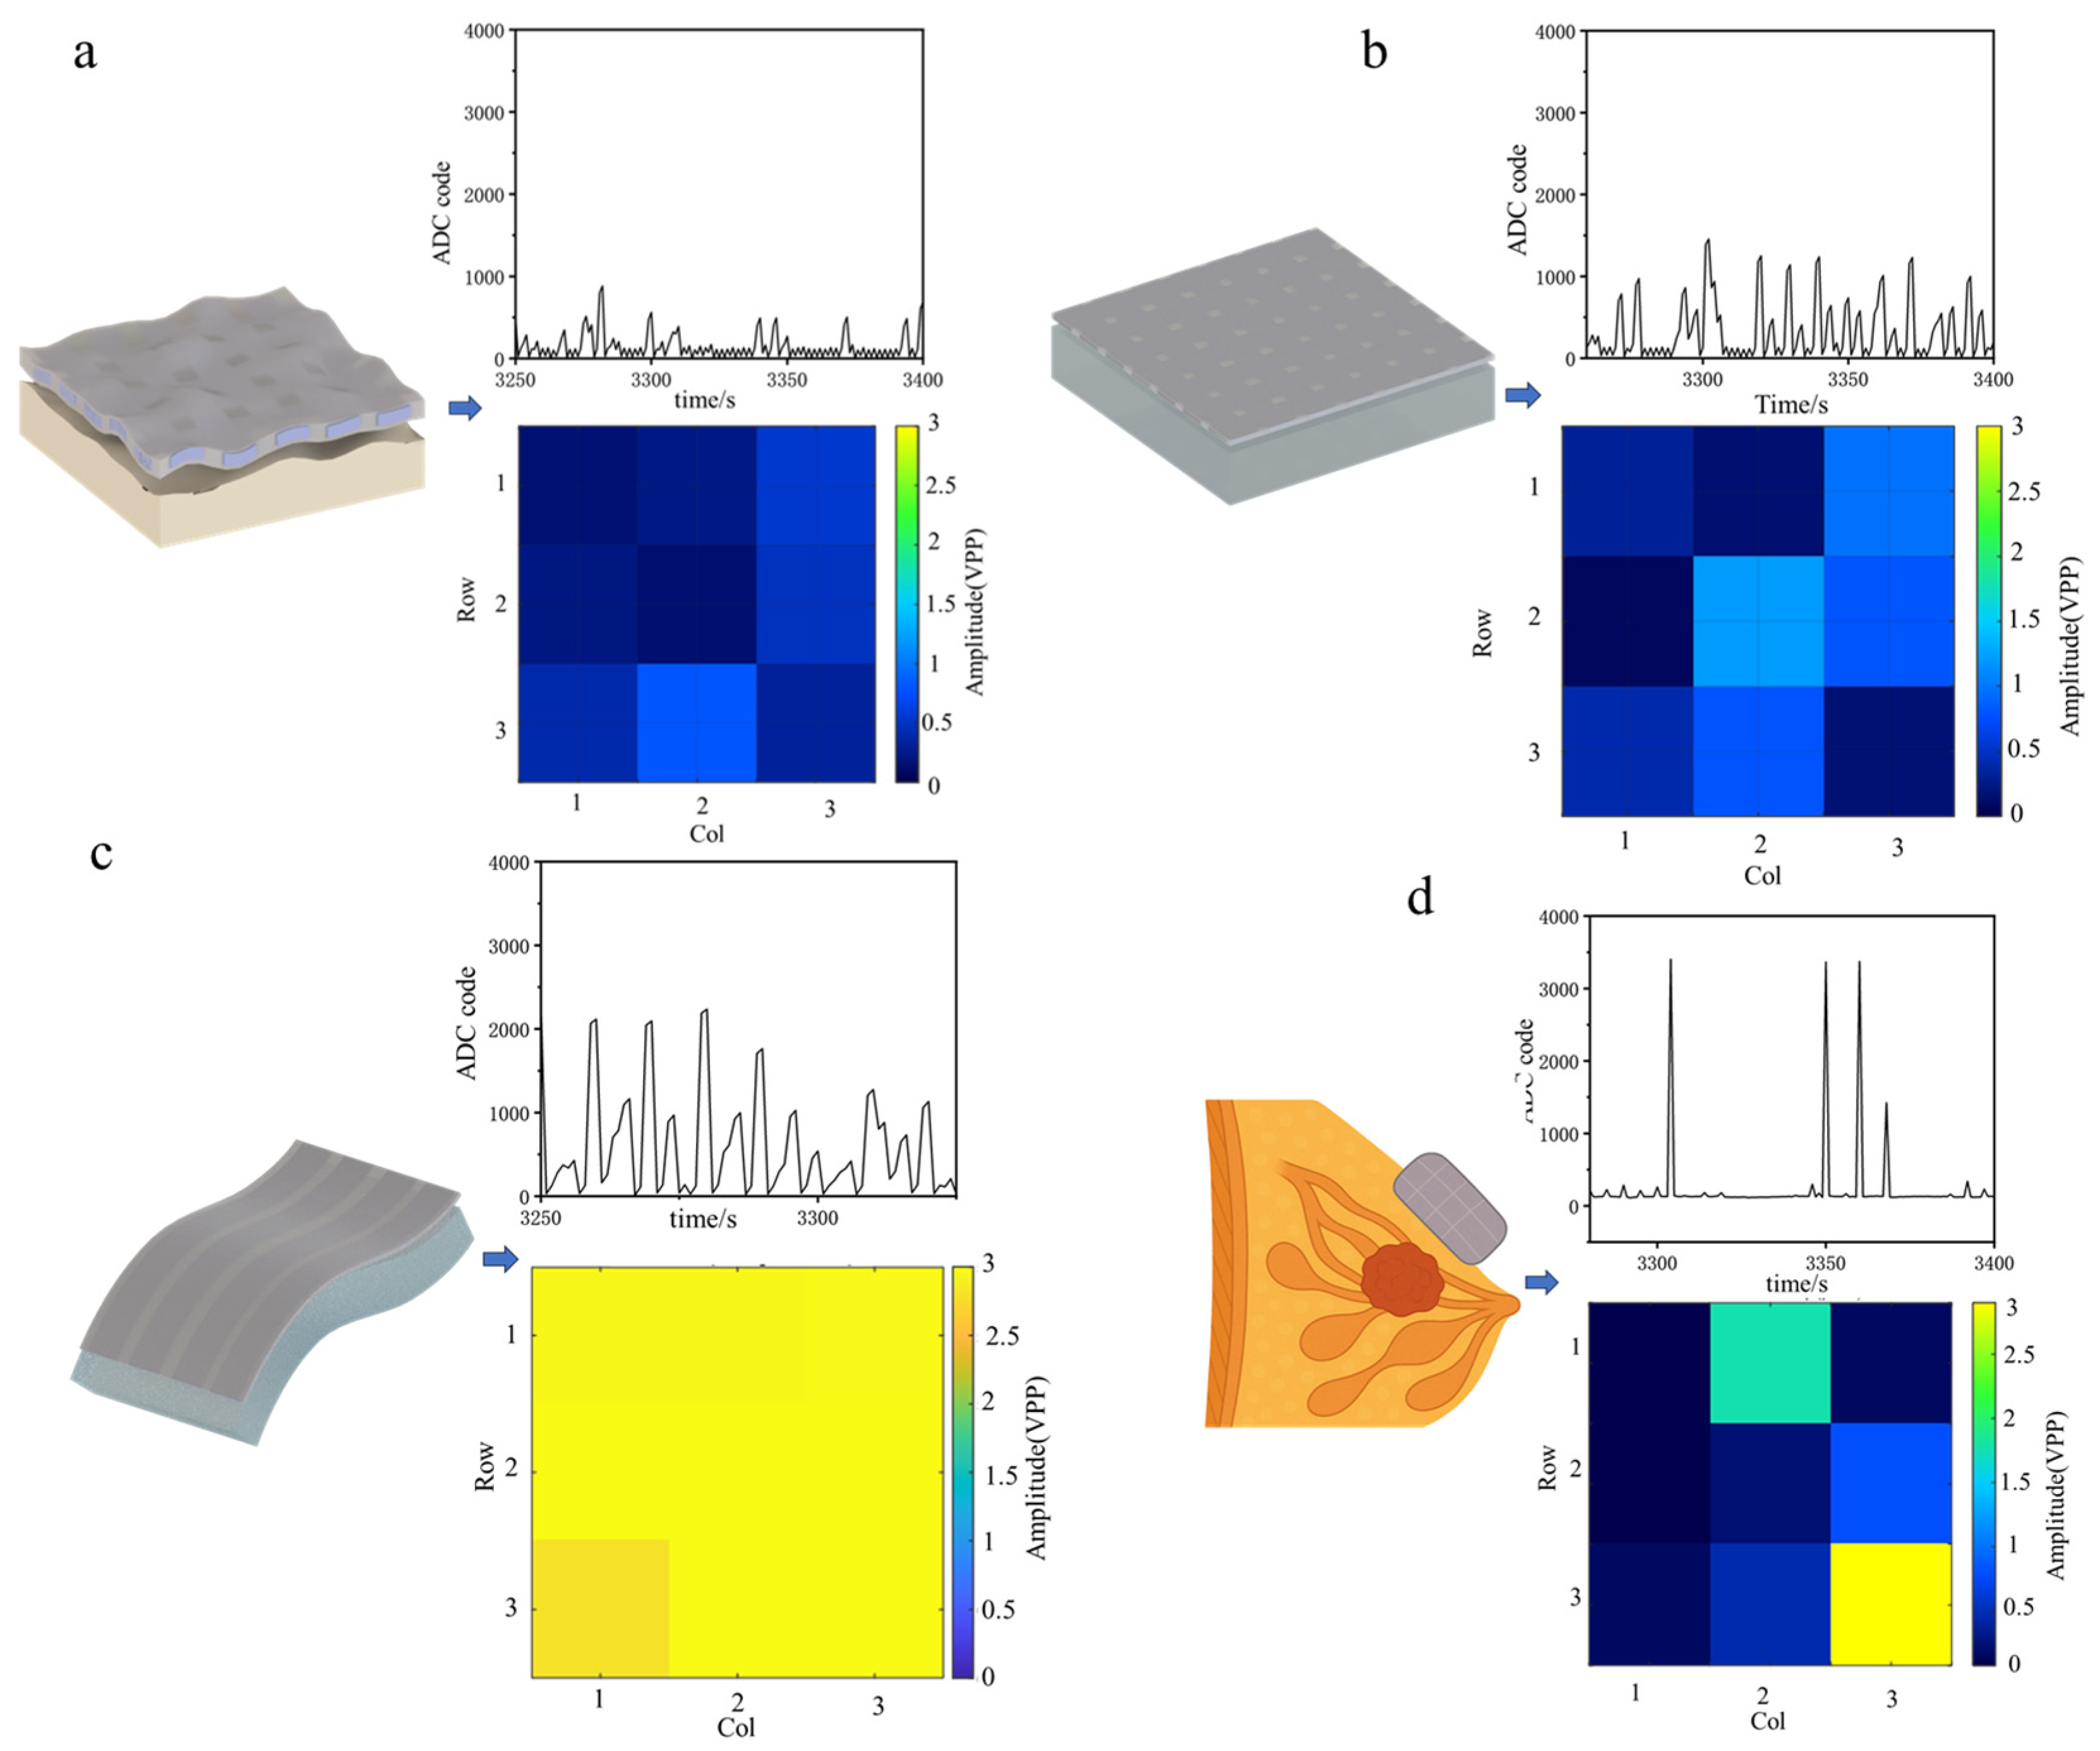
As shown in Figure S3 in the Supplementary Materials, to investigate the sensitivity of the sensor to different acoustic environments, experiments were conducted in water, rigid materials, and soft-tissue analogues (egg-based models). As shown in Figure 4a–c, the system produced distinct echo responses depending on the acoustic impedance and mechanical properties of the medium.
In water, the echo signals exhibited smooth decay and high temporal consistency due to minimal impedance mismatch. In contrast, rigid substrates generated stronger reflections and higher-amplitude oscillatory responses, reflecting significant impedance discontinuities. The soft-tissue analogue produced more complex and spatially distributed echo patterns due to its heterogeneous internal structure.
These results demonstrate that the sensor system is capable of distinguishing materials with different acoustic properties and can sensitively respond to variations in impedance and structural composition.
As shown in Figure 4d, regions containing internal anomalies exhibited distinct echo characteristics compared with homogeneous regions. In particular, the presence of embedded lesions or internal interfaces resulted in localized amplitude enhancement, waveform distortion, and phase variation. These variations were clearly visualized in the spatial heatmaps, where abnormal regions exhibited significantly higher signal intensity. The Figure S4 in the Supplementary Materials can further illustrate its sensitivity.
These findings indicate that the system is sensitive to local variations in mechanical stiffness and acoustic impedance, enabling the detection of heterogeneous structures within biological-like media.

3.3. CNN-Based Signal Validation and Classification

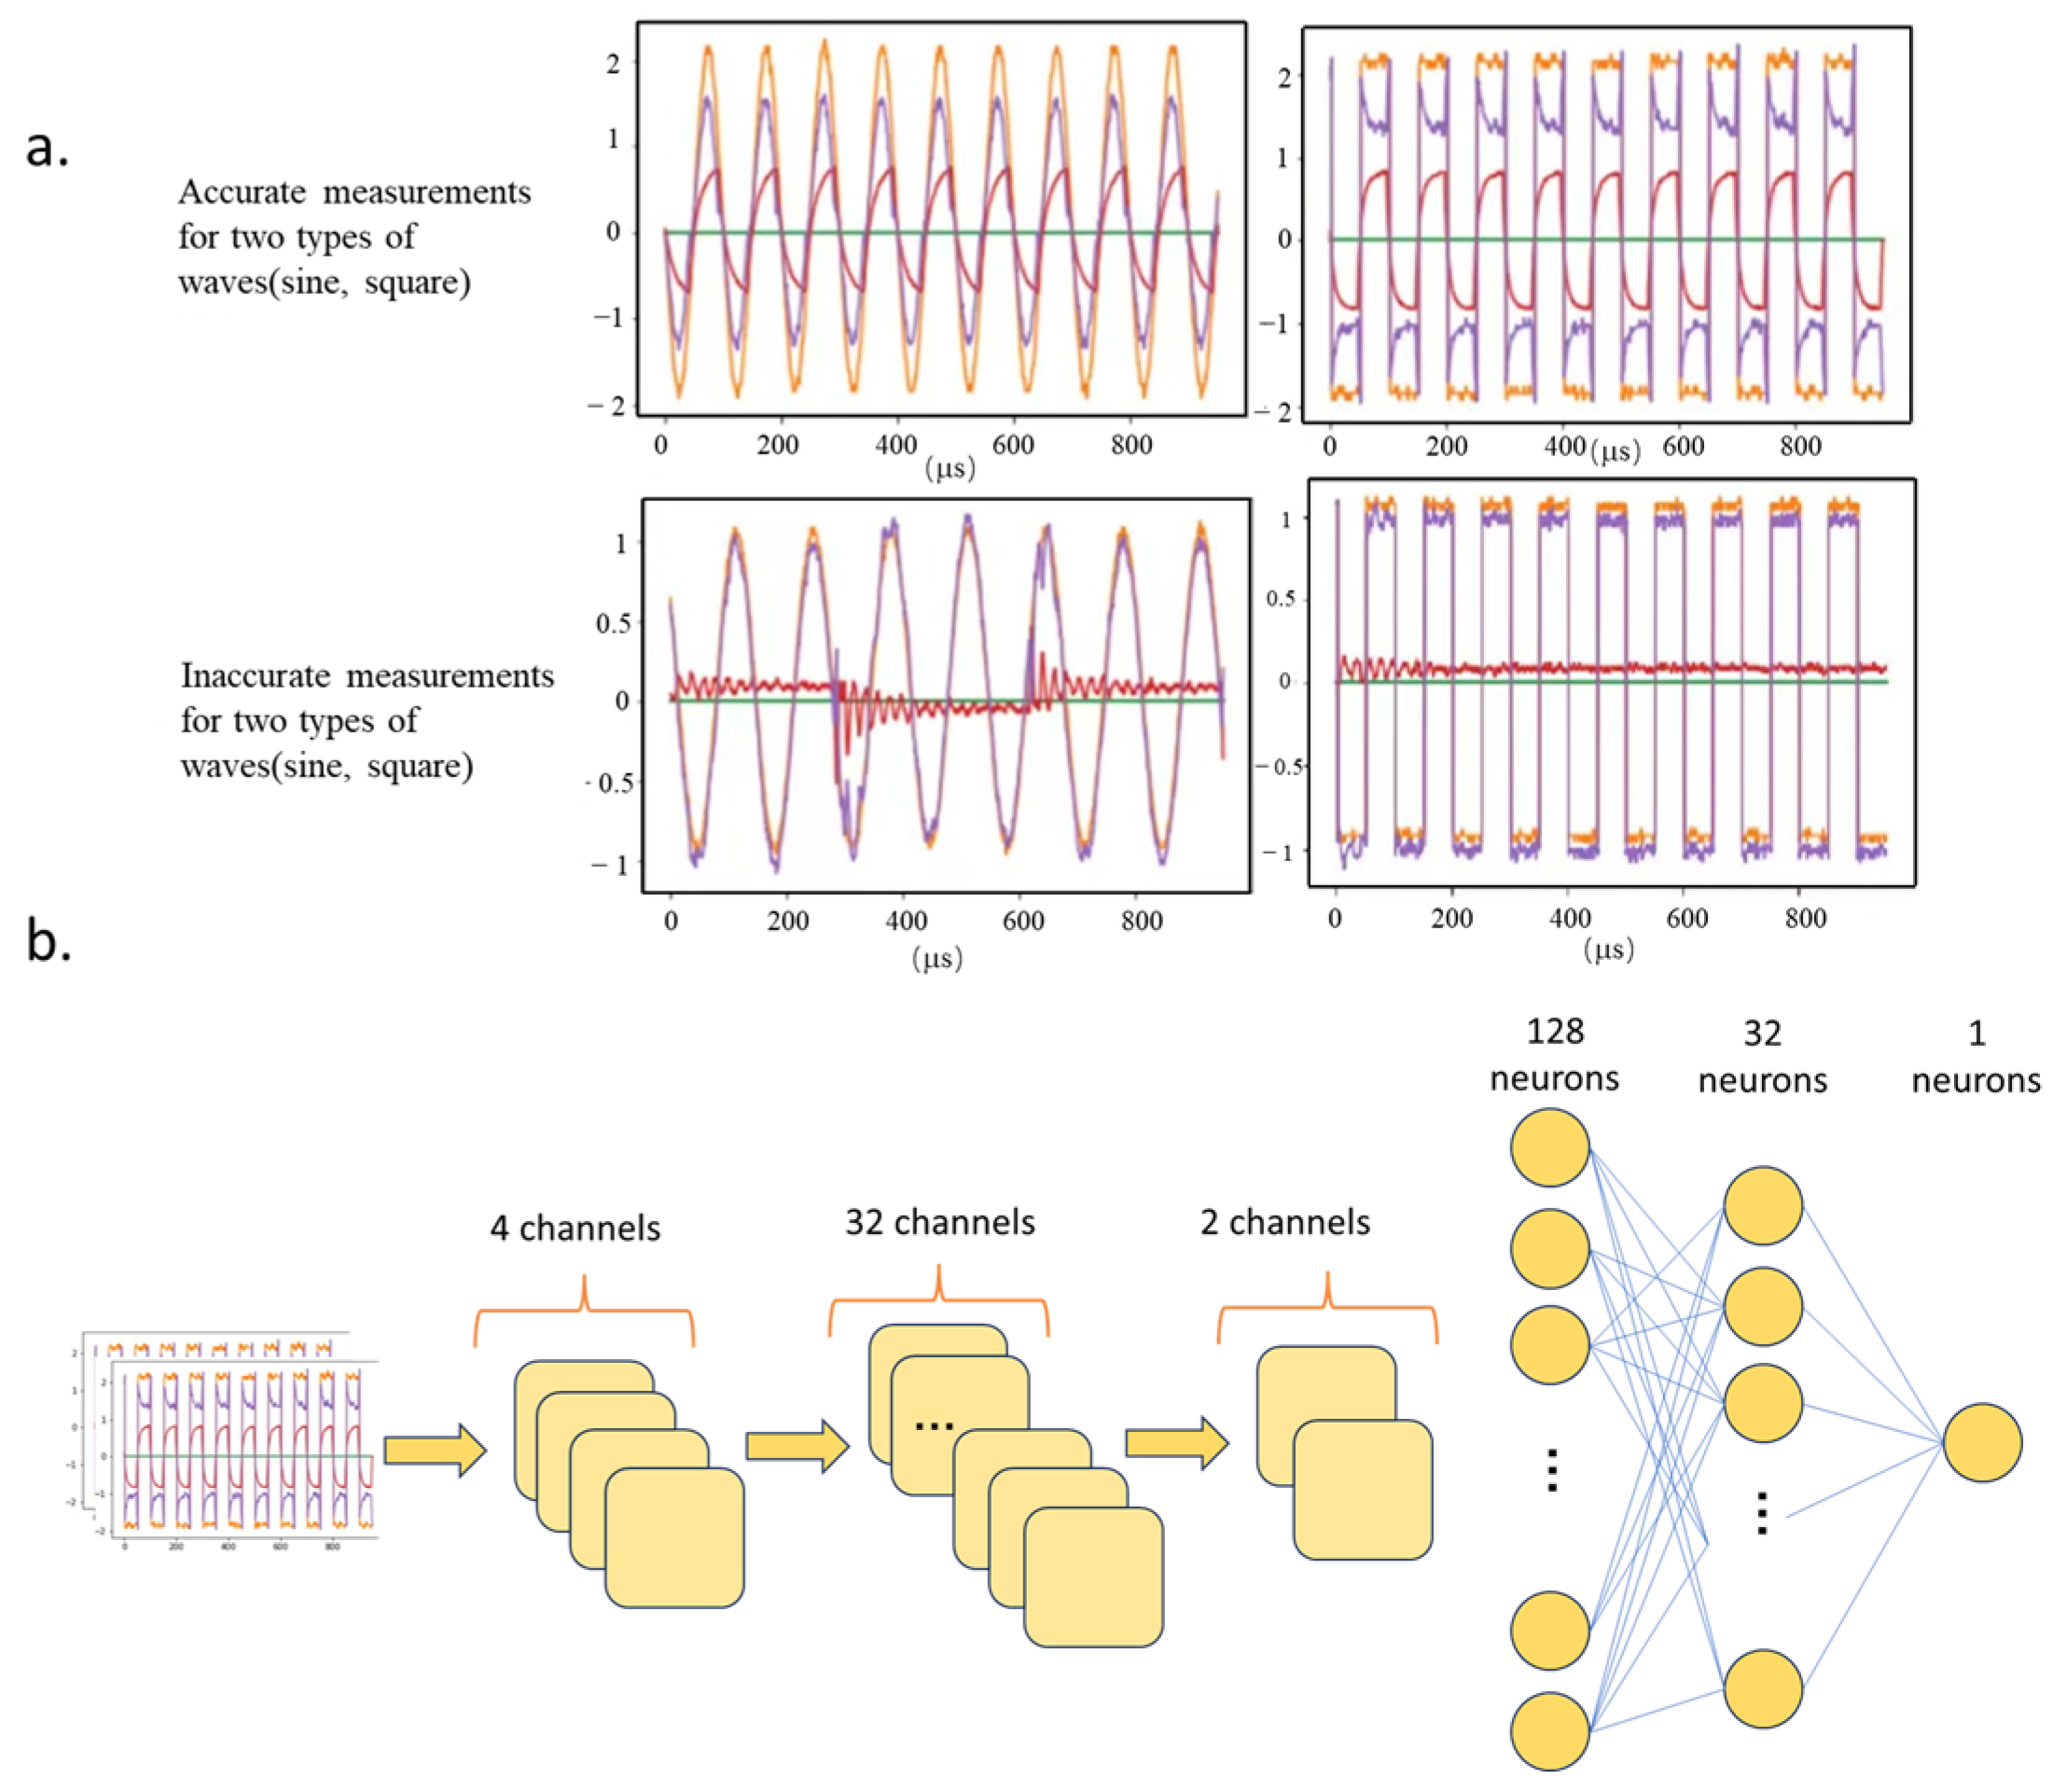
To improve signal reliability, a convolutional neural network (CNN) was employed to distinguish valid echo signals from corrupted measurements [46]. Representative waveforms shown in Figure 5a indicate that valid signals exhibit smooth and consistent patterns, whereas invalid signals display noise fluctuations, distortion, and temporal misalignment.
As shown in Figure 5b, raw time-series signals were fed into the model for abnormality assessment. The network consists of three convolutional layers, which progressively extract increasingly complex features: the first layer uses four channels to capture basic local patterns, the second expands to 32 channels to learn higher-dimensional representations, and the third compresses the output to two channels to preserve critical information while reducing parameter count. The resulting features are then flattened and passed to a fully connected layer, which outputs a binary classification indicating whether the signal is normal or erroneous.
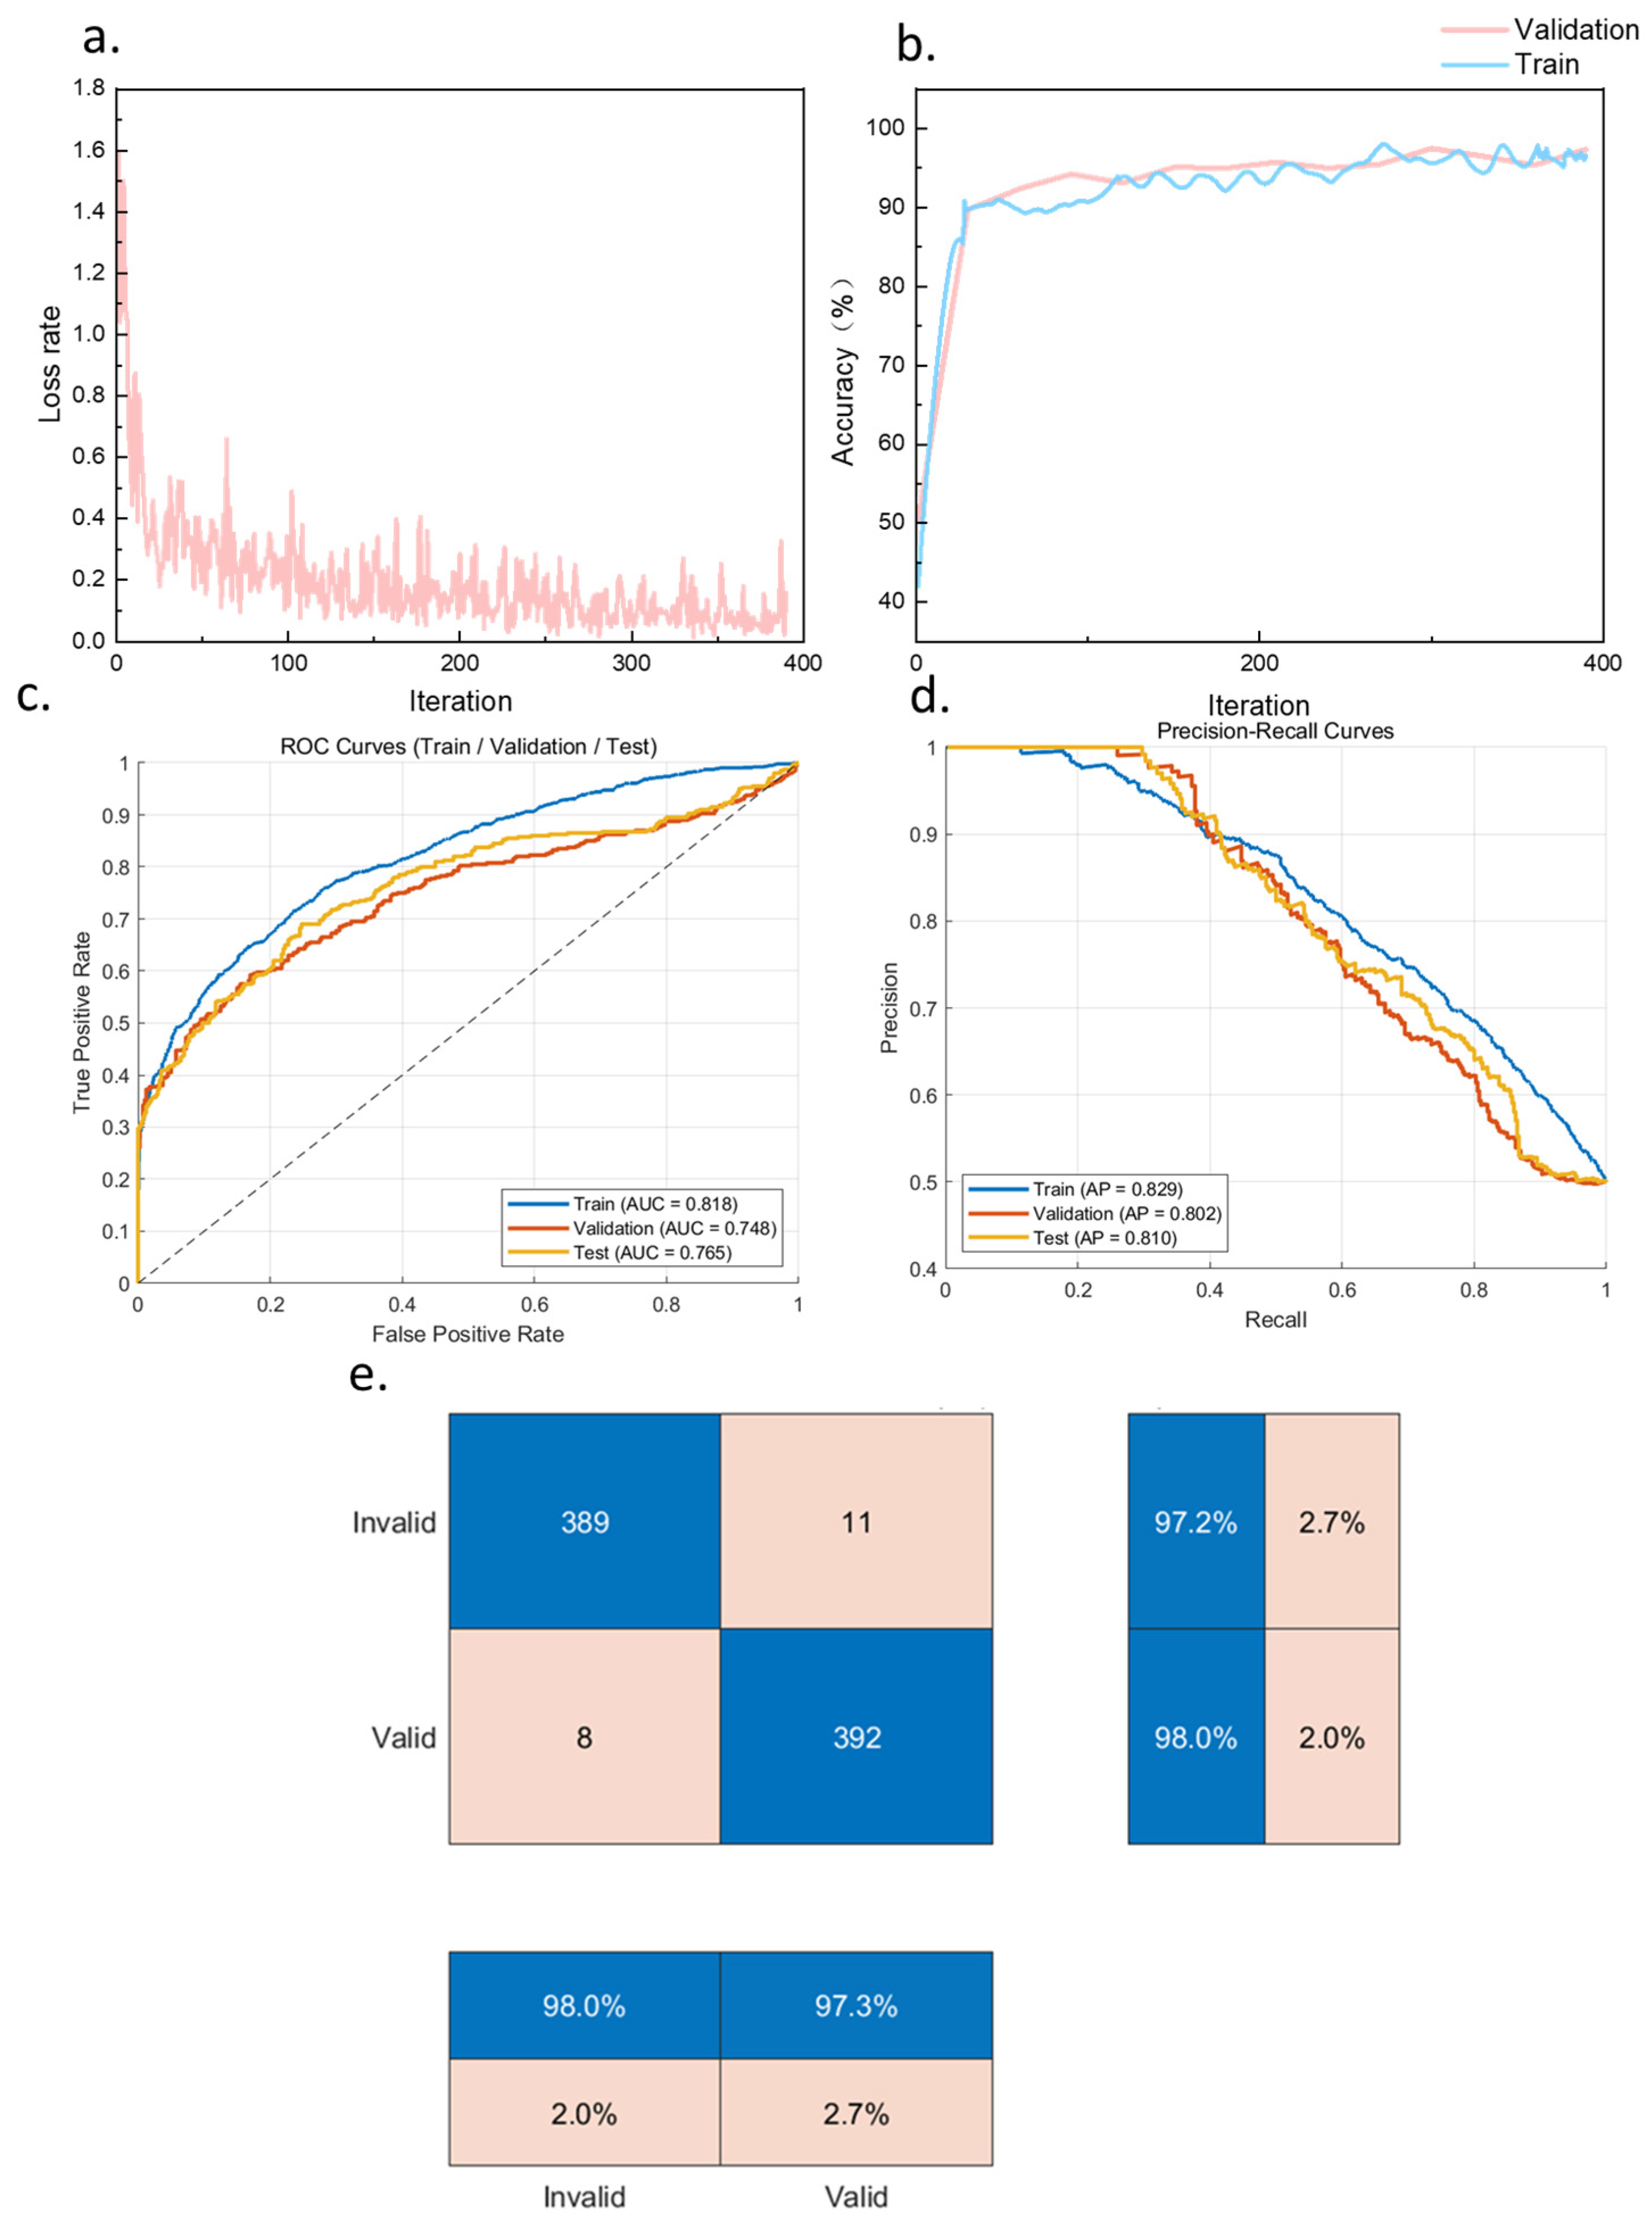
The CNN model achieved a classification accuracy exceeding 96% on the test dataset, with stable convergence observed during training (Figure 6a,b). The ROC and PR curves (Figure 6c,d) further demonstrate robust discriminative performance, with consistent results across training, validation, and test sets.
Figure 6a shows the evolution of the loss function during training. The results indicate that the model parameters gradually stabilized over the course of iteration, with no obvious divergence observed, suggesting that the proposed model could be optimized reliably under the current data conditions and effectively distinguish valid from invalid echo signals. Figure 6b presents the corresponding accuracy curves during training. As the number of iterations increased, the accuracy on both the training and validation sets rose rapidly and reached a high level at an early stage, indicating that the convolutional neural network was able to quickly learn discriminative features from the echo signals. Both curves then remained stable and converged to above 96%, demonstrating good convergence and training stability. Moreover, the small gap and limited fluctuation between the training and validation curves suggest that no evident overfitting occurred and that the model achieved good generalization performance. Figure 6c shows that the model achieved consistent discriminative performance across the training, validation, and test sets, with AUC values of 0.818, 0.748, and 0.765, respectively. All ROC curves remained above the random-classifier baseline, indicating effective separation of positive and negative samples. The similar AUC values for the validation and test sets further suggest stable performance on unseen data, with no evidence of severe overfitting despite the slightly higher AUC on the training set. In Figure 6d, the PR curves further confirmed the robustness of the model across datasets. The AP values reached 0.829, 0.802, and 0.810 on the training, validation, and test sets, respectively, indicating a favorable balance between precision and recall. Although precision declined with increasing recall, as expected for binary classification, the curves remained consistently high, supporting stable positive-class recognition. As shown in Figure 6e, the confusion matrix results indicate that the model achieves an accuracy of approximately 97%.
The small performance gap between datasets suggests that the model achieved good generalization without significant overfitting. These results indicate that the CNN effectively improves signal reliability by filtering out corrupted data prior to further analysis.

4. Conclusions

Based on the above experimental results, this work establishes a wearable diagnostic platform that integrates functional materials, low-noise electronics, and machine learning within a unified sensing architecture [45]. By combining AgNW/P(VDF-TrFE)-based piezoelectric sensing with CNN-enabled signal interpretation, the system is able to not only detect weak bioacoustic responses, but also extract diagnostically relevant information in real time. These results highlight the potential of coupling intrinsically responsive materials with intelligent algorithms to create closed-loop systems for signal acquisition, feature analysis, and decision support. Recent advances in flexible and wearable ultrasound devices, including innovations in materials, structural designs, and wearable imaging patches, further support the broad potential of such systems for continuous health monitoring and personalized medicine [46,47,48].
At the same time, this study remains a proof of concept. Validation was limited to breast phantoms and benchtop experiments, and the performance of the device in heterogeneous living tissues has not yet been established. Further in vivo studies in animal models or human subjects will therefore be required before clinical translation can be considered [49]. Looking ahead, this platform provides a promising foundation for expansion into a wearable intelligent diagnostic network, supporting coordinated operation between multimodal sensing and cloud-based intelligent analysis for continuous health monitoring and personalized medical intervention [50]. Beyond breast abnormality detection, the platform may also find broader applications in cardiovascular function monitoring, tissue elasticity imaging, and neural pulse sensing.

Supplementary Materials

The following supporting information can be downloaded at https://www.mdpi.com/article/10.3390/app16126126/s1. Figure S1: The test circuit [51]; Figure S2: The test conducted under different conditions; Figure S3: The sensor can receive different signals and reflect their differences; Figure S4: Schematic diagram of the amplification filter circuit.

Author Contributions

Conceptualization, J.H.; methodology, Z.S., Q.C., R.L.H., S.H., J.L., P.Z., L.Z. and J.H.; software, Z.S., Q.C. and R.L.H.; validation, S.H., Z.S., Q.C. and R.L.H.; formal analysis, Z.S. and R.L.H.; investigation, J.H.; writing—original draft preparation, Z.S., R.L.H. and J.H.; writing—review and editing, J.H.; supervision, J.H. All authors have read and agreed to the published version of the manuscript.

Funding

This work is supported by HBUT under award number GCC20220002. The work was supported by the US Department of Energy, Office of Basic Energy Sciences, Division of Materials Sciences and Engineering under Contract No. DE-AC02-05CH11231. The authors would like to thank JS Nanotechnologies LLC for their support (Contract No. JS-Nano-1901110).

Institutional Review Board Statement

Not applicable.

Informed Consent Statement

Not applicable.

Data Availability Statement

Data are available upon reasonable request.

Conflicts of Interest

The authors (Z.S. and J.H.) filed patents based on this technology. Author Jeongmin Hong was employed by the company “4R&D Division, JS Nanotechnologies, LLC, Fremont, CA 94538, USA”. The remaining authors declare that the research was conducted in the absence of any commercial or financial relationships that could be construed as potential conflicts of interest.

Abbreviations

The following abbreviations are used in this manuscript:
CNNConvolutional Neural Network
ADCAnalog-to-Digital Converter

References

  1. Bray, F.; Laversanne, M.; Sung, H.; Ferlay, J.; Siegel, R.L.; Soerjomataram, I.; Jemal, A. Global cancer statistics 2022: Globocan estimates of incidence and mortality worldwide for 36 cancers in 185 countries. CA Cancer J. Clin. 2024, 74, 229–263. [Google Scholar] [CrossRef] [PubMed]
  2. Siegel, R.L.; Giaquinto, A.N.; Jemal, A. Cancer statistics, 2024. CA Cancer J. Clin. 2024, 74, 12–49. [Google Scholar] [CrossRef] [PubMed]
  3. Hoffmann, E.; Masthoff, M.; Kunz, W.G.; Seidensticker, M.; Bobe, S.; Gerwing, M.; Berdel, W.E.; Schliemann, C.; Faber, C.; Wildgruber, M. Multiparametric mri for characterization of the tumour microenvironment. Nat. Rev. Clin. Oncol. 2024, 21, 428–448. [Google Scholar] [CrossRef] [PubMed]
  4. Schwenck, J.; Sonanini, D.; Cotton, J.M.; Rammensee, H.-G.; la Fougère, C.; Zender, L.; Pichler, B.J. Advances in pet imaging of cancer. Nat. Rev. Cancer 2023, 23, 474–490. [Google Scholar] [CrossRef] [PubMed]
  5. Rogers, J.A.; Someya, T.; Huang, Y. Materials and mechanics for stretchable electronics. Science 2010, 327, 1603–1607. [Google Scholar] [CrossRef] [PubMed]
  6. Kim, D.-H.; Lu, N.; Ma, R.; Kim, Y.-S.; Kim, R.-H.; Wang, S.; Wu, J.; Won, S.M.; Tao, H.; Islam, A.; et al. Epidermal electronics. Science 2011, 333, 838–843. [Google Scholar] [CrossRef] [PubMed]
  7. Xu, S.; Zhang, Y.; Jia, L.; Mathewson, K.E.; Jang, K.-I.; Kim, J.; Fu, H.; Huang, X.; Chava, P.; Wang, R.; et al. Soft microfluidic assemblies of sensors, circuits, and radios for the skin. Science 2014, 344, 70–74. [Google Scholar] [CrossRef] [PubMed]
  8. Someya, T.; Bao, Z.; Malliaras, G.G. The rise of plastic bioelectronics. Nature 2016, 540, 379–385. [Google Scholar] [CrossRef] [PubMed]
  9. Zhou, Z.; Lv, K.; Tsui, P.-H. Editorial: Recent advances in artificial intelligence-empowered ultrasound tissue characterization for disease diagnosis, intervention guidance, and therapy monitoring. Front. Physiol. 2023, 14, 1234611. [Google Scholar] [CrossRef] [PubMed]
  10. Zhou, S.; Park, G.; Lin, M.; Yang, X.; Xu, S. Wearable ultrasound technology. Nat. Rev. Bioeng. 2025, 3, 835–854. [Google Scholar] [CrossRef]
  11. Hu, H.; Huang, H.; Li, M.; Gao, X.; Yin, L.; Qi, R.; Wu, R.S.; Chen, X.; Ma, Y.; Shi, K.; et al. A wearable cardiac ultrasound imager. Nature 2023, 613, 667–675. [Google Scholar] [CrossRef] [PubMed]
  12. Lin, M.; Hu, H.; Zhou, S.; Xu, S. Soft wearable devices for deep-tissue sensing. Nat. Rev. Mater. 2022, 7, 850–869. [Google Scholar] [CrossRef]
  13. Lin, M.; Zhang, Z.; Gao, X.; Bian, Y.; Wu, R.S.; Park, G.; Lou, Z.; Zhang, Z.; Xu, X.; Chen, X.; et al. A fully integrated wearable ultrasound system to monitor deep tissues in moving subjects. Nat. Biotechnol. 2024, 42, 448–457. [Google Scholar] [CrossRef] [PubMed]
  14. Wang, C.; Li, X.; Hu, H.; Zhang, L.; Huang, Z.; Lin, M.; Zhang, Z.; Yin, Z.; Huang, B.; Gong, H.; et al. Monitoring of the central blood pressure waveform via a conformal ultrasonic device. Nat. Biomed. Eng. 2018, 2, 687–695. [Google Scholar] [CrossRef] [PubMed]
  15. Lim, H.-R.; Kim, H.S.; Qazi, R.; Kwon, Y.-T.; Jeong, J.-W.; Yeo, W.-H. Advanced soft materials, sensor integrations, and applications of wearable flexible hybrid electronics in healthcare, energy, and environment. Adv. Mater. 2020, 32, 1901924. [Google Scholar] [CrossRef]
  16. Oh, J.Y.; Lee, Y.; Lee, T.-W. Skin-mountable functional electronic materials for bio-integrated devices. Adv. Healthc. Mater. 2024, 13, 2303797. [Google Scholar] [CrossRef] [PubMed]
  17. Dagdeviren, C.; Yang, B.D.; Su, Y.; Tran, P.L.; Joe, P.; Anderson, E.; Xia, J.; Doraiswamy, V.; Dehdashti, B.; Feng, X.; et al. Conformal piezoelectric energy harvesting and storage from motions of the heart, lung, and diaphragm. Proc. Natl. Acad. Sci. USA 2014, 111, 1927–1932. [Google Scholar] [CrossRef] [PubMed]
  18. Yin, J.; Wang, S.; Tat, T.; Chen, J. Motion artefact management for soft bioelectronics. Nat. Rev. Bioeng. 2024, 2, 541–558. [Google Scholar] [CrossRef] [PubMed]
  19. Heikenfeld, J.; Jajack, A.; Rogers, J.; Gutruf, P.; Tian, L.; Pan, T.; Li, R.; Khine, M.; Kim, J.; Wang, J.; et al. Wearable sensors: Modalities, challenges, and prospects. Lab Chip 2018, 18, 217–248. [Google Scholar] [CrossRef] [PubMed]
  20. Gao, W.; Emaminejad, S.; Nyein, H.Y.Y.; Challa, S.; Chen, K.; Peck, A.; Fahad, H.M.; Ota, H.; Shiraki, H.; Kiriya, D.; et al. Fully integrated wearable sensor arrays for multiplexed in situ perspiration analysis. Nature 2016, 529, 509–514. [Google Scholar] [CrossRef] [PubMed]
  21. Krouskop, T.A.; Wheeler, T.M.; Kallel, F.; Garra, B.S.; Hall, T. Elastic moduli of breast and prostate tissues under compression. Ultrason. Imaging 1998, 20, 260–274. [Google Scholar] [CrossRef] [PubMed]
  22. Shankar, P.M. A general statistical model for ultrasonic backscattering from tissues. IEEE Trans. Ultrason. Ferroelectr. Freq. Control. 2000, 47, 727–736. [Google Scholar] [CrossRef] [PubMed]
  23. LeCun, Y.; Bengio, Y.; Hinton, G. Deep learning. Nature 2015, 521, 436–444. [Google Scholar] [CrossRef] [PubMed]
  24. Krizhevsky, A.; Sutskever, I.; Hinton, G.E. Imagenet classification with deep convolutional neural networks. Commun. ACM 2017, 60, 84–90. [Google Scholar] [CrossRef]
  25. Litjens, G.; Kooi, T.; Bejnordi, B.E.; Setio, A.A.A.; Ciompi, F.; Ghafoorian, M.; van der Laak, J.A.W.M.; van Ginneken, B.; Sánchez, C.I. A survey on deep learning in medical image analysis. Med. Image Anal. 2017, 42, 60–88. [Google Scholar] [CrossRef]
  26. Shen, D.; Wu, G.; Suk, H.-I. Deep learning in medical image analysis. Annu. Rev. Biomed. Eng. 2017, 19, 221–248. [Google Scholar] [CrossRef] [PubMed]
  27. Wang, M.; Yang, Y.; Min, J.; Song, Y.; Tu, J.; Mukasa, D.; Ye, C.; Xu, C.; Heflin, N.; McCune, J.S.; et al. A wearable electrochemical biosensor for the monitoring of metabolites and nutrients. Nat. Biomed. Eng. 2022, 6, 1225–1235. [Google Scholar] [CrossRef] [PubMed]
  28. Hu, H.; Ma, Y.; Gao, X.; Song, D.; Li, M.; Huang, H.; Qian, X.; Wu, R.; Shi, K.; Ding, H.; et al. Stretchable ultrasonic arrays for the three-dimensional mapping of the modulus of deep tissue. Nat. Biomed. Eng. 2023, 7, 1321–1334. [Google Scholar] [CrossRef] [PubMed]
  29. Wang, C.; Chen, X.; Wang, L.; Makihata, M.; Liu, H.-C.; Zhou, T.; Zhao, X. Bioadhesive ultrasound for long-term continuous imaging of diverse organs. Science 2022, 377, 517–523. [Google Scholar] [CrossRef] [PubMed]
  30. Song, X.; Yi, B.; Chen, Q.; Zhou, Y.; Cho, H.; Hong, Y.; Chung, S.; You, L.; Li, S.; Hong, J. Machine learning-powered ultrahigh controllable and wearable magnetoelectric piezotronic touching device. ACS Nano 2024, 18, 16648–16657. [Google Scholar] [CrossRef] [PubMed]
  31. Miranda, B.H.S.; Bagnis, D.; Oréfice, R.L. Towards the fabrication of fully printed flexible p(vdf-trfe)-based piezoelectric sensors. Sens. Actuators A Phys. 2024, 372, 115379. [Google Scholar] [CrossRef]
  32. Hu, Y.-D.; Tang, C.-Y.; Li, S.-J.; Wu, Y.-J.; Ke, K.; Chen, R.; Luo, C.; Dong, Q.-X.; Li, H.-X.; Bai, L.; et al. Flash annealing boosts piezoelectricity of pvdf-trfe. Nat. Commun. 2025, 16, 11147. [Google Scholar] [CrossRef] [PubMed]
  33. Hua, Y.; Tang, L.; Qian, J.; Wang, S.; Ge, G.; Lin, J.; Zhai, J. Outstanding comprehensive piezoelectric properties in knn-based ceramics via co-optimization of crystal structure and grain orientation. Acta Mater. 2025, 297, 121378. [Google Scholar] [CrossRef]
  34. Rosso, M.; Maspero, F.; Esposito, A.; Afifi, T.A.; Riani, M.; Gattere, G.; Di Matteo, A.; Corigliano, A.; Ardito, R. Characterization of AlN in mems: Synergistic use of dynamic testing, static profilometry, and an enhanced reduced-order model. Eur. J. Mech. A/Solids 2026, 115, 105834. [Google Scholar] [CrossRef]
  35. Safari, A.; Akdogan, E.K. Piezoelectric and Acoustic Materials for Transducer Applications; Springer: New York, NY, USA, 2008. [Google Scholar]
  36. Persano, L.; Dagdeviren, C.; Su, Y.; Zhang, Y.; Girardo, S.; Pisignano, D.; Huang, Y.; Rogers, J.A. High performance piezoelectric devices based on aligned arrays of nanofibers of poly(vinylidenefluoride-co-trifluoroethylene). Nat. Commun. 2013, 4, 1633. [Google Scholar] [CrossRef] [PubMed]
  37. Wang, X.; Yang, B.; Liu, J.; Zhu, Y.; Yang, C.; He, Q. A flexible triboelectric-piezoelectric hybrid nanogenerator based on p(vdf-trfe) nanofibers and pdms/mwcnt for wearable devices. Sci. Rep. 2016, 6, 36409. [Google Scholar] [CrossRef] [PubMed]
  38. Cobbold, R. Foundations of Biomedical Ultrasound; Oxford University Press: Oxford, UK, 2006. [Google Scholar]
  39. Petrella, L.I.; de Azevedo Valle, H.; Issa, P.R.; Martins, C.J.; Machado, J.C.; Pereira, W.C.A. Statistical analysis of high frequency ultrasonic backscattered signals from basal cell carcinomas. Ultrasound Med. Biol. 2012, 38, 1811–1819. [Google Scholar] [CrossRef] [PubMed]
  40. Szabo, T.L. Diagnostic Ultrasound Imaging: Inside Out; Academic Press: Oxford, UK, 2014. [Google Scholar]
  41. Kino, G.S. Acoustic Waves: Devices, Imaging, and Analog Signal Processing; Prentice-Hall: Upper Saddle River, NJ, USA, 1987. [Google Scholar]
  42. Kingma, D.P.; Ba, J. Adam: A method for stochastic optimization. arXiv 2014, arXiv:1412.6980. [Google Scholar] [CrossRef]
  43. Zhang, Z.; Sabuncu, M.R. Generalized cross entropy loss for training deep neural networks with noisy labels. Adv. Neural Inf. Process. Syst. 2018, 32, 8792–8802. [Google Scholar] [PubMed]
  44. Kim, J.; Campbell, A.S.; de Ávila, B.E.-F.; Wang, J. Wearable biosensors for healthcare monitoring. Nat. Biotechnol. 2019, 37, 389–406. [Google Scholar] [CrossRef] [PubMed]
  45. Mahato, K.; Saha, T.; Ding, S.; Sandhu, S.S.; Chang, A.-Y.; Wang, J. Hybrid multimodal wearable sensors for comprehensive health monitoring. Nat. Electron. 2024, 7, 735–750. [Google Scholar] [CrossRef]
  46. Raschka, S.; Liu, Y.H.; Mirjalili, V. Machine Learning with Pytorch and Scikit-Learn: Develop Machine Learning and Deep Learning Models with Python; Packt Publishing: Birmingham, UK, 2022. [Google Scholar]
  47. La, T.-G.; Le, L.H. Flexible and wearable ultrasound device for medical applications: A review on materials, structural designs, and current challenges. Adv. Mater. Technol. 2022, 7, 2100798. [Google Scholar] [CrossRef]
  48. Kong, F.; Liu, P.; Tang, H.; Zhao, J.; Ruan, R.; Chen, S.; Peng, J. A wearable ultrasound patch based on ultrathin backing for biomedical imaging. Sens. Actuators A Phys. 2025, 393, 116854. [Google Scholar] [CrossRef]
  49. Sun, T.; Feng, B.; Huo, J.; Xiao, Y.; Wang, W.; Peng, J.; Li, Z.; Du, C.; Wang, W.; Zou, G.; et al. Artificial intelligence meets flexible sensors: Emerging smart flexible sensing systems driven by machine learning and artificial synapses. Nano-Micro Lett. 2023, 16, 14. [Google Scholar] [CrossRef] [PubMed]
  50. Wang, M.; Jia, L.; Li, H.; Feng, X. Wearable ultrasound devices for biomedical applications. FlexTech 2025, 1, 35–43. [Google Scholar] [CrossRef]
  51. Elsheakh, D.N.; Fahmy, O.M.; Farouk, M.; Ezzat, K.; Eldamak, A.R. An Early Breast Cancer Detection by Using Wearable Flexible Sensors and Artificial Intelligent. IEEE Access 2024, 12, 48511–48529. [Google Scholar] [CrossRef]
Figure 1. Schematic diagram. (a) Schematic illustration of the overall sensor architecture. (b) Schematic illustration of the sensor cross-sectional structure.
Applsci 16 06126 g001
Figure 2. Schematic diagram of the overall system workflow, including sensor excitation and pulse-echo signal generation, signal acquisition and amplification, data processing, and machine learning-based classification.
Applsci 16 06126 g002
Figure 3. Multichannel excitation and echo acquisition process based on the 3 × 3 piezoelectric sensor array. (a) Pulse excitation waveform (3.3 V, 10 μs pulse width, 180 kHz frequency); (b) raw millivolt-level signals captured by the sensor; (c) analog front-end (AFE) processed signals, including 18.3× amplification and 53 kHz low-pass filtering; (d) heatmap representing the signal intensity distribution across all channels; (e) automated diagnostic output, where the abnormal echo signal exhibits significantly higher amplitude than the normal one. (f) Multi-channel (10 × 10) sensor simulation results. In the future, this sensor can be scaled up to an n × n array for detecting abnormalities in other body parts.
Applsci 16 06126 g003
Figure 4. (a) Testing results in a soft-tissue-like environment. Because the acoustic impedance difference between the soft material and the sensor is small, the resulting echo signals are weaker and more diffuse. The generated feature map shows moderate intensity, reflecting the signal characteristics of soft-tissue environments. (b) Measurement feature map on rigid materials. Rigid materials create a larger acoustic impedance mismatch, resulting in stronger reflections and more pronounced echo signals. (c) Testing of the sensor and circuit in water. When the piezoelectric sensor is subjected to pressure and deforms in water, its output signal generally becomes higher. The received ultrasonic echo signals, after passing through the amplification and filtering circuit, exhibit good periodic consistency and very low noise, indicating stable and reliable signal acquisition. (d) Detection of a lesion within a breast tissue model. The presence of a lesion significantly alters the propagation and reflection characteristics of ultrasound, producing noticeably different echo patterns. After identifying these changes, distinct abnormal signals associated with the lesion are generated, reflecting the echo differences caused by tissue abnormalities.
Applsci 16 06126 g004
Figure 5. Architecture and training performance of the CNN model. (a) Comparison of two types of input signals (sine wave and square wave) under accurate and erroneous measurement conditions in the neural network. Orange: Generated signal; Purple: Received signals; Red: Subtraction signal. (b) Schematic diagram of the CNN model structure, showing the convolutional and fully connected layers used to classify signals as accurate or erroneous.
Applsci 16 06126 g005
Figure 6. Performance evaluation of the CNN model for echo-signal classification. (a) Evolution of the loss function during training. (b) Accuracy curves of the training and validation sets as a function of iteration number. (c) Comparison of ROC curves for the training, validation, and test sets. (d) Precision–recall (PR) curves further evaluating model precision across different recall levels. (e) Confusion matrix results showing high classification accuracy for both classes.
Applsci 16 06126 g006
Table 1. Training configuration.
ParameterValue
Iteration1000
Learning rate0.001
Loss functionCross-entropy loss function
Optimizer Adam optimizer
Disclaimer/Publisher’s Note: The statements, opinions and data contained in all publications are solely those of the individual author(s) and contributor(s) and not of MDPI and/or the editor(s). MDPI and/or the editor(s) disclaim responsibility for any injury to people or property resulting from any ideas, methods, instructions or products referred to in the content.