1. Introduction
The retinal pigment epithelium (RPE) is a polarized monolayer of cells located between the choroidal capillaries and the photoreceptor cells. It performs critical functions such as phagocytosis, bidirectional transport of nutrients and waste products, and secretion of growth factors to maintain retinal homeostasis [
1]. The RPE is the most critical component of the outer blood-retinal barrier (oBRB) [
2], a which also includes the choroidal capillary endothelium and Bruch’s membrane [
3]; these structures regulate the selective exchange of substances between the systemic circulation and the retina [
4]. The integrity of this barrier fundamentally depends on tight junctions (TJ) between adjacent RPE cells. TJ is composed of proteins such as claudins, occludin, and members of the ZO family, which limit permeability on the extracellular side, thereby maintaining the strictly necessary trans-epithelial electrochemical gradients that are essential for the function of retinal photoreceptors and visual signal transduction [
5].
Impaired TJ integrity leads to a loss of selective intercellular membrane permeability, manifested by increased barrier permeability, abnormal fluid accumulation in the subretinal space and outer retinal layers, and unrestricted infiltration of blood-derived inflammatory mediators and macromolecules into the retina [
6]. These consequences trigger a self-amplifying cascade of tissue damage, including photoreceptor metabolic stress, extracellular matrix remodeling, neovascular dysregulation, and progressive neurodegeneration. Consequently, TJ disruption has been identified as one of the earliest and most consistent histopathological features in various retinal diseases, including diabetic macular edema [
7], retinitis pigmentosa [
8], nonproliferative and proliferative diabetic retinopathy [
9], and age-related macular degeneration [
10]. Consequently, the accurate, high-resolution characterization of TJ structure and morphology has become a critical unmet need—one that is directly linked to the early detection of subclinical barrier dysfunction, patient stratification, treatment monitoring, and long-term prognosis assessment.
Current research evaluates TJ integrity at multiple levels. At the molecular level, real-time quantitative polymerase chain reaction (RT-qPCR), Western blotting, and proteomic separation techniques enable the quantitative detection of TJ proteins (such as Claudin-19 and ZO-1) and the tracking of their subcellular localization, thereby revealing how insulin disrupts oBRB by specifically altering Claudin-19 expression [
11]. At the functional level, trans-epithelial electrical resistance (TEER) and FITC-dextran assays can measure the permeability of ions and size-dependent macromolecules across cells [
12]. Mechanistic analyses have elucidated how inflammatory mediators impair barrier function through signaling pathways such as JAK/STAT, while at the morphological level, immunofluorescence techniques can visualize TJ distribution and internalization abnormalities [
13]. Furthermore, routine hematoxylin and eosin (H&E) staining allows for the assessment of retinal structure and cellular permeability throughout the retina [
14]. However, from a structural perspective, the most direct manifestation of TJ dysfunction is the disruption of the honeycomb-like skeleton.
In the field of medical imaging, the TJ structure manifests as a slender, interconnected tubular network composed of nodes and edges. In recent years, advances in deep learning have aimed to automate the extraction of such curved features. For example, models such as GATv2 have combined superpixel-based vascular center features with radial priors to extract vascular information [
15]. Others utilize state-space models combined with specialized scanning mechanisms, such as serpentine scanning modules, to capture the complex geometries of infrastructure cracks or biological vessels [
16]. Although these supervised methods show promise, they rely heavily on large amounts of high-quality manual annotations—a “insurmountable challenge” in bioimaging. To alleviate this burden, self-supervised learning (SSL) strategies have emerged. For example, the StyleGAN2-based generative paradigm has been applied to representation learning for fluorescence images [
17], while other SSL strategies focus on suppressing photon noise and motion artifacts in live-cell microscopy to visualize complex structures without the need for manual labels [
18].
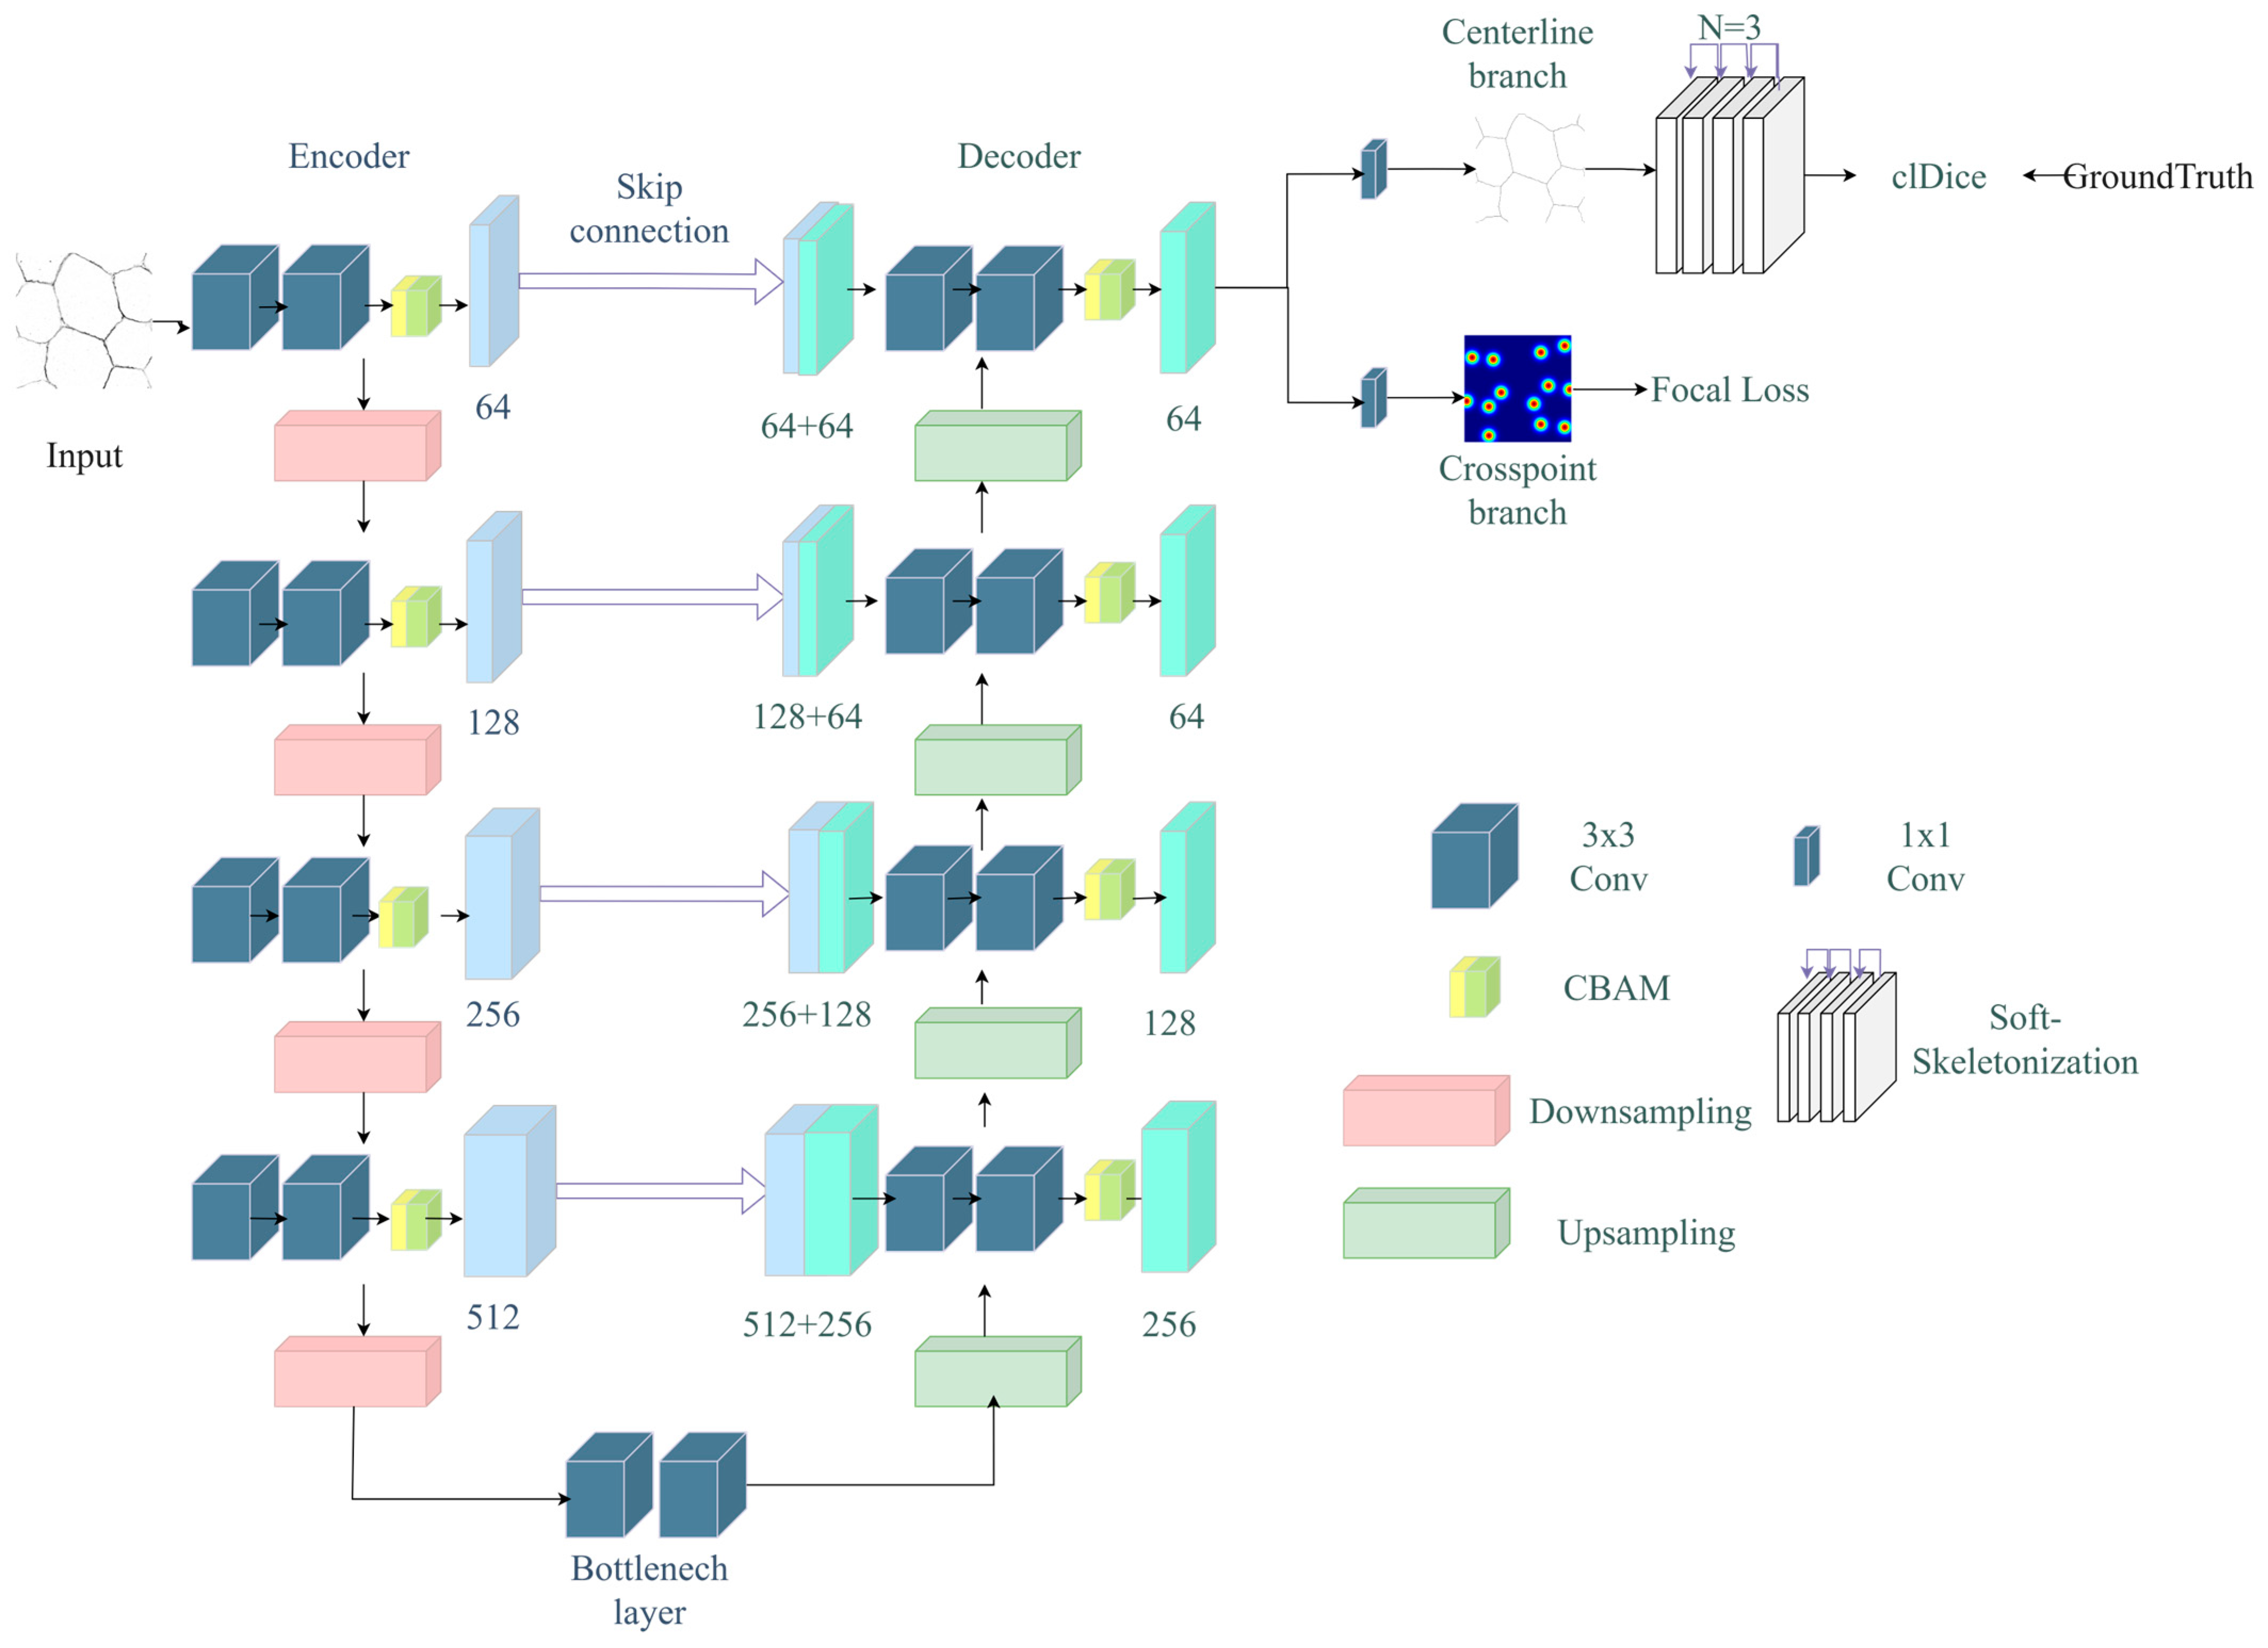
However, applying the widespread success of deep learning to TJ analysis faces several inherent limitations. First, aside from architectural improvements, the high cost and low reproducibility of manual skeleton annotation remain insurmountable obstacles. Precisely annotating connection centerlines and nodes is a labor-intensive task and is susceptible to inter-observer variability, particularly in regions with low signal-to-noise ratios. Second, TJ images exhibit extremely sparse structures and blurred boundary features, and conventional algorithms often fail to preserve topological connectivity. Consequently, the primary bottleneck lies in the objective and accurate extraction of microstructural features—particularly skeletons and branch nodes—which define the network’s topological continuity. Accurate extraction not only reflects the physical integrity of the barrier but also provides the necessary foundation for calculating pathological metrics, such as network density and fracture rates. To address this gap, we propose a weakly supervised strategy designed to preserve the topological integrity of TJ structures under challenging conditions. By utilizing an iterative skeleton refinement algorithm to generate topologically aware pseudo-labels, we avoid the need for exhaustive manual pixel-level annotation. Our framework employs a multi-task dual-head U-Net with Convolutional Block Attention Modules (CBAM), specifically designed to extract skeletal features and nodes from noisy backgrounds (as shown in
Figure 1). This approach ensures that the extracted morphological metrics faithfully reflect the underlying biological connectivity of TJ.
2. Materials and Methods
2.1. Dataset Description
The experimental samples in this study were obtained from RPE tissue that had undergone varying degrees of oxidative stress, ensuring a comprehensive simulation and capture of the typical structural changes in tight junctions (TJ) within a real biological environment [
19]. Immunofluorescence techniques were used to specifically label the ZO-1 protein in RPE tissue and sampling was systematically performed along the four major radial axes extending from the optic nerve head. Image acquisition was performed using a confocal microscope, with each field of view measuring 184.61 × 184.61 micrometers, covering the entire depth of the ZO-1-labeled region. Each stack was typically comprised 10–15 optical sections spaced 1 micrometer apart. To prepare the image data for topological analysis, we used Fiji [
20] (version ImageJ 1.54p, National Institutes of Health, Bethesda, MD, USA) to perform Z-projection stacking, merging the image stacks into a representative two-dimensional projection.
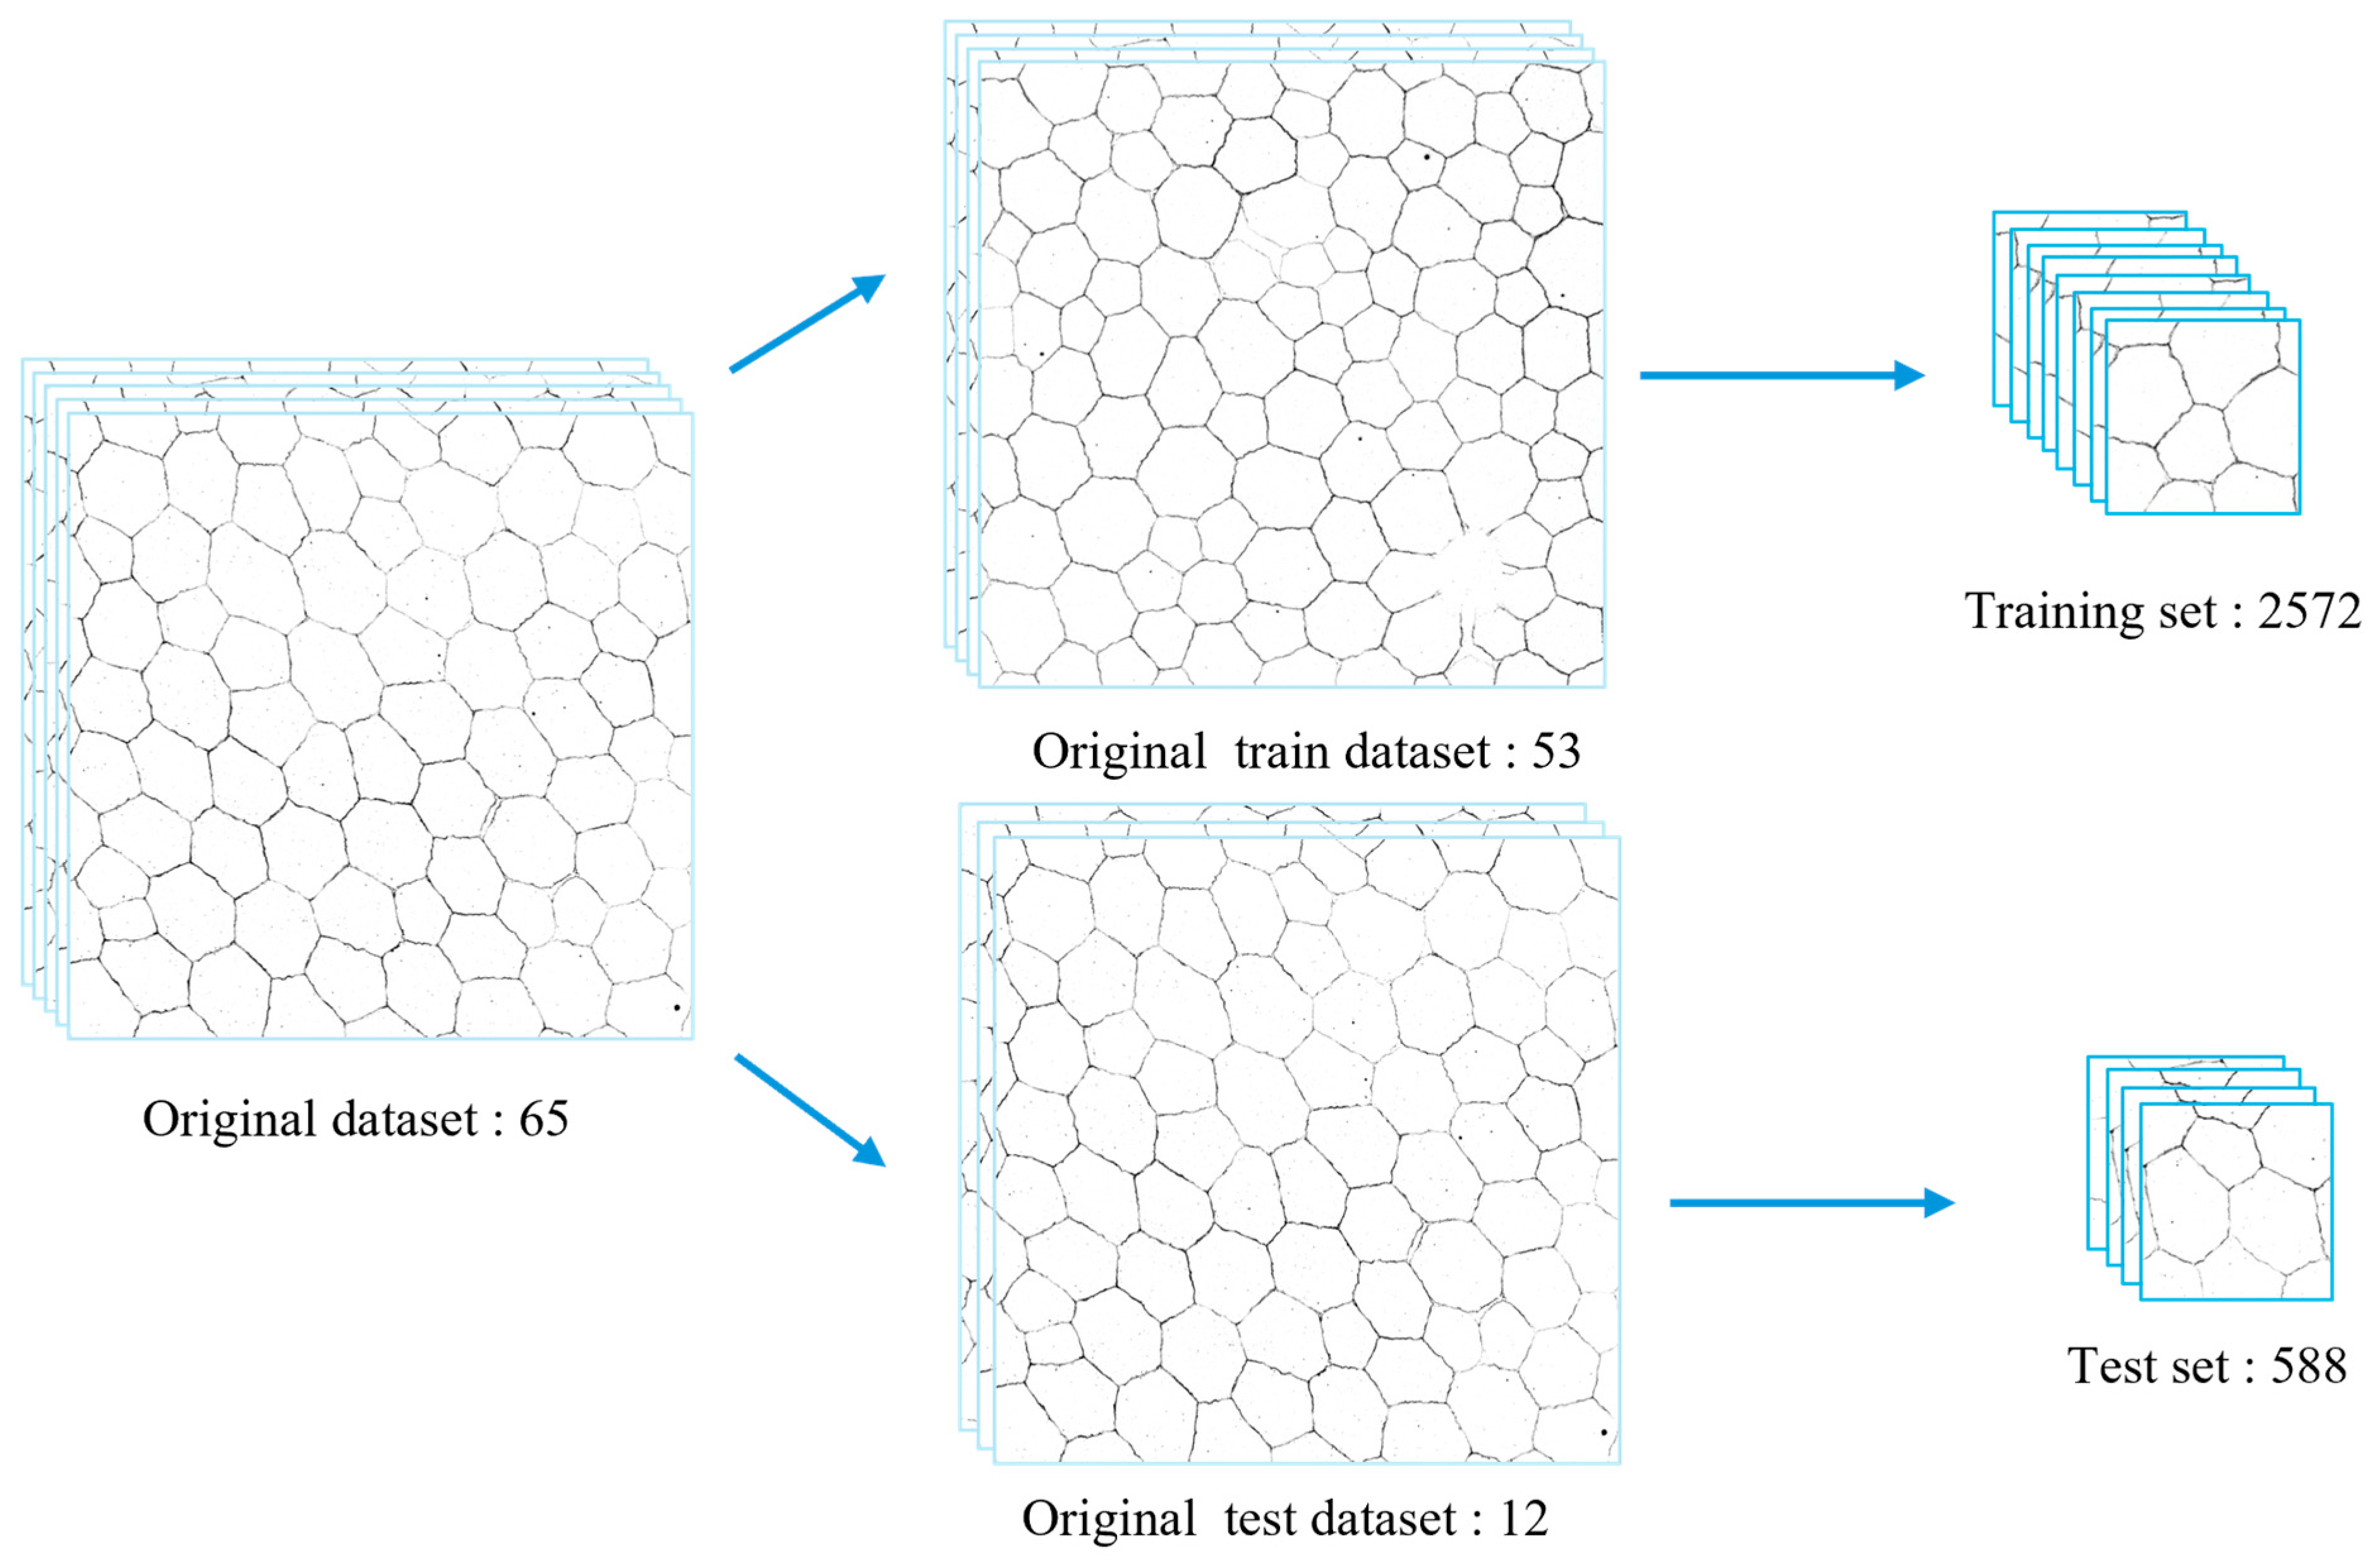
The dataset was derived from a total of 20 mice, including 10 biological replicates in the control group (3 images per mouse) and 10 biological replicates in the oxidative stress group (3–4 images per mouse). Three experimental conditions were established: mice in a healthy state, mice treated with IL-1β (201-LB, R&D Systems, Minneapolis, MN, USA) for 2 h, and mice treated with IL-1β for 4 h. To ensure a rigorous and unbiased evaluation of model performance, we adopted a holdout validation strategy. The dataset comprises 65 high-resolution raw images. We performed the split at the image level rather than the patch level to strictly avoid data leakage. Specifically, we randomly selected 16 mice, using the 53 raw images collected from them as the training set. The 12 images collected from the remaining 4 mice were used as the independent test set.
Through sliding-window cropping (window size 512 × 512, stride 256), this division yielded 2572 training patches and 588 independent test patches (
Figure 2). By maintaining complete spatial separation between the training and test samples, we ensured that the model was evaluated based on biological structures and noise patterns never encountered during the optimization phase. This approach provides a reliable metric for assessing the framework’s generalization ability in reconstructing TJ networks under varying degrees of oxidative stress.
2.2. Network Structure Design
We adopted an improved U-Net architecture as the main framework for model training. U-Net is a classic fully convolutional encoder–decoder network originally proposed by Ronneberg et al. [
21] for biomedical image segmentation. Its architecture consists of an encoder and a decoder. The encoder progressively extracts multiscale semantic features from the input image and reduces spatial resolution through successive convolutional and max-pooling operations. The decoder subsequently restores spatial resolution through upsampling and combines high-resolution local features from corresponding encoder stages with the decoder’s deep semantic features via skip connections, thereby balancing the understanding of global context with the preservation of fine local details in pixel-level prediction tasks.
Applying U-Net to TJ structure skeleton refinement and junction prediction offers several significant advantages. First, the skip connection mechanism enables the network to simultaneously capture both the macroscopic topological structure of the TJ skeleton and the microscopic boundary details at the pixel level. This characteristic is particularly helpful in mitigating structural blurring caused by salt-and-pepper noise or uneven staining in confocal images, thereby improving the continuity and accuracy of skeleton predictions. Second, the fully convolutional design grants the model flexibility regarding input image size, while the progressively expanding receptive fields in the encoding path help integrate broader contextual information. This feature facilitates semantic inference and structural completion in TJ disruption regions and enhances the robustness of junction localization in areas of TJ damage caused by oxidative stress.
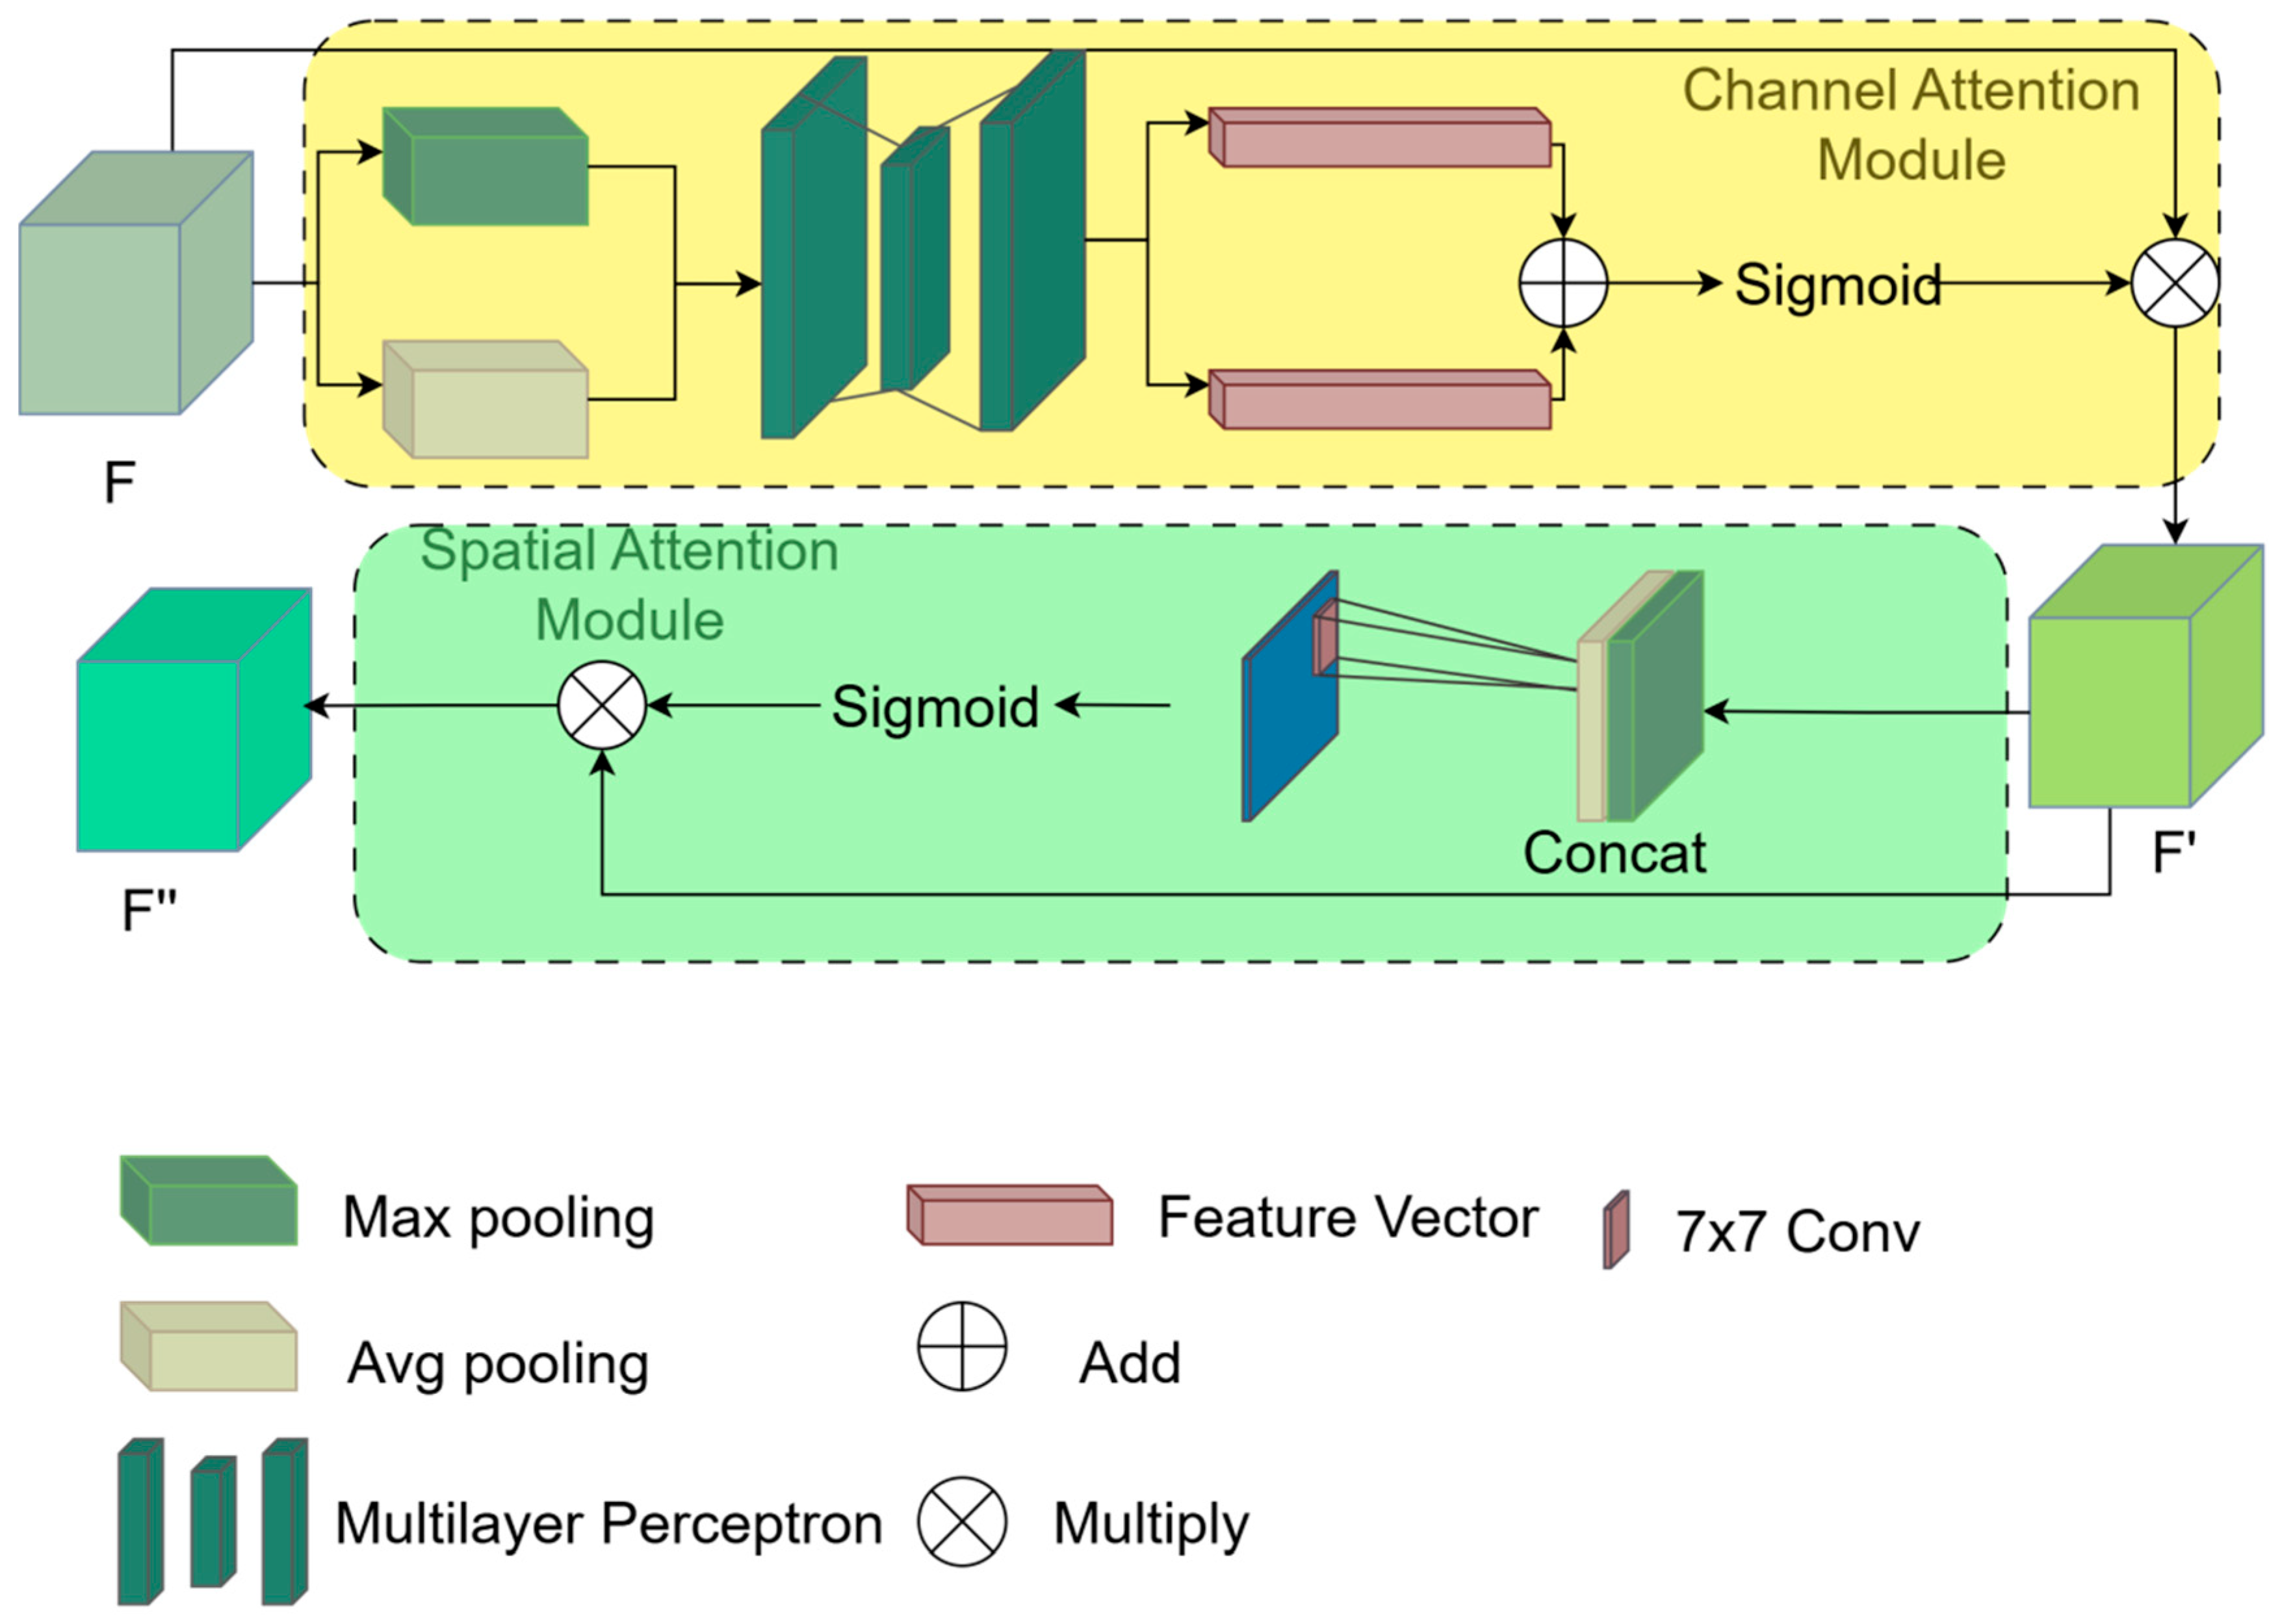
Given the slender structure of TJ and their tendency to blend with the background, the spatial attention mechanism aids in localizing fine boundaries, while the channel attention mechanism helps filter out irrelevant background noise. Therefore, in this study, a U-Net-based encoder–decoder architecture was adopted as the main network, and CBAM was introduced during feature extraction and fusion at each scale to enhance the network’s ability to represent key structures [
22], as shown in
Figure 3. The specific computational process is as follows:
Here, F denotes the input feature map, while and represent the channel attention weight map and the spatial attention weight map, respectively. is the feature map after channel attention processing, and is the output feature map after dual attention adjustment.
For the input feature map, the channel attention module reduces its spatial dimensions through global average pooling and global max pooling operations to extract the average response intensity and maximum response intensity. Subsequently, a multi-layer perceptron composed of fully connected layers performs nonlinear transformation, dimensionality reduction, and upsampling, and finally generates the channel attention weight vector
using the Sigmoid activation function. The mathematical expression is as follows:
Here, W1 and W0 are the weight matrices of the two layers of the multi-layer perceptron, respectively, while σ represents the sigmoid activation function.
The spatial attention module models the spatial correlations and the varying importance of pixel locations in the feature maps refined by the channel attention module. Specifically, the spatial attention module applies global average pooling and global max pooling operations along the channel axis to generate two 2D feature maps. These maps are concatenated to form a dual-channel feature map, which is then processed through a convolutional layer with a 7 × 7 convolutional kernel to perform spatial context aggregation. Finally, the spatial attention weight map
is generated using the Sigmoid activation function. The mathematical formula is as follows:
Here, denotes a convolution operation using a 7 × 7 kernel, and [ ; ] denotes concatenation along the channel dimension.
This mechanism ensures that the spatial attention module can focus on important regions while incorporating sufficient contextual information. For sparse structures distributed throughout the image, this method effectively enhances the feature responses at these locations, thereby improving the model’s overall accuracy.
2.3. Design of Composite Loss Function
To facilitate subsequent analysis of TJ structure deformations, it is essential to preserve the correct topological structure of the TJ network, particularly its connectivity and branching patterns. Traditional pixel-level loss functions, such as binary cross-entropy loss and Dice loss, are primarily designed to optimize classification accuracy between foreground and background or overall region overlap. Although these objectives are effective for general segmentation tasks, they are less suitable for characterizing slender linear structures, as the predicted results may still contain discontinuities or missing segments.
To better preserve topological connectivity, we incorporate the clDice [
23] loss into the overall loss function as a supervisory signal for the skeleton prediction branch. By transforming the predicted outputs and ground-truth labels into skeleton or centerline representations that more faithfully reflect topological features, clDice encourages the network to focus more explicitly on structural continuity during training:
Here, and represent the accuracy and sensitivity of the topological structure obtained through soft skeletalization, respectively. On the one hand, they suppress false branches and artifacts, thereby improving the accuracy of the topological structure. On the other hand, they reduce missed connections and disconnections, thereby improving the recall of the topological structure. This approach makes the model highly sensitive to connectivity damage, effectively reducing the fragmentation of linear structures and eliminating redundant erroneous branches.
Given the complex topology of the TJ architecture, we developed a multi-task composite loss function.
(1) Centerline branches: Since the width of the refined skeleton is nearly one pixel, this leads to a class imbalance, where the number of background pixels far exceeds the number of centerline pixels. Therefore, this section employs a weighted cross-entropy loss function, limits the number of positive samples to 100, and combines it with Dice loss to focus on the overlapping regions, introducing clDice loss to enhance topological connectivity. The centerline loss consists of three components:
Here, we employ three loss functions that complement one another. and provide robust pixel-level supervision, while ensures the overall position and shape of the foreground region and further constrains the topological consistency of the predictions at the structural level, thereby making the predicted results morphologically closer to the actual structure.
(2) Junction point branches: Junction points are independently distributed in space, which can easily lead to training instability. In this section, we combine the focal loss (α = 0.85, γ = 2.0) with weighted binary cross-entropy (max_pw = 500). Through this approach, the network is forced to focus on hard-to-classify regions. The cross-loss function combines the focal loss and weighted binary cross-entropy loss to address the issue of class imbalance.
(3) The total loss formula is:
Here, denotes the centerline loss, and denotes the junction loss. Set the centerline and the junction . By increasing the loss weight for junctions, the prediction accuracy of keypoints can be improved.
3. Results
3.1. Experimental Environment and Training Parameters
These experiments were conducted on a workstation equipped with an NVIDIA GeForce RTX 4060 laptop GPU. The GPU driver version was 566.07, and the CUDA version was 12.7. All deep learning models were implemented using PyTorch 2.4.1 and cuDNN 90100. Both training and inference were performed on a single GPU with CUDA acceleration enabled.
Model training utilized the AdamW [
24] (Adaptive Moment Estimation with Weight Decay) optimizer. Compared to the traditional Adam optimizer, AdamW more effectively prevents model overfitting and enhances generalization. The initial learning rate was set to 1.0 × 10
−3, and the weight decay coefficient was 1.0 × 10
−4. A cosine-smoothed learning rate strategy was introduced, in which the learning rate decreases along a cosine curve based on the training step, eventually reaching a minimum of 1.0 × 10
−5. This strategy facilitates rapid convergence during the early training stages and enables fine-tuning near local optima with an extremely low learning rate in the later stages.
To further improve training efficiency and promote stable convergence, this study adopted the torch.cuda.amp automatic mixed-precision technology. This strategy significantly reduces memory consumption and accelerates backpropagation while maintaining numerical stability. Additionally, to prevent training instability caused by gradient explosion in the early stages of optimization, the maximum gradient norm was capped at 1.0. To guarantee deterministic reproducibility, all random seeds in Python (version 3.8.20) and PyTorch environments were strictly fixed to 42 for a single complete training run. The specific hyperparameters for model training are shown in
Table 1. These baseline training parameters were empirically selected based on established biomedical image segmentation literature, whereas critical hyperparameters, such as loss balancing weights, were systematically optimized via local grid search on the validation set.
3.2. Evaluation Metrics
To rigorously evaluate the performance of the proposed algorithm, we calculated performance metrics on the validation set. To determine junction point accuracy, two independent researchers used Fiji software and a region-based annotation protocol to establish ground truth (GT) values. Since vertices in the TJ network have a finite spatial extent rather than being single pixels, the experts manually delineated a “minimum bounding region” for each junction point. The final GT was determined by consensus between these two researchers, providing a reliable spatial reference for evaluating the accuracy of the vertex coordinates obtained by the algorithm. If the Euclidean distance between an algorithm-generated junction point (
) and its nearest manually annotated point (
) falls within a predefined spatial tolerance threshold
d, the detection is classified as a true positive (TP).
To ensure the accuracy of the assessment, we implemented a one-to-one matching constraint, meaning that each GT point can only correspond to one detection point. Therefore, detection results that fall outside this radius or are related to noise/phantom are marked as false positives (FP), while the undetected junction points in the GT set are recorded as false negatives (FN). We use precision, recall rate, and F
1 score to quantify the performance of the algorithm, and the calculation method is as follows:
The Skeletal Detection Rate (SDR) evaluates geometric alignment by calculating the proportion of predicted skeletal pixels that fall within a distance threshold τ of the ground-truth skeleton. In this study, we set τ to 5 pixels to account for minor spatial misalignments. Let
denote the set of centerline pixels in the predicted image, and let
denote the set of centerline pixels in
GT. For any point p in the set
, the shortest Euclidean distance from
p to
is defined as
.
To quantify topological consistency, we evaluated the results using the Betti error, Graph Connectivity Ratio, and Mean Node Degree Error metrics.
The Betti error is used to measure the difference in hole topology between the predicted skeleton and GT. It is defined as the sum of the absolute differences between the 0th-order Betti number (
, representing connected components) and the 1st-order Betti number (
, representing handles or loops) of the two. Let
G be the ground truth image and
P be the predicted image. The corresponding nth-order Betti number is:
The Graph Connectivity Ratio (GCR) index is used to evaluate the connectivity performance of the predicted results, and its calculation is defined as:
Here, represents the connectivity of the GT skeleton, and represents the connectivity of the predicted skeleton. By doing so, we ensure that over-segmentation and under-segmentation are subject to the same penalty, thereby yielding a relatively fair evaluation result.
The Mean Node Degree Error (MNDE) metric is used to determine whether the predicted skeletal structure matches the ground truth in terms of structural distribution. It is calculated as follows:
Here, and represent the distributions of node degrees for GT skeleton and the predicted skeleton, respectively, after they have been converted into graph structures. denotes the mean value, and Equation (16) is used to measure the absolute difference from the mean. The purpose of this step is to assess the average connectivity of the model’s predicted structure. denotes the standard deviation, and Equation (17) is used to measure the absolute difference in the standard deviation. The purpose of this step is to assess whether the structural node distribution of the predicted results aligns with that of the ground truth labels. Combining these two factors, the final MNDE metric is the sum of the two.
3.3. Result Analysis
To rigorously evaluate the performance of our proposed clDice-constrained multi-task framework in reconstructing complex TJ networks, we conducted a comprehensive comparative analysis. This evaluation aimed to test the model’s robustness against common imaging artifacts, such as low signal-to-noise ratios and discontinuous fluorescence intensity. We compared our method with two high-performance benchmarks (UNet++ [
25] and ResUNet [
26]) and highlighted the advantages of our approach in preserving topological connectivity. Performance was quantified using the five metrics introduced in
Section 3.2 to ensure comprehensive validation of the pixel-level fidelity and biological continuity of the predicted TJ structures.
As shown in
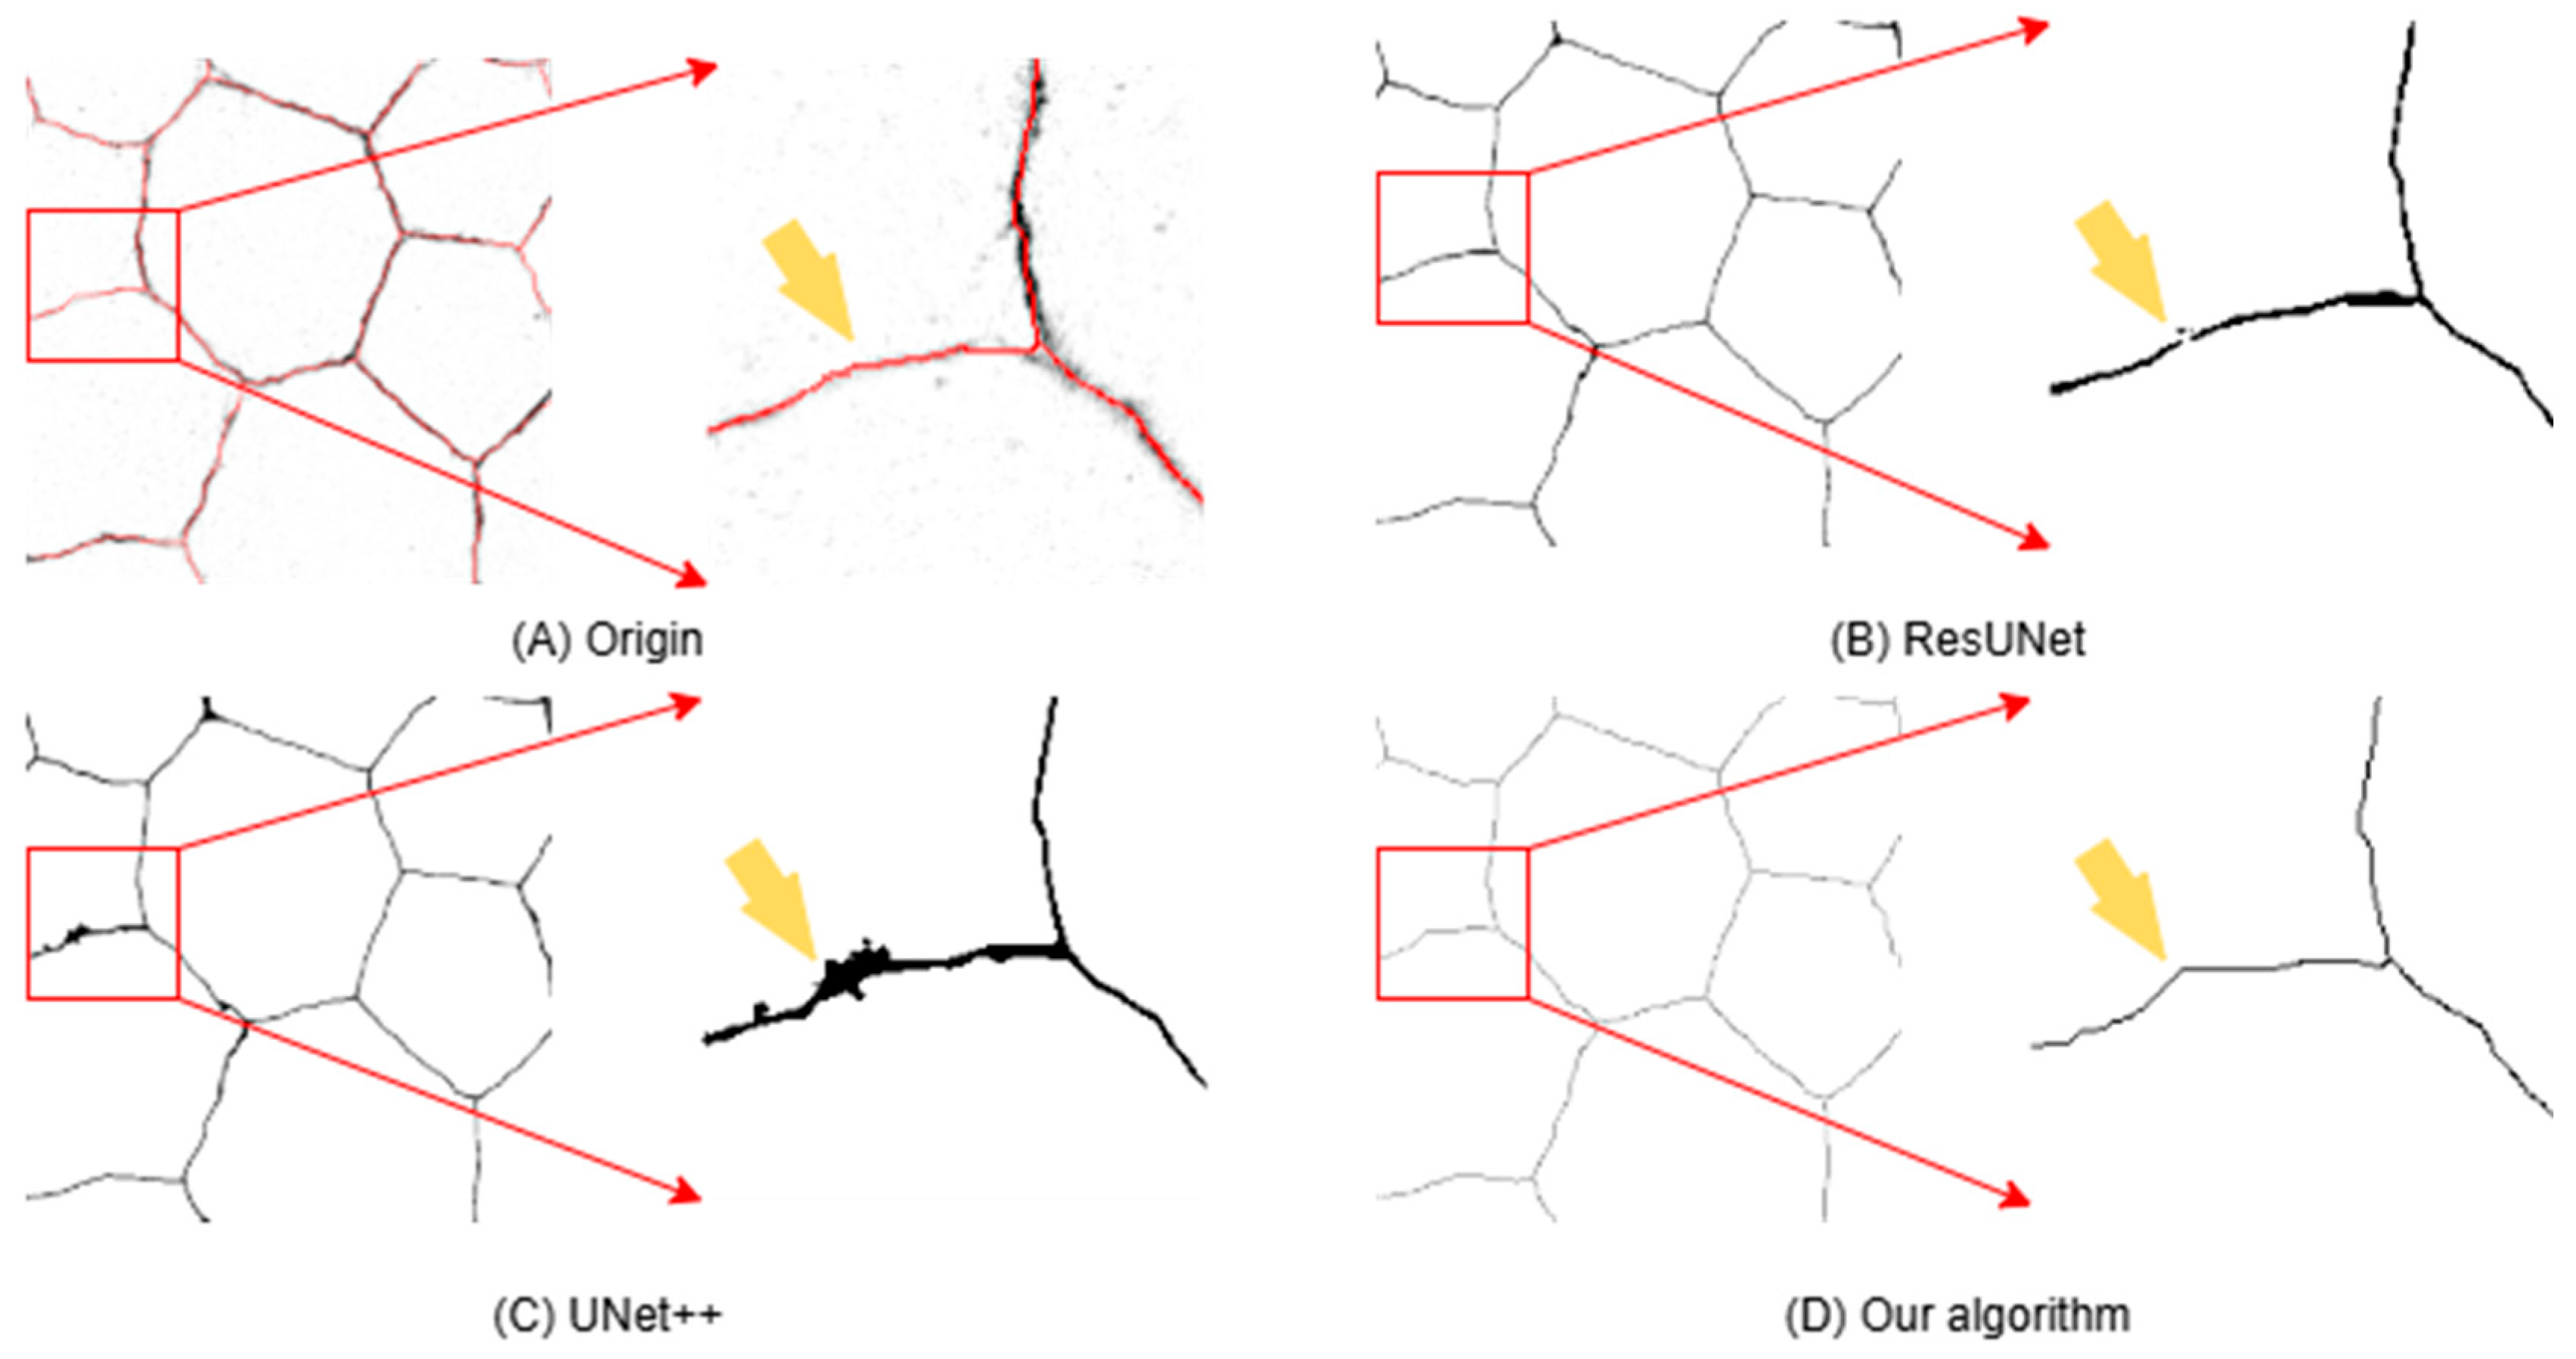
Figure 4A, we present the raw data used for training, along with the red skeleton serving as the training label, and the faintly reduced fluorescence details within it (indicated by the yellow solid arrows). During evaluation, we observed an interesting phenomenon. Despite using exactly the same single-pixel skeleton annotation data, ResUNet (
Figure 4B) and UNet++ (
Figure 4C) often produce overly thick and overly expanded predictions. This is because standard region-based losses encourage the network to generate thicker, more robust regions to penalize minor spatial misalignments. In contrast, our proposed UNet+CBAM+clDice produces highly precise, near-single-pixel predictions. These results indicate that the centerline-aware nature of the clDice loss, combined with CBAM’s spatial focusing capability, successfully compels the network to learn precise topological skeletons rather than inflated approximations.
As shown in
Table 2, although UNet++ achieved the highest SDR value, it also exhibited the greatest topological instability, as evidenced by its Betti error of 11.6316. This topological error can lead to misleading interpretations, such as false indications of structural defects in normal biological organizations. While ResUNet demonstrates a significant advantage in localizing TJ vertices, its Betti error is still high at 10.4474. Compared to these two models, although our method shows a slight decrease in the SDR metric and Junction F1 score, it exhibits a substantial advantage in maintaining topological connectivity, with a Betti error of only 3.3182. To further substantiate these observations, we performed a statistical analysis using the Wilcoxon test on three metrics evaluating topological connectivity (Betti Error, GCR, and MNDE).
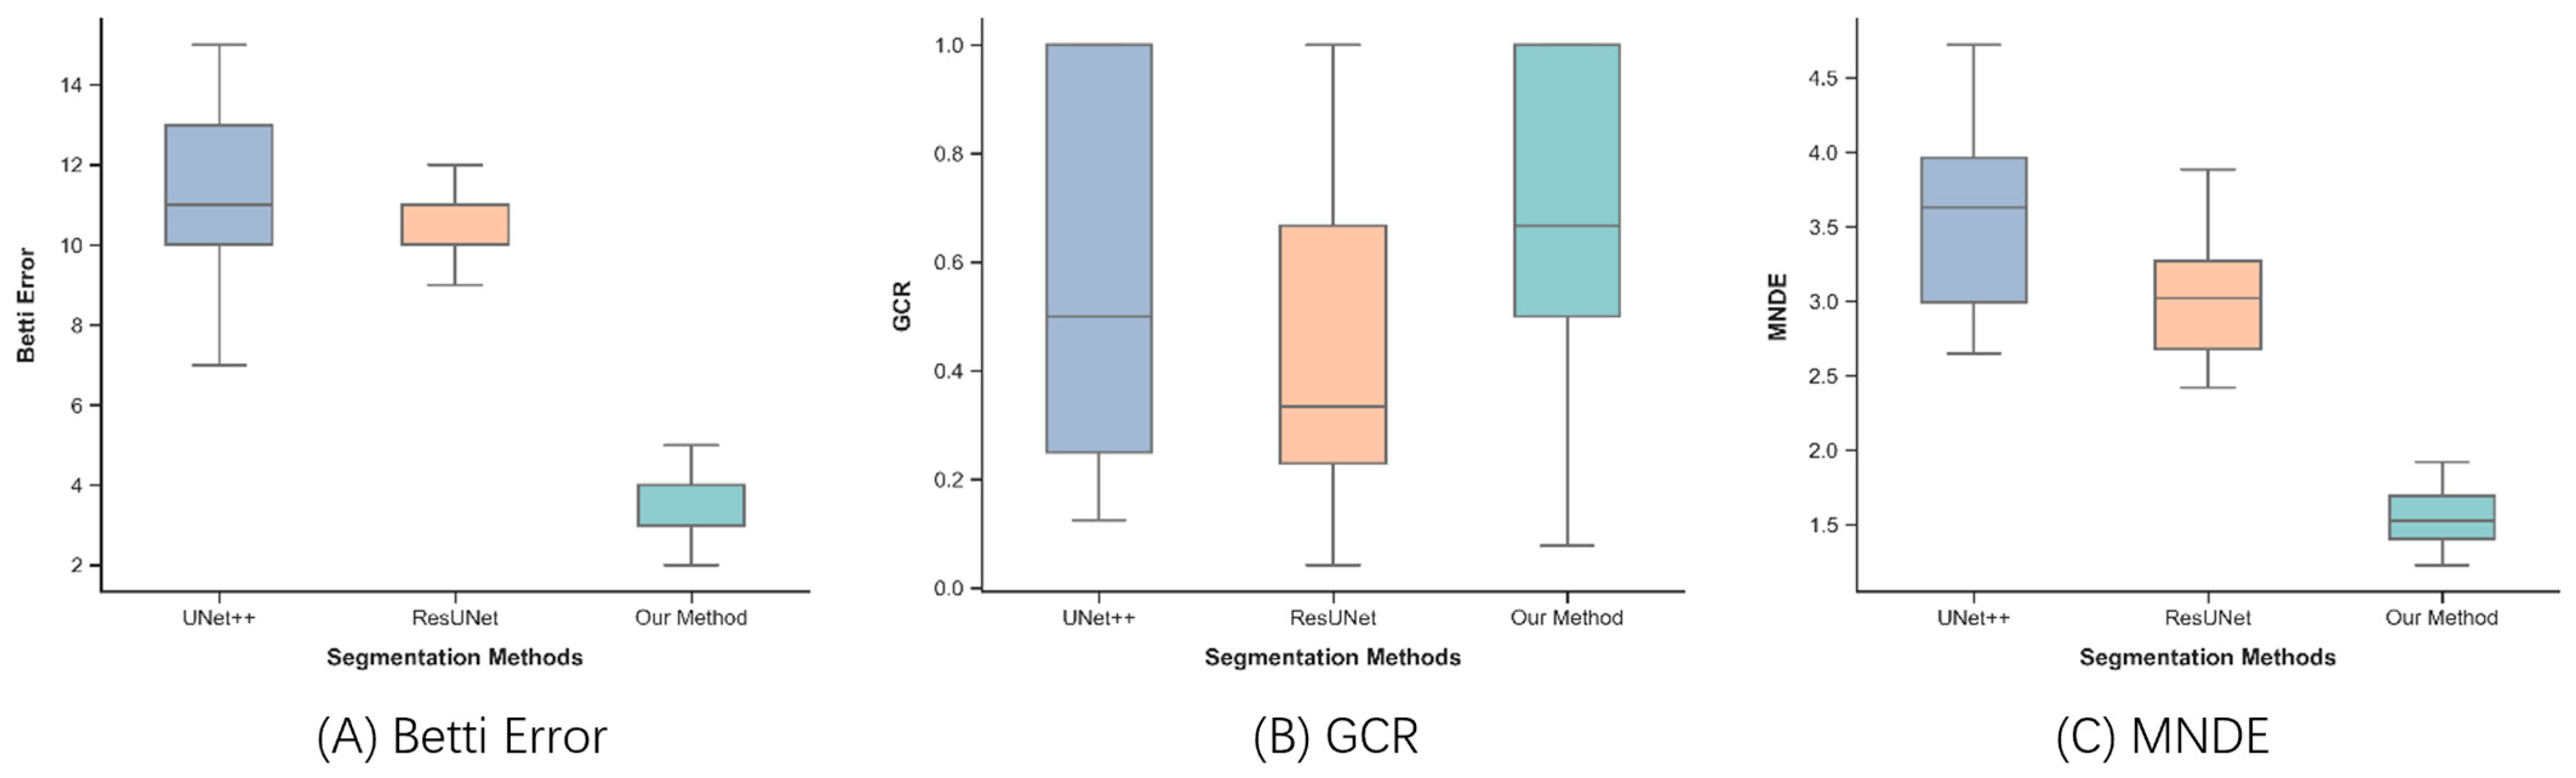
Additionally, to intuitively illustrate sample variability, box plots of Betti error, GCR, and MNDE for the test samples are presented in
Figure 5. Both the statistical data and box plots consistently demonstrate our algorithm’s clear advantage in predicting structural connectivity, a fact further underscored by visual inspection of the charts. In the absence of global topological constraints, the skeleton branches and node branches predicted by the UNet++ and ResUNet models are often disconnected. The TJ structure is typically accompanied by locally high-intensity fluorescent signals in the images, and other models achieve high F1 scores by learning these local features. However, these junctions, despite high F1 scores, are often physically isolated and discontinuous in their predictions, as evidenced by the three topological connectivity metrics. In contrast, our method, by employing collaborative optimization via CBAM and clDice constraints, enables the extracted model to more accurately reflect the true connectivity distribution of the skeleton.
3.4. Ablation Study
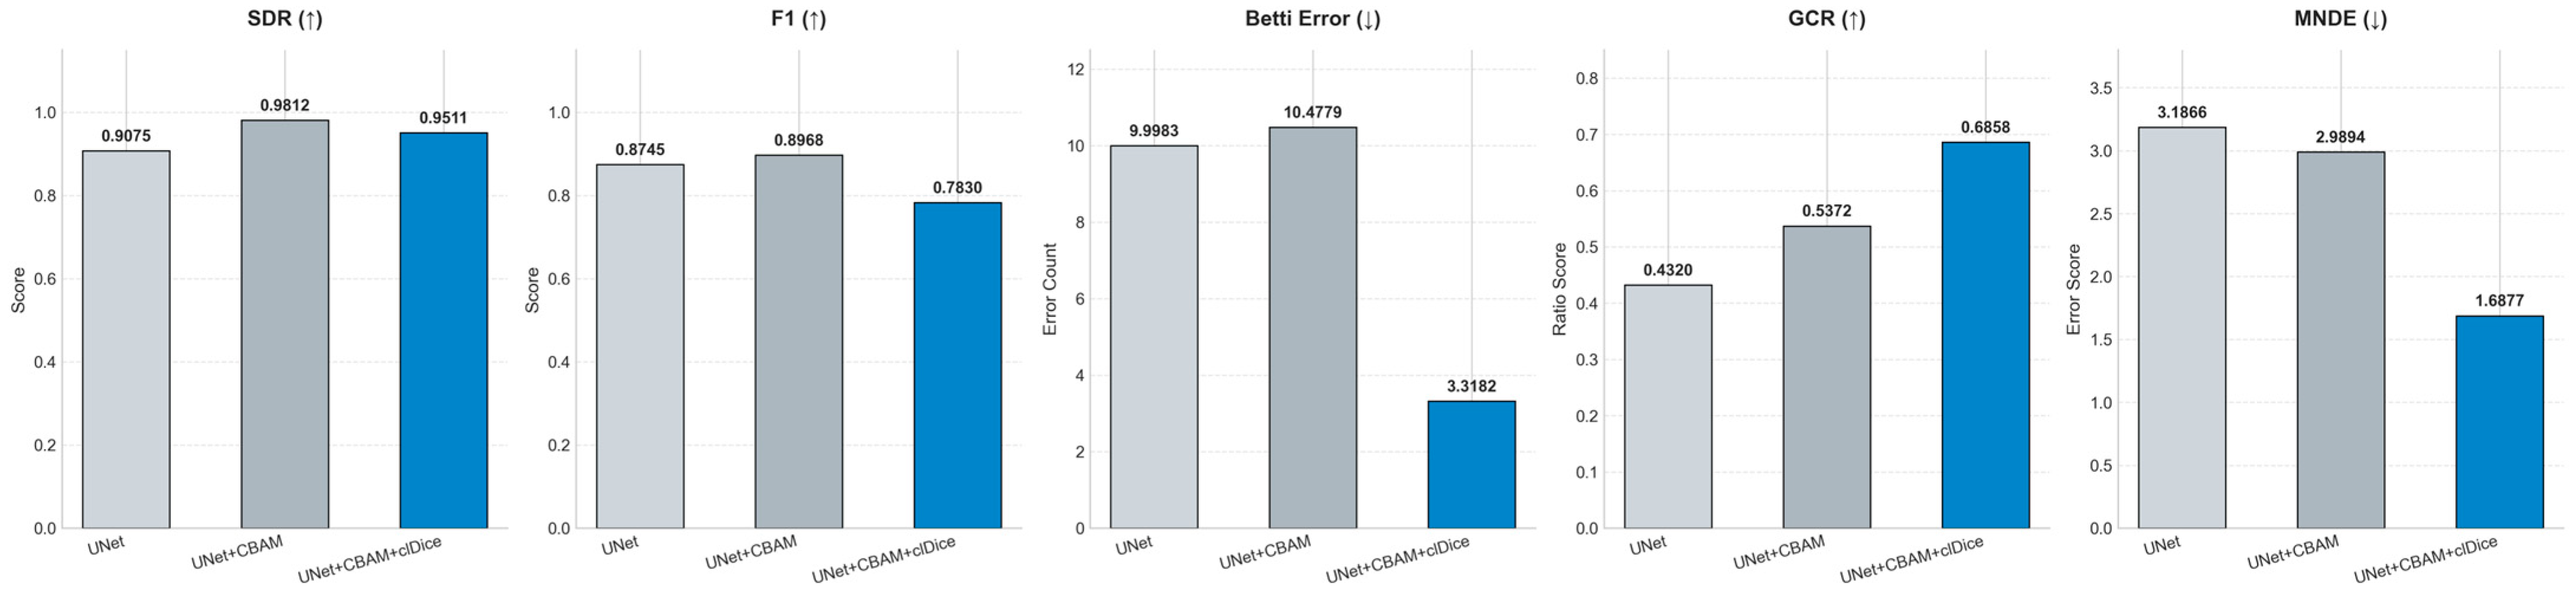
To evaluate the specific contributions of the CBAM and clDice loss functions separately, we evaluated different modules. As shown in
Figure 6, an independent UNet architecture was set as the baseline, and both the F1 and SDR metrics demonstrated satisfactory results. Although CBAM achieved slight improvements on these two metrics, it failed to resolve the topological discontinuity issue, resulting in the Betti error stubbornly remaining at 10.4779. This clearly indicates that relying solely on feature-level attention mechanisms is insufficient to achieve global geometric connectivity.
Our proposed clDice-constrained multi-task framework represents the most significant advancement toward reliable automatic oBRB evaluation. Although this approach results in reduced pixel-level overlap (SDR = 0.9511) and a lower F1 score for connected points (0.7830), our qualitative visual results strongly demonstrate that this statistical trade-off is justified. Predictions generated by baseline models and attention-only models are coarser and more fragmented, which artificially inflates pixel-matching scores and fundamentally compromises the integrity of the network. In contrast, our algorithm largely eliminates topological errors, reducing the Betty error to 3.3182, while the GCR and MNDE metrics also demonstrate the superiority of our algorithm. By forcing the network to extract a clear and continuous skeleton rather than a coarse probabilistic map, our method effectively bridges the gaps commonly found in standard predictions. Ultimately, it establishes a geometrically faithful representation of the topological structure of TJ—a prerequisite for the quantitative evaluation of oBRB integrity metrics such as connection break rates and network connectivity density.
4. Discussion
Traditional deep learning models have certain limitations in preserving topological structures, particularly when predicting fine-grained branch skeletons. They tend to focus more on pixel-level overlaps rather than the integrity of the overall structure. This can lead to significant errors in evaluating barrier functionality and affect subsequent experimental analyses. The multi-task framework we developed in this study (inspired by clDice and CBAM) addresses this challenge by shifting the prediction from the pixel level to the structural connectivity level.
Our research demonstrates that region-based loss functions, such as Dice and cross-entropy, yield more robust skeleton predictions by minimizing penalties for spatial misalignment. Although this extended framework improves SDR and F1 scores, it fails to prevent structural fragmentation and discontinuities. Particularly in biological modeling, such discontinuities can become a critical source of interference. In contrast, our model reduces the Betti error to 3.3182, providing more complete topological features. For downstream morphological analysis, this model is more valuable than highly fragmented masks. The model is trained on pseudo-labels generated by the skeleton refinement process rather than on precise manual annotations. Even under this setup, the network is still capable of learning stable topological representations, indicating that the structural constraints introduced by the loss function play a dominant role in guiding connectivity learning.
Through the ablation experiments in
Section 3.4, we can also clearly identify the specific contributions of CBAM and clDice. We found that relying solely on CBAM is insufficient for achieving global connectivity, as the Betti number remains at 10.4779. This indicates that while CBAM can refine local features, it lacks global geometric constraints. The incorporation of clDice addresses this shortcoming by penalizing topological deviations between the predicted and actual skeletons, enabling the network to learn the skeletal lines of TJ structures and thereby generate clearer single-pixel predictions. By extracting skeletal feature information, we can calculate metrics such as cell area, rupture rate, and network density, thereby enabling quantitative measurement of retinal barrier damage. This provides a more efficient analytical tool for studying the progression of retinal diseases under oxidative stress.
Despite these advances, several key limitations of this study must be explicitly acknowledged to guide future clinical translation. Currently, this framework operates as a structural extraction tool requiring subsequent post-processing steps, rather than a fully automated end-to-end diagnostic tool, and its performance under conditions of severe cell loss remains to be further investigated. Additionally, our evaluation is constrained by the small dataset size and limited biological variability of the samples, while our heavy reliance on skeleton-derived pseudo-labels rather than expert-certified manual annotations may introduce systematic training biases. Finally, the model’s generalization ability to diverse human clinical pathological image datasets remains uncertain and requires extensive cross-cohort validation. Future work will focus on expanding our dataset to incorporate broader biological and clinical diversity, integrating annotations from expert clinicians to refine the training process, and transforming this framework into a fully automated end-to-end clinical diagnostic platform capable of directly assessing the health status of the human retinal pigment epithelium (RPE).
5. Conclusions
In this study, we propose a novel deep topology-preserving network specifically designed for the accurate skeleton extraction and node identification of TJ in RPE immunofluorescence images. To address the structural fragmentation problem prevalent in traditional segmentation algorithms, our method integrates CBAM into a multi-task dual-head U-Net architecture. Crucially, we introduce a custom composite loss function that incorporates a clDice loss constraint, effectively prompting the network to prioritize structural continuity and topological integrity rather than relying solely on pixel-level classification.
Our experimental results reveal a critical trade-off between pixel-level spatial accuracy and topological fidelity. While baseline models such as UNet++ perform better in terms of pixel-level overlap, they exhibit severe topological instability, manifesting as spurious discontinuities that can easily be confused with true barrier lesions. In contrast, our proposed clDice constraint framework significantly reduces topological errors and demonstrates consistent results across three metrics of topological connectivity, indicating that our algorithm achieves a more complete preservation of topological connectivity.
However, a significant limitation remains: the proposed model currently functions solely as a high-precision preprocessing step for structural feature extraction. It cannot yet perform fully automated quantitative analysis of TJ damage. Therefore, although it provides high-fidelity topological inputs, subsequent computational workflows are still required to derive final pathological metrics such as specific connection breakage rates or network connectivity density. Addressing this gap by extending the current framework into an end-to-end automated diagnostic system for quantitative oBRB assessment will be a major focus of our future work.