1. Introduction
Wire electrical discharge machining (WEDM) removes material with controlled electrical discharges between a continuously moving wire electrode and an electrically conductive workpiece immersed in a dielectric fluid. Because there is no direct mechanical contact, the process is well-suited to complex geometries and difficult-to-machine materials that require dimensional accuracy, particularly in aerospace, automotive, and tool-making applications [
1]. Ho et al. [
1] identified wire breakage and wire electrode wear as persistent limits on WEDM efficiency and accuracy, and these issues remain central in current work on process stability.
Inconel 718 is difficult to machine conventionally because it retains high strength at elevated temperatures, has low thermal conductivity, and work-hardens readily. WEDM is therefore a useful option for this alloy. The discharge environment, however, progressively damages the wire electrode. Wear appears as mass loss, cratering, diameter reduction, and the deposition of workpiece-derived elements on the wire surface. These changes can reduce dimensional accuracy, increase the probability of wire breakage, and raise consumable cost [
1,
2].
Wire wear has been investigated for several difficult-to-machine materials. Tosun and Cogun [
3] studied the WWR (Wire Wear Ratio) during WEDM of AISI 4140 steel and reported discharge voltage as the dominant factor. Goswami and Kumar [
4] used a Taguchi L27 array for Nimonic 80A and found pulse-on time, together with its interaction with pulse-off time, to be most influential. Similar trends were reported for Nimonic 75 [
5], Al-based metal matrix composites [
6], and Nimonic 263 [
7], although the relative contributions depended on the workpiece, electrode, and generator system. Taken together, these studies point to pulse-on time as a recurring driver of wire wear, but not as a universal single-factor explanation.
Work focused specifically on Inconel 718 is more limited. Ramakrishnan and Karunamoorthy [
8] examined WEDM performance with a brass wire electrode, but their emphasis was on the material removal rate and surface roughness; wire wear was only represented indirectly through wire consumption. Dhale and Deshmukh [
9] considered the wire diameter together with dimensional deviation, wire consumption, and surface quality. Abhilash and Chakradhar [
10] later compared four wire electrode types for the WEDM of Inconel 718 and linked discharge energy to wire-break failure. In a subsequent study, they proposed a machine-vision system for in-process WWR estimation and showed that adaptive changes in pulse-off time, servo voltage, and the wire feed rate can keep wire wear within safer limits [
11]. Buk et al. [
12] used surface-topography-based indicators to compare wire wear for Inconel 718, Ti-6Al-4V, and 42CrMo4 steel. These studies show that wire wear in Inconel 718 is recognised as a practical issue, but they do not provide a direct gravimetric factorial decomposition of the principal electrical parameters for the material–electrode combination considered here.
The mechanisms of wire wear have also been studied from the standpoint of discharge behaviour and surface damage. Liao et al. [
13] distinguished two wire rupture modes using spark-frequency analysis and SEM observation: sudden thermal overload and gradual deterioration caused by excessive arc discharges. Luo [
14] showed that erosion craters reduce the effective load-bearing cross-section of the wire and act as stress concentrators. Lee and Liao [
15] further demonstrated that the ratio of normal to arc sparks can serve as an indicator of process stability and wire condition. Morphological studies by Singh et al. [
5] and Grigoriev et al. [
16] reported wider and deeper craters with increasing pulse-on times and peak currents, along with the transfer of workpiece elements to the wire surface.
The electrode construction is also relevant. Kruth et al. [
2] showed that coating composition and thickness affect the discharge process; zinc-rich coatings can improve flushing by promoting explosive vaporisation of the dielectric and reducing arc formation. Elecut X uses a gamma-phase Cu
5Zn
8 coating on a pure copper core, combining the high conductivity of copper with the discharge behaviour of a zinc-based coating. Altuğ [
17] also noted that workpiece thermal and microstructural properties influence WWR, while Kneubühler et al. [
18] pointed out that the deposition of workpiece material on the wire surface can bias purely gravimetric wear assessment. This issue is especially relevant for Inconel 718, where transferred elements may remain on the electrode surface after cutting.
The specific combination of Inconel 718, a gamma-phase Cu
5Zn
8-coated copper-core electrode, and a complete full factorial design with direct gravimetric measurement has not yet been reported. Previous Inconel 718 studies have relied on indirect wire consumption [
9], image-based WWR estimation [
11], comparisons between other wire materials [
10], or surface-topography-based wear indicators [
12]. Many gravimetric studies on other materials have used Taguchi-type arrays [
4,
5,
6], which are efficient for screening but do not resolve all two-way interactions. The present work addresses this gap through a complete 3
3 factorial experiment with the pulse-on time (A), pulse-off time (B), and servo reference voltage (Aj) as factors. Oscilloscope monitoring was used to verify the discharge regime before measurement, and ANOVA was applied to quantify the contribution of each factor.
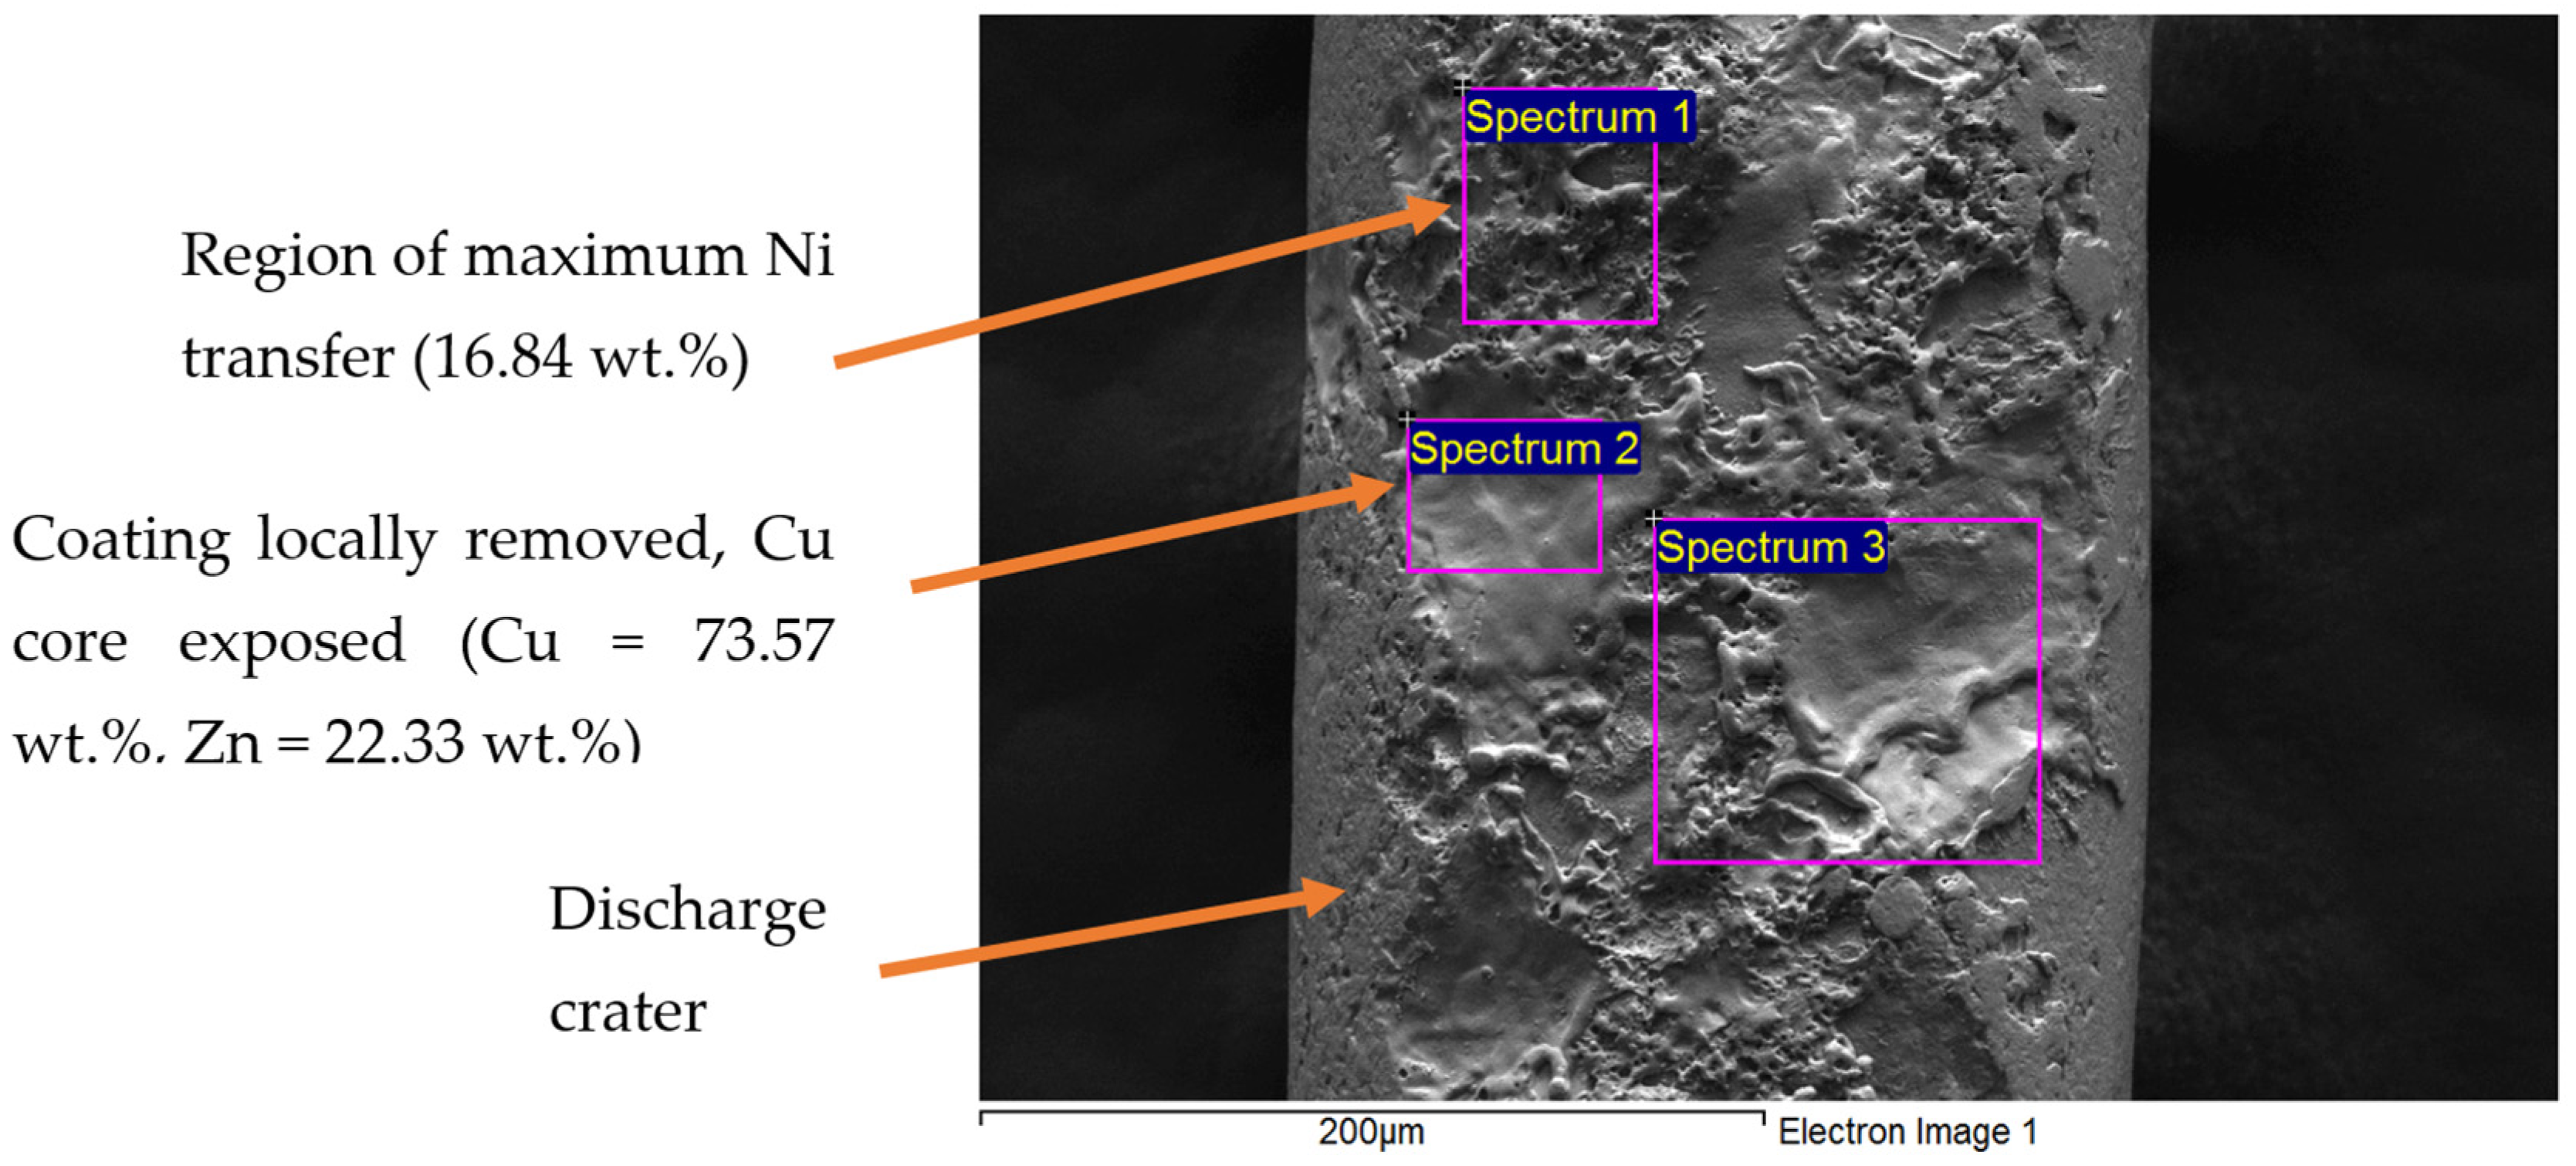
Novelty and contribution: This study provides (i) a consistent gravimetric dataset for wire electrode wear in the combination Inconel 718 + γ-Cu5Zn8-coated copper-core wire under a complete 33 full factorial design; (ii) an ANOVA decomposition of the main effects and two-way interactions of pulse-on time, pulse-off time, and servo reference voltage; and (iii) SEM/EDS evidence of workpiece-to-electrode material transfer on the Elecut X wire, including a local nickel concentration of 16.84 wt.% on the frontal face of the most worn electrode. These contributions are intended to support both parameter selection and the interpretation of gravimetric wear measurements in this material combination.
2. Materials and Methods
The workpiece material was Inconel 718, a precipitation-hardened nickel-based superalloy used in aerospace, power generation, and high-temperature structural components because of its strength, oxidation resistance, and fatigue performance at elevated temperatures. The chemical composition is listed in
Table 1. Values were taken from the mill test certificate supplied with the material and conform to the nominal composition ranges of Inconel 718 according to UNS N07718 (W.Nr. 2.4668). The workpiece was a rectangular block with dimensions of 10 × 30 × 120 mm.
All experiments used an Elecut X wire electrode (ø 0.25 mm, tensile strength 500 N/mm
2, and electrical conductivity 65% IACS) supplied by ELERO s.r.o. (Považská Bystrica, Slovakia). The wire consists of a pure copper core with an electrolytically deposited gamma-phase Cu
5Zn
8 coating. This construction is intended to combine the conductivity of the copper core with the discharge behaviour and thermal response of a zinc-rich coating. The γ-Cu
5Zn
8 coating thickness was not measured directly on a wire cross-section in the present study; for similar electrolytically coated WEDM electrodes, coating thicknesses of the order of a few micrometres have been reported [
2]. Although the γ-Cu
5Zn
8 phase has lower electrical and thermal conductivity than pure copper [
19], the overall wire conductivity (65% IACS) is dominated by the copper core, while the zinc-rich coating mainly contributes through favourable ionisation behaviour and controlled vaporisation during discharge.
The experiments were performed on a Charmilles Robofil 310 CNC wire electrical discharge machine (AgieCharmilles, Losone, Switzerland), with axis travel of 400 × 250 × 400 mm and a maximum workpiece weight of 1000 kg. A Keysight EDUX1002A digital storage oscilloscope (Keysight Technologies, Santa Rosa, CA, USA) was connected to the generator output to monitor the discharge signal. Before each 5 min measurement, cutting continued until the actual pulse-off time B reached the programmed value. Only then was the measurement interval started so that the recorded wear corresponded to the intended parameter settings. The dielectric fluid used in all experiments was deionised water, which is the standard dielectric medium for the Charmilles Robofil 310 transistor-controlled WEDM generator and for the corresponding cutting parameters tested in this study.
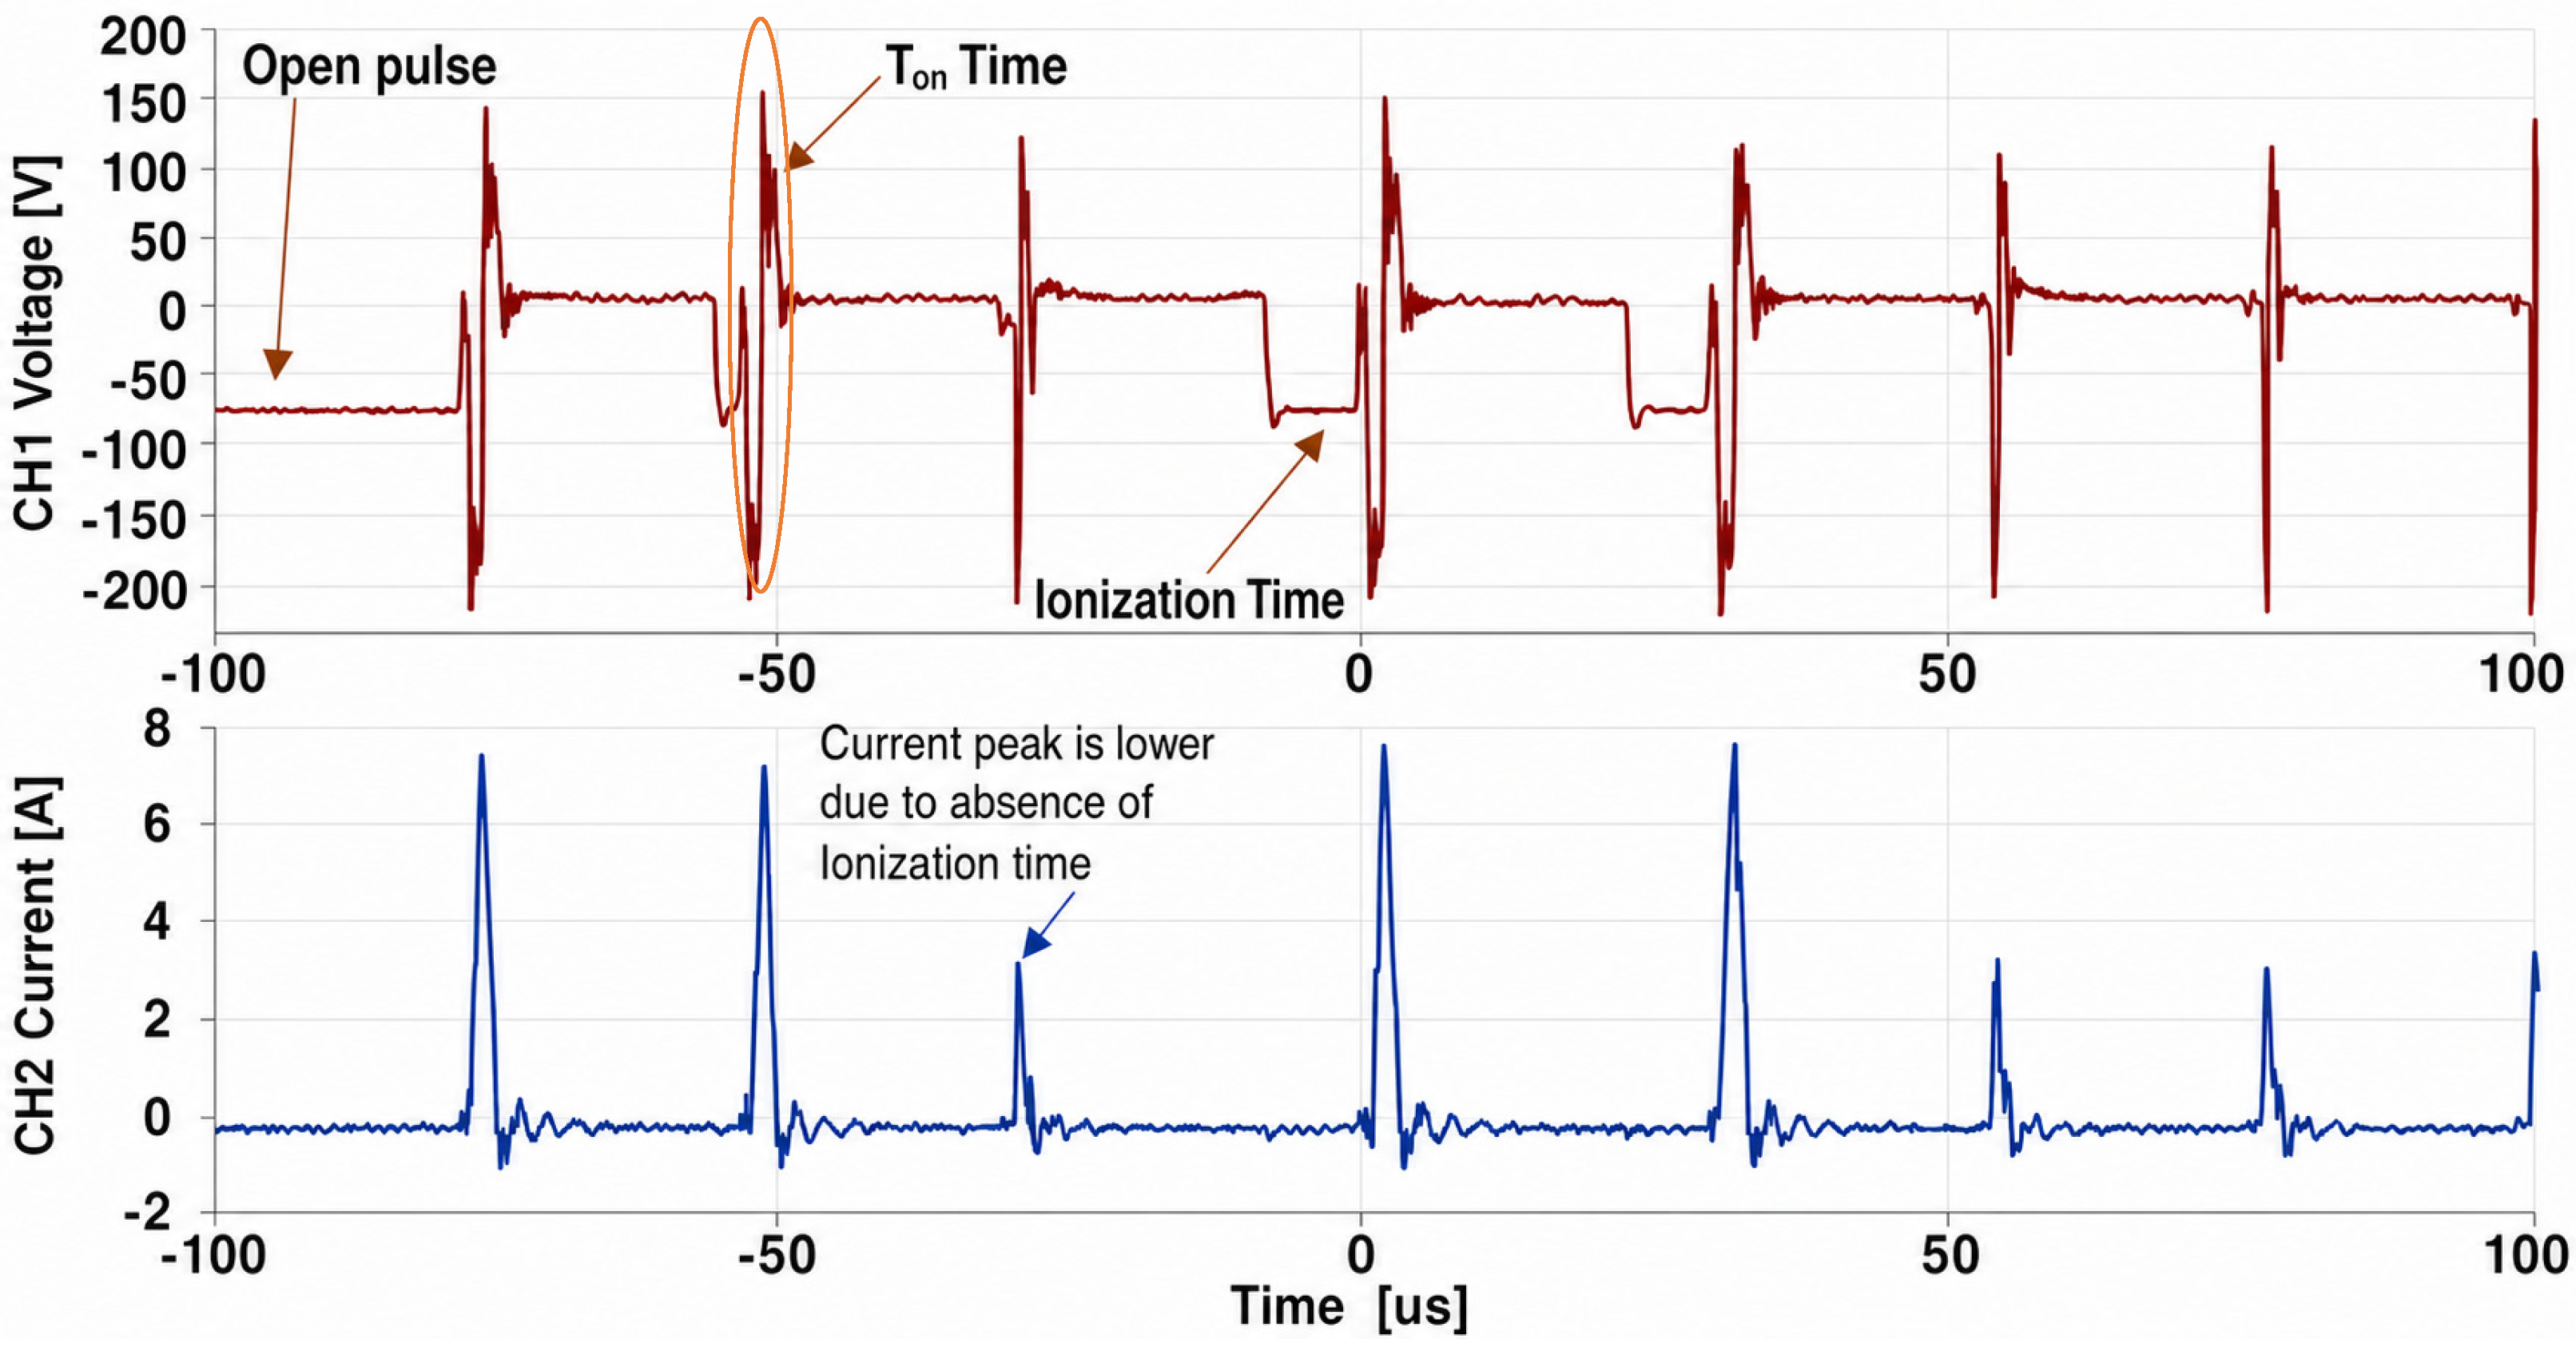
The waveform in
Figure 1 illustrates the discharge states observed during cutting, including normal discharge pulses, open pulses, the ionisation time, and the pulse-off time (T
off). A normal discharge pulse is preceded by an ionisation period, during which the dielectric breaks down and a plasma channel forms between the wire and the workpiece. If this ionisation period is absent, usually because of debris in the gap, the current peak is lower, and the pulse contributes less energy to material removal. This occurs because conductive debris in the gap establishes a partial current path, triggering breakdown before the voltage reaches its nominal ignition level and preventing the formation of a well-defined plasma channel. Since pulse energy is the time integral of the product of the voltage and current, both the reduced breakdown voltage and the lower current peak diminish the thermal energy delivered to the spark site. Open pulses occur when voltage is applied but breakdown does not take place, either because the gap is too large or because local conditions do not support discharge initiation. Measurements for each experimental run were initiated only after T
off reached its programmed value, confirming stable process conditions.
Figure 1 also shows why the oscilloscope was used as a starting criterion for each measurement. At the beginning of a cut, the machine control system adjusts the discharge gap, and the actual pulse-off time can be longer than the programmed value. After stabilisation, B decreases to the set value. From that point onward, the discharge regime is suitable for comparing the programmed parameter combinations.
After machining, the separated wire segment was cleaned with isopropanol and a paper tissue to remove dielectric residues and loose deposited particles. The segment was then weighed three times on a KERN PCB 350-3 analytical balance (KERN & Sohn GmbH, Balingen, Germany), with 350 g capacity, 0.001 g resolution, and 0.001 g repeatability.
Wire wear was expressed as mass loss Δm (g), calculated from the difference between the initial mass of the new 4 m wire segment (1.672 g) and the mean post-machining mass. The standard uncertainty of the mean was calculated for each run as:
where SD is the standard deviation of the three repeated weighings, and n = 3 is the number of weighing repetitions. The expanded uncertainty of mass loss at approximately 95% confidence was calculated as
using a coverage factor k = 2. Across the 27 runs, the mean standard uncertainty of the mean was u(
) = 0.91 mg, and the mean expanded uncertainty was U95(Δm) = 1.82 mg. This corresponds to a mean relative uncertainty of 2.7% of the measured mass loss. Because u(
) is close to the balance resolution, the balance itself was the dominant uncertainty source.
Surface morphology and elemental composition of selected wire electrode samples were analysed using a JEOL JSM-7600F high-resolution scanning electron microscope (JEOL Ltd., Tokyo, Japan) equipped with an Oxford Instruments X-Max 50 mm2 energy-dispersive X-ray spectrometer (EDS) (Oxford Instruments Plc., High Wycombe, UK) for elemental analysis in a secondary electron imaging (LEI) regime.
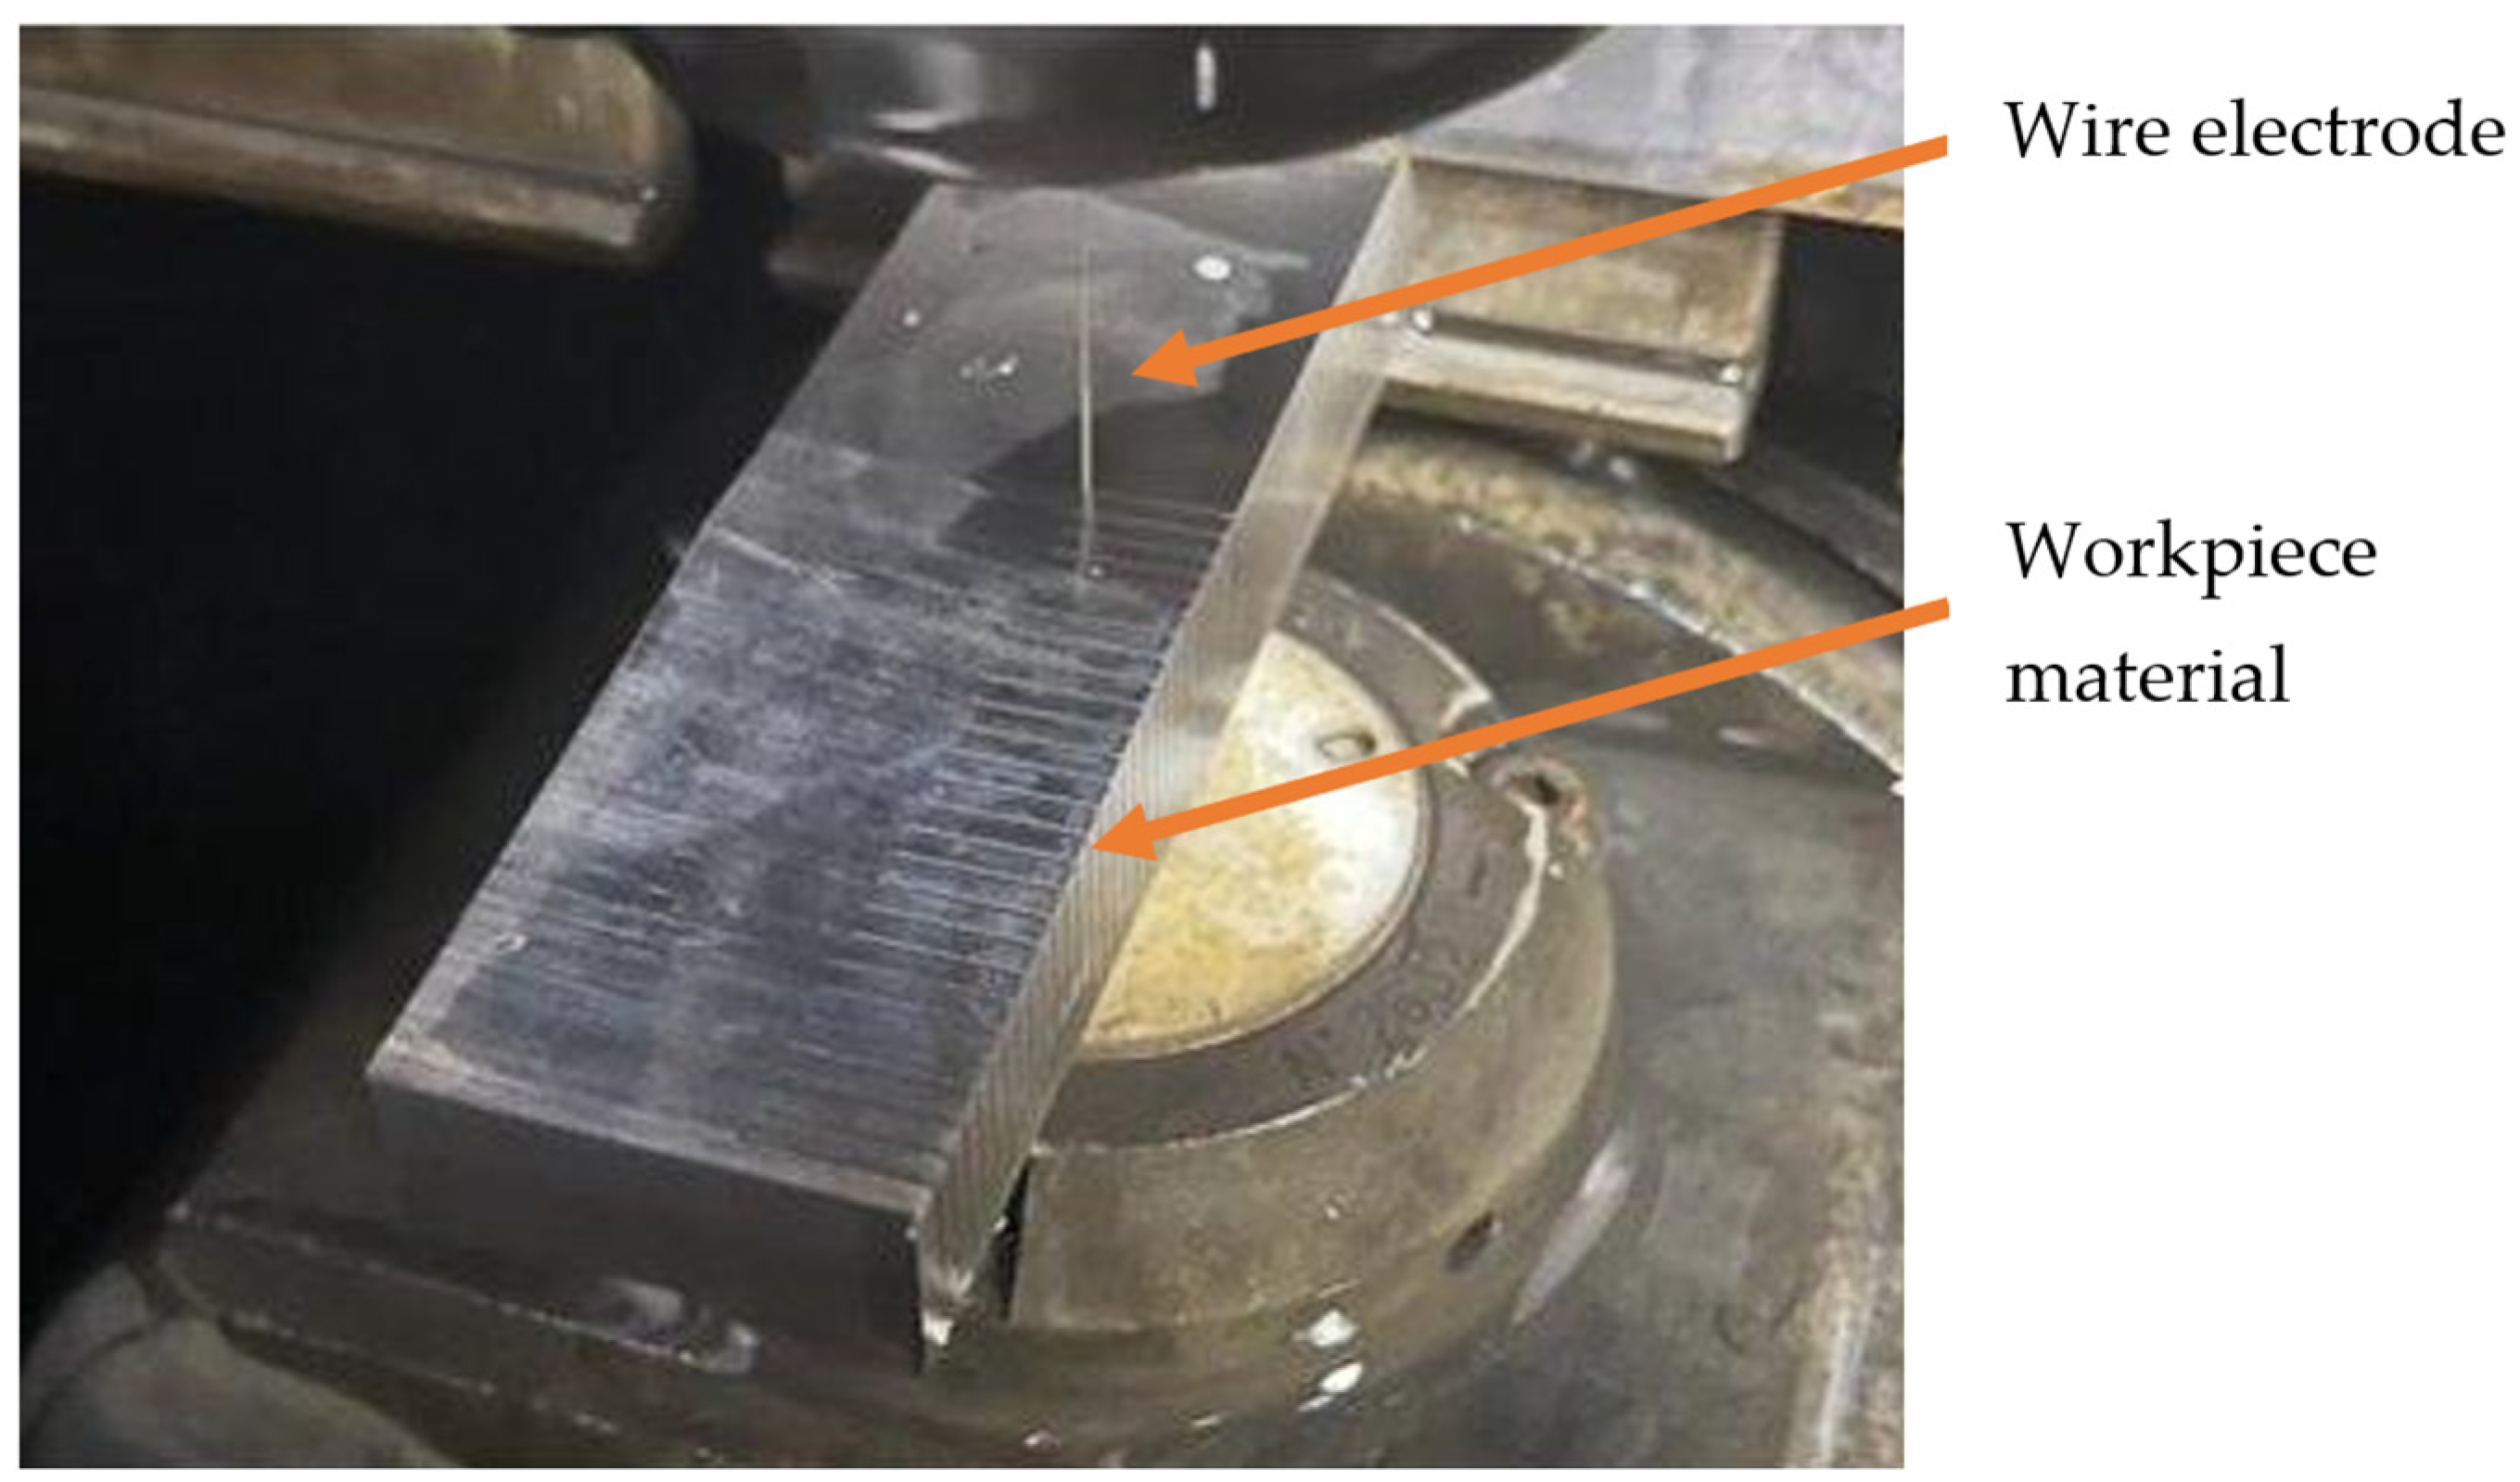
Figure 2 shows the experimental setup during a typical WEDM run, with the Inconel 718 workpiece clamped on the working table of the Charmilles Robofil 310 CNC wire EDM machine (AgieCharmilles, Losone, Switzerland). The fully CNC-controlled execution of the programmed parameter combinations, together with the oscilloscope-based stability verification described above, ensured reproducible and well-defined discharge conditions for all 27 experimental runs.
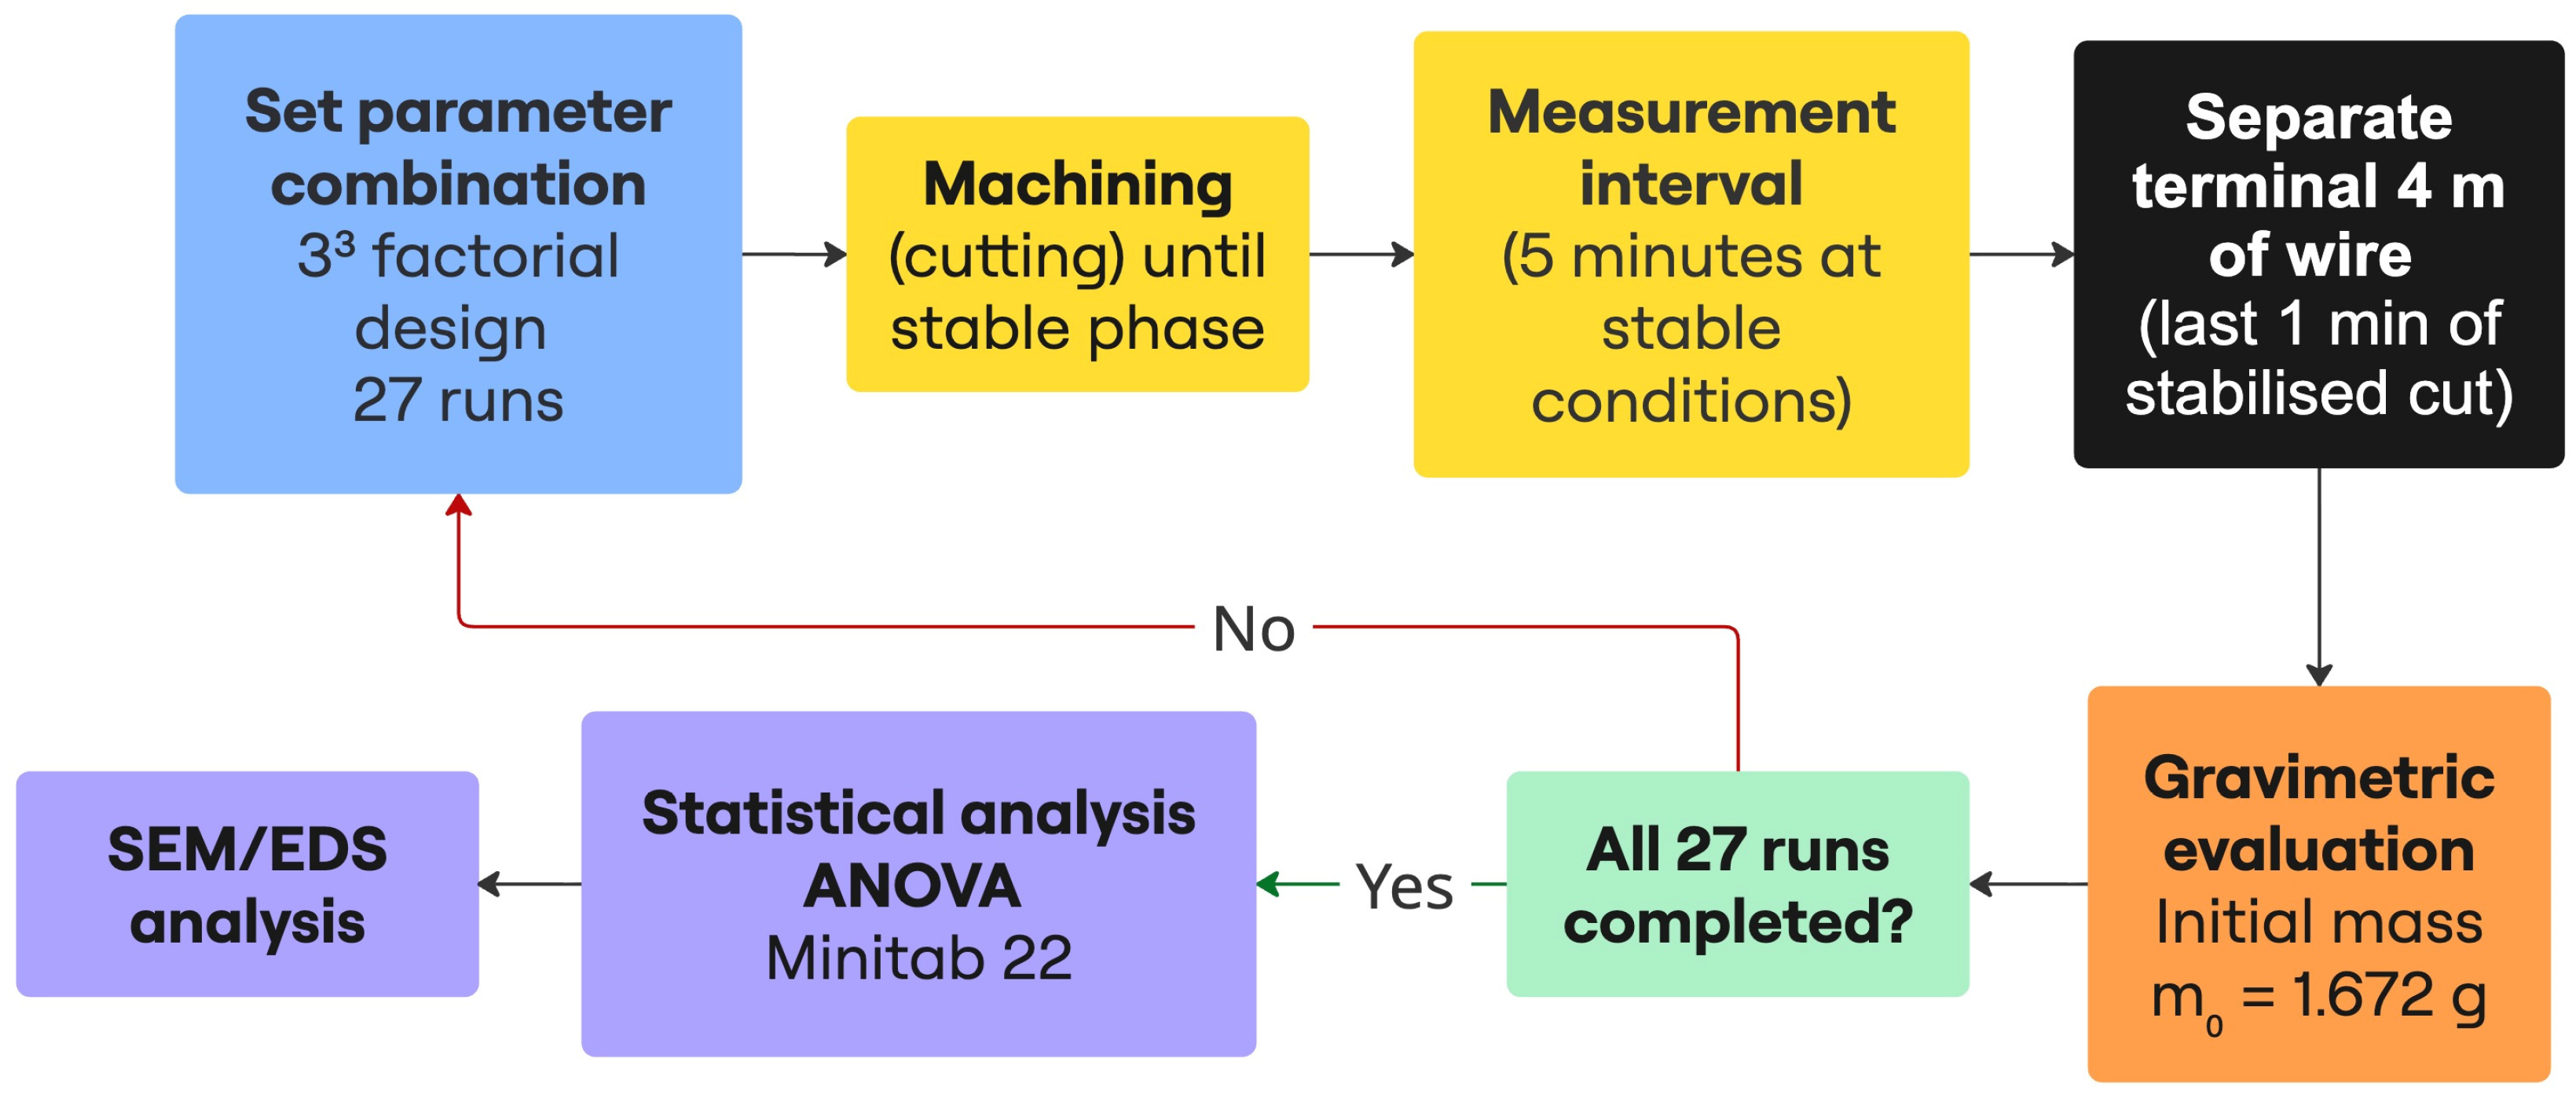
For each run, the wire first cut under the selected parameter combination until stable oscilloscope conditions were reached. The following 5 min interval was used for measurement. After this interval, machining was stopped and the terminal 4 m of wire was separated for gravimetric evaluation. With a constant wire feed speed of 4 m·min−1, this segment corresponds to the wire exposed during the final minute of the stabilised cut.
Wire feed speed (WS) affects how many discharge craters are distributed along a given length of wire, because it controls the supply rate of fresh electrode material into the cutting zone. In this experiment, WS was fixed at a relatively low value of 4 m·min−1. The purpose was to increase the crater density per unit wire length and thereby make the gravimetric wear signal more sensitive to the electrical parameters A, B, and Aj.
A schematic overview of the full experimental procedure, summarising the parameter-setting, machining, stabilisation, gravimetric, and statistical evaluation steps, is shown in
Figure 3. The loop back to the parameter-setting block indicates that each of the 27 factorial combinations was processed through the same procedure, and the workflow proceeds to the final ANOVA and SEM/EDS analyses only after all runs have been completed.
The experiment followed a complete 3
3 factorial design with 27 runs, covering all combinations of three factors at three levels. The variable parameters are listed in
Table 2, and the constant parameters are listed in
Table 3. The initial mass of the new 4 m Elecut X segment was 1.672 g. Statistical analysis was carried out in Minitab 22 (Minitab LLC, State College, PA, USA) using analysis of variance (ANOVA).
All other process parameters were fixed for the 27 runs and are listed in
Table 3. The oscilloscope-based stability criterion described above was applied before each measurement.
The 27 runs were completed sequentially in the systematic factorial order given in
Table 4 in one uninterrupted session of approximately 5 h rather than in a randomised order. The three principal sources of potential time-correlated drift—dielectric temperature, dielectric conductivity, and the discharge waveform—were monitored throughout the session: temperature remained constant at 18 °C, conductivity stayed within 12–16 µS/cm (measured every 30 min), and oscilloscope verification before each run showed no systematic change in the waveform. A stabilisation phase preceded each measured cut, and a single wire spool was used for the entire campaign. Despite the absence of strict randomisation, the monitored parameters showed no systematic drift across the session, and therefore, the risk of confounding between run order and the estimated factor effects is low.
4. Discussion
The factor ranking is consistent with the wider WEDM literature, where pulse-on time is often reported as a major driver of wire wear [
5,
6,
7]. Its high contribution in the present dataset is partly due to the wide relative range tested, from 0.4 to 1.2 µs, and partly to the low thermal conductivity of Inconel 718, which favours heat concentration in the discharge zone. Differences from studies such as Tosun and Cogun [
3], where discharge voltage dominated, can be explained by generator architecture. In RC-type systems, pulse energy depends strongly on open-circuit voltage, whereas in the transistor-controlled Charmilles Robofil 310, it is mainly governed by U·I·t
on. In this setting, pulse-on time is the most direct control of thermal loading.
The comparison with Abhilash and Chakradhar [
10,
11] also shows why factor contributions should be interpreted in context. Their machine-vision WWR method captured local geometric change, whereas the present gravimetric method measures net mass change over a 4 m wire segment. Their wire electrodes also differed from the γ-Cu
5Zn
8-coated copper-core Elecut X wire used here. The two approaches therefore describe related but not identical aspects of wire wear.
The physical mechanism behind this factor ranking can be interpreted in terms of the thermophysical asymmetry between the γ-Cu
5Zn
8 coating and the copper core. Zinc, the dominant constituent of the coating, has much lower melting and boiling temperatures than copper: approximately 419.5 °C and 907 °C for Zn, compared with approximately 1084.6 °C and 2562 °C for Cu, respectively. In addition, the γ-Cu
5Zn
8 phase has lower thermal conductivity than pure copper [
19]. The zinc-rich coating can therefore act as a sacrificial thermal layer during discharge: local melting and vaporisation of the coating consume part of the deposited discharge energy, while the lower thermal conductivity of the γ phase delays heat transfer towards the copper core.
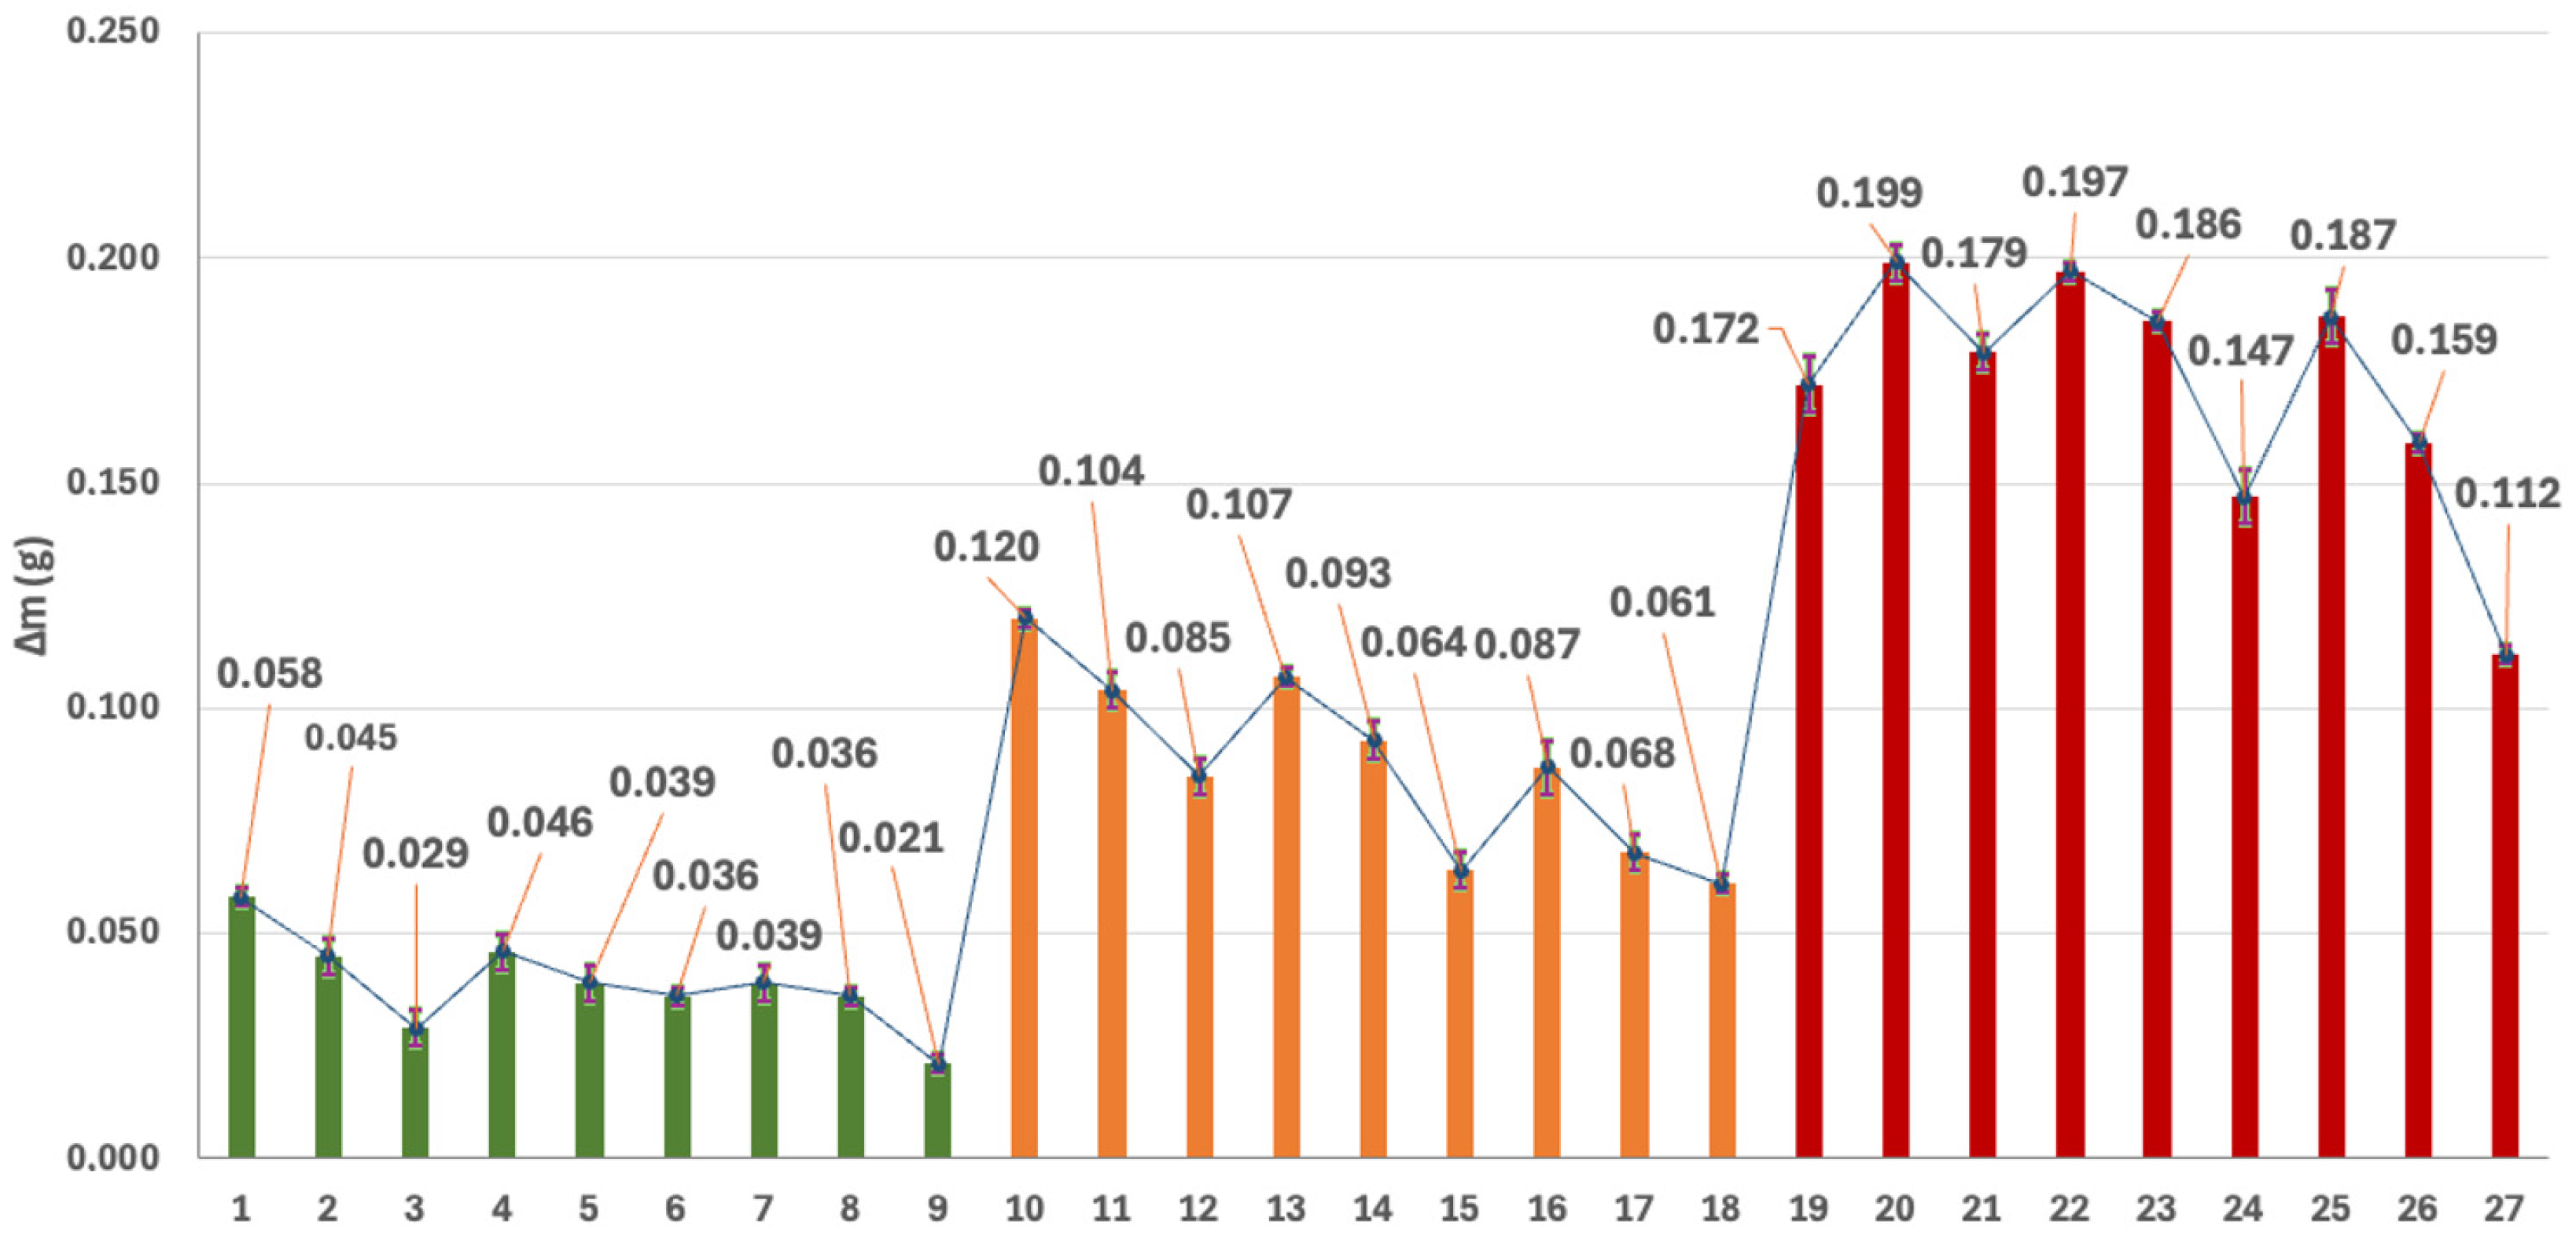
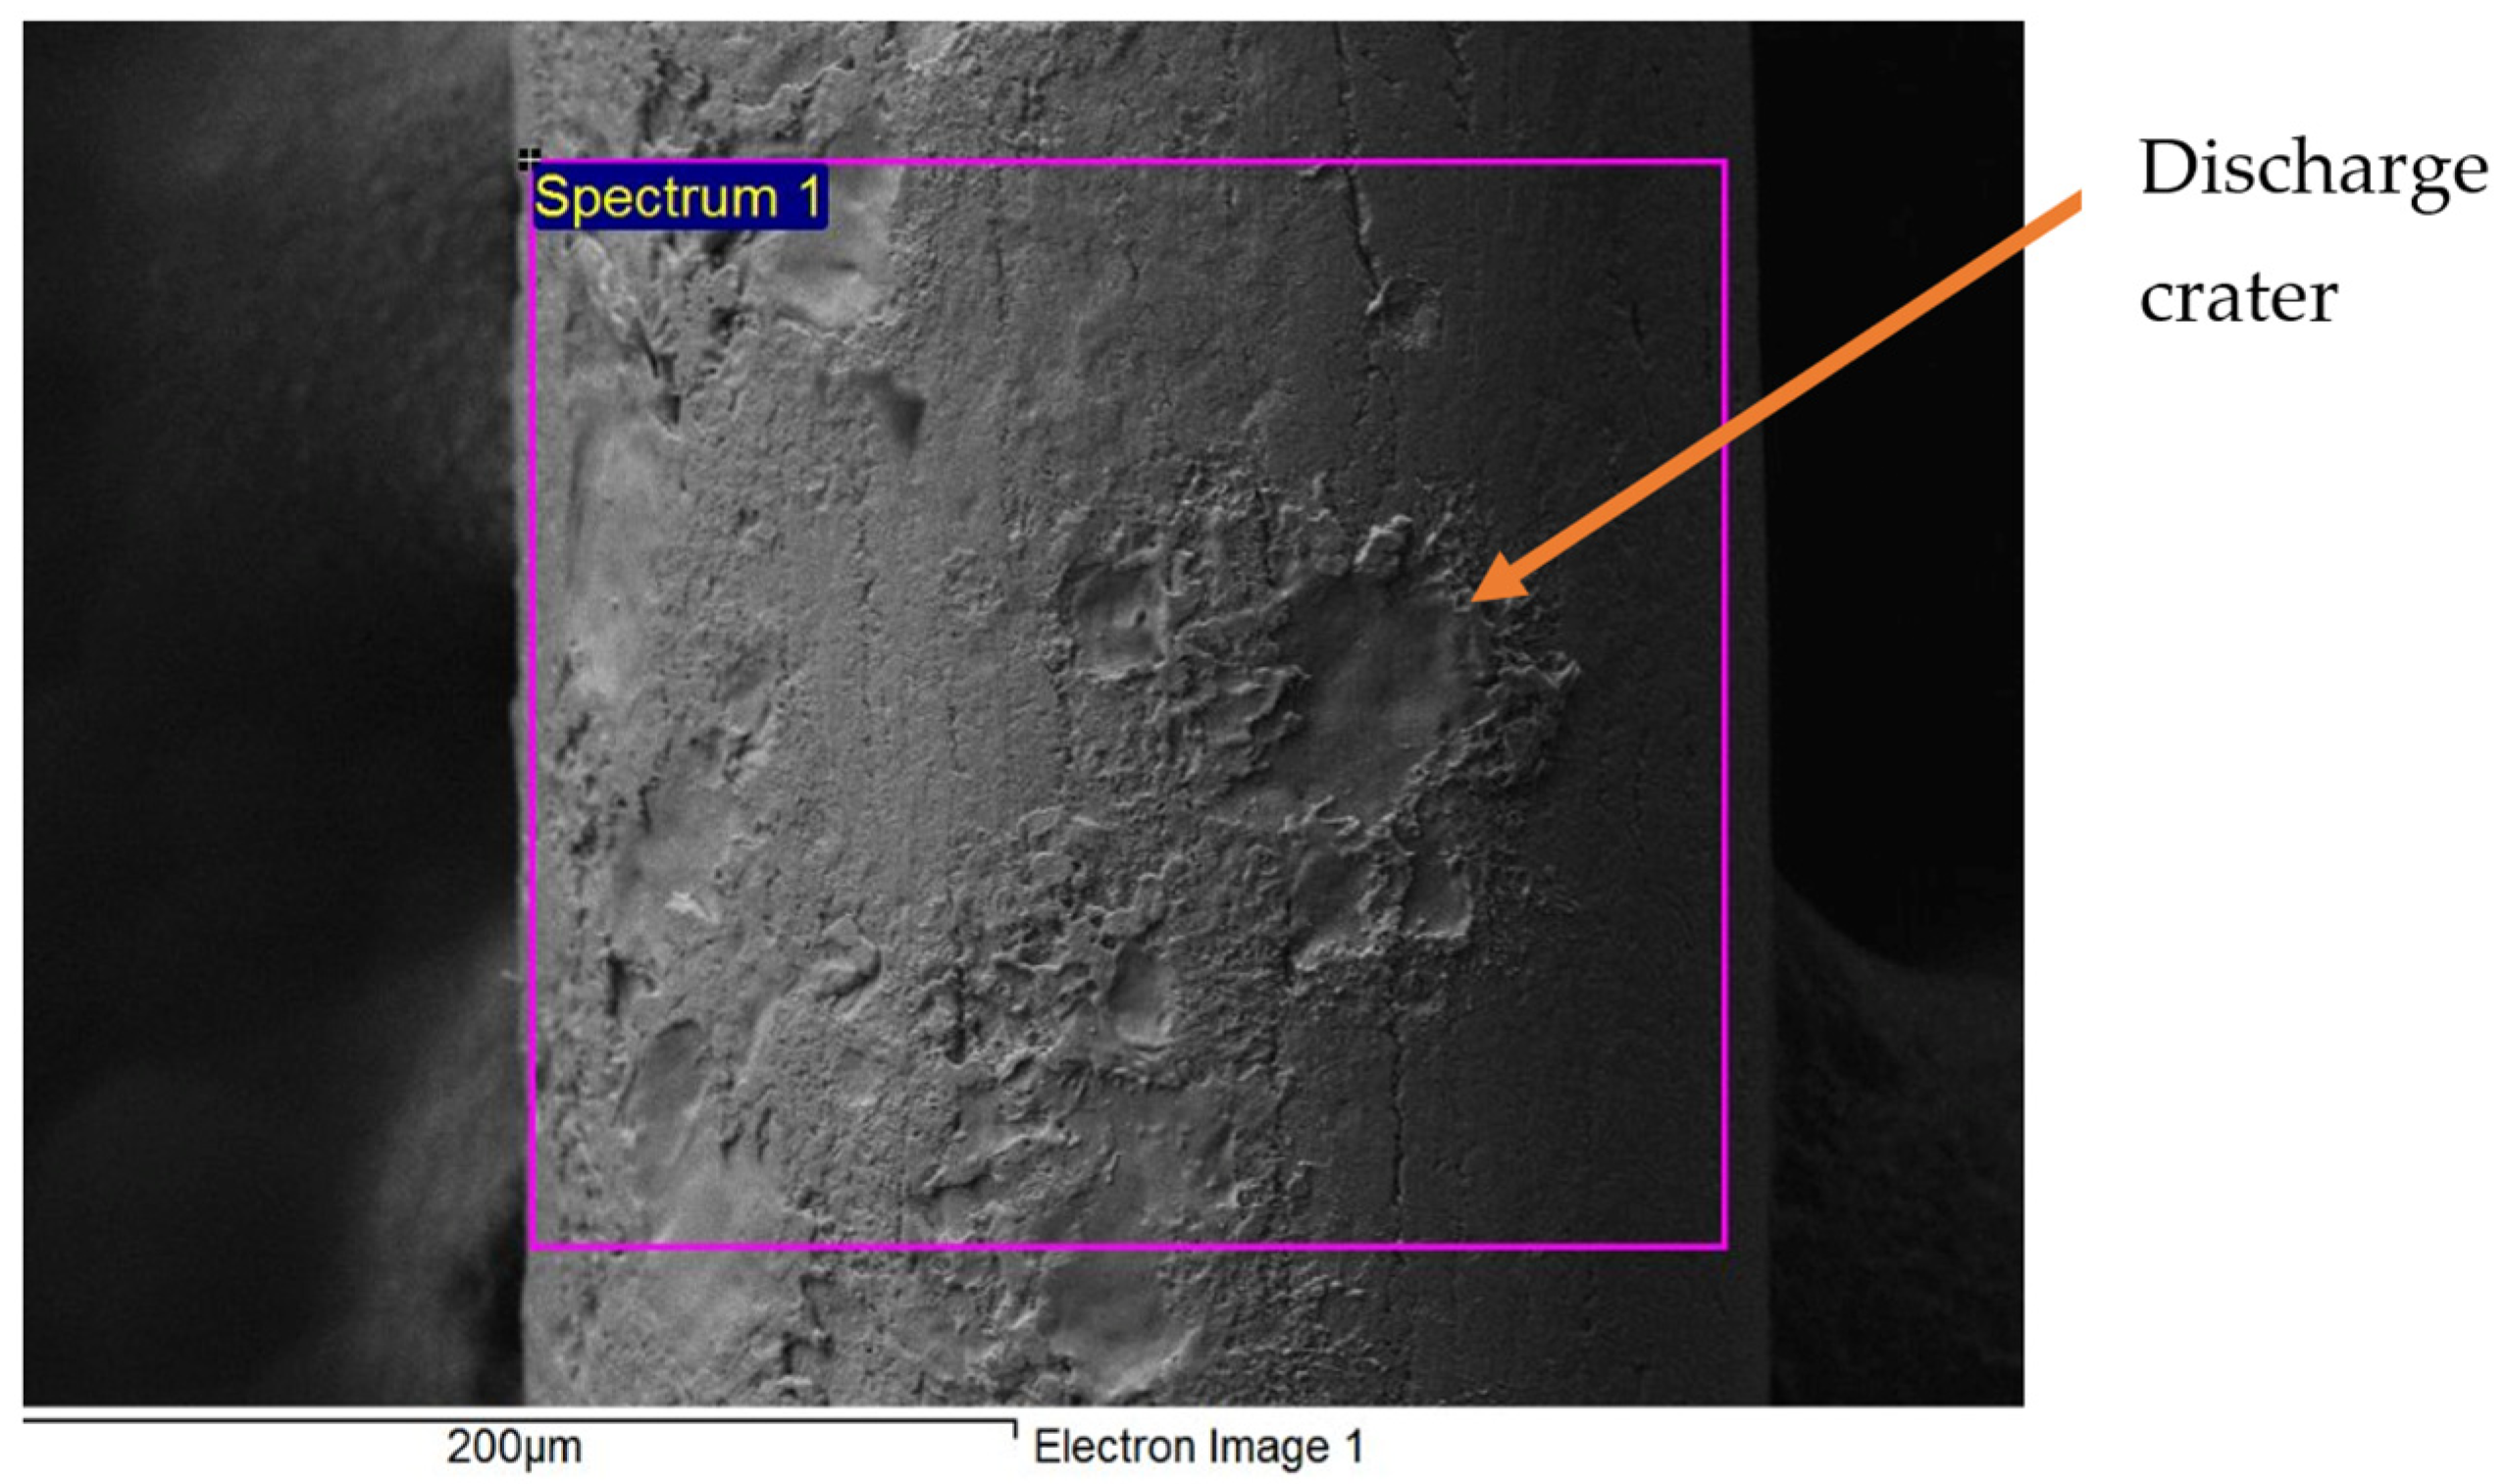
The effectiveness of this protective layer depends primarily on the energy delivered during each discharge. At the shortest pulse-on time tested (A = 0.4 µs, run 9), the discharge energy appears to remain largely within the coating-controlled wear regime. This is consistent with the EDS composition of the least worn electrode, which remains close to the original γ-Cu
5Zn
8 coating composition (Cu = 36.54 wt.%, Zn = 49.19 wt.%;
Table 8). At the longest pulse-on time tested (A = 1.2 µs, run 20), the higher discharge energy produces more severe local thermal damage, coating degradation, and local depletion of Zn-rich material. Spectrum 2 in
Table 9 (Cu = 73.57 wt.%, Zn = 22.33 wt.%) indicates that the γ-Cu
5Zn
8 coating has been locally thinned or removed to the extent that the copper core contributes strongly to the analysed surface volume.
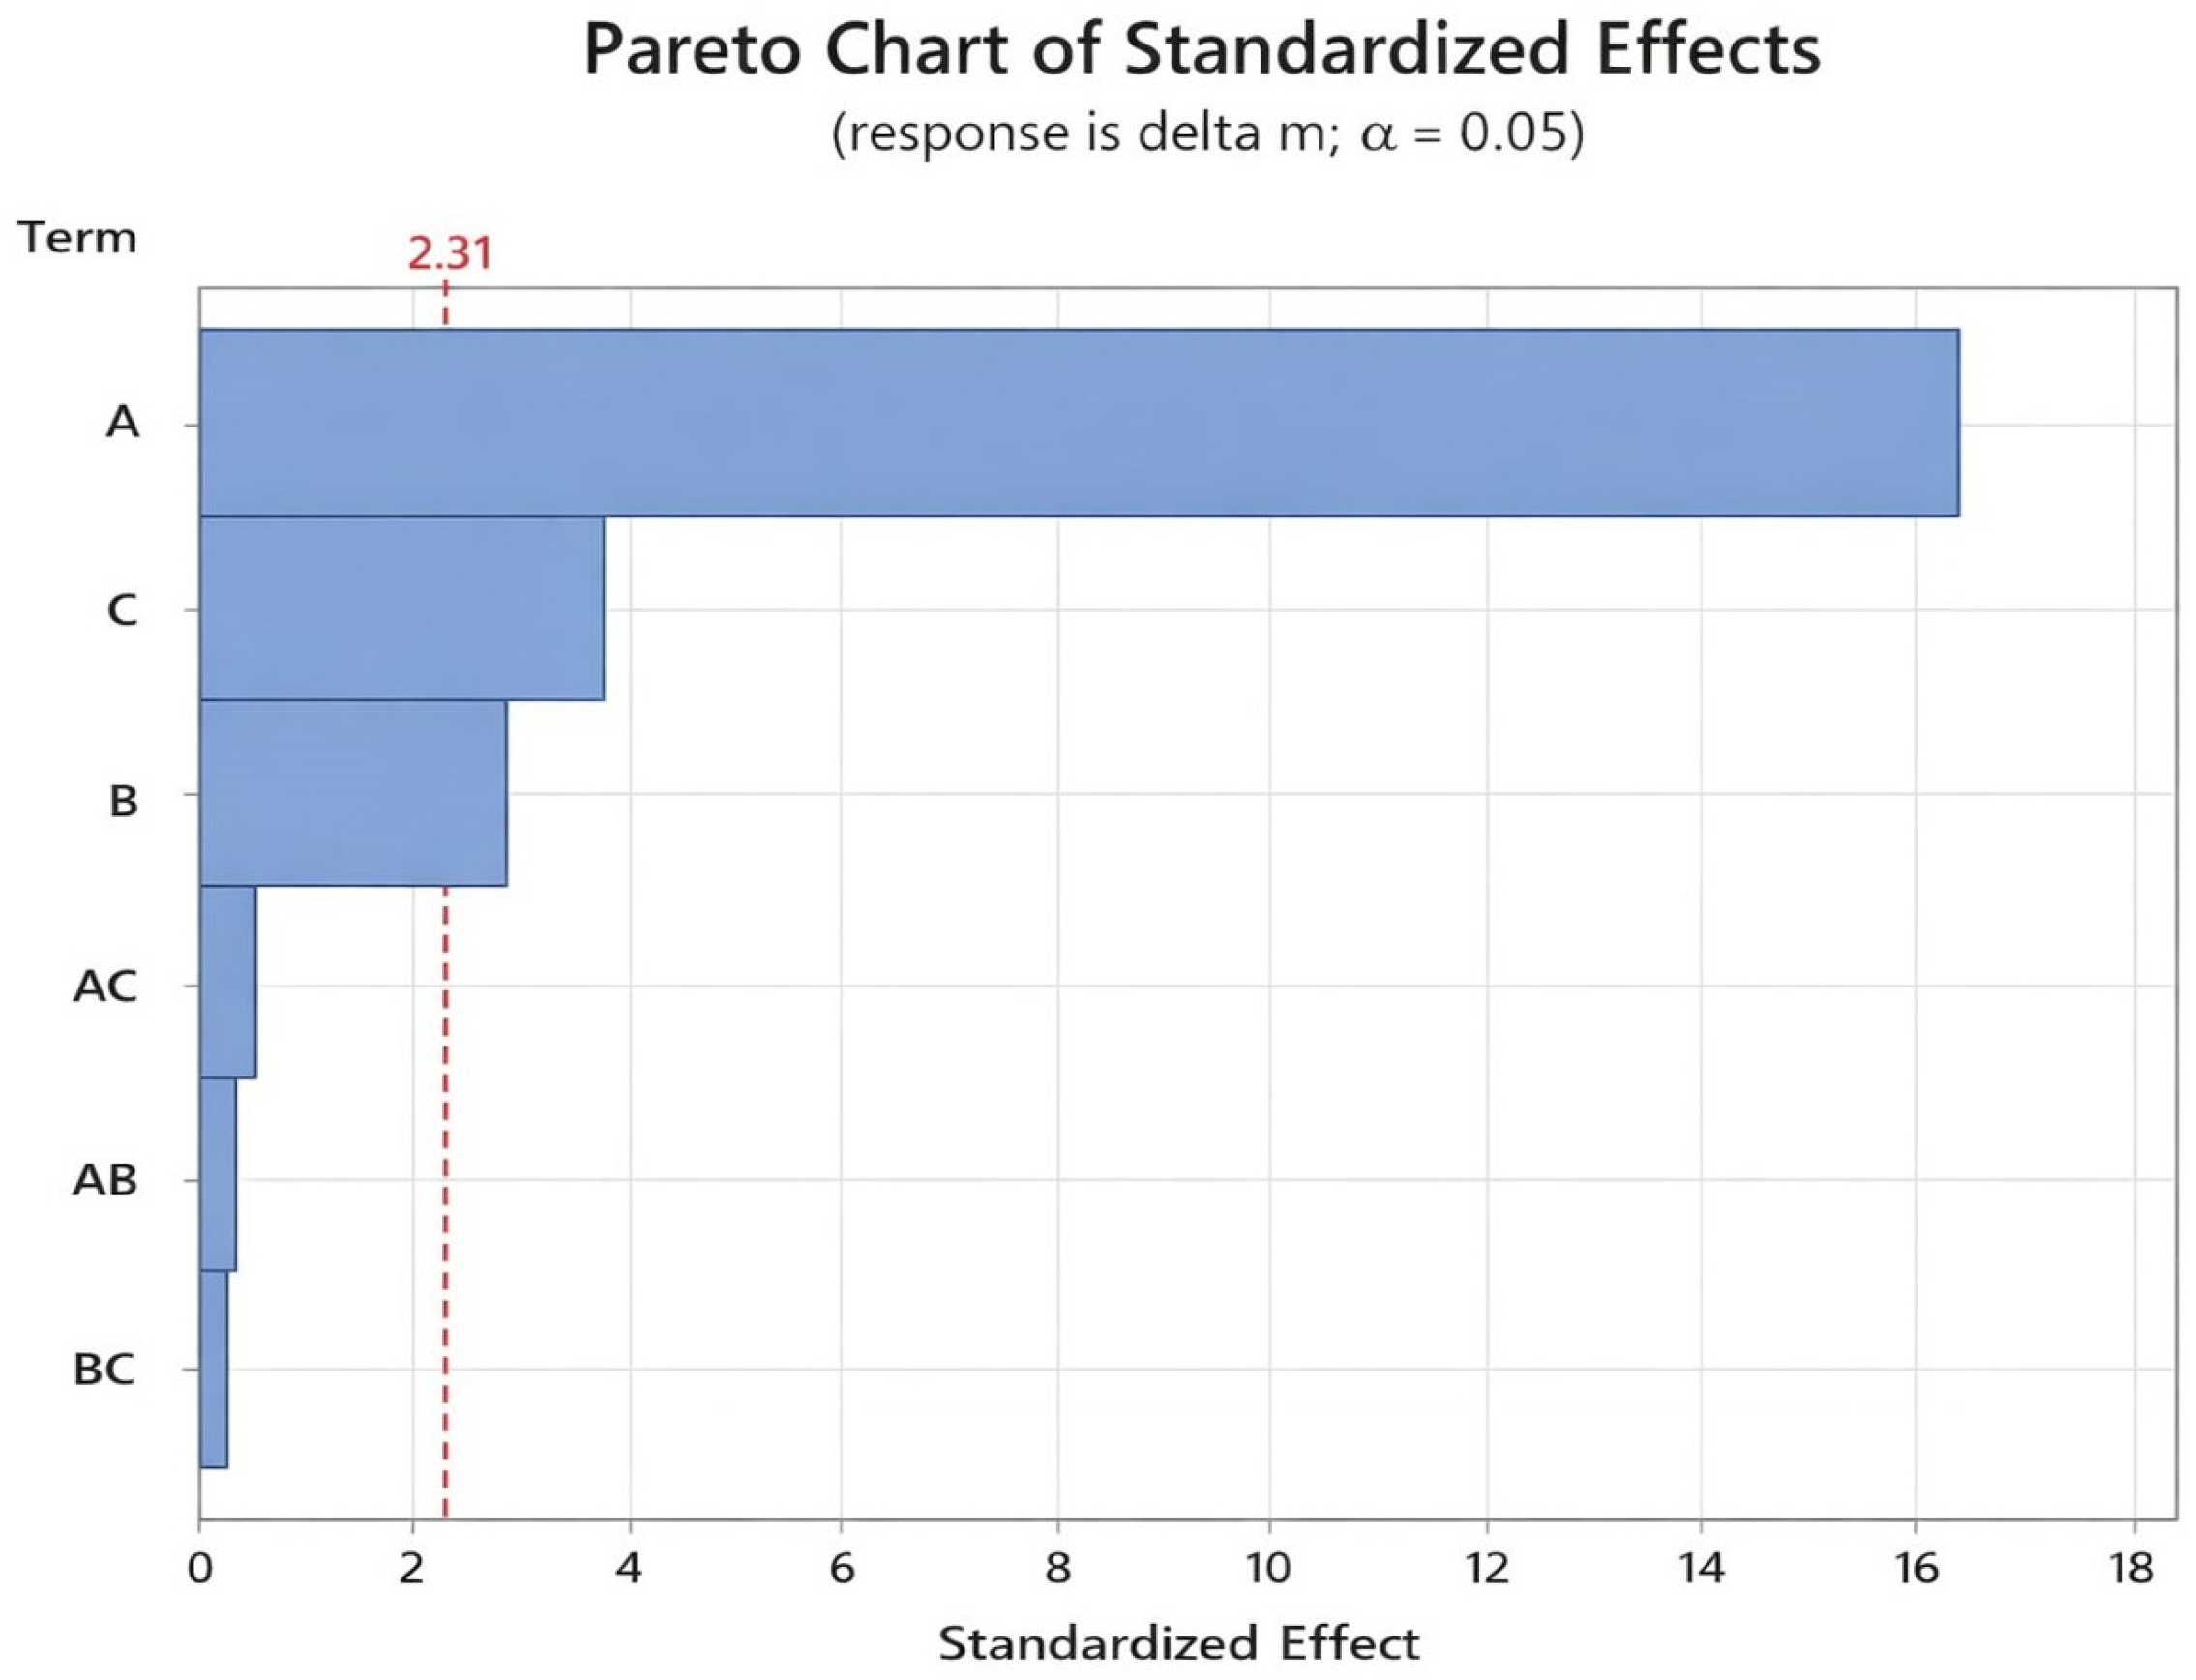
This suggests a transition from coating-dominated wear at low pulse-on time to local coating failure and copper-core exposure at high pulse-on time. Once this transition occurs, subsequent discharges no longer only interact with the sacrificial Zn-rich coating but also with the load-bearing copper core, leading to more severe cratering and a higher net mass loss. This mechanism explains why pulse-on time has the dominant ANOVA contribution to Δm (88.45%,
Table 5): A directly controls whether the per-discharge thermal load remains within the protective regime of the coating or reaches a regime where the coating is locally breached. Pulse-off time (B) and servo reference voltage (Aj) modulate this primary mechanism indirectly, through dielectric recovery, gap conditions, and flushing efficiency, which is consistent with their smaller statistical contributions.
The secondary roles of servo reference voltage and pulse-off time are consistent with this interpretation. Higher Aj increases the nominal gap between the wire and the workpiece, which can improve debris removal and reduce secondary arc discharges. Longer B extends the dielectric-recovery interval between discharges. Both parameters therefore affect the stability and cooling conditions around the discharge zone, but neither controls the per-discharge thermal load as directly as pulse-on time.
The non-significant two-way interactions suggest that A, B, and Aj can mainly be interpreted through their individual effects within the tested window. This is useful for process tuning, but it should not be extended beyond the investigated range without additional experiments. The gravimetric response also complements surface-topography methods such as that of Buk et al. [
12]: gravimetry captures the global net mass response of the wire segment, while profilometry resolves local geometric change.
EDS adds chemical detail to the gravimetric result. The unused wire matched the expected Cu
5Zn
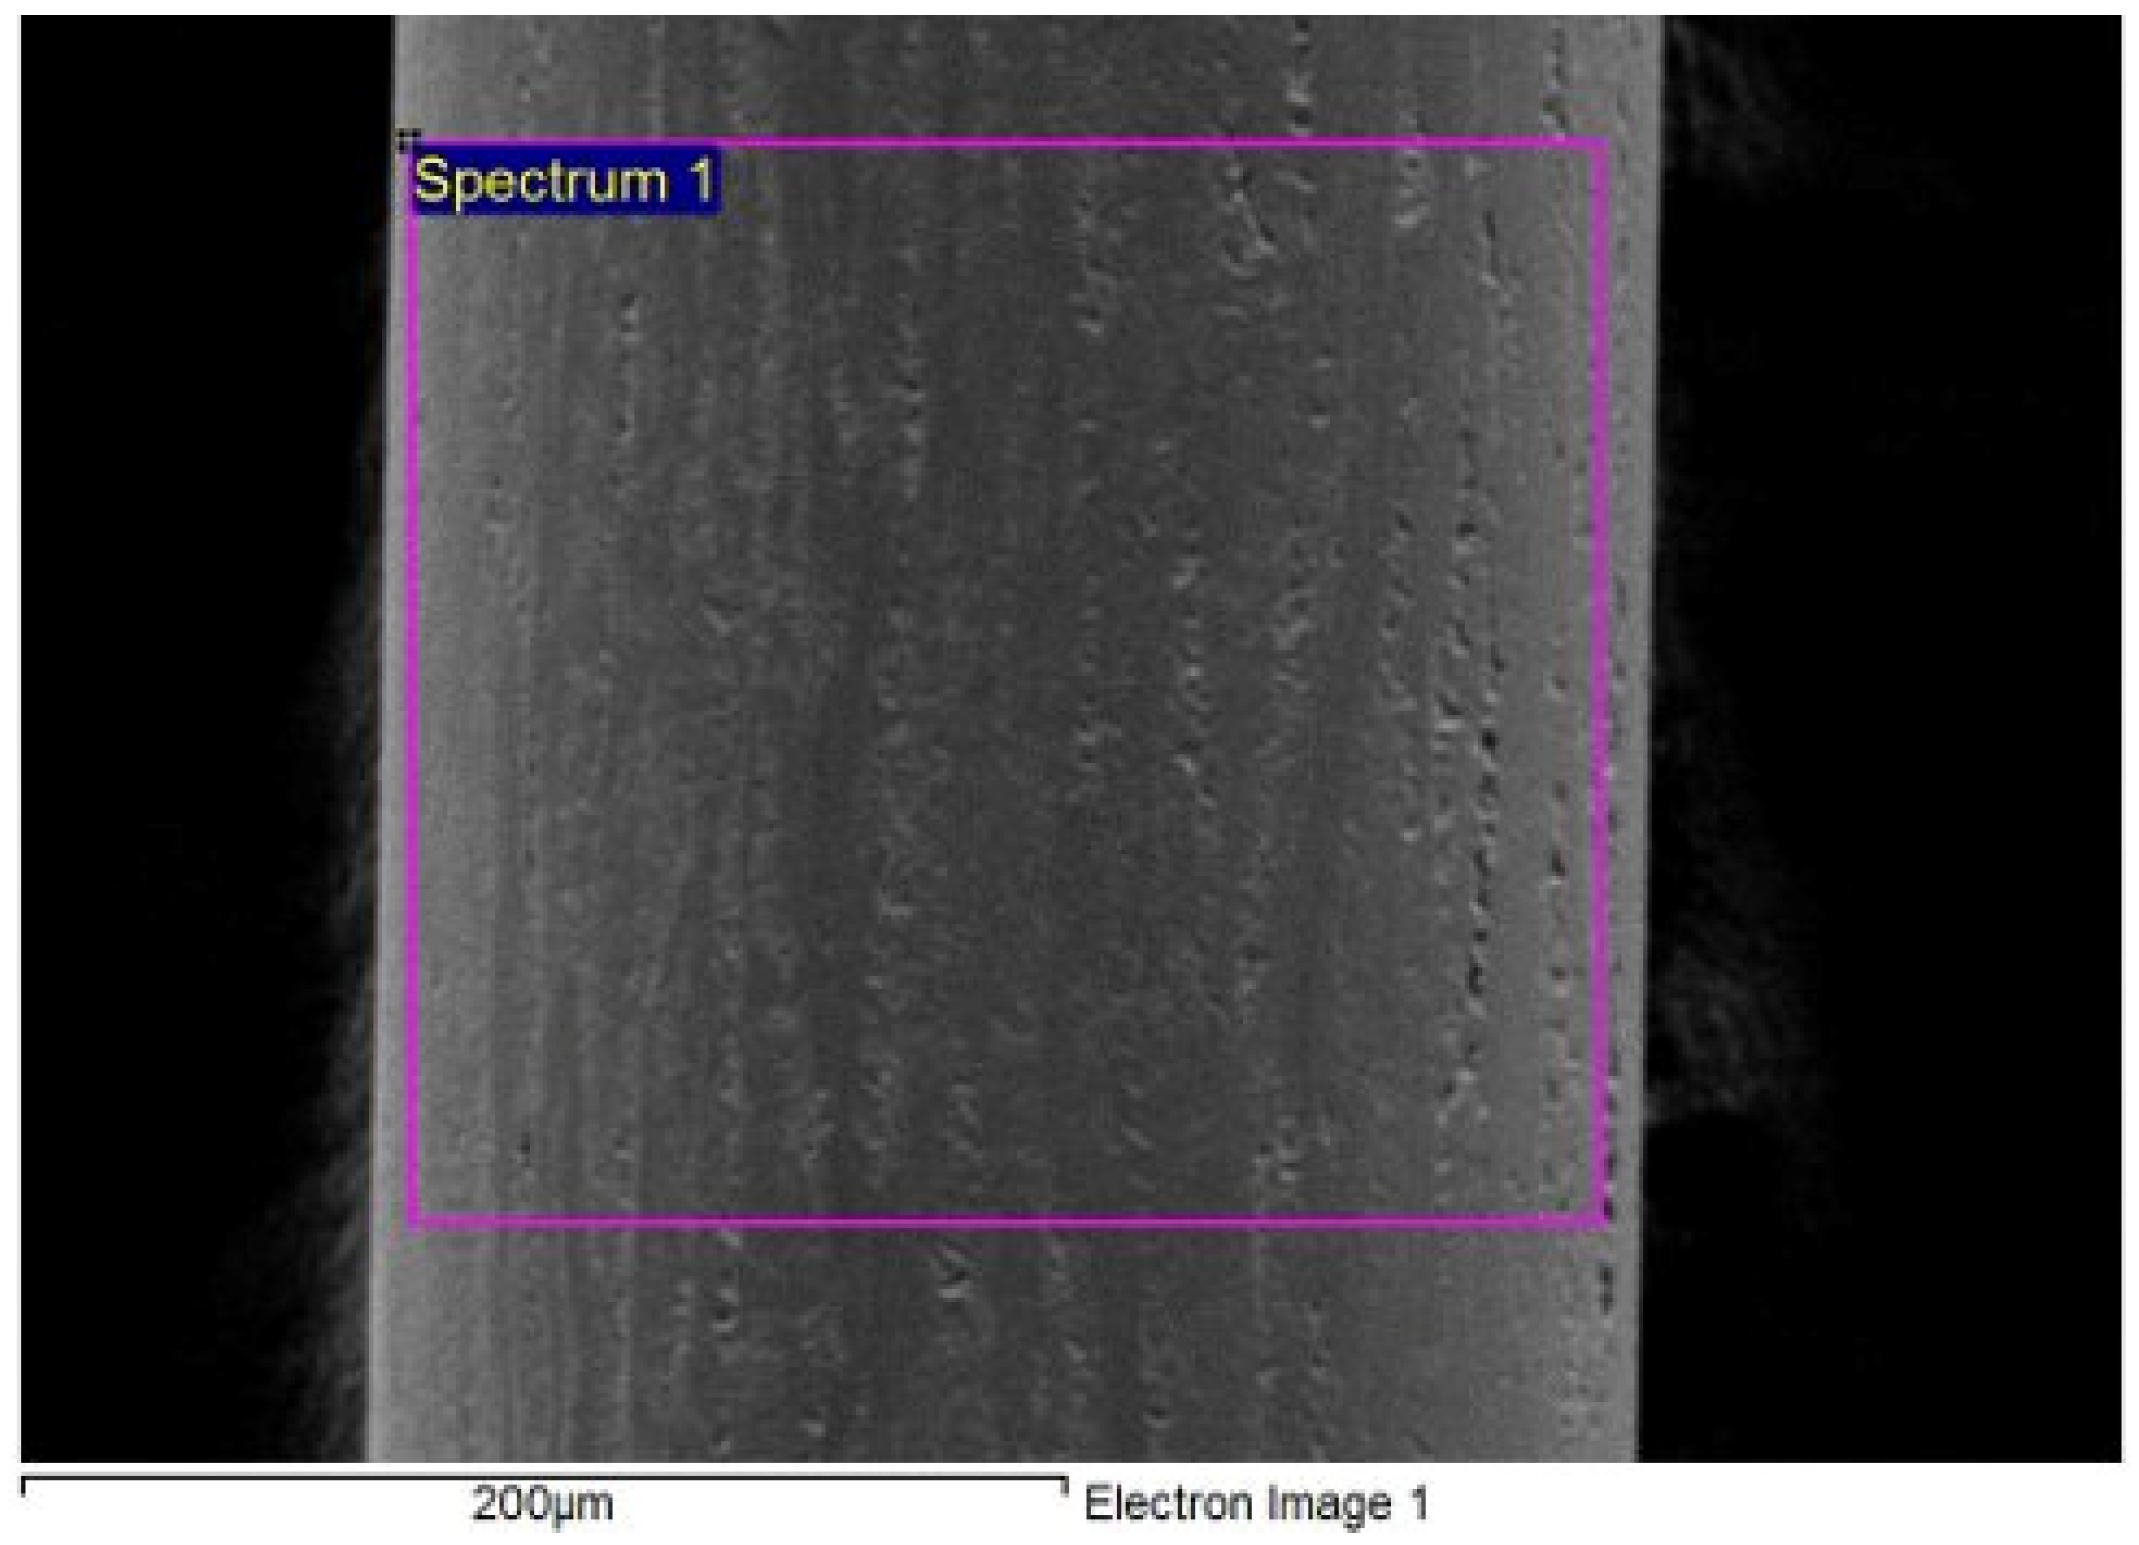
8 coating, while the worn samples showed increasing workpiece-derived material on the surface. In run 20, Ni reached a local maximum of 16.84 wt.% on the frontal face, although the three EDS spectra varied strongly. This should be read as the local stochastic deposition of resolidified workpiece material, not as an average composition of the whole wire surface. The strong spatial variation in Cu and Zn within run 20 also indicates the extent of coating degradation under high pulse-on time. Spectrum 2 in
Table 9, with Cu = 73.57 wt.% and Zn = 22.33 wt.% (compared with the unworn coating composition of 37.87 wt.% Cu and 61.58 wt.% Zn in
Table 7), shows that the γ-Cu
5Zn
8 coating has been locally removed and the underlying copper core is exposed at this location. This provides direct evidence that, at A = 1.2 µs, coating degradation reaches the stage where the copper core is locally engaged in the discharge process; in contrast, the EDS spectrum from the least worn electrode (run 9,
Table 8), with Cu = 36.54 wt.% and Zn = 49.19 wt.%, remains close to the original coating composition. Coating wear and core exposure are therefore strongly dependent on pulse-on time within the investigated range.
This distinction matters for Δm, because gravimetry measures a net mass balance rather than pure electrode erosion. Electrode material is removed by melting, vaporisation, and crater formation, while resolidified Inconel 718 material can be locally deposited on the wire surface. The EDS evidence of Ni enrichment therefore indicates that the actual amount of electrode material removed may be partly masked by workpiece material transfer.
The oxygen results should be interpreted cautiously. The least worn electrode contained more oxygen than the most worn electrode, which suggests that oxide formation and retention depend on the balance between zinc-rich coating oxidation, coating erosion, and the deposition of workpiece-derived metals. A more definitive explanation would require time-resolved or more spatially extensive surface analysis.
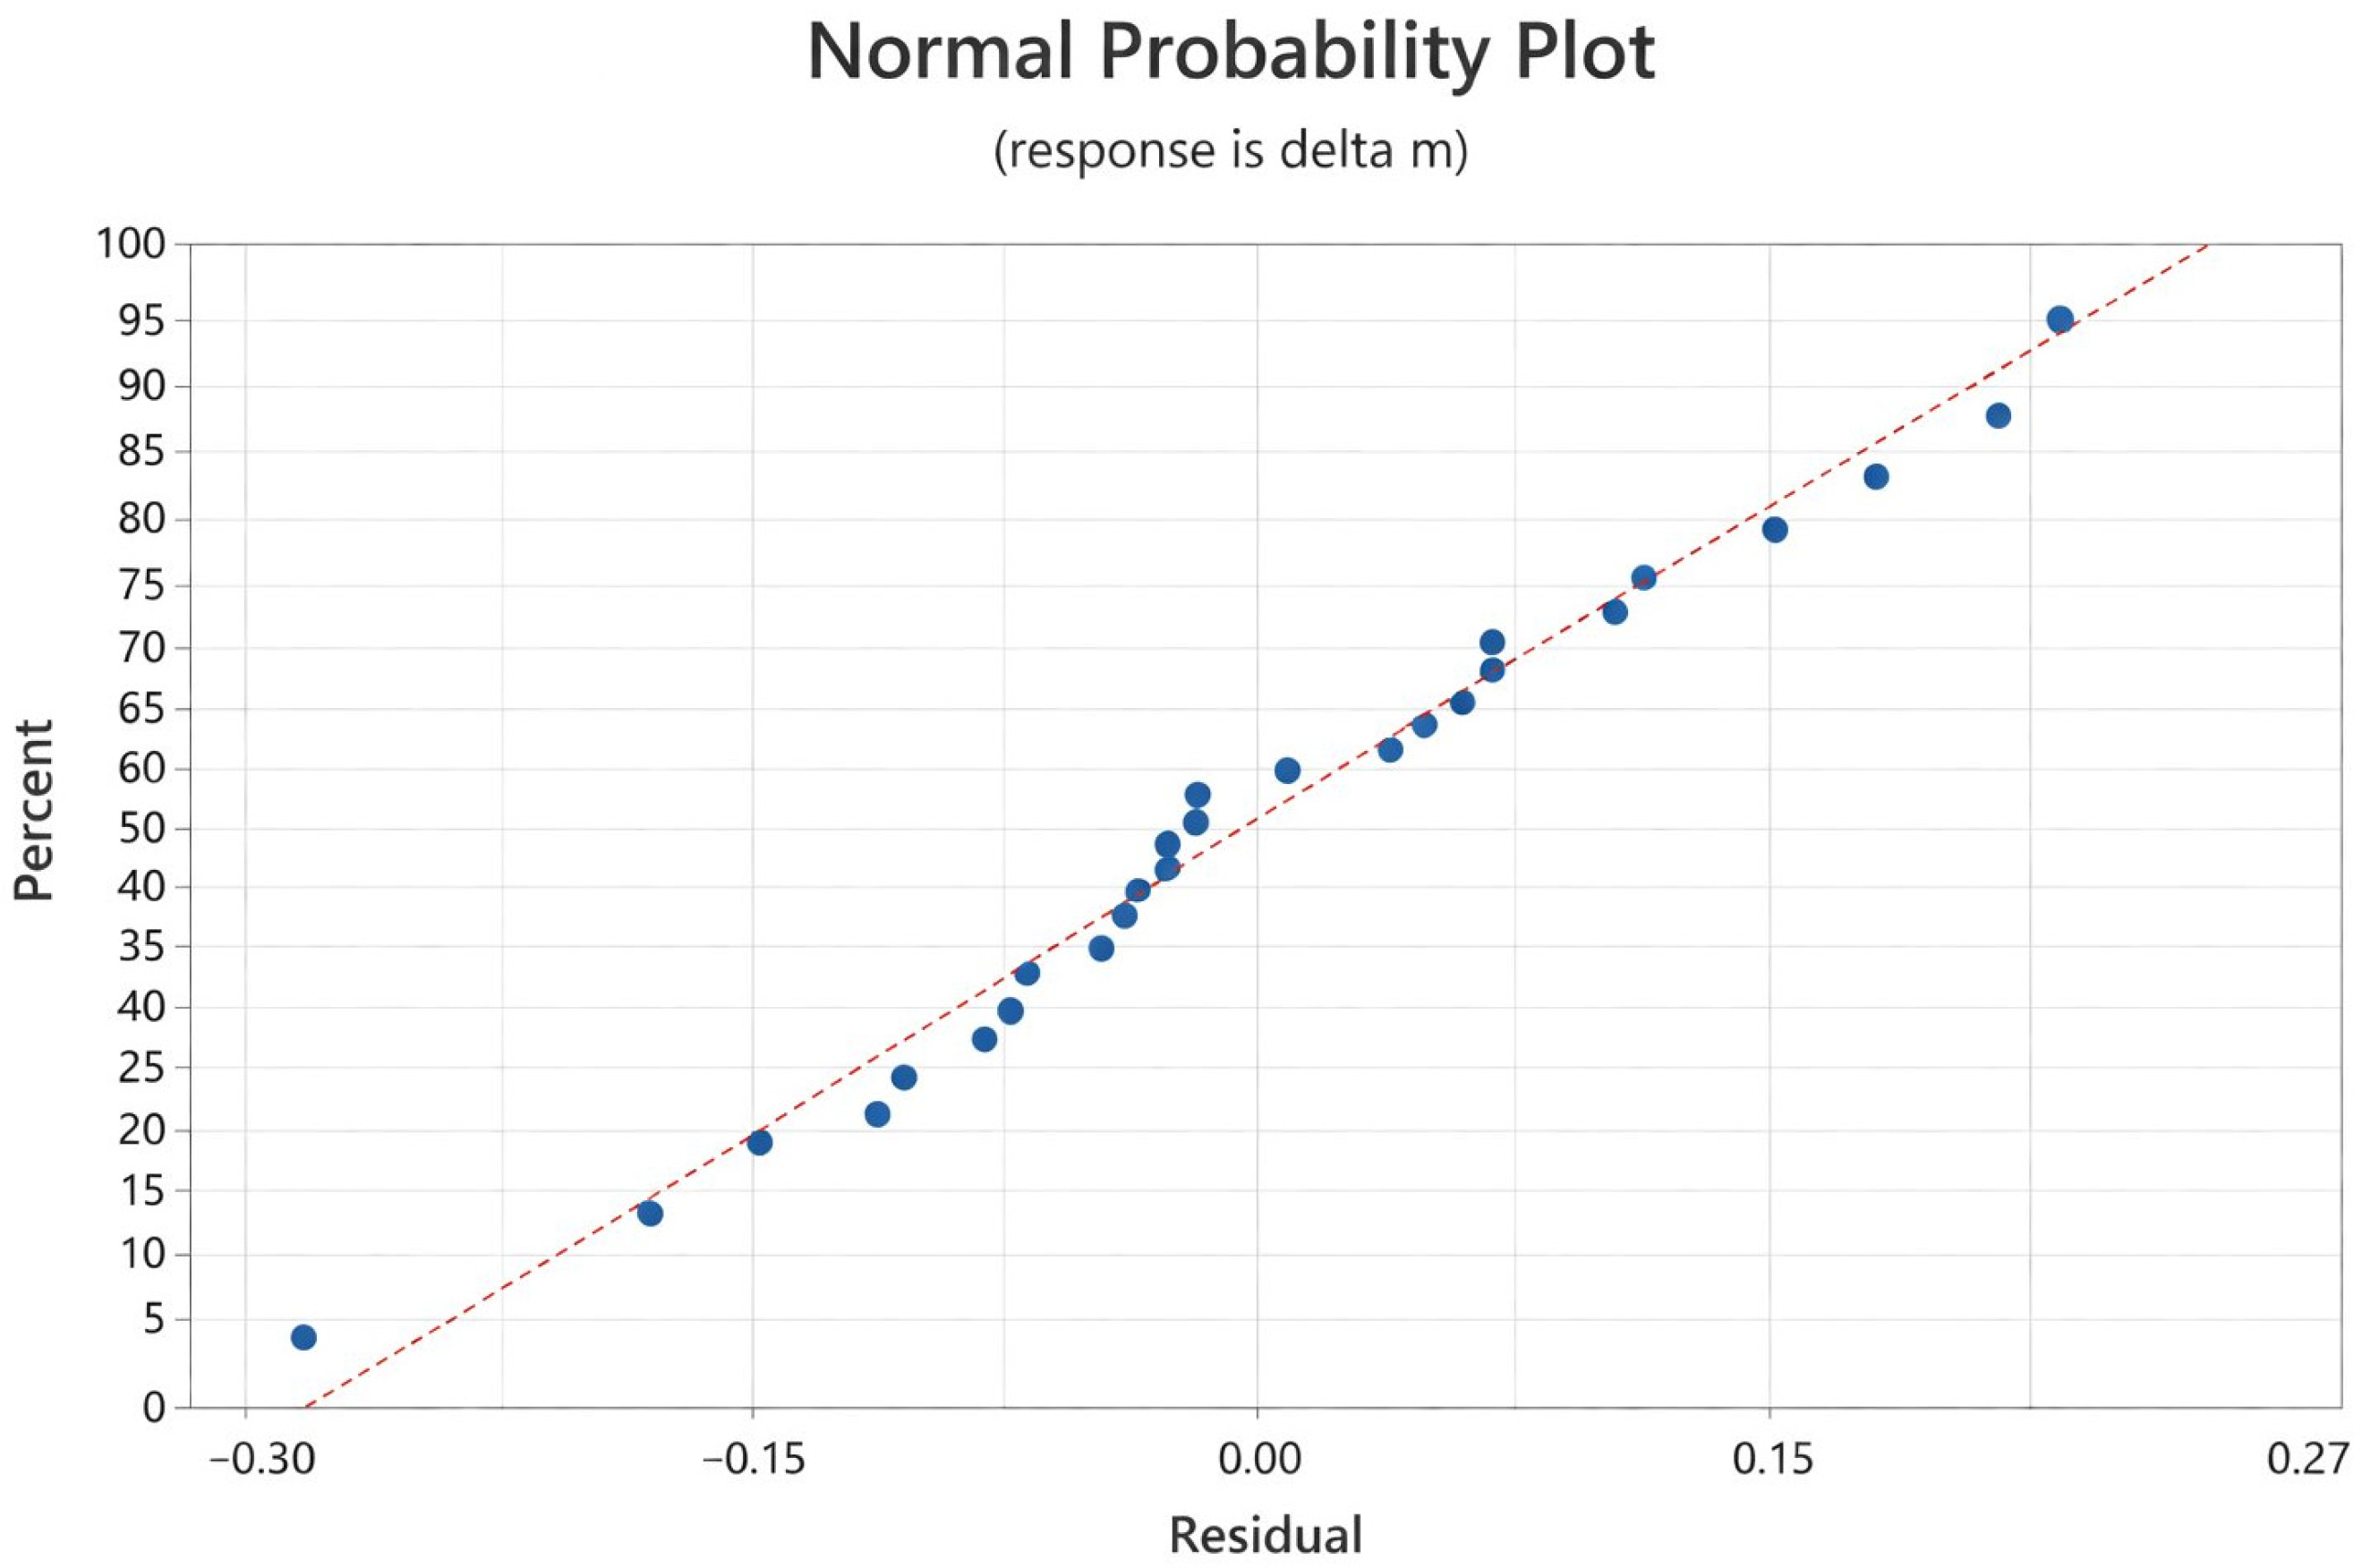
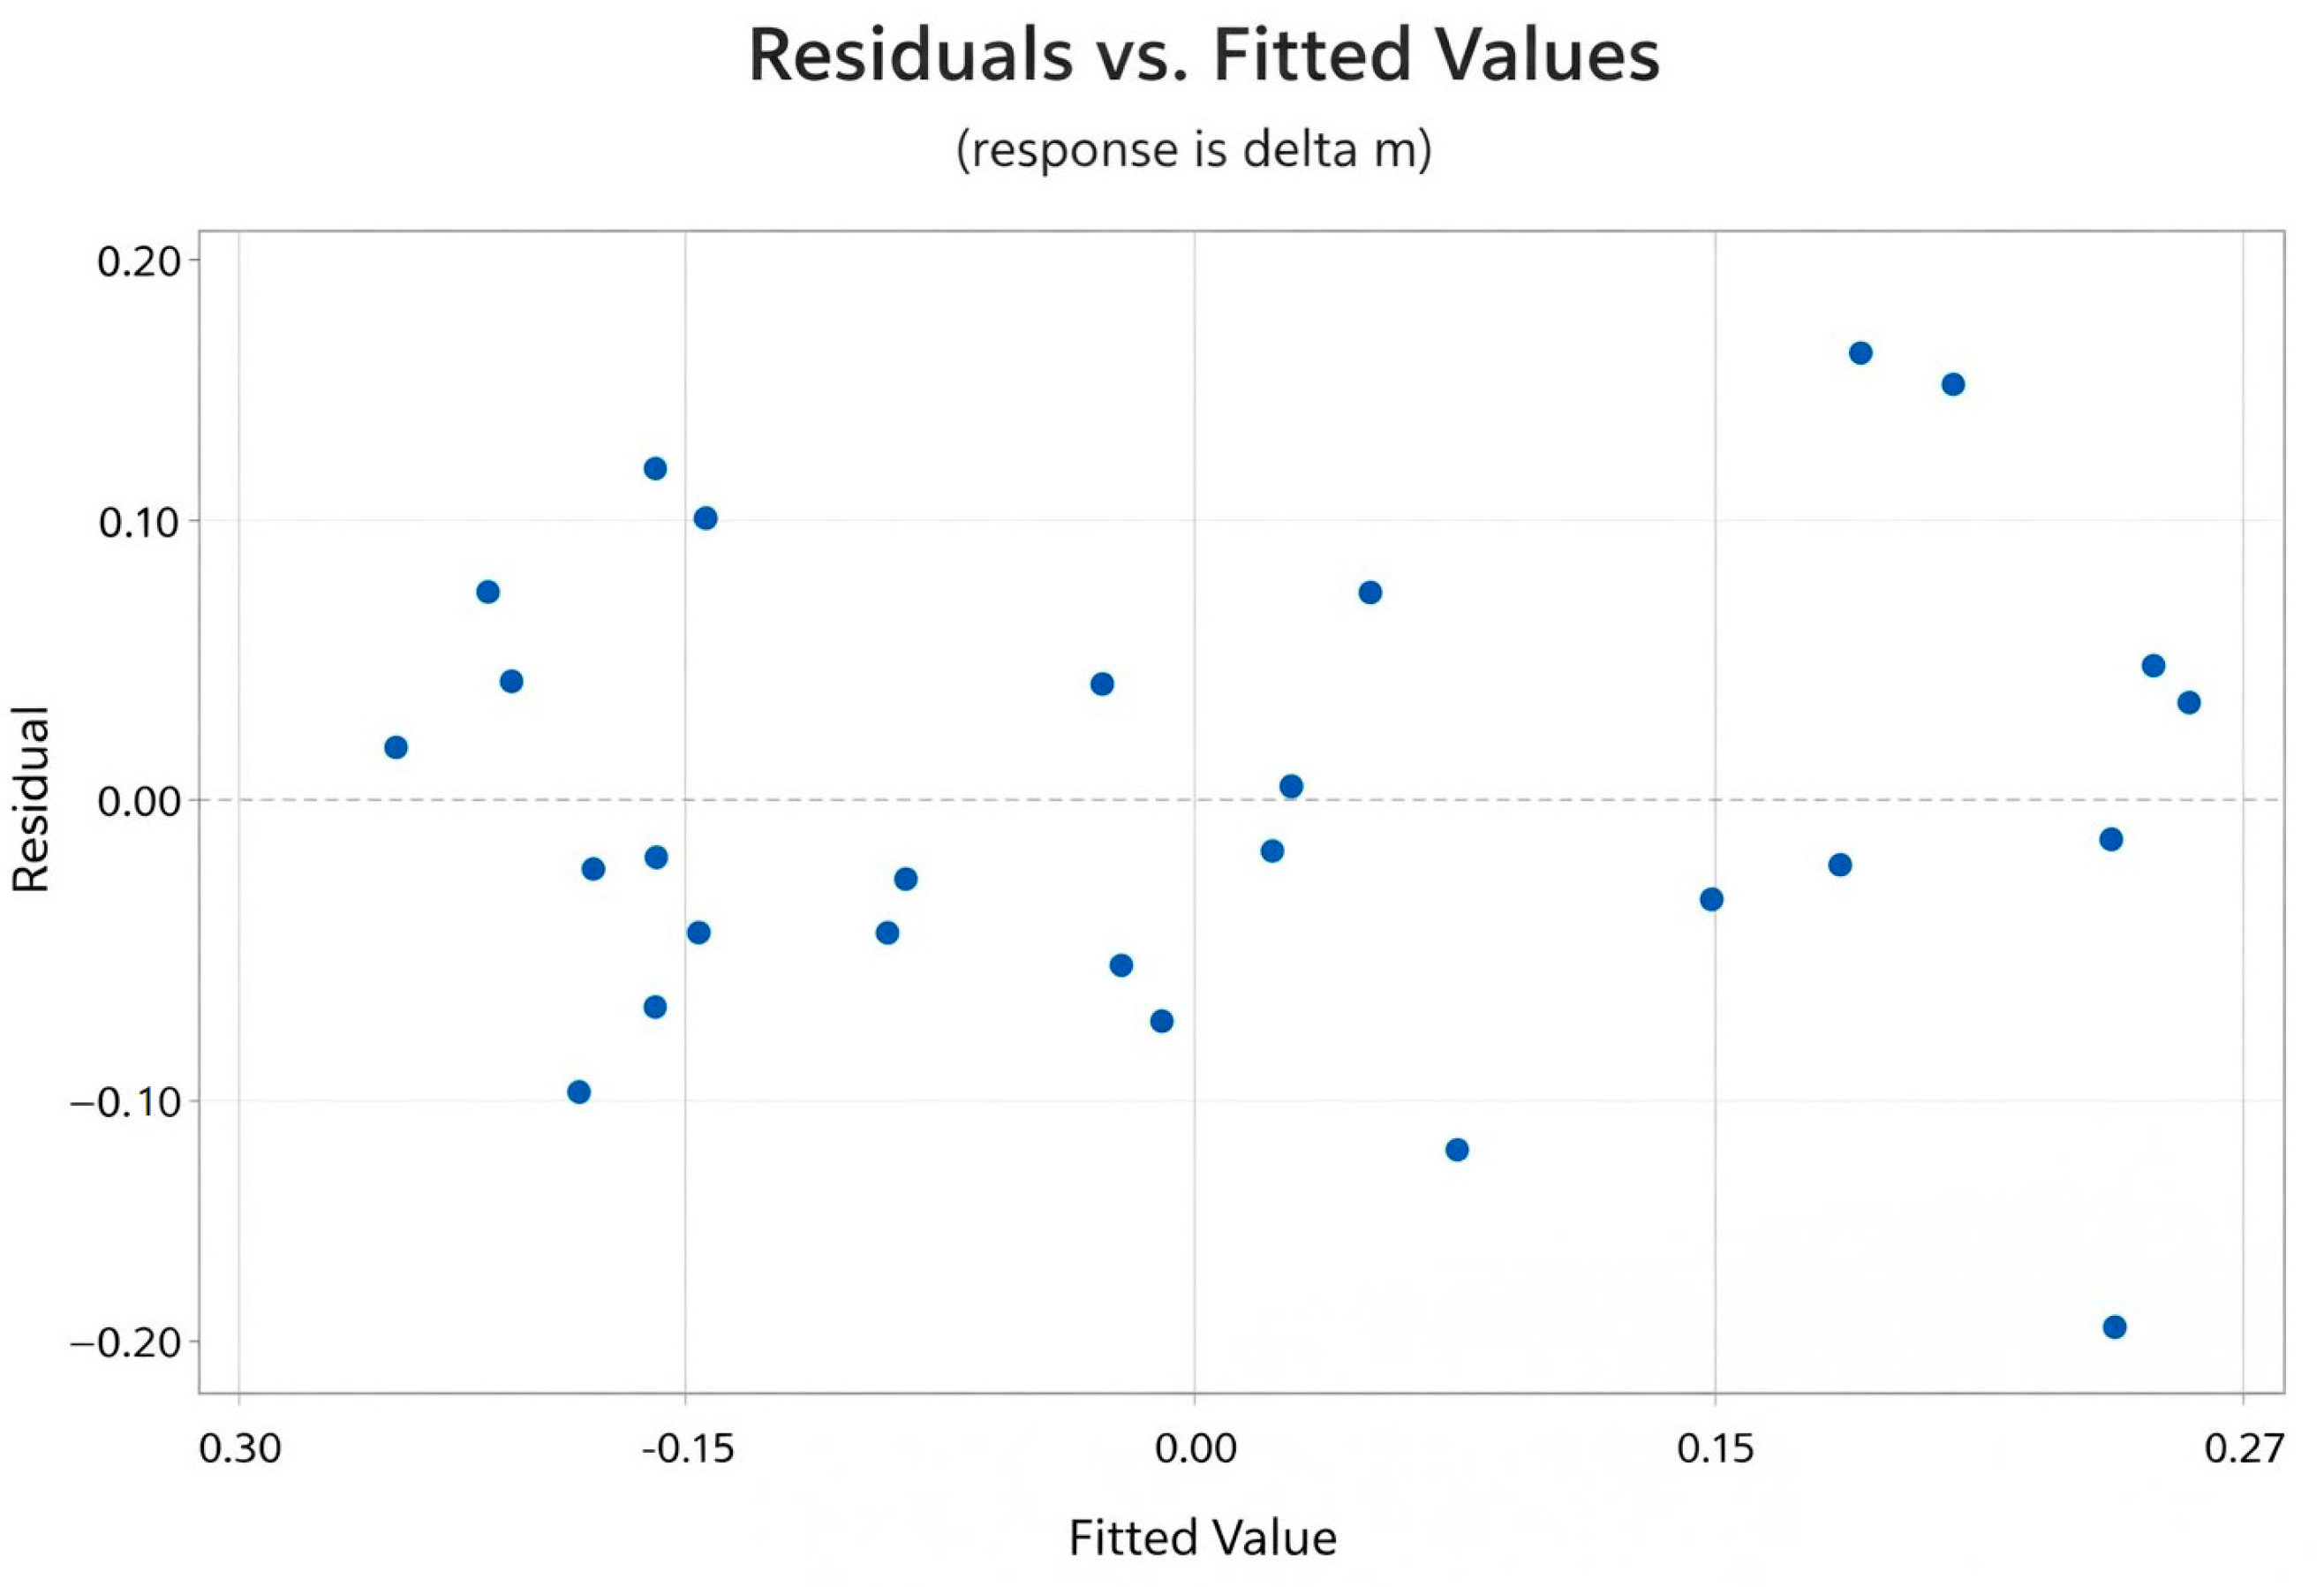
The model statistics and residual diagnostics in
Section 3.1 support the linear ANOVA model used here. The Ryan–Joiner result (
p = 0.046) indicates a minor departure from strict normality, but the balanced factorial structure and the absence of variance heterogeneity make the inference acceptable for this exploratory design.
Several limitations should be kept in mind. First, the 3
3 factorial design was run without experimental replication, and the A × B × Aj interaction was pooled into the error term [
20]. Replication would be needed for a direct pure-error estimate. Second, all runs used a fixed, relatively low wire feed speed (WS = 4 m·min
−1), chosen to amplify the wear per unit wire length; the absolute Δm values should therefore not be transferred directly to production settings with higher feed speeds. Third, the conclusions apply to one electrode type (γ-Cu
5Zn
8-coated copper-core Elecut X) and one workpiece material (Inconel 718). Fourth, the reported factor contributions describe the relative effects of A, B, and Aj on the cumulative Δm accumulated within the 5 min stable-cutting condition tested in this study and are not intended to extrapolate directly to extended wire-life intervals; assessing the wear-rate evolution over longer cutting durations would require time-resolved measurements at multiple cutting times. Future work should include replicated designs, a wider WS range, comparisons with other electrode architectures, and time-resolved wear measurements at multiple cutting durations.
The dataset gives a practical basis for tuning electrode wear during the WEDM of Inconel 718. Because the response was measured across the full factorial space, the results support a clear wear-reduction strategy: use shorter pulse-on time as the primary control, and adjust the servo reference voltage and pulse-off time as the secondary controls. The final operating point, however, should also account for productivity and surface integrity.
Pulse-on time should therefore not be reduced in isolation. Lower A decreases electrode wear by supplying less energy per discharge, but it also reduces the energy available for workpiece removal and may lower the cutting speed or MRR. Liao and Yu [
21] reported that, under steady WEDM conditions, shorter normal discharge on-time increases the discharge efficiency, whereas increasing the discharge on-time increases material removal but reduces the removed volume per unit input energy. The useful operating region is therefore a compromise between electrode consumption and productivity. A multi-response optimisation approach such as grey relational analysis (GRA) could be used in future work to combine Δm with the cutting speed or MRR and identify a more practical process setting.
These findings have direct implications for the design and optimisation of CNC wire EDM processes, particularly in the precision machining of nickel-based superalloys. The quantitative factor ranking established in this study—pulse-on time as the dominant driver of electrode wear, followed by servo reference voltage and pulse-off time—provides a concrete basis for informed parameter selection in CNC production environments. Because the CNC controller executes each programmed parameter combination deterministically, the present full factorial map of Δm can be translated directly into machining strategies: in applications where electrode consumption and process stability carry significant cost, pulse-on time should be treated as the primary optimisation variable, while the servo reference voltage and pulse-off time serve as secondary levers for fine-tuning. Combined with in-process monitoring approaches—such as the oscilloscope-based stability verification used here or closed-loop vision-based systems recently proposed for CNC WEDM [
11]—the present results support the development of more adaptive and cost-efficient CNC machining strategies for Inconel 718 and related difficult-to-cut alloys used in aerospace and power-generation components.




 ,
,