Article

Analysis of Metallic-to-Oxide Sputtering Mode Transition During Reactive Magnetron Deposition of Aluminum Oxide Coatings

by
Andrey V. Kaziev
1,
Alexander V. Tumarkin
1,
Dobrynya V. Kolodko
1,2,
Maksim M. Kharkov
1,
Raghavendra Konaguru
1,
Dmitry G. Ageychenkov
1,
Nikolay N. Samotaev
1,* and
Konstantin Yu. Oblov
1
1
National Research Nuclear University MEPhI (Moscow Engineering Physics Institute), 115409 Moscow, Russia
2
Kotelnikov Institute of Radioengineering and Electronics RAS, Fryazino Branch, 141190 Fryazino, Russia
*
Author to whom correspondence should be addressed.
Appl. Sci. 2025, 15(8), 4305; https://doi.org/10.3390/app15084305
Submission received: 7 March 2025 / Revised: 2 April 2025 / Accepted: 10 April 2025 / Published: 14 April 2025
(This article belongs to the Special Issue Plasma Physics: Theory, Methods and Applications)

Abstract

:
Direct current (DC) reactive magnetron discharge in Ar + O2 mixtures with an aluminum (Al) target was investigated. Electrical measurements of the discharge voltage and current along with the deposition rate trends observed with varying the oxygen flow rate indicated the presence of hysteresis, typical to when using a DC power supply. The transition between metallic and oxide (compound) modes was analyzed in more detail by measuring the mass-resolved fluxes of positively and negatively charged ions together with the optical emission spectra of plasma. The dependence of constituent ion fluxes (Ar+, Ar2+, Al+, O+, O2+, O, and O2) on the reactive oxygen gas flow rate was revealed, indicating the transition (in 1.2–1.8 sccm O2 flow range) from a metallic regime to a poisoned regime. The optical diagnostics indicated a nonlinear hysteresis loop pattern of dependence for various constituents (ions and neutrals) of the magnetron discharge plasma. The comparison between the particle and optical measurements, though exhibiting a pronounced correlation, demonstrated individual features of both methods, which need to be taken into account when interpreting the results. The hysteresis patterns were further discussed by comparing the experimental data with the calculation results from the Berg model. An approach of adapting the model results to the case of a power-regulated magnetron power supply is expressed.

1. Introduction

Thin films of aluminum oxide Al2O3 are an excellent choice when one needs to secure surface hardness and enhance surface protection coupled with good optical transparency. They are widely used in demanding applications [1,2,3,4,5,6,7,8,9,10] in optics, sensors, and spectroscopy. They serve as diffusion-barrier coatings and protective layers in metal-cutting tools and insulating layers in microelectronics.
One of the most popular methods for obtaining metal oxide coatings is reactive magnetron sputtering. The process is known to be accompanied by nonlinear hysteresis effects when the content of the reaction gas in the mixture changes [11,12,13,14]. Hysteresis behavior affects the discharge parameters and properties of the resulting coatings. The most critical influence of this phenomenon is the complication of fixing the working point of the reactive sputtering process in the desirable region (having a decent deposition rate together with good stoichiometry of the growing compound layer), or even the simple inability to do so [15,16,17,18,19,20]. The magnitude and impact of this effect vary significantly depending on the power supply mode used and are most severe in direct current (DC) magnetron sputtering (DCMS). In the pulsed power modes, such as high-current impulse magnetron sputtering (HiPIMS), modulated pulsed power magnetron sputtering (MPPMS), and deep oscillation magnetron sputtering (DOMS), these effects might be either mitigated or properly controlled for, improving the deposition rates [21,22,23,24,25,26,27,28,29].
The position of the working point and the corresponding properties of aluminum oxide coatings obtained by the reactive magnetron sputtering process are influenced by various parameters such as the cathode voltage, condition of the target surface, constituent ion fluxes, discharge current density, proportion of flow rates of reactive and working gases, power rating, and type of power supply used. The abrupt changes in discharge voltage, current, and deposition rate give a clear indication of the occurrence of target poisoning, i.e., covering it with a compound layer [30,31,32,33,34]. Target poisoning is determined by the reactive oxygen gas flow rate and its partial pressure. This phenomenon occurs at a specified region of infliction or transition of the parameters such as partial pressure of the reactive gases which is governed by the gettering of the gas by the sputtering system.
One of the most popular methods for investigating and controlling the discharge in the reactive mode is optical emission spectroscopy (OES) [18,35,36,37]. The available instruments of deposition process control and fixation of the working point are largely based on the optical measurements. While being a solid proven method for process stabilization, the interpretation of OES results regarding the properties of growing film might be a complicated task. The coating composition and properties are governed by the fluxes of particles incident at the substrate, which can hardly be directly reconstructed from the OES data, especially when chemically active species are present in plasma [38].
For the analysis of the sputtering processes, the particle diagnostics (ion energy and mass spectrometry) are perfectly suitable, which enable measurement of constituent plasma ion fluxes in the magnetron discharge [35,37,39,40,41,42,43,44,45,46]. For oxygen-based reactive processes, the role of negative ions in the overall particle ensemble should also be taken into account and can be thoroughly analyzed by ion mass spectrometry [40,41,47,48,49,50]. These ions can impinge the substrate with greater kinetic energies and thereafter can cause damage to the deposited layer.
Despite the large number of studies concerning the hysteresis processes in reactive magnetron sputtering, few of them explicitly demonstrate the dependence of particle fluxes of different kinds on the reactive gas flow rate in the metallic-to-compound mode transition. In [39], such results are shown for carbon sputtering in Ar/N2 mixtures in DCMS and HiPIMS. In [43], a similar approach is used to analyze Ti and WTi sputtering in nitrogen in a DC magnetron plasma. A closer look at the correlation between optical and ion mass spectrometric data in a pulsed magnetron sputtering of aluminum oxide is presented in [35]. However, the data there are shown in dependence on the discharge voltage, and no analysis of the hysteresis curves is demonstrated.
Apart from the experiments, modeling studies equally contribute to understanding and quantifying the hysteresis effects observed in reactive magnetron sputtering, both DC and pulsed [51,52,53,54,55,56,57,58,59,60,61]. The models can be used to predict the position of the working point and the characteristics of hysteresis loops. Calculations, however, imply possessing a comprehensive set of coefficients (for sputtering, chemisorption, sticking, implantation, etc.) for a given selection of materials, which as a rule is not readily available and might take a separate study to determine.
Investigation of the positive and negative ions’ fluxes gives an insight in experimentally identifying the transition zones, and this can also help us determine the qualifying parameters which influence the sputtering process and in turn affect the quality of the fabricated coatings. The aim of this work is to characterize the reactive DCMS of aluminum oxide in Ar/O2 mixtures by bringing together the diagnostic results of current and voltage measurements, deposition rate dynamics, ion mass spectrometry, and optical emission spectroscopy. The novelty of this work therefore lies in the systematic and comprehensive look at different indicators of the metallic-to-oxide sputtering mode transition, which has not been reported before. Revealed trends of constituent plasma species are thereafter compared with the modeling results to yield the parameters of the hysteresis loop applicable for the power regulation mode of magnetron sputtering.

2. Materials and Methods

The experiments were performed in a laboratory-scale sputtering machine equipped with a circular Magneto 3GABS magnetron (Pinch, LLC, Moscow, Russia) having a 76.2 mm diameter aluminum target (purity 99.999%, Girmet, LLC, Moscow, Russia). Experimental setup scheme is demonstrated in Figure 1.
The vacuum chamber was pumped down to a base pressure of 10−4 Pa with a turbomolecular pump backed by a Roots pump. Argon and oxygen were introduced into the chamber by the automated mass-flow controllers El-Flow (Bronkhorst High-Tech B.V., Ruurlo, The Netherlands). The total operating pressure was fixed at 0.5 Pa. The cumulative flow rate of argon and oxygen in each mode was varied between 0 and 4.2 sccm in both directions to characterize the hysteresis behavior of the system. Correspondingly, since the total gas flow was fixed at 30 sccm, the oxygen flow fraction in the Ar/O2 gas mixture was varied from 0 to 14%. To guarantee the stability of the magnetron operation mode, all measurements described below were taken after 5 min from the moment of changing the oxygen flow rate.
Magnetron discharge was operated with a DC power supply APEL-M-5PDC (Applied Electronics, LLC, Tomsk, Russia). The power rating was fixed at 100 W in all presented experiments.
A magnetic sector mass analyzer (MA) was used to determine the mass-resolved ion fluxes in the typical substrate placement area. MA comprised an electrostatic extractor attached to the vacuum chamber pointed at the racetrack region of the magnetron. The extractor was essentially a three-electrode electrostatic lens realizing the functions of sampling ions from plasma, accelerating them and forming an ion beam. The entrance plasma-facing electrode was grounded, while the accelerating electrode, the magnetic sector, and all related equipment were under high voltage (Uacc) relative to the ground potential. In order to improve the sensitivity of the instrument, a secondary electron multiplier (SEM) was used as a detector of mass-filtered ions. The further details of the mass spectrometer configuration are discussed in [44,62]. The acquisition time for each ion mass spectrum was 1 min.
In order to have an ability to measure the mass-resolved fluxes of both positive and negative ions, the detection system was arranged in two different configurations depending on the charge sign. The corresponding diagrams of electric potential distribution inside the MA are shown in Figure 2.
A quartz crystal microbalance (QCM) Mikron-5 (Izovac Ltd., Minsk, Belarus) with crystal diameter of 14 mm and resonant frequency of 6 MHz was used to obtain the qualitative data on the deposition rate’s dependence on the oxygen flow [52]. Mass deposition rate in arbitrary units was obtained by approximating the time dependence of the resonant oscillation frequency with a linear fit and calculating its slope. No assumptions of material density were made, and no coating thickness was calculated because the film’s composition varies with changing the oxygen flow.
Optical emission from plasma was characterized by a three-channel AvaSpec-ULS2048L (Avantes B.V., Apeldoorn, The Netherlands) spectrometer. It comprised three measurement ranges of 200–365 nm (resolution 0.12 nm), 364–603 nm (resolution 0.18 nm), and 360–810 nm (resolution 0.15 nm). The fiber was mounted outside the vacuum chamber, and the emission was collected through a quartz viewport. No special protection was used to cover the viewport. Nevertheless, in our conditions, the measured spectra were not distorted because of the low deposition rate coupled with the high optical transparency of aluminum oxide coatings [1]. This fact was checked by comparing the spectra measured in the beginning and in the end of the experimental session, after sputtering for a time sufficiently long to remove the compound from the target.
Identification of emission lines was performed using NIST database and reference data on molecular oxygen [63,64]. The acquisition time for each optical emission spectrum was 100 ms, and the resulting data were averaged over 3 measurements.

3. Results

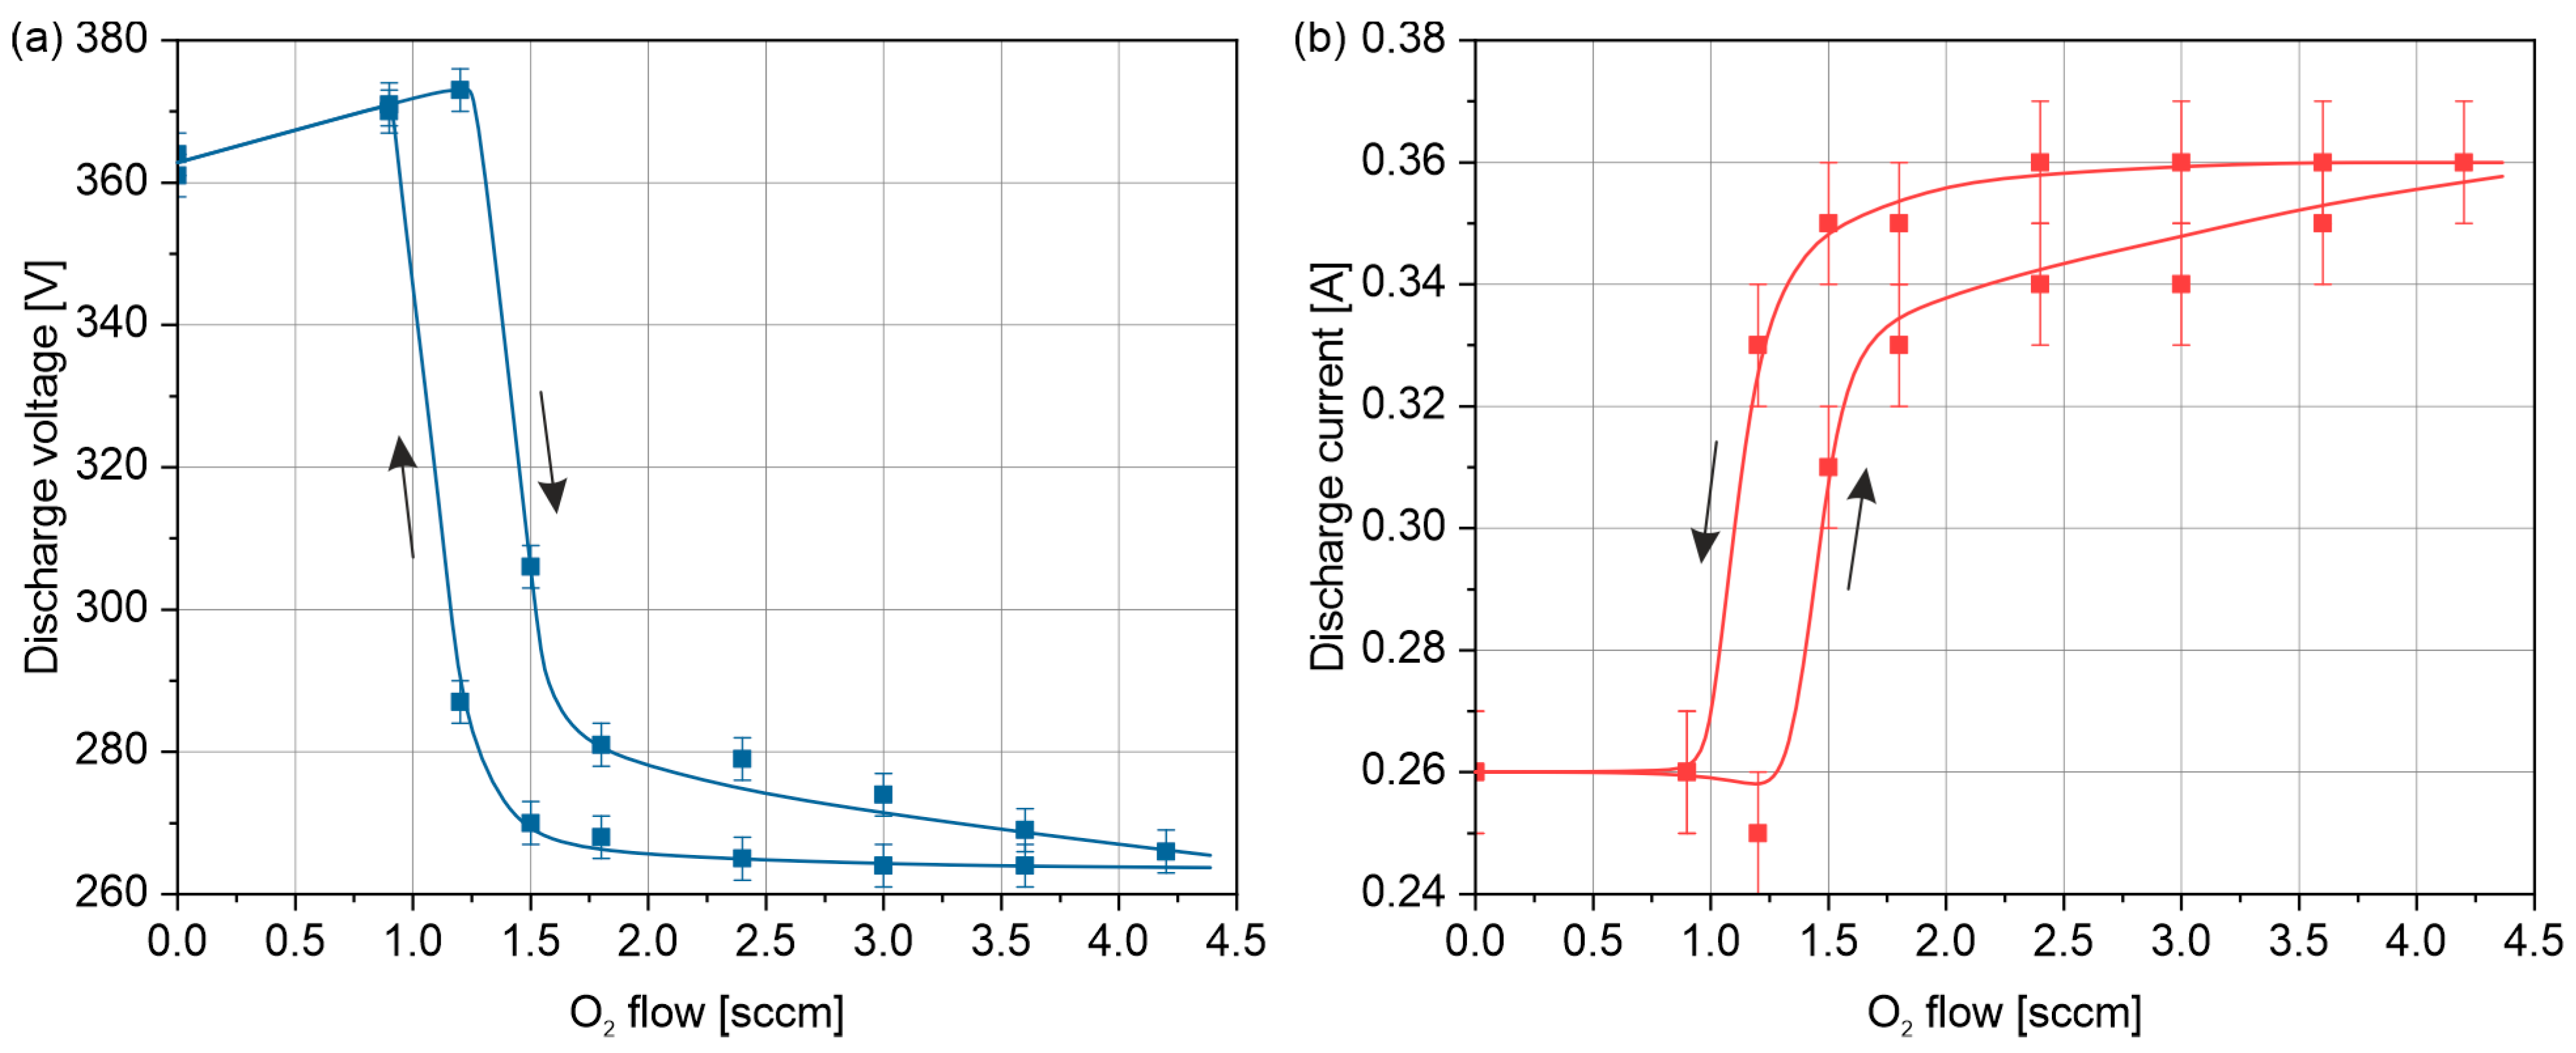
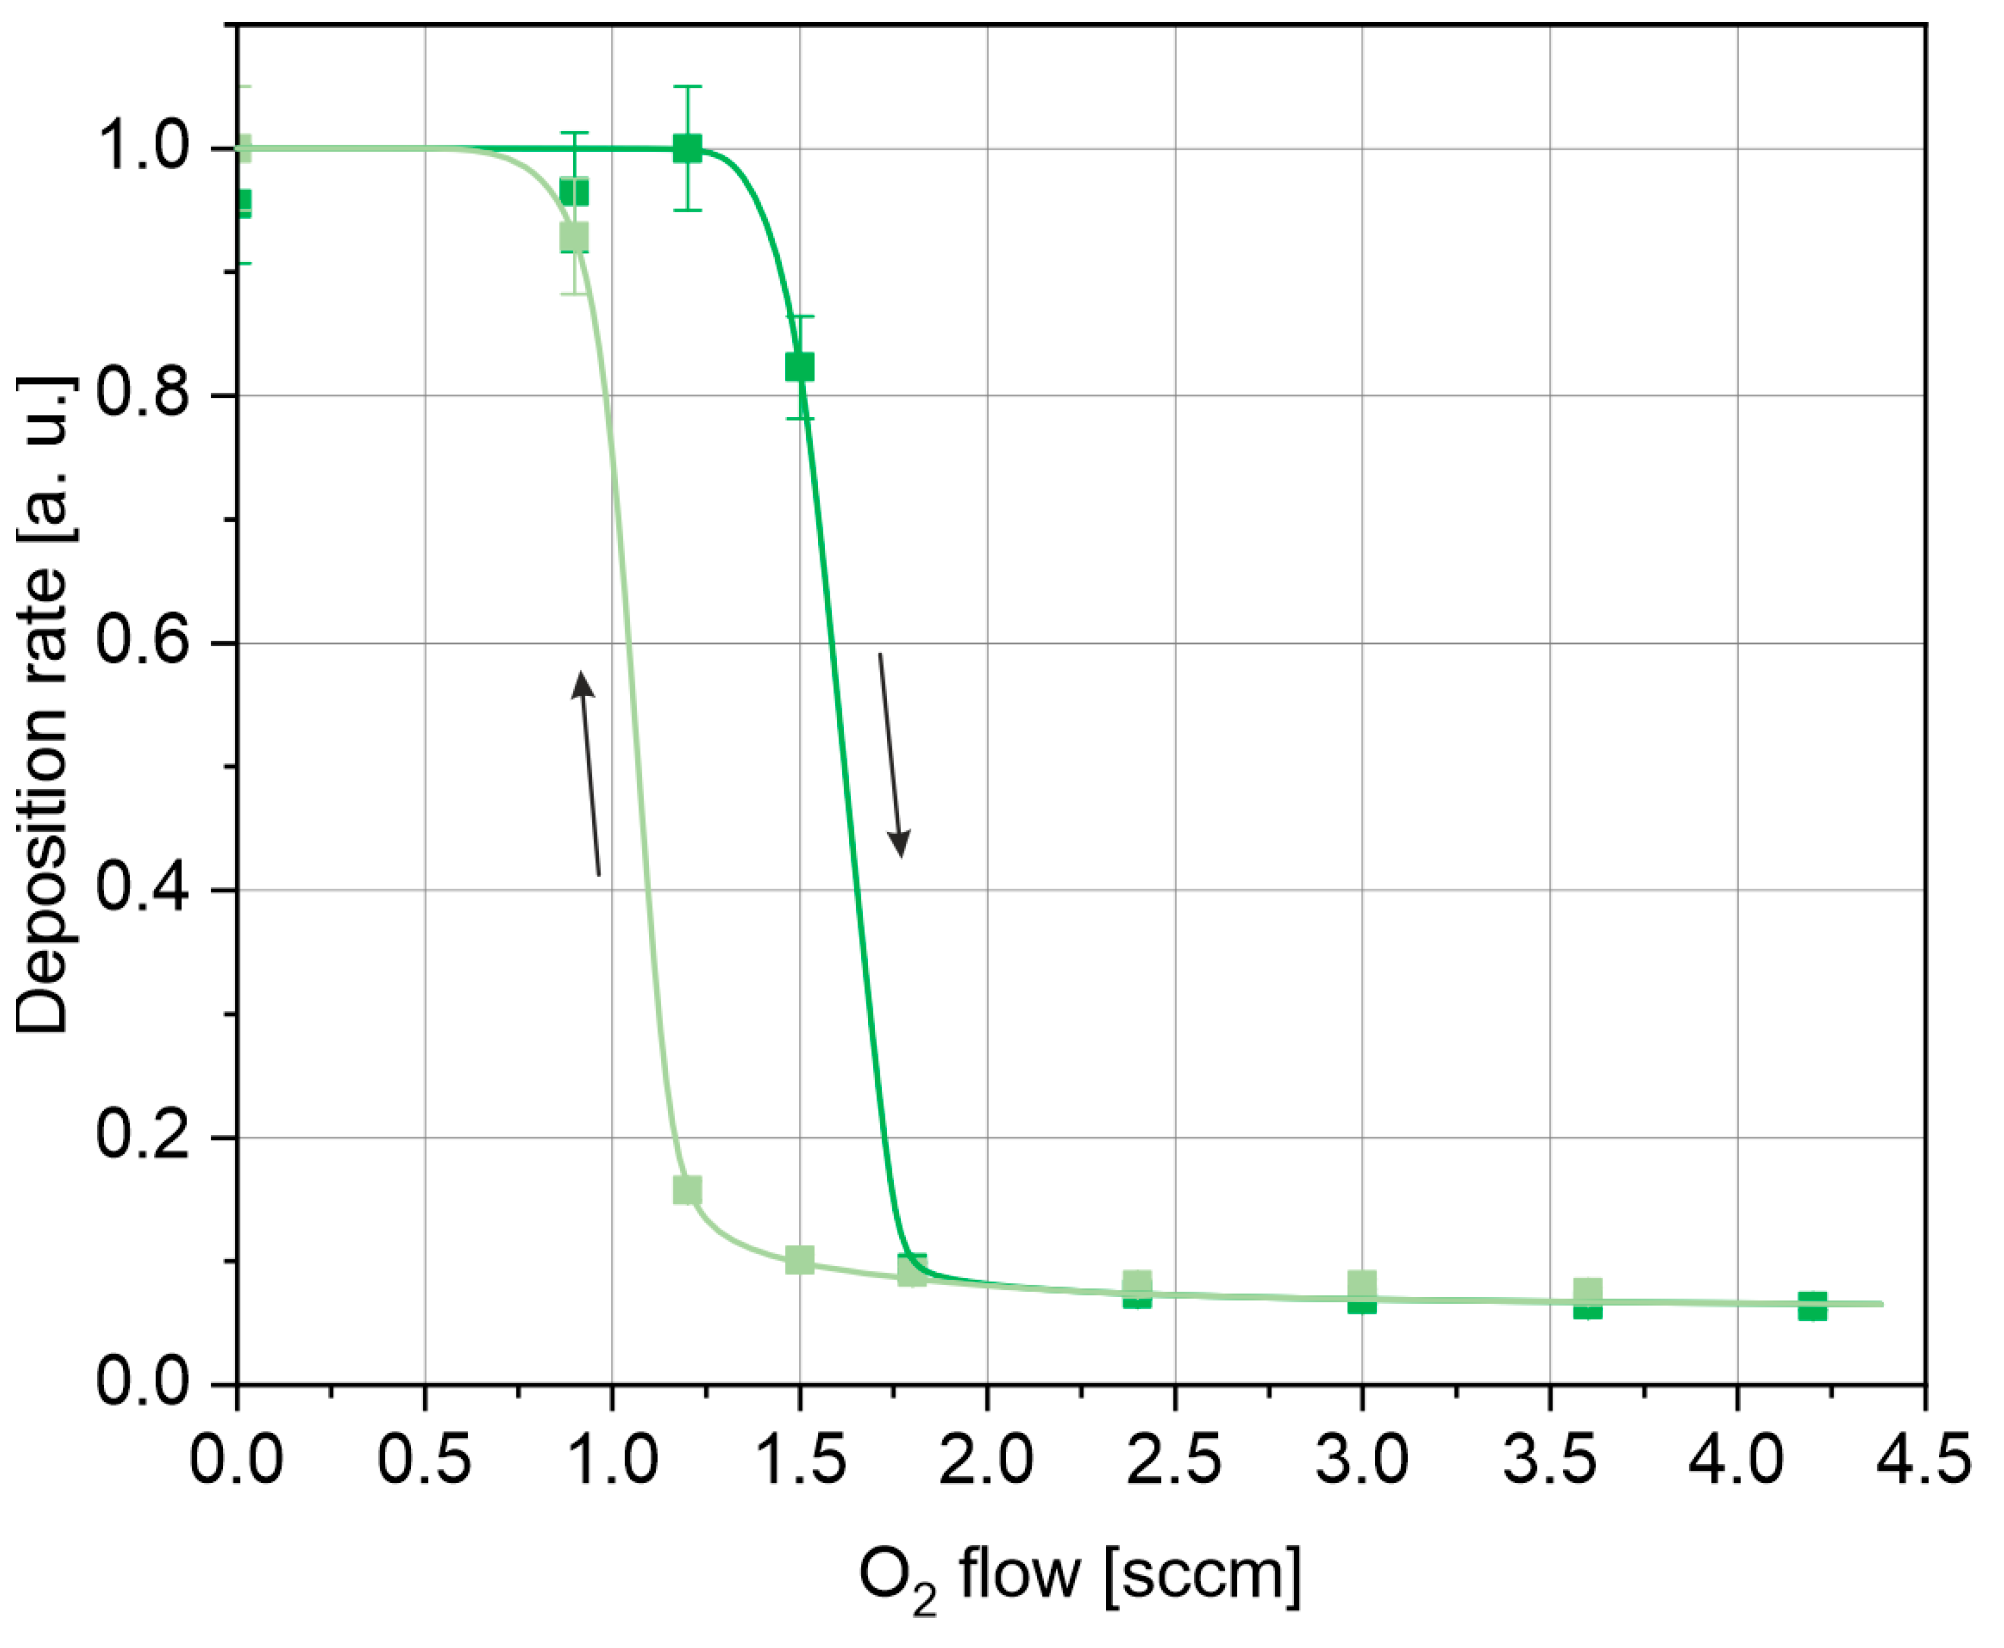
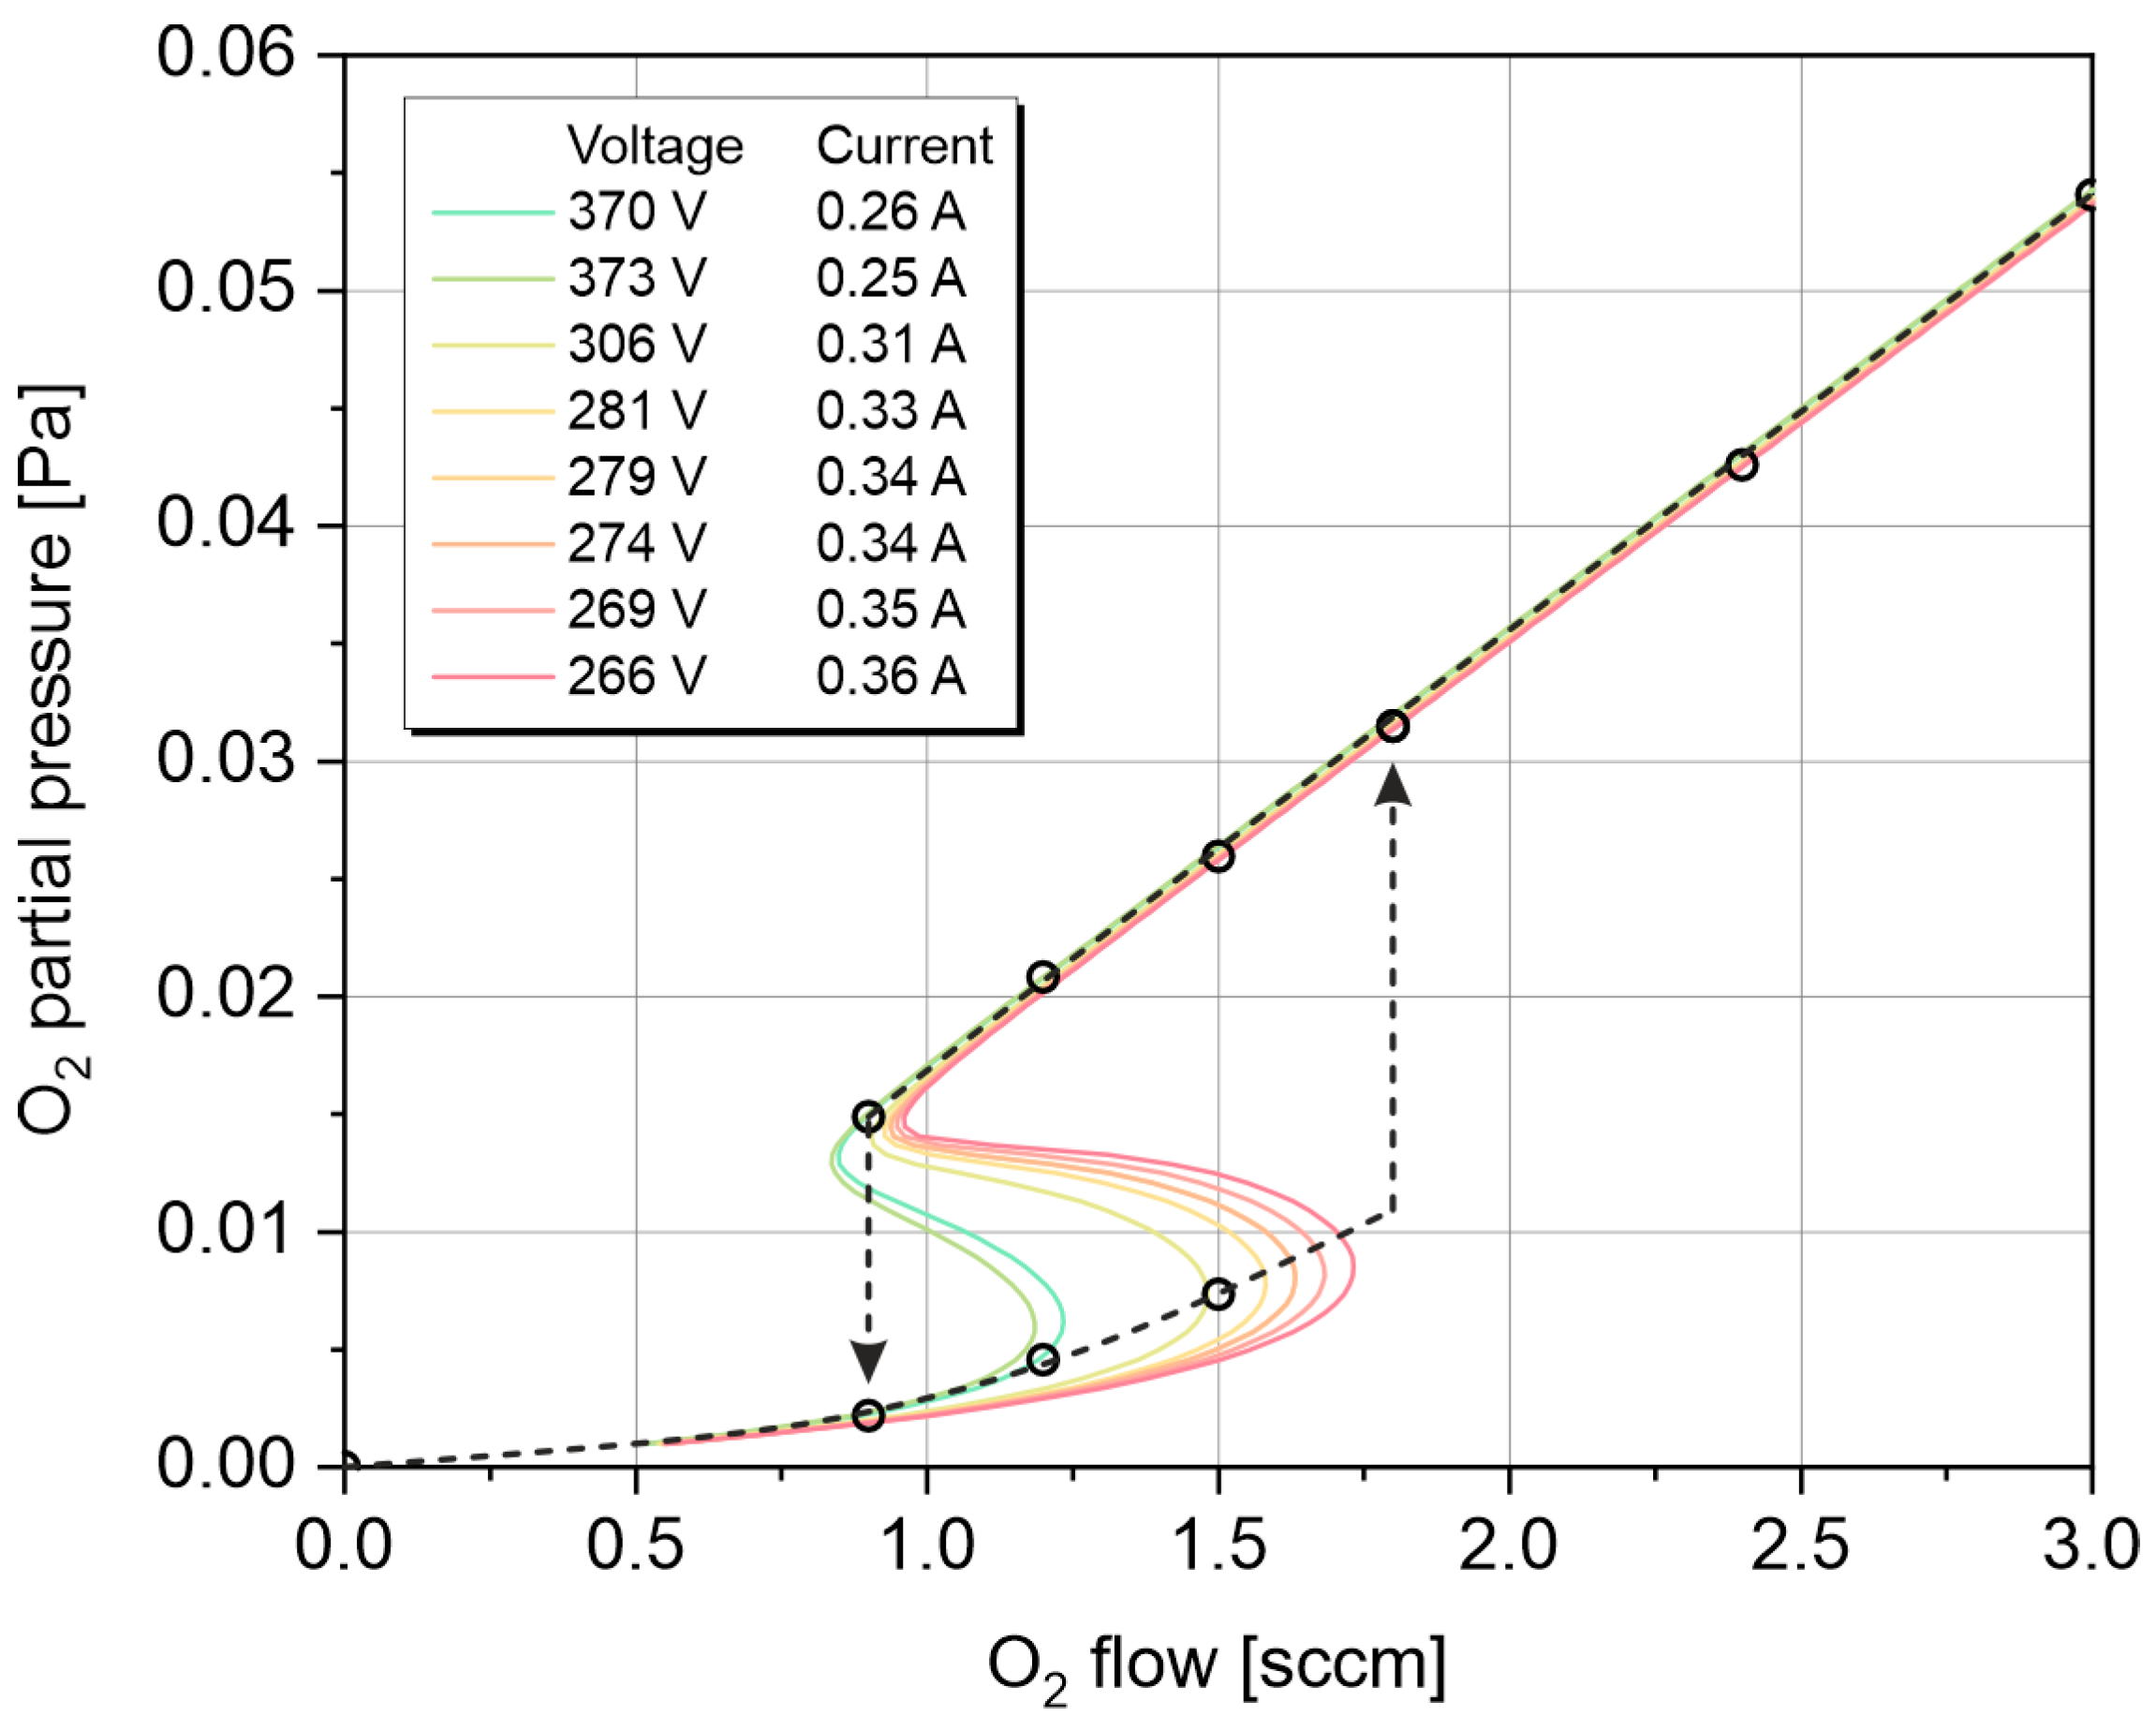
3.1. Electrical Parameters

Figure 3 shows the dependences of discharge voltage and discharge current on the oxygen mass flow rate for its increasing (“forward”) and decreasing (“reverse”) scenarios. The sensors used dictate the measurement precision of the discharge voltage and current. Since the power supply was operated in its low-current mode, the current sensor’s accuracy of 0.01 A corresponds to a relative error of as high as 4%.
We observe a drop in the discharge voltage coupled with a growth of current when the oxygen amount is increased, which can be ascribed to an increase in the coefficient of secondary ion–electron emission from the aluminum oxide layer. This behavior is typical for reactive DCMS [11,12,26,52]. The hysteresis loop occupies the range of oxygen flow rate from 0.9 to 1.8 sccm, with an affected part of the forward curve extended up to 4.2 sccm, which can be observed in both the voltage and current curves.
The experimentally determined mass deposition rate using a quartz crystal microbalance (QCM) is shown in Figure 4. The measurement accuracy is connected to the precision of linear fitting of the time dependence of the crystal’s resonant frequency.
The hysteresis loop observed in the deposition rate curve exhibits the same starting point and width as in the voltage and current curves (Figure 3). However, unlike in those, no deviations between forward and reverse trends are present here. This might suggest the differences in charged particle (ions and electrons) fractions’ dependence on the direction of oxygen flow rate change, which can be pronounced in the voltage and current measurements. Equality of the forward and reverse QCM signals at oxygen flow rates exceeding 1.8 sccm means the same total mass deposition rate, i.e., the same flux of heavy species arriving at the substrate for both scenarios.

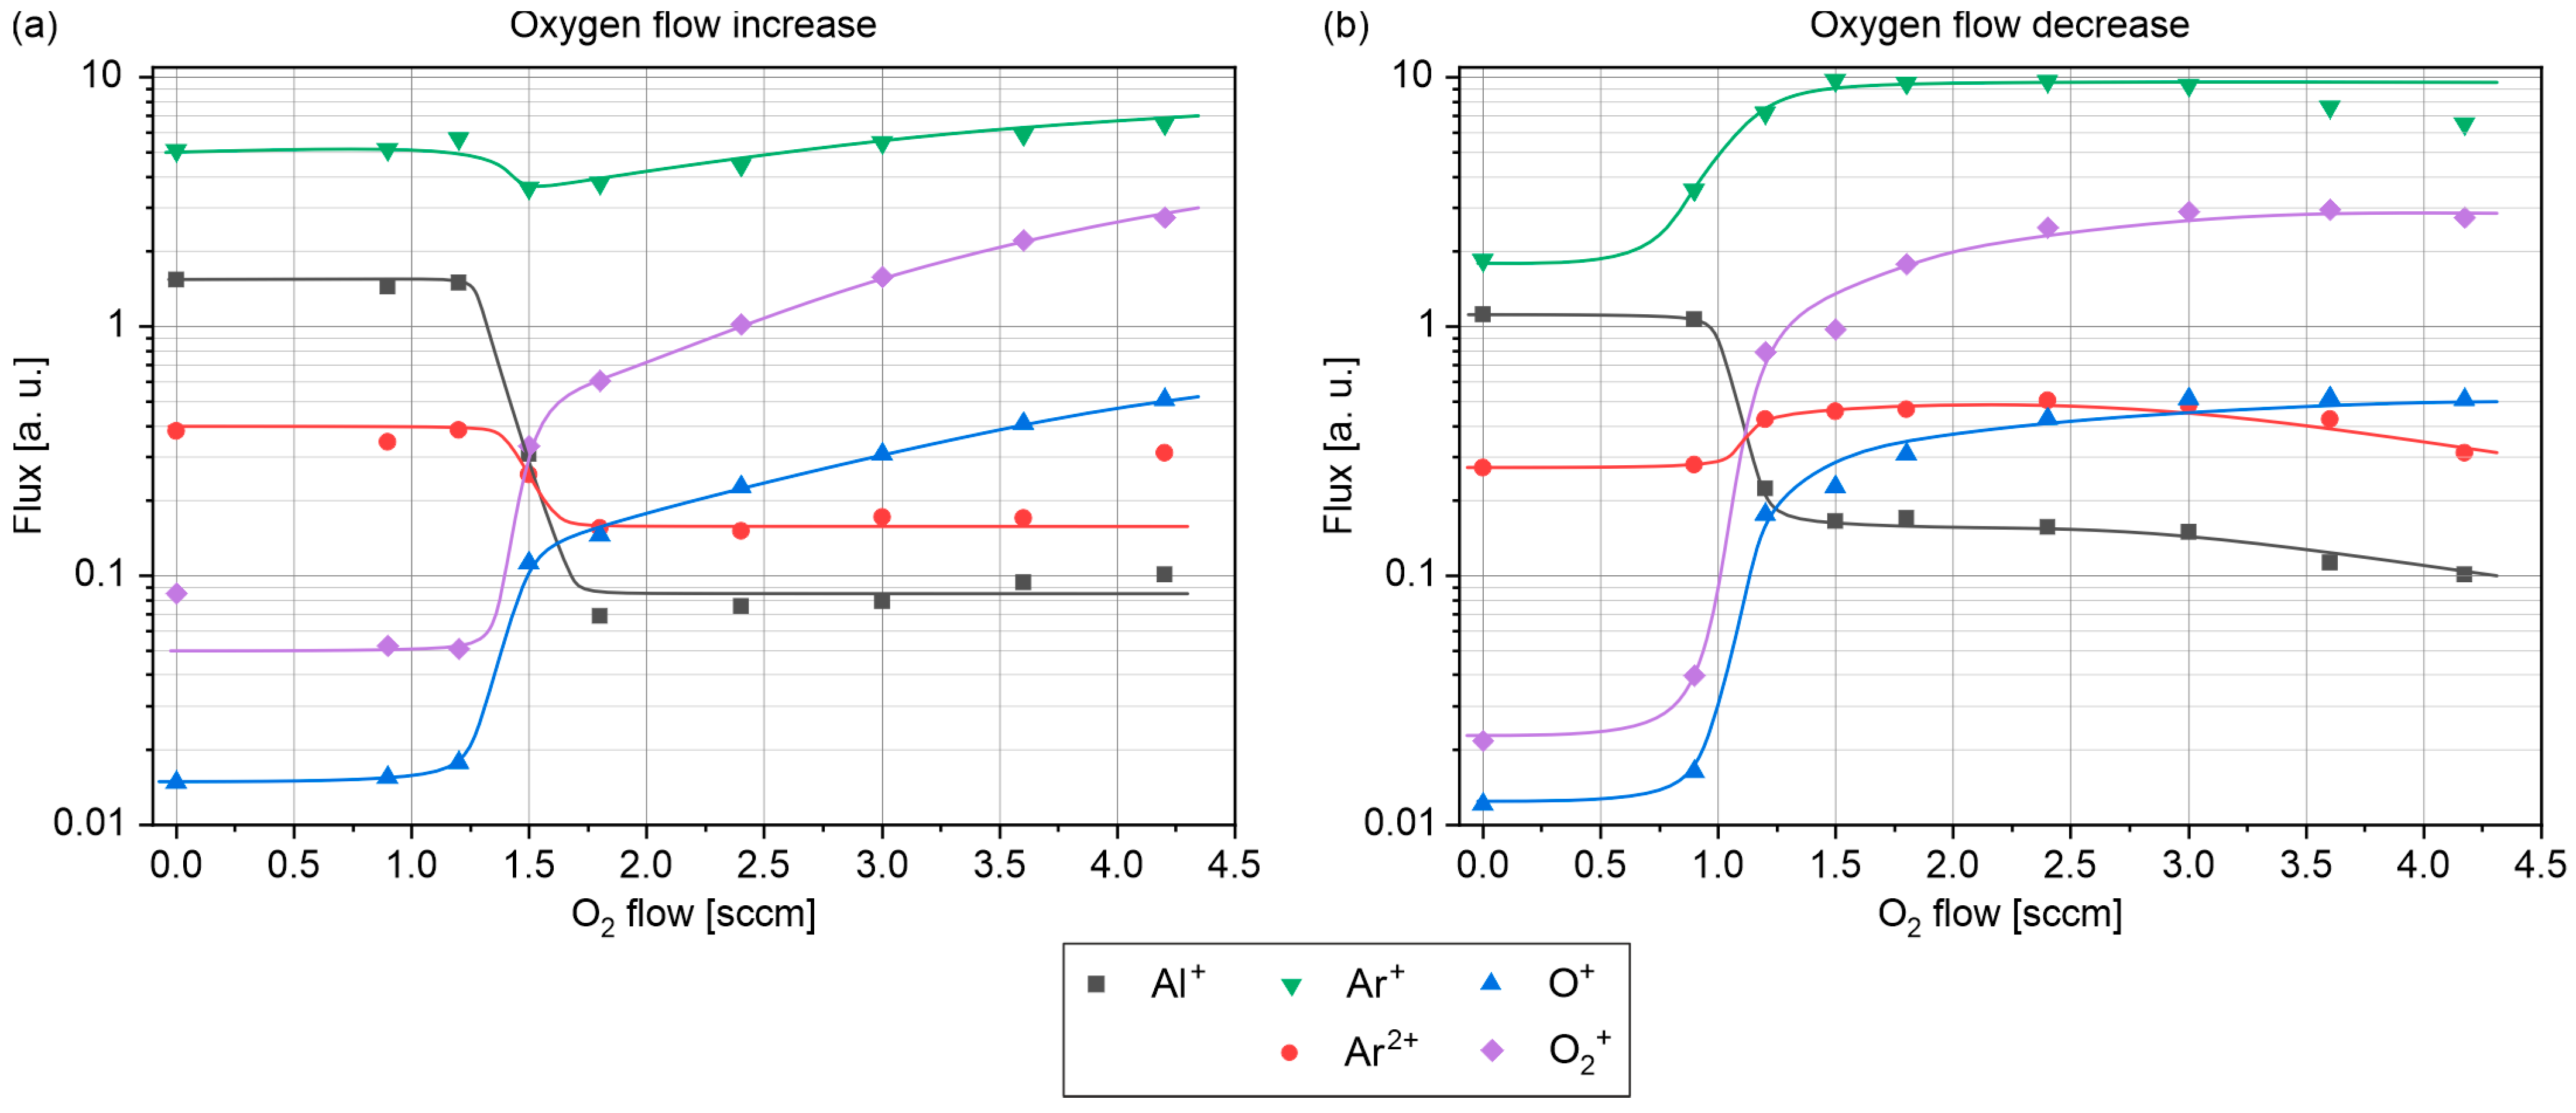
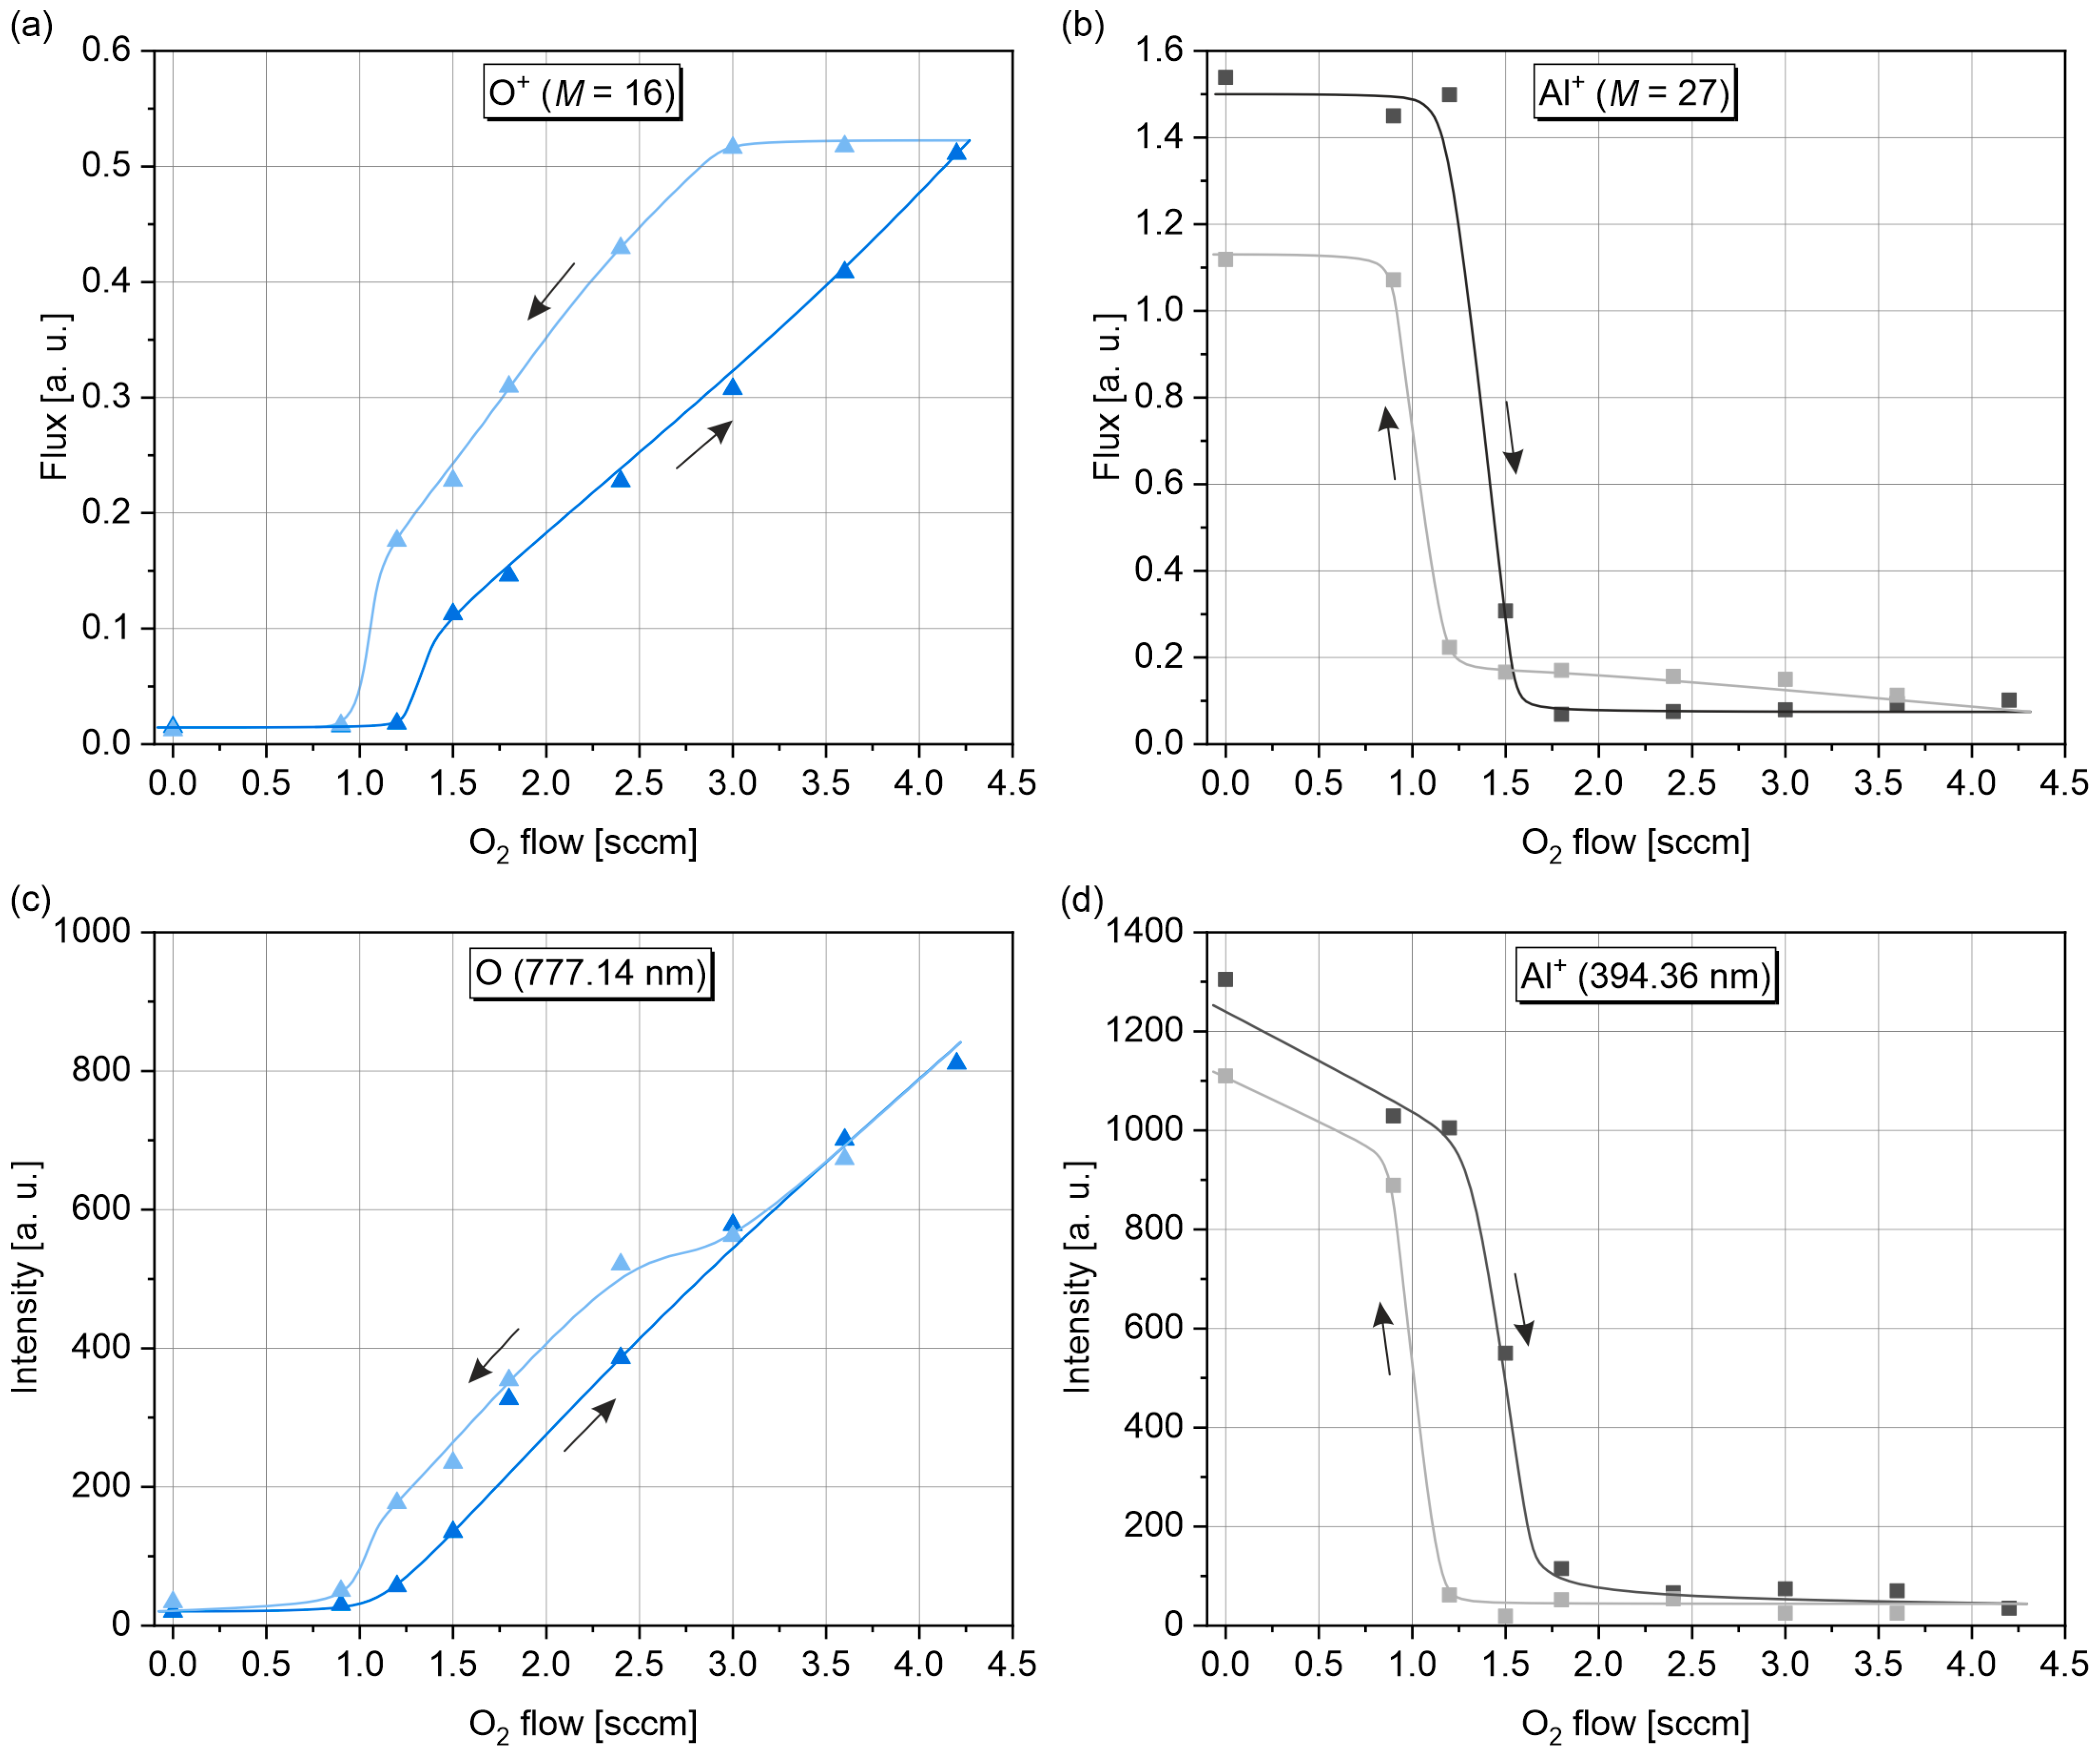
3.2. Ion Mass Spectrometry

Analysis of the ion mass spectra revealed that the main constituents of the ion flux to the substrate were Ar+, Ar2+, Al+, O+, O2+, O, and O2. The types of spectra obtained for each of the component ions in each regime of working reactive gas (O2) flow differed in their intensities correspondingly. The spectra were indicative of good capture of all possible ions and gave a clear demarcation in their intensities. The magnitudes of each mass peak in each spectrum were collected and plotted against the oxygen flow. The results for the positively charged ions are shown in Figure 5. Note that the data have an error of ~0.001 a. u., corresponding to the noise level of the secondary electron multiplier.
The measurements revealed a nonlinear dependence of argon, aluminum, and oxygen ion fluxes on an increase in the flow rate of reactive oxygen gas. In Figure 5, a sharp change in the behavior of the magnetron discharge can be seen at a threshold of 1.2 sccm of reactive O2 flow that was found to influence the characteristics of the ion fluxes.
The intensities of the ion fluxes have been plotted in log scale for a clearer understanding of the dependences. Figure 5a shows the dependences plotted with increasing reactive gas flow in the forward direction while Figure 5b demonstrates the dependences plotted with decreasing reactive gas flow in the reverse direction. Two limiting cases can be visualized here: before transition (left side of threshold, 0.9–1.2 sccm oxygen flow) and after transition (right side of threshold, 1.8 sccm oxygen flow). The left part of the graph is indicative of low fractions of oxygen, which is due to the chemisorption of supplied oxygen on the surface of the target. The oxygen molecules are trapped in the surface, forming an oxide layer on the target, hence poisoning it [51]. The remaining ion contribution parameters are generally constant and stable.
As we glance through the right part of the graph, we notice a different state. There is a nonlinear pattern to the parameters measured which is due to the presence of free oxygen molecules in the deposition chamber volume. There exists a possibility of physisorption of oxygen atoms in the walls of the chamber, which explains the gradual decrease of oxygen ion contribution with the increase in flow rate. One should note the similarity in the deviation of the O+ and O2+ forward curves from the reverse ones observed earlier for the discharge voltage and current trends (Figure 3). At the same time, the signals of argon and aluminum ions do not exhibit such a pronounced feature.
An important process worth mentioning is the fact the discharge is the most intense at the racetrack causing its sputtering. With an increase in oxygen supply, the possibility of racetrack widening might occur. It can act as a possible contributor for the reduction in oxygen ions’ intensity as some of the oxygen ions can be embedded in the target metal surface where no oxidation had taken place (increase in non-reactive fraction on the target surface). Correspondingly, an increase in the metal ion contribution is seen which is due to the ease of ionization of metal atoms compared to argon gas in the transition phase (1.2–1.8 sccm O2). This is explained by the increase in current in the transition region, inducing a greater contribution of metal ions with low ionization energies.
The dynamics of the formation of negative oxygen ions were studied as well. To do this, the polarity of the accelerating voltage for the mass analyzer was reversed. The negative ions were registered at a potential almost equal to the cathode potential [30], and a consistency was observed with the existing experimental results obtained for negative ions even at low power ratings of the discharge [40,41,47,48,49,50]. The experiment was carried out after venting the vacuum chamber, as well as calibration of the reference input voltage for the secondary electron multiplier together with the obtained mass spectra. After that, an experiment was conducted at a rated power of 100 W. The ion currents’ contributions for positively and negatively charged oxygen ions are depicted in Figure 6. Note that the data have an error of ~0.001 a. u., corresponding to the noise level of the secondary electron multiplier.
It was found that negative atomic oxygen ions have a sharp positive correlation, and negative molecular oxygen ions have a sharp negative correlation with an increase in the flow rate of reactive oxygen gas (Figure 6). Here, too, it was observed that the negative oxygen ions had a nonlinear dependence after a threshold of 1.2 sccm of oxygen flow.
As discussed above, the target becomes fully poisoned at the transition threshold of greater than 1.8 sccm reactive oxygen gas flow. After this transition, there is a presence of oxygen in the volume. This presence can be explicitly shown by the presence of negative ions beyond the threshold. The electron sticking rate corresponds to the efficient formation of negative ions. The mechanism of the formation of the negative ions is described by the following equations [40]:
(i) e + O2 → O + O, [Dissociative mechanism]
(ii) e + O2 + M → O2 + M, [Three-body collision]
where M is a metallic atom.
These negative ions emanate from the target metal surface during sputtering and exhibit a particular characteristic. The intensities of both types of negative ions are high at the region in the near vicinity beyond the transition point as can be seen in Figure 6, and in the region further past the transition, in the oxide formation zone, we notice an increase in both sorts of ions. The rightmost measured points, however, show an abrupt decline in negative ion fractions, with O2 flux reaching the detection limit. The reason for such trend shapes remains unclear.
The generation and behavior of negative oxygen ions when using a pure aluminum target are in accord with those in other experiments with an Al target [41] and resemble the results obtained for other oxide targets, specifically, Zn:Al [40], W [46], Zn [48,49], In [48,49], Sn [49], Mg [49], Ti [49], and ZnO:Al2O3 [47]. The negative ions are generated at the racetrack where the ionization rate and density are maximized, and the corresponding intensities thus obtained for negative ions O, O2 are high.

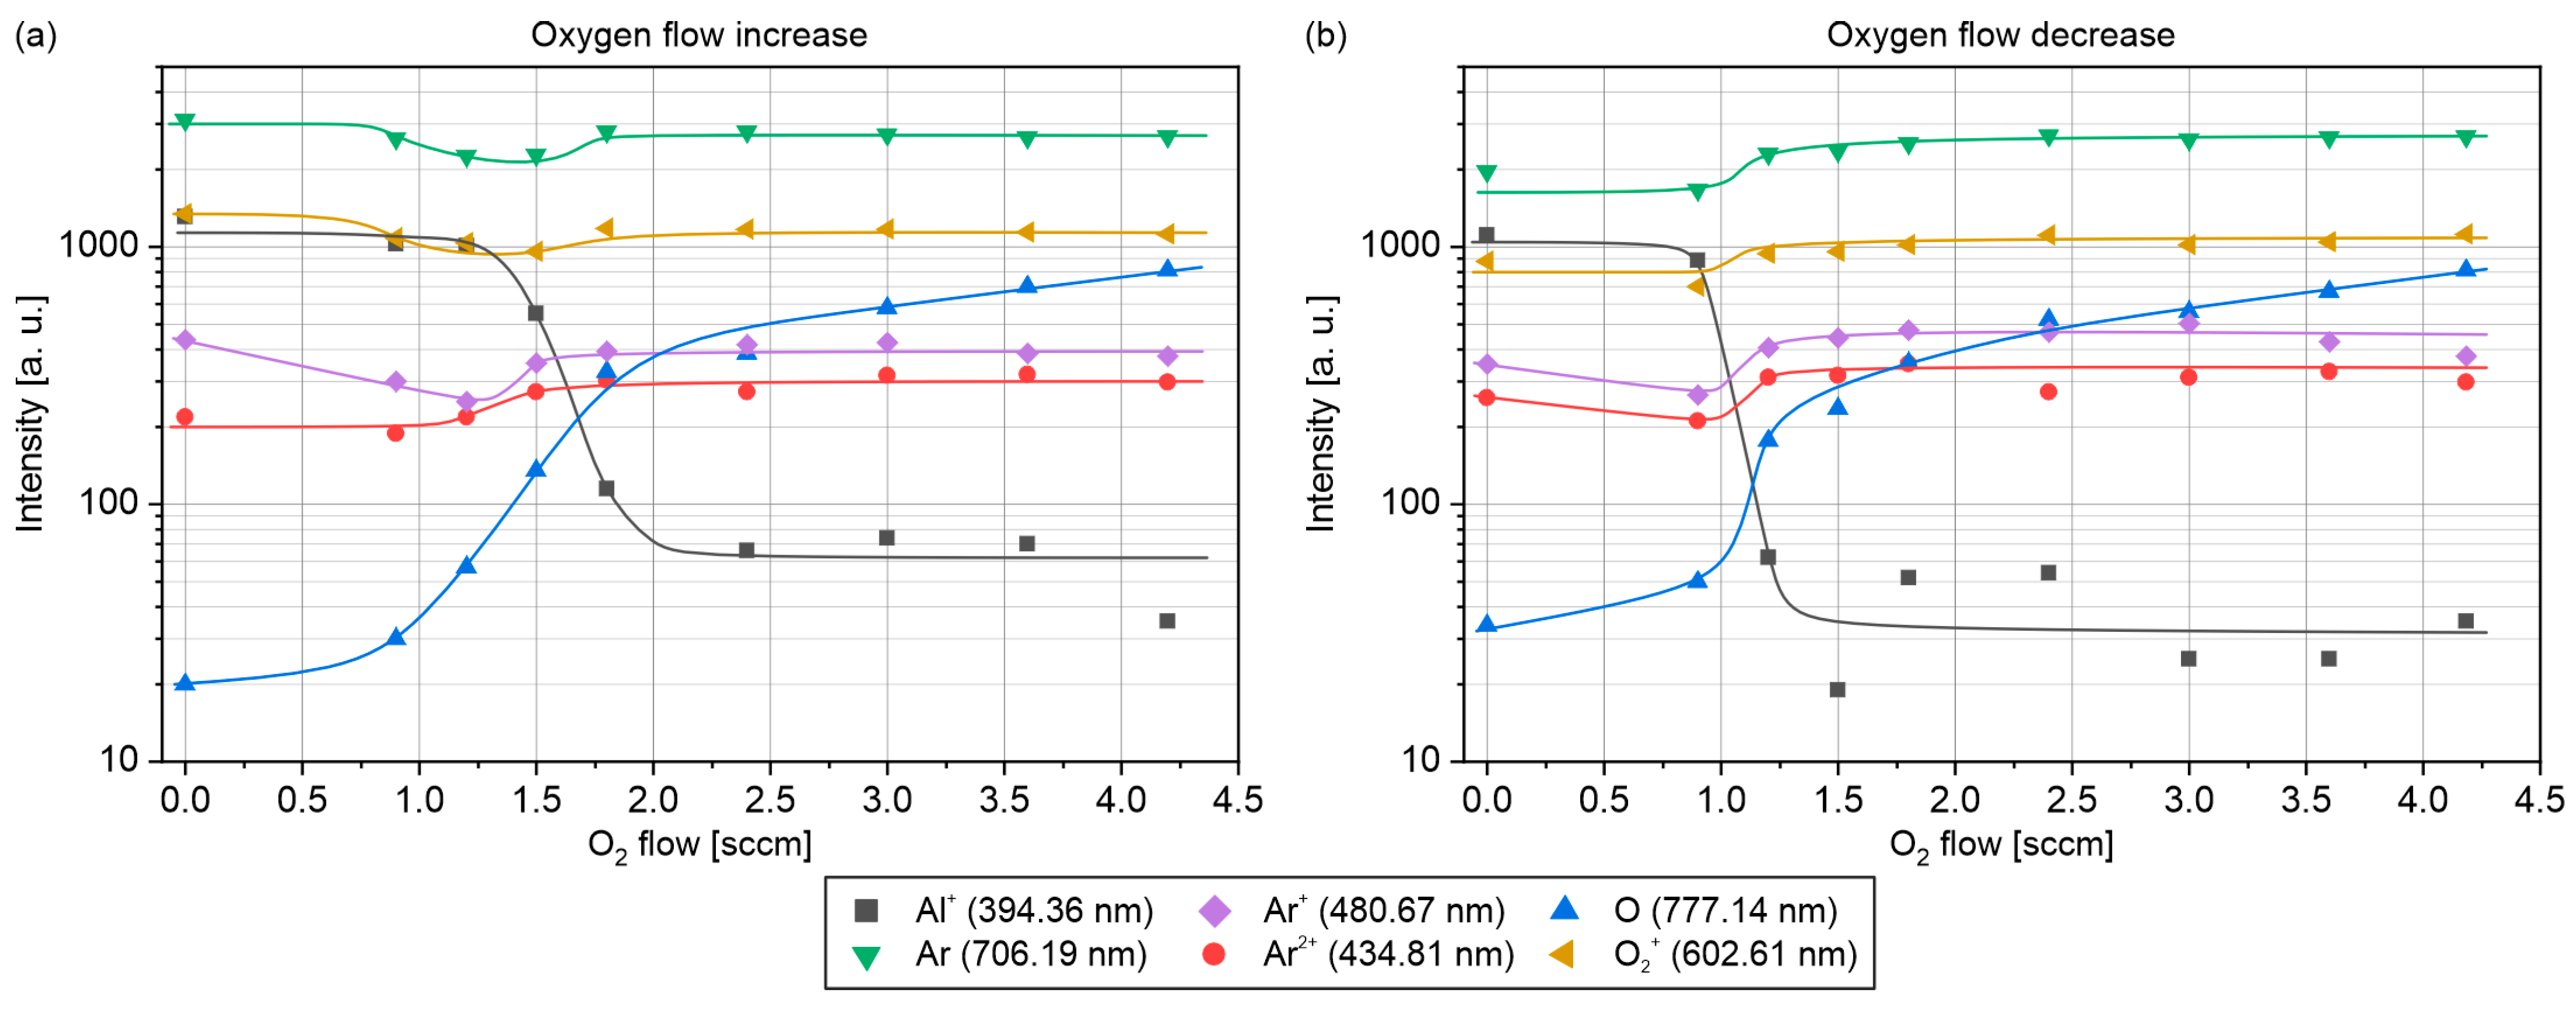
3.3. Optical Emission Spectroscopy

The oxygen flow rate dependences of the spectral radiation intensities of selected strong representative emission lines—Al+ (394.36 nm), Ar (706.19 nm), Ar+ (480.67 nm), Ar2+ (434.81 nm), O (777.14 nm), and O2+ (602.61 nm)—are shown in Figure 7. Note that the data have an error of ~20 a. u., corresponding to the noise level of the dark signal recorded by the spectrometer.
The spectral intensities of plasma species emission are presented in log scale for a clearer understanding of the dependencies. Figure 7a shows the dependences plotted with increasing reactive gas flow in the forward direction, while Figure 7b shows the dependences plotted with decreasing reactive gas flow in the reverse direction.
We observe a decrease in the radiation intensity for the metal ions (Al+) with a corresponding increase in the neutral oxygen atoms (O) and oxygen ions (O2+) measured at different oxygen flows. These changes were observed in the transition zone near the oxygen flow value 1.2 sccm. A slight increase in the radiation intensity after transition can be observed for neutral argon (Ar) atoms and Ar+ ions.

4. Discussion

Each individual spectrum for positive and negative ions has a prominent threshold region of reactive oxygen gas flow where we witnessed a nonlinear dependence. The signals recorded by both optical spectroscopy and ion mass spectrometry for the most representative species of aluminum and oxygen are compared in Figure 8. The optical data for O+ ions were omitted because of their negligible intensity. Therefore, the comparative analysis can be made for the ion flux behavior of O+ and Al+ ions and spectral intensities of O (777.14 nm) and Al+ (394.36 nm) emission lines.
One might observe a clear similarity in the starting point of hysteresis loops for all the curves, being at an oxygen flow of about 0.9 sccm. With increasing oxygen flow, both particle and optical signals for aluminum demonstrate alike behavior. The resulting width of hysteresis loops is nearly the same for both types of diagnostic data.
At the same time, in the 0–0.9 sccm flow rate range, intensity of the Al+ emission line decreases in contrast to the Al+ ion current, which is stable. The intensity of emission lines is governed by the complex set of reactions in plasma involving electrons and heavy species. The declining intensity of the selected Al+ line might indicate the changes in electron energy distribution resulting in depletion of the electronic transitions responsible for the intensity of this particular emission line, even if the flux of Al+ species remains constant. Another cause might be the change in Al+ ions’ energy. Testing the true cause requires additional energy-resolved measurements.
For oxygen, both signals measured in the forward direction, i.e., with increasing oxygen flow, show good agreement in the curve shape. The reverse measurements, however, give contrasting pictures. The O+ ion flux signal has a steady value when decreasing the oxygen flow from 4.2 to 3.0 sccm. At the same time, the optical O signal goes down along the forward trend but then has a shifted horizontal part. These are apparent differences in the hysteresis loop width between O+ ion flux and O emission intensity.
The observed discrepancy suggests that the O emission line intensity cannot be fully representative of the O+ ion flux. Measured optical emission intensity should correlate with the concentration of excited O atoms, which, in turn, can be related to O+ and O concentrations by solving a set of equations for the relevant plasma–chemical reactions.
The transition threshold at 1.2 sccm of the O2 reactive gas supply can be explained by the joint construction of the reactive sputtering Berg model and the experimental results. Let us consider the basic steady-state Berg model comprising the following equations [51,52]:
0 = dNt/dt = (2/Z)αtF(1 − θ1) − (j/ecθ1,
[chemisorption]   [sputtering]
0 = dNs/dt = (2/Z)αsF(1 − θ2) + (j/ecθ1(At/As)(1 − θ2) − (j/em(1 − θ1)(At/As2,
[chemisorption]   [oxide growth]   [deposition of metal]
patmq = (2/Z)αtξF(1 − θ1)At + (2/Z)αsξF(1 − θ2)As + pS,
[balance of oxygen species in the chamber]
where Nt, Ns—numbers of oxygen atoms, which formed compounds with metal atoms at the target and substrate/wall, correspondingly (per unit area); θ1—fraction of the target surface area covered by the oxide compound (poisoned); θ2—compound fraction on the substrate/wall surfaces; j—ion current density; p—partial oxygen pressure; γc—sputtering yield of the compound; γm—sputtering yield of the metal; αt, αs—sticking coefficients of oxygen atoms to metallic parts of the target and substrate/wall surfaces, correspondingly; At—target surface area; As—substrate/wall surface area; e—elementary charge; F = p(2πkBTm)−1/2—relationship between flux F of neutral oxygen molecules and partial oxygen pressure p (kB—Boltzmann constant, T—gas temperature, m—molecular mass); patm—atmospheric pressure; q—oxygen flow rate; ξ = VMpatm/NA—unit conversion factor (VM—molar volume, NA—Avogadro constant); Z—stoichiometry factor of the compound (3/2 for Al2O3); and S—effective pumping speed.
Equation (1) describes the oxidation state of the target surface. The substrate coverage with the oxide compound is determined by Equation (2). Equation (3) expresses the balance of reactive gas species supplied to the chamber. In the steady state, dNt/dt = 0 and dNc/dt = 0 [51,52].
The system of Equations (1)–(3) was used to calculate the dependences of oxygen partial pressure p on oxygen flow rate q taking into account the processes of poisoning and sputtering. The overlay of the calculated results and experimental discharge parameters is shown in Figure 9.
In the power regulation mode, both the voltage and current change when the reactive gas flow is varied. In Figure 8, several pressure–flow lines were built according to Berg model solutions corresponding to different voltages, at a constant power of 100 W. They were calculated for a fixed pair of experimentally observed voltage and current values (indicated in the legend). The circles correspond to the potential operation modes available for the given oxygen flow. To reconstruct the real oxygen pressure–flow curve, one should therefore combine the experimental evidence for the metallic-to-oxide transition (Figure 3, Figure 4 and Figure 8) and the calculated hysteresis curves (Figure 9).
It was found that the experimental hysteresis trajectories observed when changing the supply of reactive gas are slightly different compared to the Berg model results, but the position of the transition point coincides with the calculation. The expected jumps plotted on the graph of the experimental results are marked with arrows, and the dashed line indicates the resulting path of the working point for various flow rates of reactive gas supply. The experimental result is confirmed when we see a sharp change in the partial pressure of the reactive gas during the transition from the metallic to the oxide regime.

5. Conclusions

An experimental study of a DC magnetron discharge with an aluminum target in mixtures of argon and oxygen was systematically carried out using mass analysis of the ion flux from plasma, optical emission spectroscopy, as well as conventional electrical and mass deposition measurements. For the first time, the comparison of the detailed ion mass spectrometric and optical emission spectroscopic data in the metallic-to-oxide mode is shown for reactive aluminum sputtering, in the same system, and for the full hysteresis loop.
There was a significant change in the fluxes of positive and negative ions after a certain threshold of oxygen consumption. The relative proportions of fluxes of Al+ and Ar+ ions decrease, and the proportion of O2+ increases. The intensities of the spectral lines corresponding to the Ar+ and O2+ ions, as well as the neutrals Ar and O, grow with an increase in the oxygen flow. The intensity of the Al+ radiation decreases to almost zero when the oxygen flow is more than 2.4 sccm. The ratio of the fluxes of negative oxygen ions O2 and O correlates with the behavior of positive ions. A sharp increase in the content of molecular ions of O2 corresponds to the transition of the target to a poisoned state. Modeling of the electrical parameters using the Berg model under conditions similar to the experiment allowed us to correctly restore the shape of the transition from the metallic mode to the oxide mode.
The main practical advice emanating from the obtained results is to take into account the correlation between actual ion fluxes arriving at the substrate and the OES data (which are usually used to monitor the metallic-to-oxide transition). Knowing this relationship improves determination of the transition region and helps to identify the working point more precisely, therefore improving the process of alumina film fabrication.

Author Contributions

Conceptualization, A.V.K. and A.V.T.; Data curation, D.V.K., M.M.K. and K.Y.O.; Funding acquisition, N.N.S.; Investigation, A.V.T., M.M.K., R.K. and D.G.A.; Methodology, D.V.K.; Project administration, A.V.K. and N.N.S.; Software, D.V.K. and K.Y.O.; Supervision, A.V.K.; Writing—original draft, D.V.K. and R.K.; Writing—review and editing, A.V.K. and N.N.S. All authors have read and agreed to the published version of the manuscript.

Funding

This work was carried out within the framework of the state task of the Ministry of Science and Higher Education of the Russian Federation (subject No. FSWU-2022-0022 “Low-temperature ceramic technologies (LTCC) in microelectronics”).

Institutional Review Board Statement

Not applicable.

Informed Consent Statement

Not applicable.

Data Availability Statement

The original contributions presented in this study are included in the article. Further inquiries can be directed to the corresponding author.

Conflicts of Interest

The authors declare no conflicts of interest. The funders had no role in the design of the study; in the collection, analyses, or interpretation of data; in the writing of the manuscript; or in the decision to publish the results.

References

  1. Zhou, G.; Wang, L.; Wang, X.; Yu, Y.; Mutzke, A. Effect of Bias Voltage on Microstructure and Optical Properties of Al2O3 Thin Films Prepared by Twin Targets Reactive High Power Impulse Magnetron Sputtering. Vacuum 2019, 166, 88–96. [Google Scholar] [CrossRef]
  2. Zhou, G.; Wang, L.; Wang, X.; Yu, Y. Investigating the Plasma Parameters and Discharge Asymmetry in Dual Magnetron Reactive High Power Impulse Magnetron Sputtering Discharge with Al in Ar/O2 Mixture. Vacuum 2020, 175, 109253. [Google Scholar] [CrossRef]
  3. Tang, X.; Li, Z.; Liao, H.; Zhang, J. Growth of Ultrathin Al2O3 Films on N-InP Substrates as Insulating Layers by RF Magnetron Sputtering and Study on the Optical and Dielectric Properties. Coatings 2019, 9, 341. [Google Scholar] [CrossRef]
  4. Mensah, S.L.; Gordon, M.; Naseem, H.H. Investigating the Plasma Parameters of an Ar/O2 Discharge during the Sputtering of Al Targets in an Inverted Cylindrical Magnetron. Phys. Plasmas 2014, 21, 093510. [Google Scholar] [CrossRef]
  5. Lin, Y. Optimization of Deposition Parameters for α-Al2O3 Coatings by Double Glow Plasma Technique. Kem. u Ind. 2015, 64, 457–466. [Google Scholar] [CrossRef]
  6. Kohara, T.; Tamagaki, H.; Ikari, Y.; Fujii, H. Deposition of α-Al2O3 Hard Coatings by Reactive Magnetron Sputtering. Surf. Coat. Technol. 2004, 185, 166–171. [Google Scholar] [CrossRef]
  7. Gavrilov, N.V.; Kamenetskikh, A.S.; Trernikov, P.V.; Emlin, D.R.; Chukin, A.V.; Surkov, Y.S. Al2O3 Thin Films Deposition by Reactive Evaporation of Al in Anodic Arc with High Levels of Metal Ionization. Surf. Coat. Technol. 2019, 359, 117–124. [Google Scholar] [CrossRef]
  8. Engelhart, W.; Dreher, W.; Eibl, O.; Schier, V. Deposition of Alumina Thin Film by Dual Magnetron Sputtering: Is It γ-Al2O3? Acta Mater. 2011, 59, 7757–7767. [Google Scholar] [CrossRef]
  9. Angarita, G.; Palacio, C.; Trujillo, M.; Arroyave, M. Synthesis of Alumina Thin Films Using Reactive Magnetron Sputtering Method. J. Phys. Conf. Ser. 2017, 850, 012022. [Google Scholar] [CrossRef]
  10. Li, Q.; Yu, Y.-H.; Singh Bhatia, C.; Marks, L.D.; Lee, S.C.; Chung, Y.W. Low-Temperature Magnetron Sputter-Deposition, Hardness, and Electrical Resistivity of Amorphous and Crystalline Alumina Thin Films. J. Vac. Sci. Technol. A Vac. Surf. Film. 2000, 18, 2333–2338. [Google Scholar] [CrossRef]
  11. Depla, D.; Heirwegh, S.; Mahieu, S.; Haemers, J.; De Gryse, R. Understanding the Discharge Voltage Behavior during Reactive Sputtering of Oxides. J. Appl. Phys. 2007, 101, 013301. [Google Scholar] [CrossRef]
  12. Gudmundsson, J.T. Physics and Technology of Magnetron Sputtering Discharges. Plasma Sources Sci. Technol. 2020, 29, 113001. [Google Scholar] [CrossRef]
  13. Schulte, J.; Sobe, G. Magnetron Sputtering of Aluminium Using Oxygen or Nitrogen as Reactive Gas. Thin Solid Film. 1998, 324, 19–24. [Google Scholar] [CrossRef]
  14. Strijckmans, K.; Schelfhout, R.; Depla, D. Tutorial: Hysteresis during the Reactive Magnetron Sputtering Process. J. Appl. Phys. 2018, 124, 241101. [Google Scholar] [CrossRef]
  15. Belkind, A.; Freilich, A.; Lopez, J.; Zhao, Z.; Zhu, W.; Becker, K. Characterization of Pulsed Dc Magnetron Sputtering Plasmas. New J. Phys. 2005, 7, 90. [Google Scholar] [CrossRef]
  16. Kadlec, S.; Musil, J.; Vyskocil, H. Hysteresis Effect in Reactive Sputtering: A Problem of System Stability. J. Phys. D Appl. Phys. 1986, 19, L187–L190. [Google Scholar] [CrossRef]
  17. Kubart, T.; Kappertz, O.; Nyberg, T.; Berg, S. Dynamic Behaviour of the Reactive Sputtering Process. Thin Solid Film. 2006, 515, 421–424. [Google Scholar] [CrossRef]
  18. Sproul, W.D.; Christie, D.J.; Carter, D.C. Control of Reactive Sputtering Processes. Thin Solid Film. 2005, 491, 1–17. [Google Scholar] [CrossRef]
  19. Wang, Q.; Fang, L.; Liu, Q.; Chen, L.; Wang, Q.; Meng, X.; Xiao, H. Target Voltage Hysteresis Behavior and Control Point in the Preparation of Aluminum Oxide Thin Films by Medium Frequency Reactive Magnetron Sputtering. Coatings 2018, 8, 146. [Google Scholar] [CrossRef]
  20. Wiatrowski, A.; Patela, S.; Kunicki, P.; Posadowski, W. Effective Reactive Pulsed Magnetron Sputtering of Aluminium Oxide—Properties of Films Deposited Utilizing Automated Process Stabilizer. Vacuum 2016, 134, 54–62. [Google Scholar] [CrossRef]
  21. Strijckmans, K.; Moens, F.; Depla, D. Perspective: Is There a Hysteresis during Reactive High Power Impulse Magnetron Sputtering (R-HiPIMS)? J. Appl. Phys. 2017, 121, 080901. [Google Scholar] [CrossRef]
  22. Särhammar, E.; Strijckmans, K.; Nyberg, T.; Van Steenberge, S.; Berg, S.; Depla, D. A Study of the Process Pressure Influence in Reactive Sputtering Aiming at Hysteresis Elimination. Surf. Coat. Technol. 2013, 232, 357–361. [Google Scholar] [CrossRef]
  23. Madsen, N.D.; Christensen, B.H.; Louring, S.; Berthelsen, A.N.; Almtoft, K.P.; Nielsen, L.P.; Bøttiger, J. Controlling the Deposition Rate during Target Erosion in Reactive Pulsed DC Magnetron Sputter Deposition of Alumina. Surf. Coat. Technol. 2012, 206, 4850–4854. [Google Scholar] [CrossRef]
  24. Kaziev, A.V.; Kolodko, D.V.; Sergeev, N.S. Properties of Millisecond-Scale Modulated Pulsed Power Magnetron Discharge Applied for Reactive Sputtering of Zirconia. Plasma Sources Sci. Technol. 2021, 30, 055002. [Google Scholar] [CrossRef]
  25. Depla, D.; Haemers, J.; De Gryse, R. Influencing the Hysteresis during Reactive Magnetron Sputtering by Gas Separation. Surf. Coat. Technol. 2013, 235, 62–67. [Google Scholar] [CrossRef]
  26. Anders, A. Tutorial: Reactive High Power Impulse Magnetron Sputtering (R-HiPIMS). J. Appl. Phys. 2017, 121, 171101. [Google Scholar] [CrossRef]
  27. Schneider, J.M.; Sproul, W.D.; Chia, R.W.J.; Wong, M.-S.; Matthews, A. Very-High-Rate Reactive Sputtering of Alumina Hard Coatings. Surf. Coat. Technol. 1997, 96, 262–266. [Google Scholar] [CrossRef]
  28. Oskirko, V.O.; Zakharov, A.N.; Pavlov, A.P.; Solovyev, A.A.; Grenadyorov, A.S.; Semenov, V.A. Dual Mode of Deep Oscillation Magnetron Sputtering. Surf. Coat. Technol. 2020, 387, 125559. [Google Scholar] [CrossRef]
  29. Lin, J.; Sproul, W.D. Structure and Properties of Cr2O3 Coatings Deposited Using DCMS, PDCMS, and DOMS. Surf. Coat. Technol. 2015, 276, 70–76. [Google Scholar] [CrossRef]
  30. Kuschel, T.; von Keudell, A. Ion-Enhanced Oxidation of Aluminum as a Fundamental Surface Process during Target Poisoning in Reactive Magnetron Sputtering. J. Appl. Phys. 2010, 107, 103302. [Google Scholar] [CrossRef]
  31. Houska, J.; Kozak, T. Distribution of O Atoms on Partially Oxidized Metal Targets, and the Consequences for Reactive Sputtering of Individual Metal Oxides. Surf. Coat. Technol. 2020, 392, 125685. [Google Scholar] [CrossRef]
  32. Depla, D.; De Gryse, R. Target Poisoning during Reactive Magnetron Sputtering: Part II: The Influence of Chemisorption and Gettering. Surf. Coat. Technol. 2004, 183, 190–195. [Google Scholar] [CrossRef]
  33. Depla, D.; Colpaert, A.; Eufinger, K.; Segers, A.; Haemers, J.; De Gryse, R. Target Voltage Behaviour during DC Sputtering of Silicon in an Argon/Nitrogen Mixture. Vacuum 2002, 66, 9–17. [Google Scholar] [CrossRef]
  34. Depla, D. Note on the Low Deposition Rate during Reactive Magnetron Sputtering. Vacuum 2024, 228, 113546. [Google Scholar] [CrossRef]
  35. Novotný, M.; Bulíř, J.; Pokorný, P.; Bočan, J.; Fitl, P.; Lančok, J.; Musil, J. Optical Emission and Mass Spectroscopy of Plasma Processes in Reactive DC Pulsed Magnetron Sputtering of Aluminium Oxide. J. Optoelectron. Adv. Mater. 2010, 12, 697–700. [Google Scholar]
  36. Ries, S.; Bibinov, N.; Rudolph, M.; Schulze, J.; Mráz, S.; Schneider, J.M.; Awakowicz, P. Spatially Resolved Characterization of a Dc Magnetron Plasma Using Optical Emission Spectroscopy. Plasma Sources Sci. Technol. 2018, 27, 094001. [Google Scholar] [CrossRef]
  37. Vašina, P.; Fekete, M.; Hnilica, J.; Klein, P.; Dosoudilová, L.; Dvořák, P.; Navrátil, Z. Determination of Titanium Atom and Ion Densities in Sputter Deposition Plasmas by Optical Emission Spectroscopy. Plasma Sources Sci. Technol. 2015, 24, 065022. [Google Scholar] [CrossRef]
  38. Kolodko, D.V.; Ageychenkov, D.G.; Kaziev, A.V.; Leonova, K.A.; Kharkov, M.M.; Tumarkin, A.V. Diagnostics of Ion Fluxes in Low-Temperature Laboratory and Industrial Plasmas. J. Instrum. 2019, 14, P10005. [Google Scholar] [CrossRef]
  39. Schmidt, S.; Czigány, Z.; Greczynski, G.; Jensen, J.; Hultman, L. Ion Mass Spectrometry Investigations of the Discharge during Reactive High Power Pulsed and Direct Current Magnetron Sputtering of Carbon in Ar and Ar/N2. J. Appl. Phys. 2012, 112, 013305. [Google Scholar] [CrossRef]
  40. Pokorný, P.; Mišina, M.; Bulíř, J.; Lančok, J.; Fitl, P.; Musil, J.; Novotný, M. Investigation of the Negative Ions in Ar/O2 Plasma of Magnetron Sputtering Discharge with Al:Zn Target by Ion Mass Spectrometry. Plasma Process. Polym. 2011, 8, 459–464. [Google Scholar] [CrossRef]
  41. Pokorný, P.; Bulíř, J.; Lančok, J.; Musil, J.; Novotný, M. Generation of Positive and Negative Oxygen Ions in Magnetron Discharge During Reactive Sputtering of Alumina. Plasma Process. Polym. 2010, 7, 910–914. [Google Scholar] [CrossRef]
  42. Pokorný, P.; Musil, J.; Lančok, J.; Fitl, P.; Novotný, M.; Bulíř, J.; Vlček, J. Mass Spectrometry Investigation of Magnetron Sputtering Discharges. Vacuum 2017, 143, 438–443. [Google Scholar] [CrossRef]
  43. Mišina, M.; Shaginyan, L.R.; Maček, M.; Panjan, P. Energy Resolved Ion Mass Spectroscopy of the Plasma during Reactive Magnetron Sputtering. Surf. Coat. Technol. 2001, 142–144, 348–354. [Google Scholar] [CrossRef]
  44. Kolodko, D.V.; Ageychenkov, D.G.; Lisenkov, V.Y.; Kaziev, A. V Evidence of 1000 eV Positive Oxygen Ion Flux Generated in Reactive HiPIMS Plasma. Plasma Sources Sci. Technol. 2023, 32, 06LT01. [Google Scholar] [CrossRef]
  45. Bowes, M.; Poolcharuansin, P.; Bradley, J.W. Negative Ion Energy Distributions in Reactive HiPIMS. J. Phys. D Appl. Phys. 2013, 46, 045204. [Google Scholar] [CrossRef]
  46. Hippler, R.; Cada, M.; Hubicka, Z. Energy Distribution of Negatively and Positively Charged Ions in a Magnetron Sputtering Discharge with a Tungsten Cathode and a Positively Biased Anode in an Argon/Oxygen Gas Mixture. Plasma Sources Sci. Technol. 2024, 33, 115006. [Google Scholar] [CrossRef]
  47. Welzel, T.; Kleinhempel, R.; Dunger, T.; Richter, F. Ion Energy Distributions in Magnetron Sputtering of Zinc Aluminium Oxide. Plasma Process. Polym. 2009, 6, S331–S336. [Google Scholar] [CrossRef]
  48. Welzel, T.; Ellmer, K. Negative Ions in Reactive Magnetron Sputtering. Vak. Forsch. und Prax. 2013, 25, 52–56. [Google Scholar] [CrossRef]
  49. Welzel, T.; Ellmer, K. Negative Oxygen Ion Formation in Reactive Magnetron Sputtering Processes for Transparent Conductive Oxides. J. Vac. Sci. Technol. A Vac. Surf. Film. 2012, 30, 061306. [Google Scholar] [CrossRef]
  50. Richter, F.; Welzel, T.; Kleinhempel, R.; Dunger, T.; Knoth, T.; Dimer, M.; Milde, F. Ion Energy Distributions in AZO Magnetron Sputtering from Planar and Rotatable Magnetrons. Surf. Coat. Technol. 2009, 204, 845–849. [Google Scholar] [CrossRef]
  51. Berg, S.; Nyberg, T. Fundamental Understanding and Modeling of Reactive Sputtering Processes. Thin Solid Film. 2005, 476, 215–230. [Google Scholar] [CrossRef]
  52. Berg, S.; Blom, H.-O.; Larsson, T.; Nender, C. Modeling of Reactive Sputtering of Compound Materials. J. Vac. Sci. Technol. A Vac. Surf. Film. 1987, 5, 202–207. [Google Scholar] [CrossRef]
  53. Karnopp, J.; Sagás, J.C. Including Substrate Temperature in Berg Model for Reactive Sputtering. Thin Solid Film. 2020, 696, 137761. [Google Scholar] [CrossRef]
  54. Berg, S.; Särhammar, E.; Nyberg, T. Upgrading the “Berg-Model” for Reactive Sputtering Processes. Thin Solid Film. 2014, 565, 186–192. [Google Scholar] [CrossRef]
  55. Depla, D.; Heirwegh, S.; Mahieu, S.; Gryse, R. De Towards a More Complete Model for Reactive Magnetron Sputtering. J. Phys. D Appl. Phys. 2007, 40, 1957–1965. [Google Scholar] [CrossRef]
  56. Särhammar, E.; Nyberg, T.; Berg, S. Applying “the Upgraded Berg Model” to Predict Hysteresis Free Reactive Sputtering. Surf. Coat. Technol. 2016, 290, 34–38. [Google Scholar] [CrossRef]
  57. Strijckmans, K.; Leroy, W.P.; De Gryse, R.; Depla, D. Modeling Reactive Magnetron Sputtering: Fixing the Parameter Set. Surf. Coat. Technol. 2012, 206, 3666–3675. [Google Scholar] [CrossRef]
  58. Yagisawa, T.; Makabe, T. Modeling of Dc Magnetron Plasma for Sputtering: Transport of Sputtered Copper Atoms. J. Vac. Sci. Technol. A Vac. Surf. Film. 2006, 24, 908–913. [Google Scholar] [CrossRef]
  59. Strijckmans, K.; Depla, D. A Time-Dependent Model for Reactive Sputter Deposition. J. Phys. D Appl. Phys. 2014, 47, 235302. [Google Scholar] [CrossRef]
  60. Möller, W.; Güttler, D. Modeling of Plasma-Target Interaction during Reactive Magnetron Sputtering of TiN. J. Appl. Phys. 2007, 102, 094501. [Google Scholar] [CrossRef]
  61. Pflug, A.; Siemers, M.; Melzig, T.; Schäfer, L.; Bräuer, G. Simulation of Linear Magnetron Discharges in 2D and 3D. Surf. Coat. Technol. 2014, 260, 411–416. [Google Scholar] [CrossRef]
  62. Kaziev, A.V.; Kolodko, D.V.; Ageychenkov, D.G.; Tumarkin, A.V.; Kharkov, M.M.; Stepanova, T.V. Direct Ion Content Measurements in a Non-Sputtering Magnetron Discharge. J. Instrum. 2019, 14, C09004. [Google Scholar] [CrossRef]
  63. Kramida, A.; Ralchenko, Y.; Reader, J.; NIST ASD Team. NIST Atomic Spectra Database (Ver. 5.12), [Online]. 2024. Available online: https://physics.nist.gov/asd (accessed on 3 March 2025).
  64. Krupenie, P.H. The Spectrum of Molecular Oxygen. J. Phys. Chem. Ref. Data 1972, 1, 423–534. [Google Scholar] [CrossRef]
Figure 1. Setup of the magnetron sputtering system.
Applsci 15 04305 g001
Figure 2. Schematic of electric potential distribution along the ion path in MA used for detection of (a) positive ions; (b) negative ions.
Applsci 15 04305 g002
Figure 3. Magnetron discharge parameters at different O2 flow rates: (a) voltage; (b) current. The arrows mark the forward and reverse curves.
Applsci 15 04305 g003
Figure 4. Dependence of the deposition rate on oxygen flow measured using QCM. The arrows mark the forward and reverse curves.
Applsci 15 04305 g004
Figure 5. Fluxes of positively charged ions in the transition region vs. oxygen flow rate: (a) flow rate increasing; (b) flow rate decreasing.
Applsci 15 04305 g005
Figure 6. Fluxes of positively and negatively charged ions in the transition region vs. oxygen flow rate.
Applsci 15 04305 g006
Figure 7. Optical emission intensities of plasma constituents vs. oxygen flow rate: (a) flow rate increasing; (b) flow rate decreasing.
Applsci 15 04305 g007
Figure 8. Comparison of hysteresis curves in ion mass spectrometric (a,b) and optical emission spectroscopic (c,d) measurements: (a) ion flux signal of O+ ions; (b) ion flux signal of Al+ ions; (c) emission intensity of O line (λ = 777.14 nm); (d) emission intensity of Al+ line (λ = 394.36 nm).
Applsci 15 04305 g008
Figure 9. Hysteresis loop evaluation by simulation and experiment. Dashed line represents the “real” oxygen pressure–flow curve for a discharge operating in power regulation mode.
Applsci 15 04305 g009
Disclaimer/Publisher’s Note: The statements, opinions and data contained in all publications are solely those of the individual author(s) and contributor(s) and not of MDPI and/or the editor(s). MDPI and/or the editor(s) disclaim responsibility for any injury to people or property resulting from any ideas, methods, instructions or products referred to in the content.

