1. Introduction to Plasma Generation
In the technology of production and modification of dielectric surfaces, generated plasma under atmospheric pressure [
1] finds new applications in the modification of electrical properties of the upper layers of material surfaces. It is also used for the modification of various parameters in terms of mechanical properties and at the molecular and atomic level [
2,
3]. For these purposes and to achieve physical or chemical changes on the surface of the target material, plasma sources [
4] are used to achieve repeatable outputs under predefined boundary and initial conditions. The proposed industrial applications for HV technology cannot readily use vacuum plasma-engineered plasma generation (PECVD). Therefore, the use of high-frequency electric discharge sources [
3] that produce plasma under atmospheric pressure proves to be a viable route.
The methods of generating non-thermal high-frequency plasma discharge are used in various industries [
2,
3]. The advantage of atmospheric pressure plasma discharge generation techniques lies in the ability to easily and efficiently modify the surface and create a local structure of the surface through its modification [
5,
6]. Another option is surface treatment using the gaseous [
7,
8] or the liquid precursors [
9].
The electromagnetohydrodynamic properties of the plasma discharges [
1] are influenced by the design of both the electrical generator and the design of the chamber used to excite the plasma [
10,
11,
12]. For the industrial deployment of plasma discharge material processing technology, the use of a slit chamber [
4] in a plasma source system, as opposed to plasma pens for local exposure [
11,
12], is very effective. The generator for industrial deployment includes an electrical generator and a high-frequency electrode with a working frequency of
f = 13.56 MHz, a slit plasma chamber [
4], and a detection system for recording plasma discharge parameters [
13]. A radio-frequency method for recording frequency spectra [
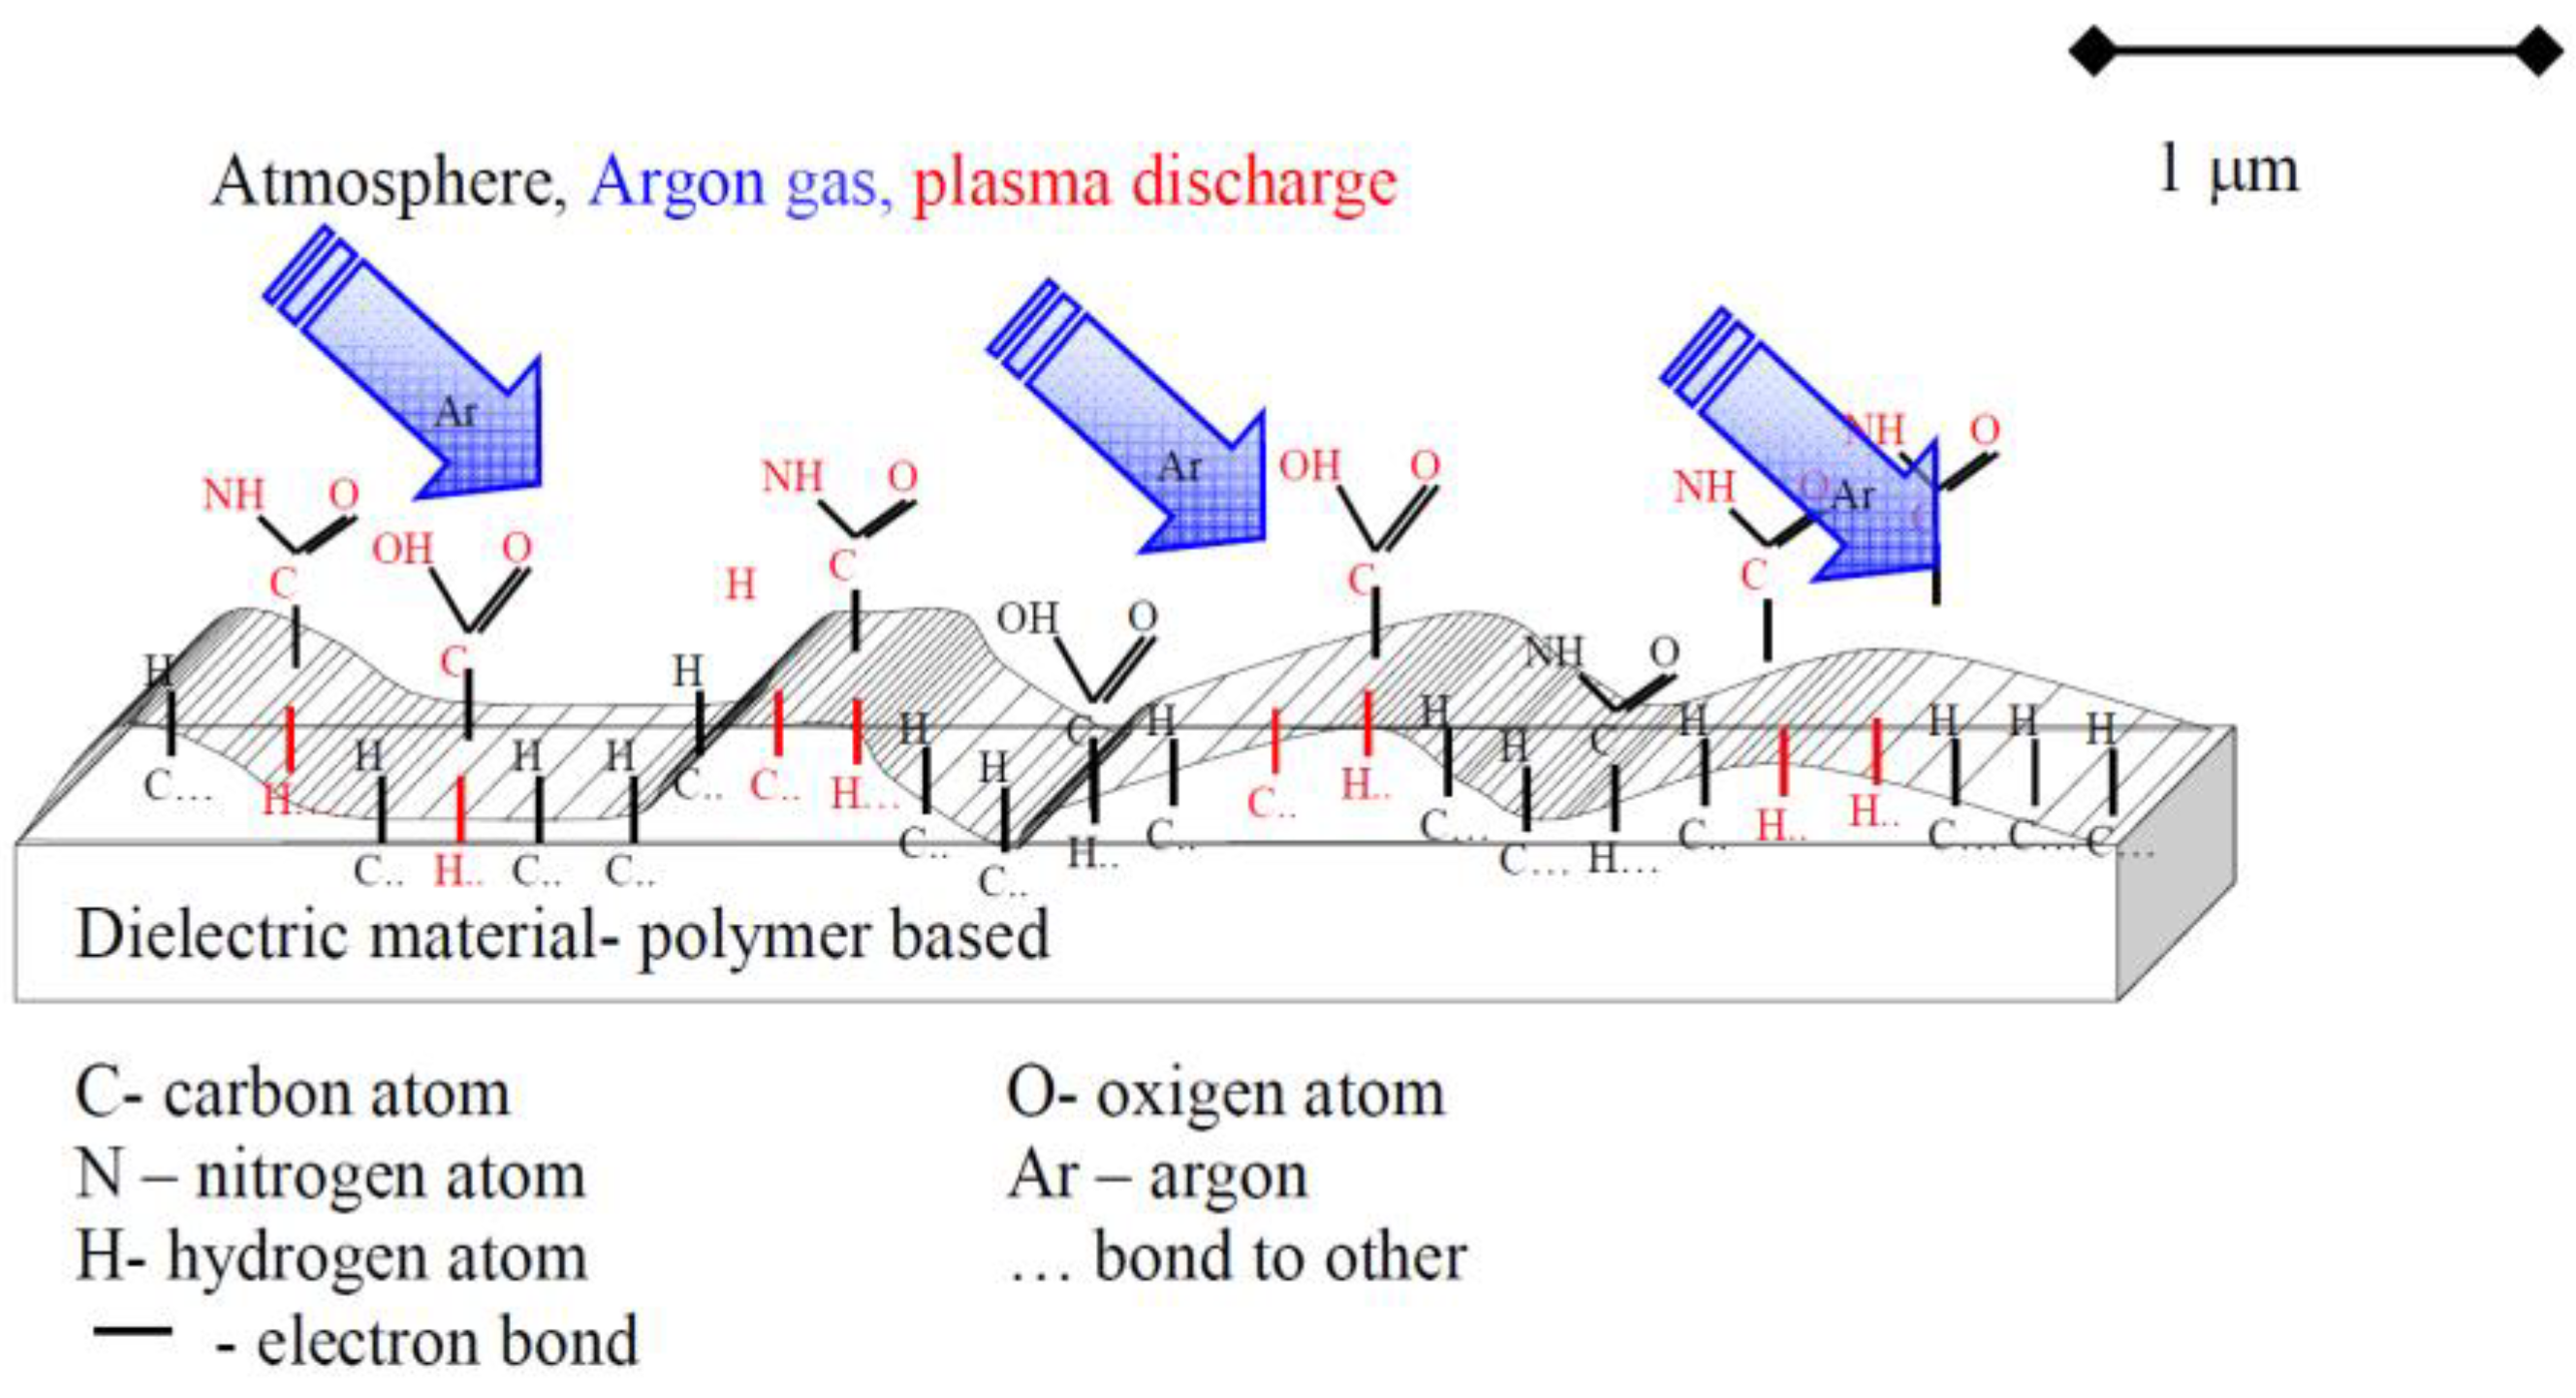
13] has proved to be a suitable detection system, which is typical for the applied discharge setup parameters (gas type, i.e., Ar, N or O, set output power of the RF generator, type of frequency of the basic RF signal, type of precursors, etc.) When the plasma source is in operation, an atmosphere composed of argon, nitrogen and other gases, either alone or also with an admixture of precursor gases or substances, flows through the slotted chamber [
14]. The qualitative and quantitative parameters of the electromagnetic discharge depend mainly on y the geometrical arrangement of the chamber, electrodes, the shape of the excitation signal of the RF generator and related parameters [
13,
14,
15,
16].
Plasma sources at atmospheric pressure can have different geometries and properties of the generated discharge, and their possible applications depend on this. Corona discharge [
17,
18,
19] and dielectric barrier discharge (DBD) [
20,
21] are not suitable for surface treatment of complex, often large, 3D products of HV insulators due to their unsuitable geometry.
The low-pressure glow discharges are quite efficient in the surface modification of materials [
22,
23]. However, using low-pressure plasma techniques in the industrial setting is not quite feasible because the implementation and operation of vacuum systems are too expensive compared with the required costs of HV insulator product applications. However, the situation may be different for plasma jets. In one of our earlier publications [
5], we compared four different plasma sources.
These plasma sources included the Plasmatreat rotating plasma jet (treated area diameter 33 mm), AFS PlasmaJet® (treated area diameter 8 mm), SurfaceTreat gliding arc jet (treated area diameter 27–36 mm), and the low-temperature RF plasma slit jet working in argon with a plasma width of 150 mm (our plasma nozzle described in this work). The first three plasma sources use air atmosphere to create plasma, although it is more economical, but it is not possible to selectively adjust the chemical processes during surface treatment. In comparison with these sources, with the plasma nozzle we developed, the RF plasma slit jet working in argon, argon oxide, argon–nitrogen, we can add appropriate additives or precursors as needed and thus regulate the processes during material surface modification. We consider this advantage to be essential for achieving the desired results of surface treatment of HV insulators considered in the described research. The second criterion for selecting a suitable plasma source from the example of the four plasma nozzles mentioned is the treated area diameter. Robotic application of a plasma source with a treated area diameter of 150 mm (or higher) is undoubtedly technically and economically more suitable for large 3D products of HV insulators than plasma nozzles with local effects.
3. Experimental Conditions of Plasma Surface Treatment of Test Samples
A radio-frequency (RF) slot plasma nozzle with an active plasma width of
wg = 150 mm was used for the surface treatment of the tested polymer insulation samples, as shown in
Figure 2. The flow rate of Ar through the plasma nozzle was consistently
wAr = 4 m
3/hour (67 L/min). Depending on the selected working conditions, nitrogen gas (N
2) at a flow rate of
wN = 1.5 L/min or oxygen (O
2) at a flow rate of
wO = 1 L/min was added to the argon. The power supplied from the RF harmonic signal generator
f = 13.56 MHz to the plasma nozzle ranged for individual surface treatments approximately around
Pout = 500 W (slight reflected power up to
Prefl = 10 W). The mouth of the plasma nozzle was
d = 10 mm above the surface of the samples. The samples were placed on a mica composite plate, which moved on a conveyor belt at a speed of
v = 22 mm/s during two passes under the active part of the plasma of the plasma nozzle. Plasma exposure was performed on only one side of the testing samples. The samples were untreated from the factory and they were not purely planar, but slightly wavy. The discharge can sometimes reach under the samples, likely creating inhomogeneities in the surface treatments when the samples are treated on both sides, as was found in previous experiments [
14]. Diagnostics of plasma discharge properties, setting of its parameters and interaction with material samples were previously published [
6,
24,
25]. In the publication [
24], the behavior of the discharge was described in detail with recordings by a fast camera at the exit of the slit plasma nozzle and on the surface of the material for argon plasma and admixtures of N
2 and O
2 in the argon plasma. The experiment demonstrated the channel character of the discharge, with individual channels oscillating and moving rapidly along the slot of the plasma nozzle mouth. This allows for the creation of very good surface finish homogeneity on the surface of the material. In the publication [
25], the behavior of the discharge during interaction with sample edges of different heights (5–30 mm) is presented and the influence of edges on the surface finish homogeneity in their vicinity is determined. Publication [
6] contributes to the issue of the efficiency of surface treatment of a slot plasma nozzle on a thermoplastic (polypropylene) including the assumed reaction processes and diagnostics of the material surface (XPS method). Publication [
6] also presents in detail the optical emission spectroscopy of the discharge and includes typical optical emission spectra emitted by the plasma (for pure argon and argon with an admixture of N
2). Other related parameters of the discharge setting and its behavior are available, for example, in works [
26,
27].
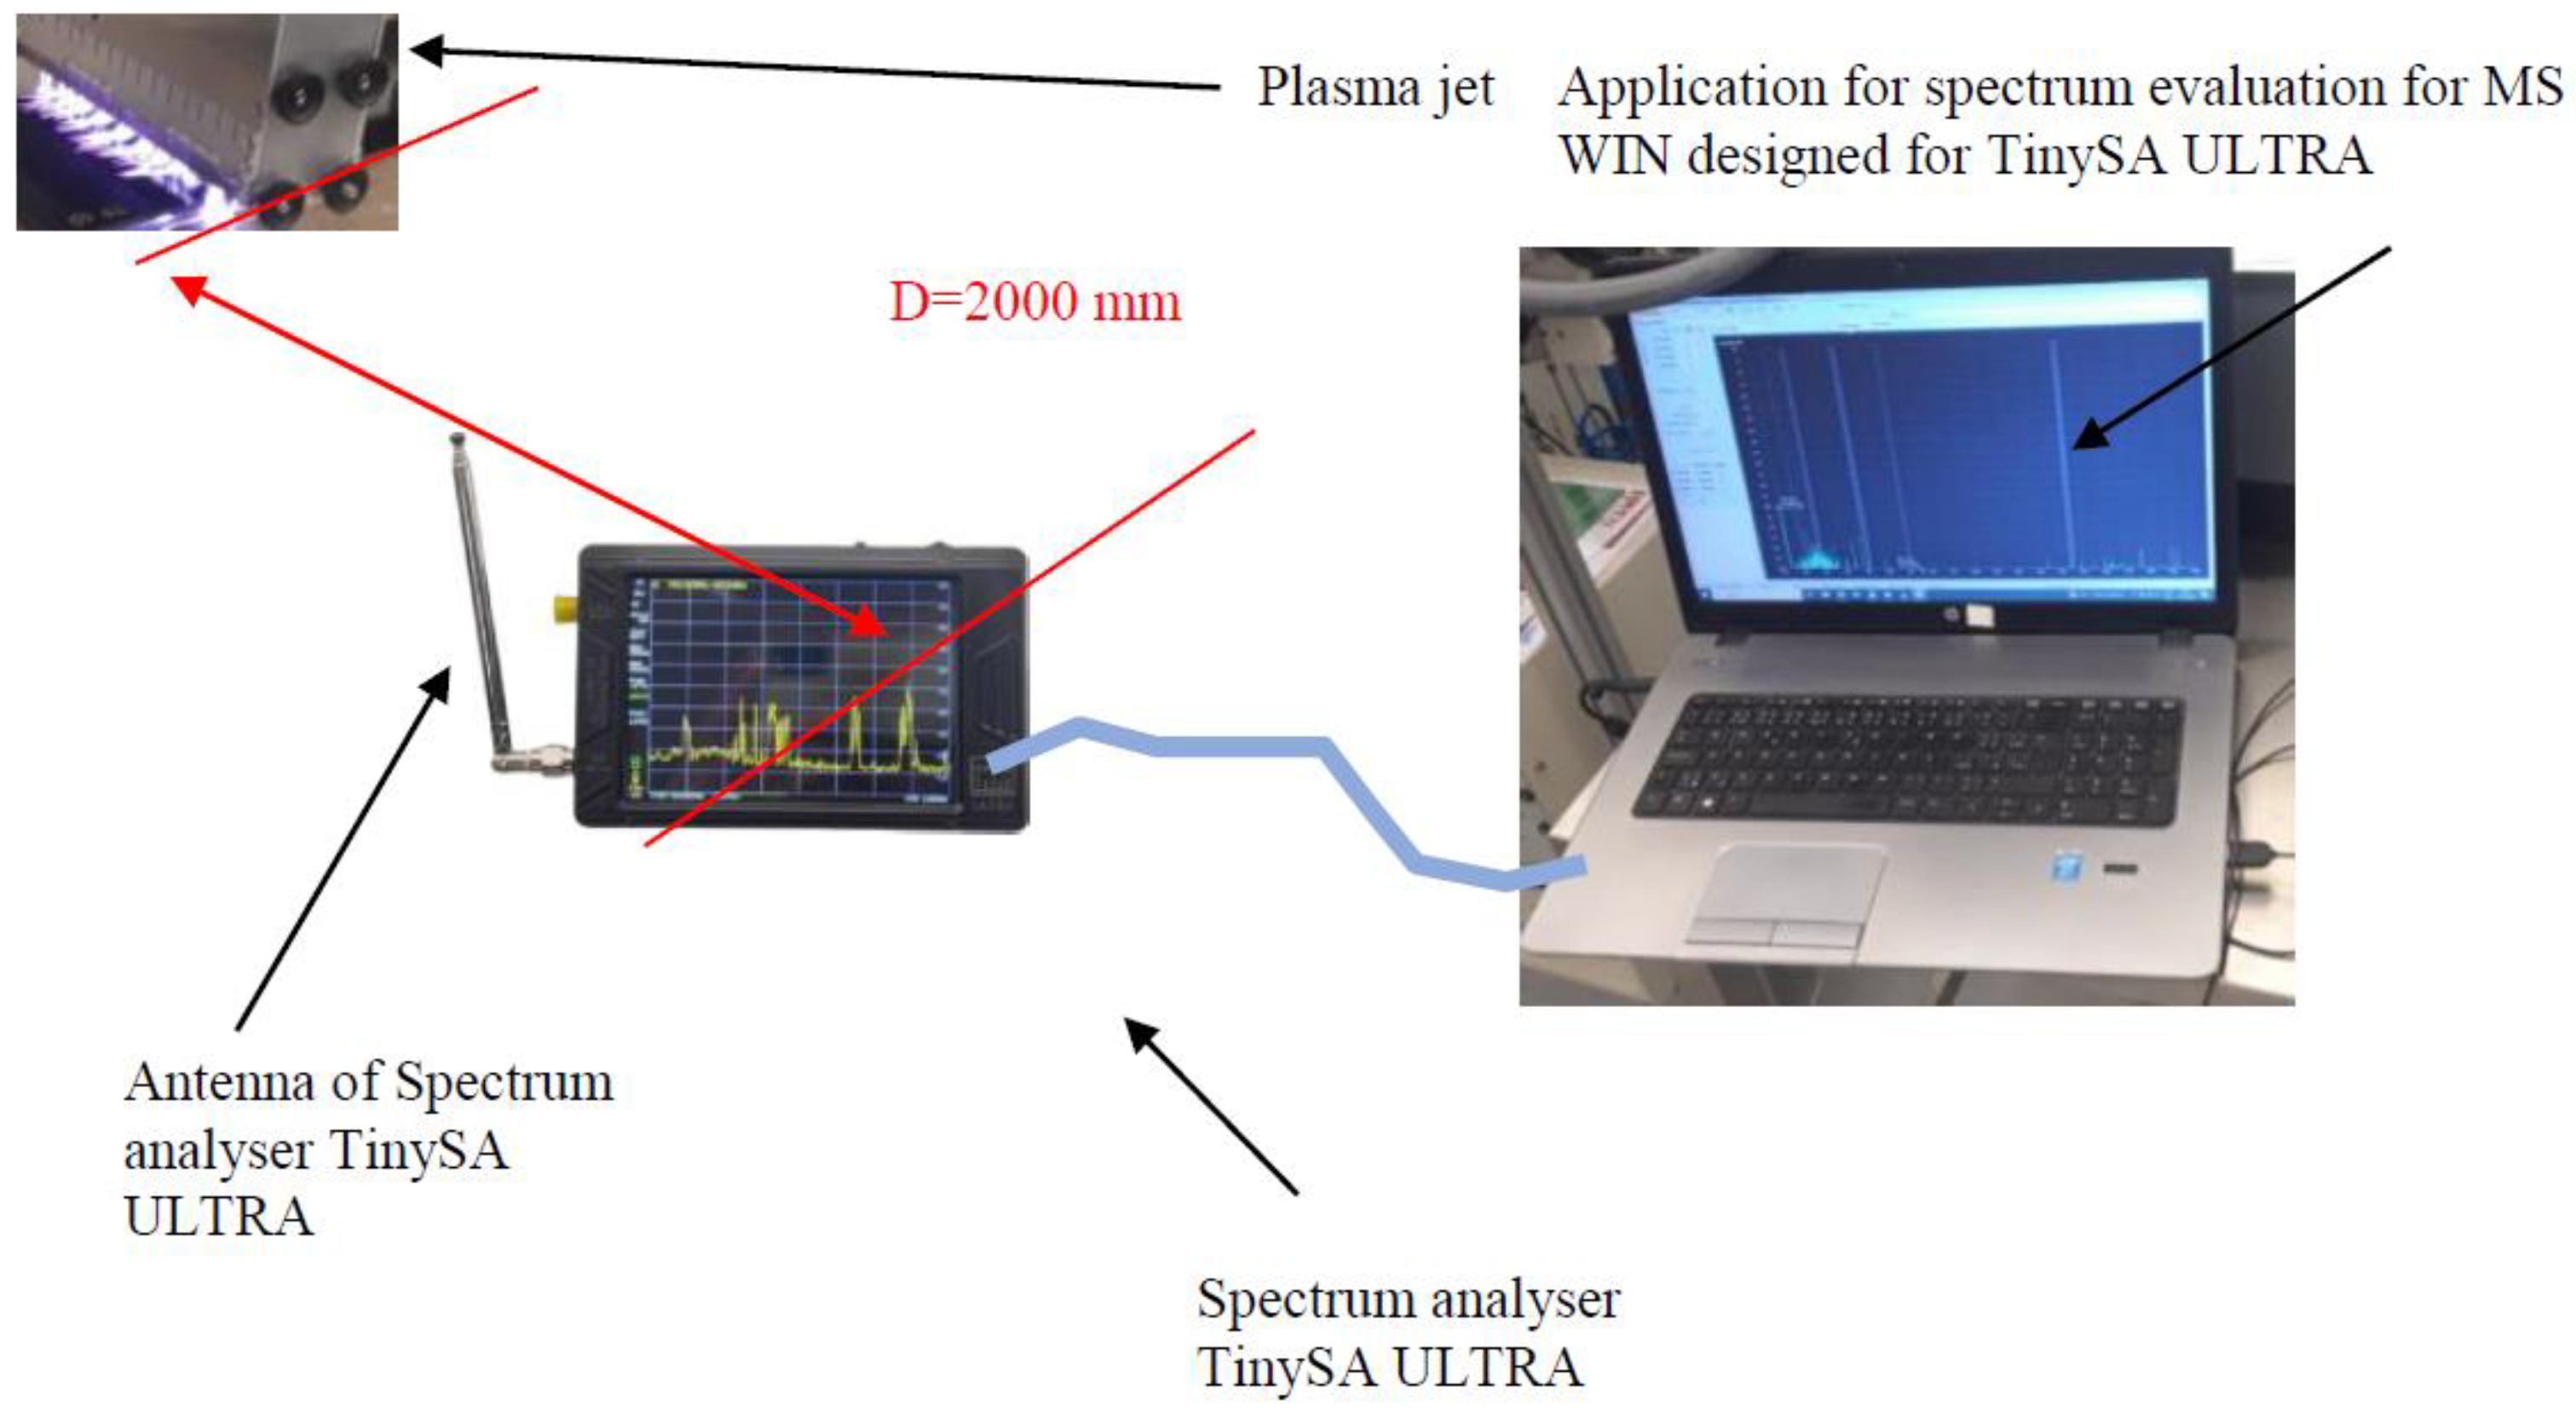
For the radio-frequency detection of the plasma spectrum, the spectrum analyzer TinySA ULTRA 100 KHZ–5.3 GHz (SA) and a spectrum evaluation application for MS WIN designed for tinyULTRA were used and a fiber rod antenna of length
la = 500 mm was placed at a distance
D = 2000 mm from the mouth of the plasma nozzle. The antenna factor was included in the SA setting, as shown in
Figure 2 and
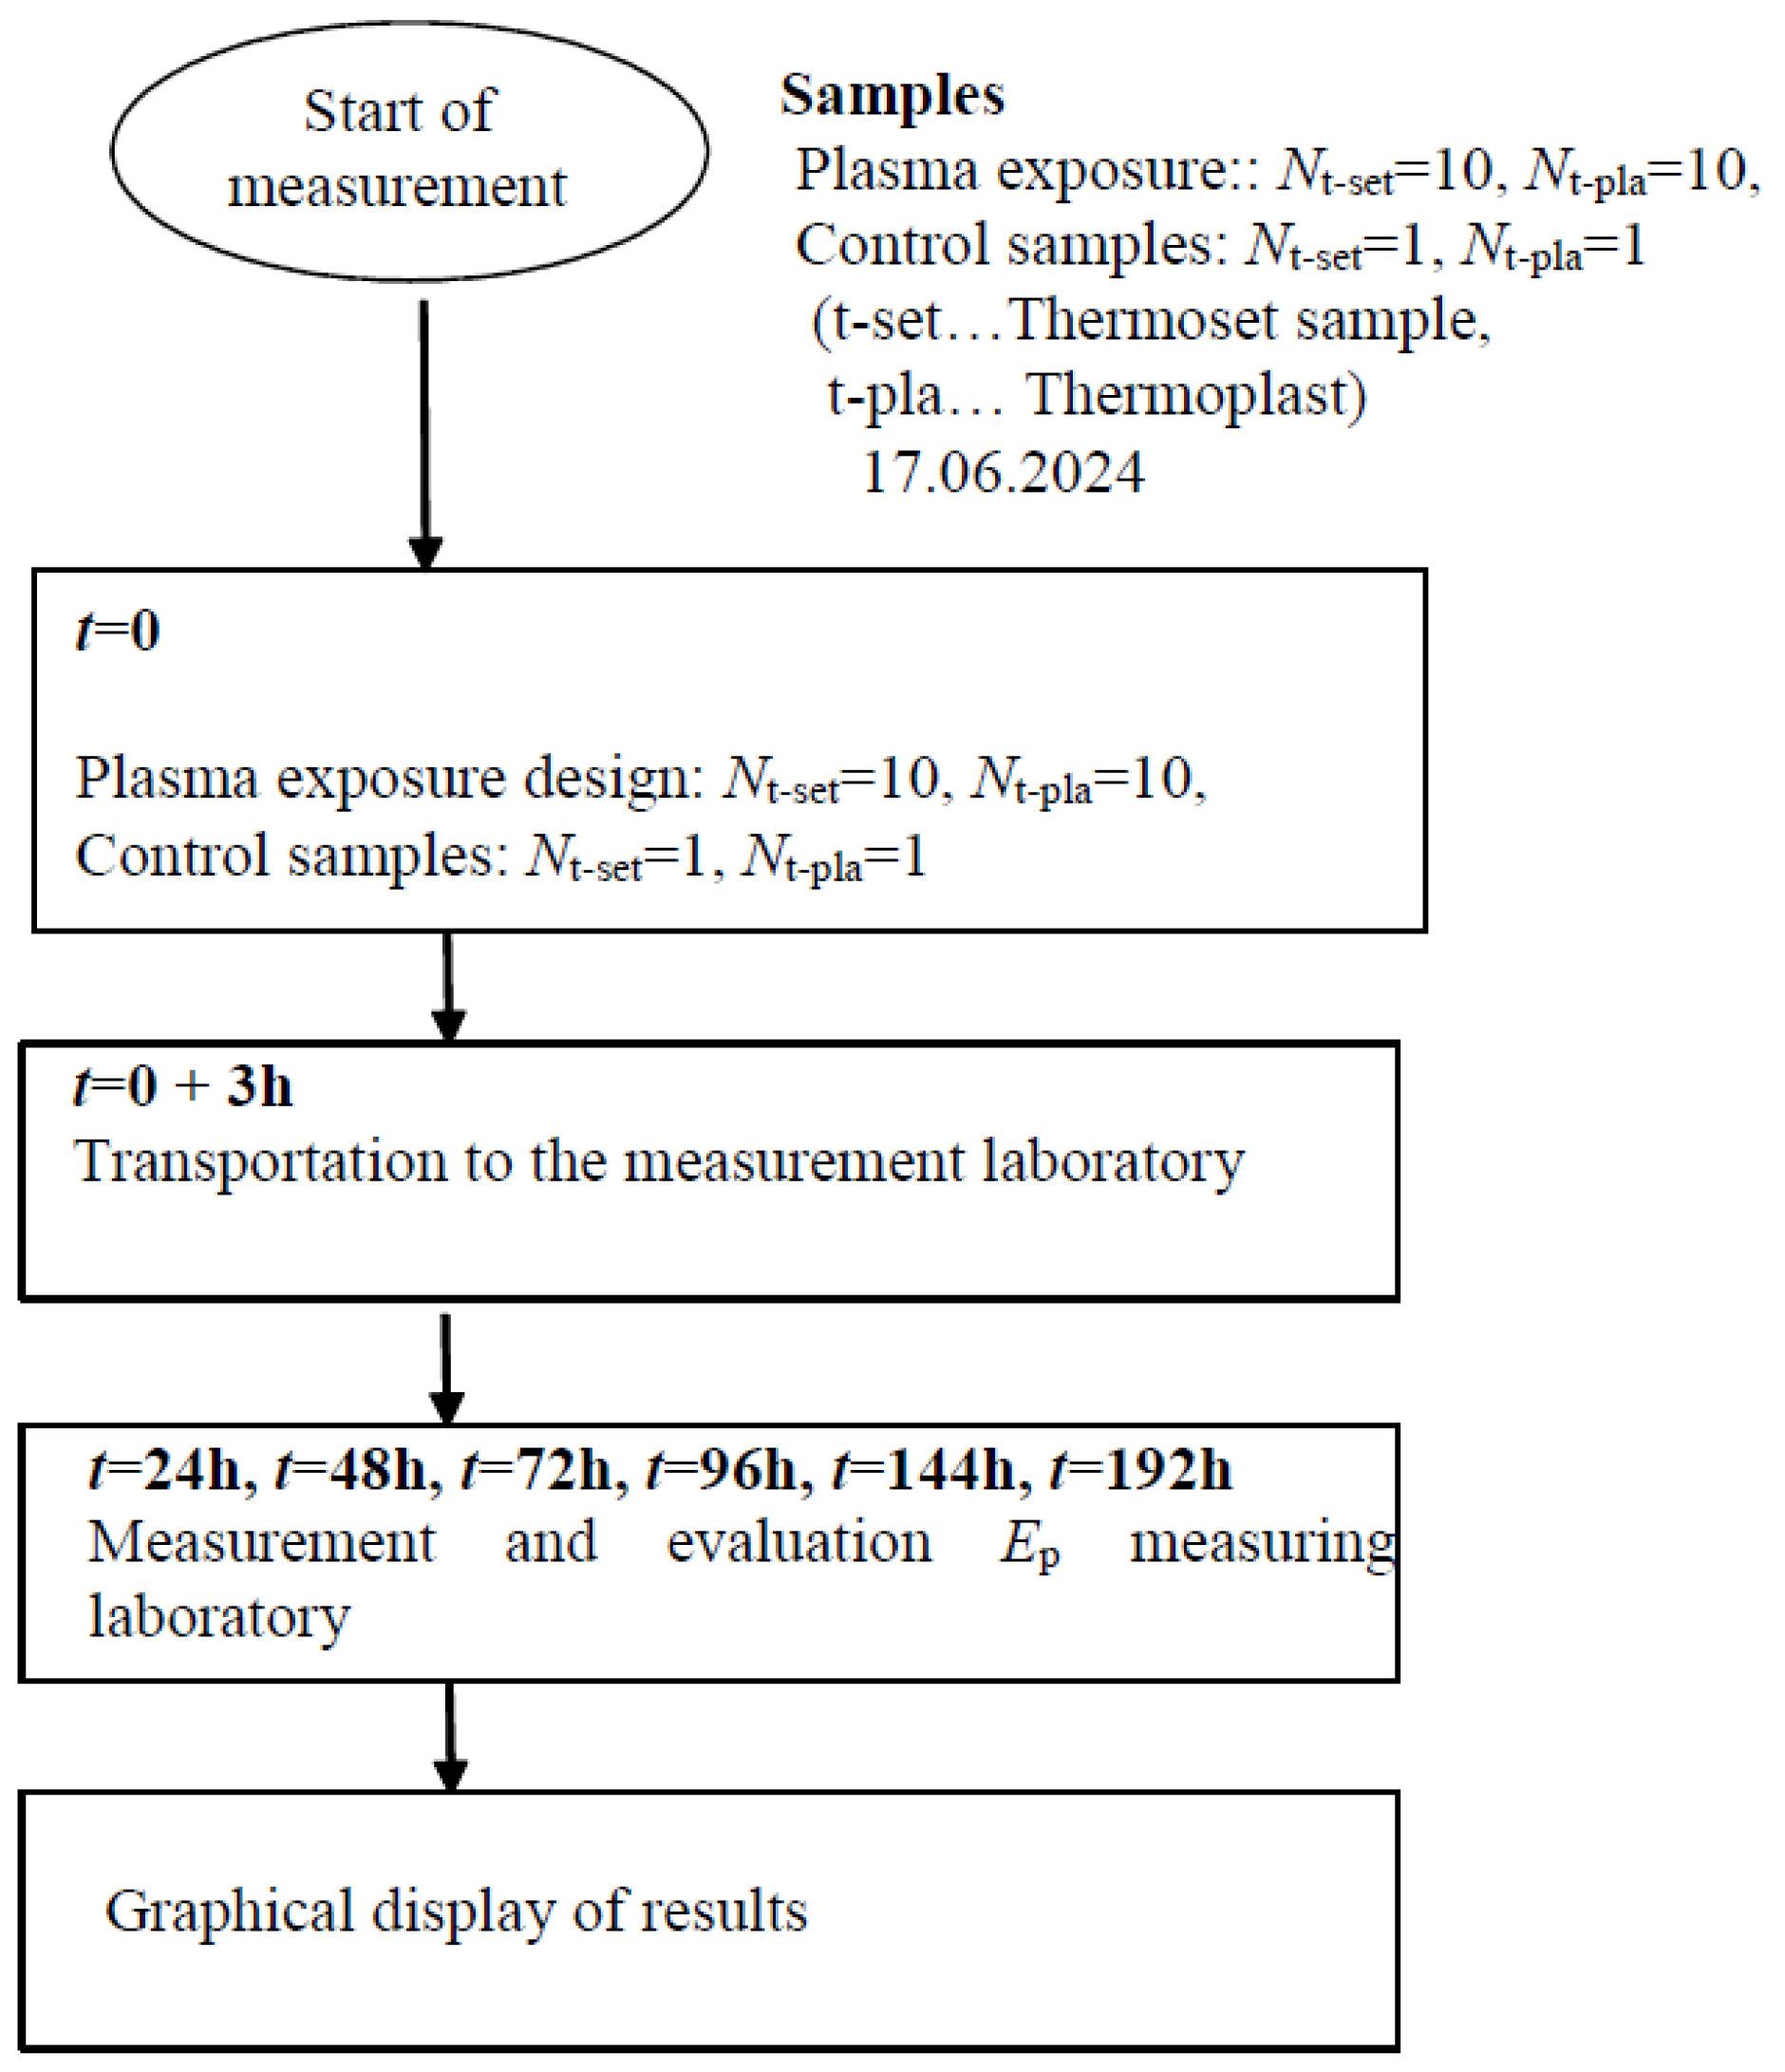
Figure 4. The methodology for exposing samples and measuring them at time intervals was adapted for the set measurement conditions (similar to work [
14]), as shown in
Figure 5.
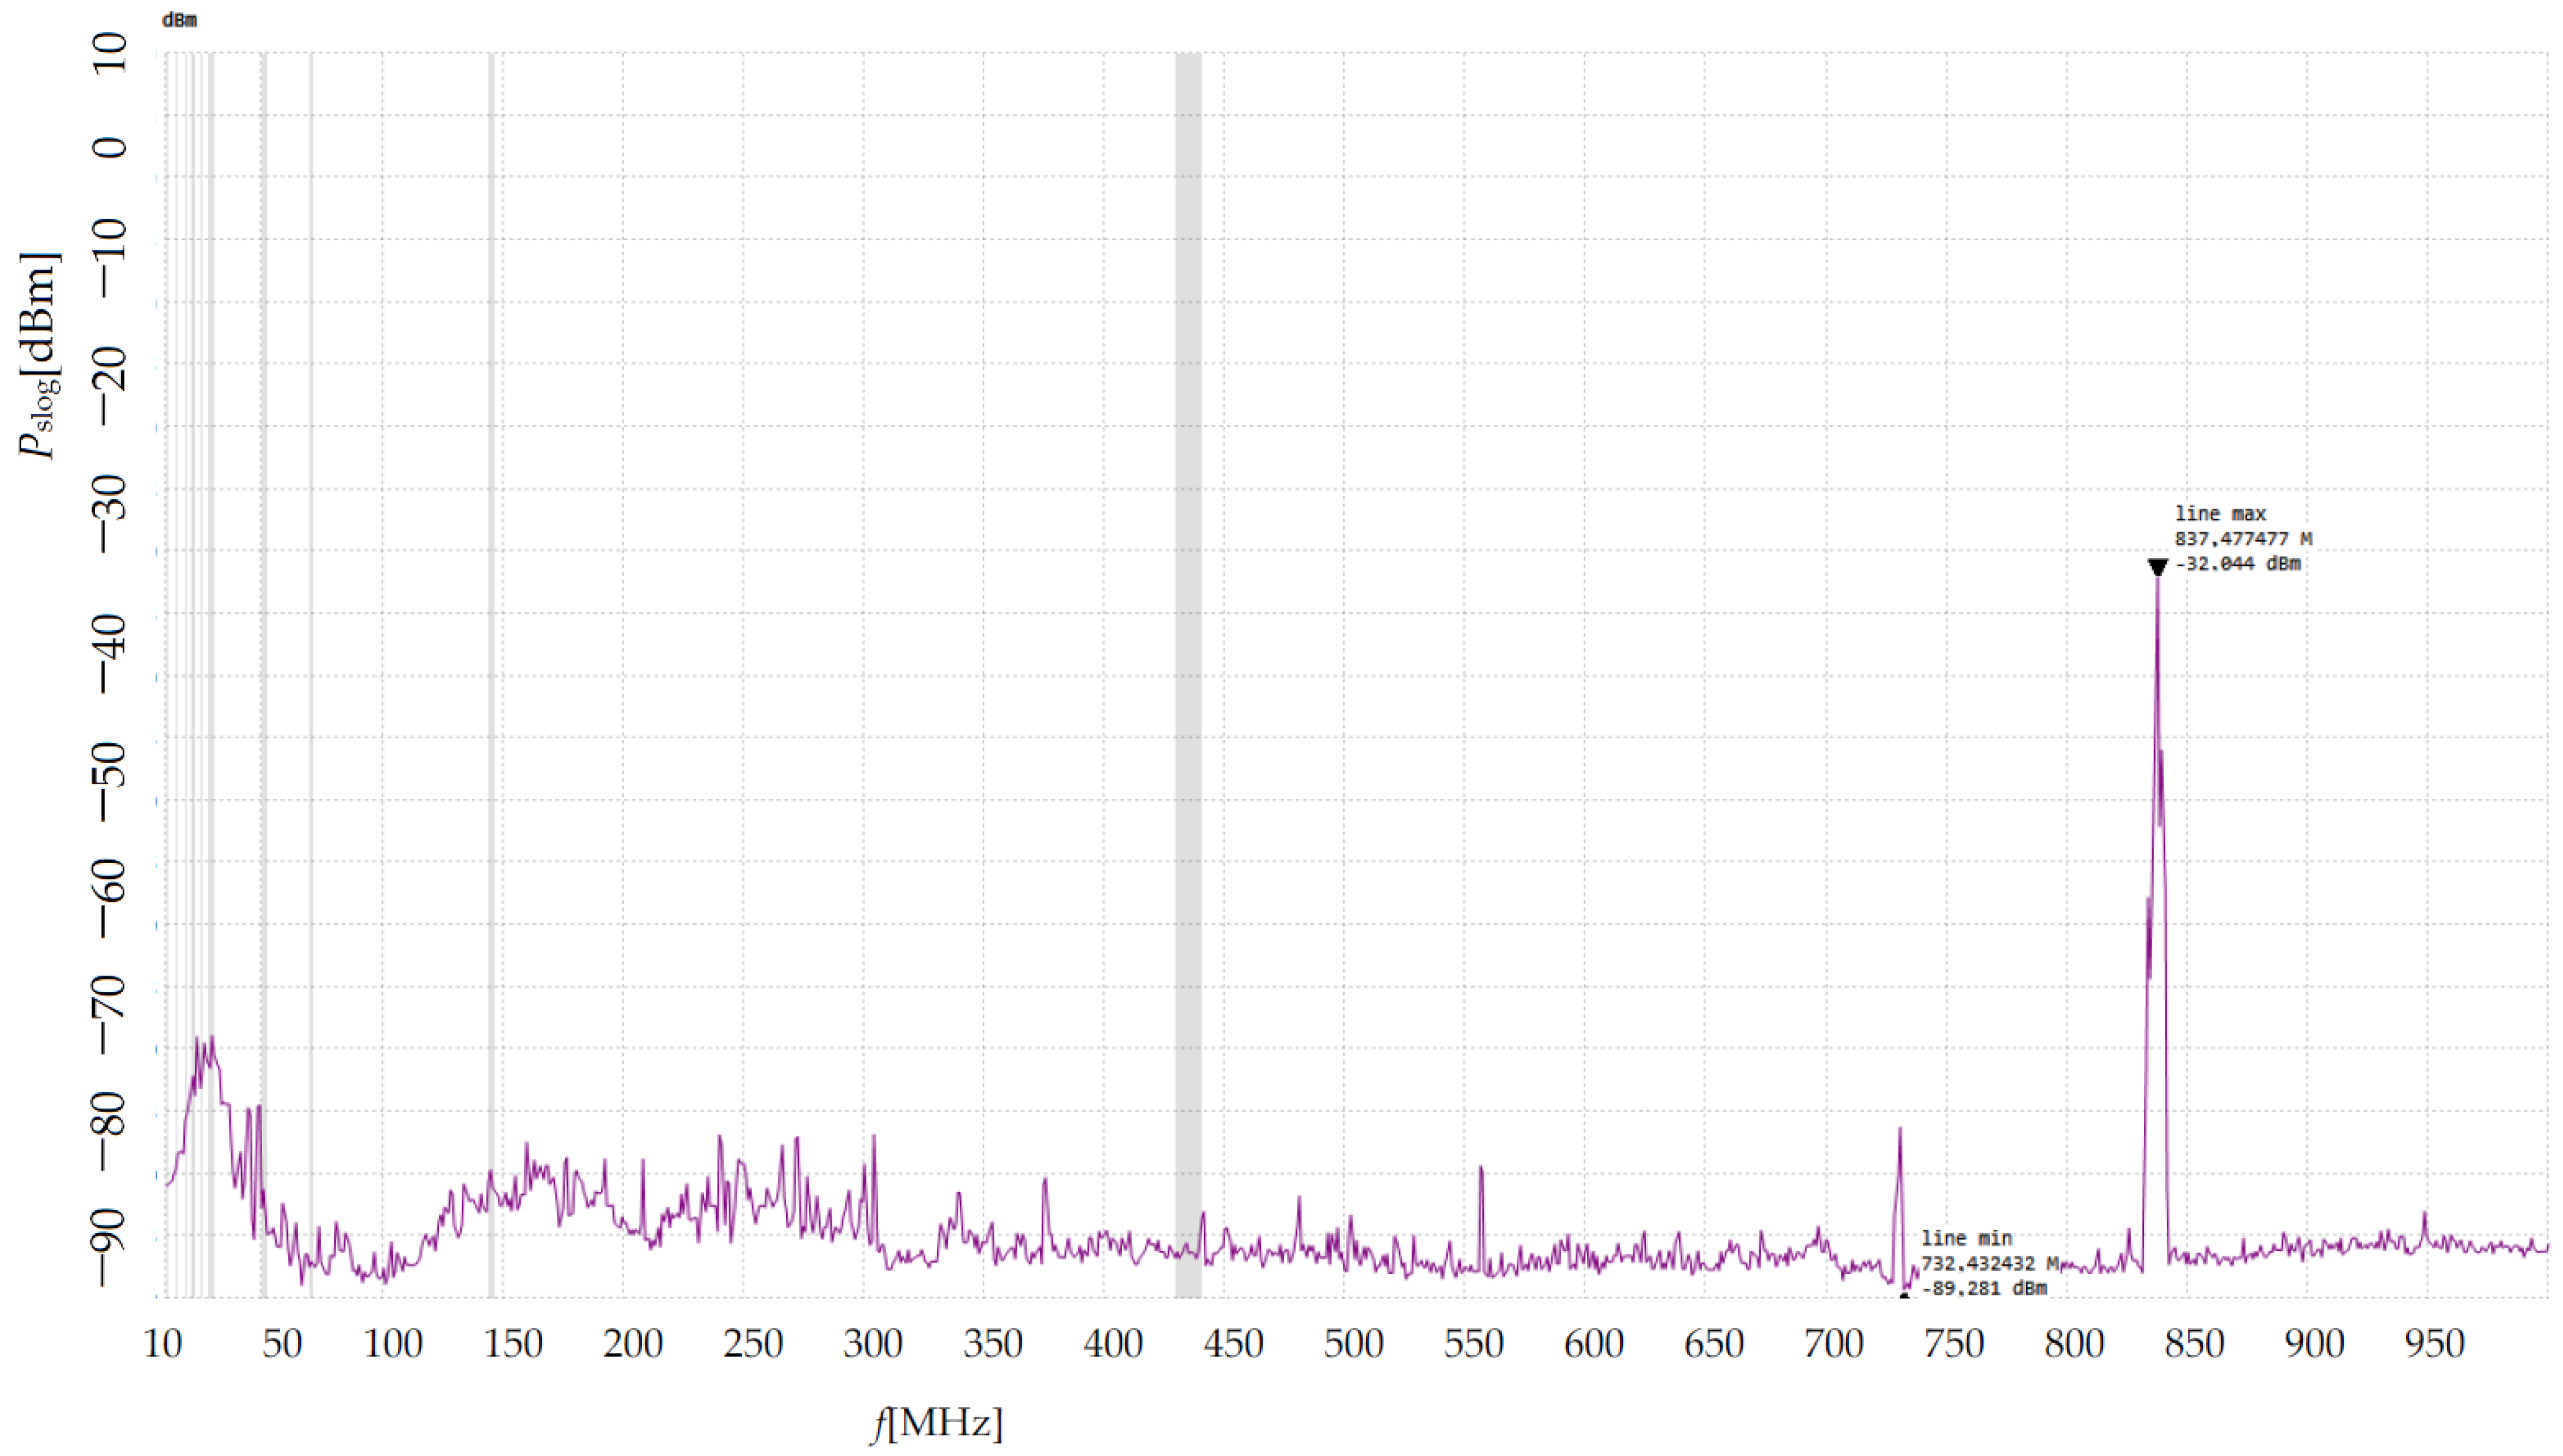
The experiment was carried out in laboratories with plasma apparatus at CEITEC BUT in Brno. A plasma slit nozzle was used under the conditions described above. At the beginning, the spectral background was measured in the laboratory without switching on the RF generator or other operating equipment. The obtained spectrum of power
Ps[dBm] is shown in
Figure 6, in the frequency range
f = 10 MHz to 1000 MHz, which was measured in the range
Pslog = 0 to −140 dBm, and then evaluated for the range
Pslog = 0 to −90 dBm.
From the perspective of fundamental research, the spectrum with power range Pslog = −90 to −140 dBm is also interesting and valuable. The interpretation of this spectrum can reveal the statistical occurrence of typical electric charge carriers in the interaction of a typical plasma discharge setup with the treated sample surface. The size and chemical composition of specific electric charge carriers can be evaluated from the known speed of their movement of the mean velocity v.
For our records in the present study, which is directed towards the subsequent industrial use of the described methodology, these records are interesting, but not producible and industrially usable. More important is the record of power Pslog = 0 to −90 dBm. Here, statistically significant and stable interactions of the plasma with a defined exposed surface are captured. By recording this spectrum for all elements of mass-produced products and subsequent tests, the possible properties can be evaluated in HV voltage tests, remote lifetime tests and in the evaluation of function and lifetime when the device is deployed in an applied device. The differences in performance, lifetime of one batch of products and a life-limited piece can then be evaluated. The spectrum is always specific to an identifiable device, with repeated batch production.
The RF spectra were taken continuously during one exposure of the sample for more than N = 15 repeatedly with the cumulation set to evaluate the average power Ps; sk = 64 always cumulated for the given frequency. This cumulation number was chosen for the first tests of the spectral line fitting properties. It was set so that during a few minutes of exposure of the dielectric sample, the composition of the spectrum was not allowed to change and the magnitude of the parameter at a given sequence was not allowed to show changes of more than 5 dBm. Three measurements were made for the first sample and the following parameters were compared. Then, the cumulative calibration was set to the indicated amount.
Figure 6 shows an overview of the spectral background in space with plasma application, where
f = 10 MHz–1000 MHz. The working space is without additional EMG shielding and thus the signal sources are as evident as in a normal urban agglomeration. When applying plasma discharge to insulator samples, the effects of changes in the plasma itself (without impurities) and on the surface of the material are evident. A detailed elucidation of the reasons for the effect would require thorough, in-depth research. The important fact remains that this is a process character, where this phenomenon of changes in the RF spectrum in a specific frequency interval is given by a unique combination of plasma and the treated material. However, this combination is repeatable. The results of the modified spectrum for the individual comparisons in
Figure 7,
Figure 8,
Figure 9,
Figure 10,
Figure 11,
Figure 12 and
Figure 13 correspond to the quantitative evaluation of the surface resistivity presented in the following text.
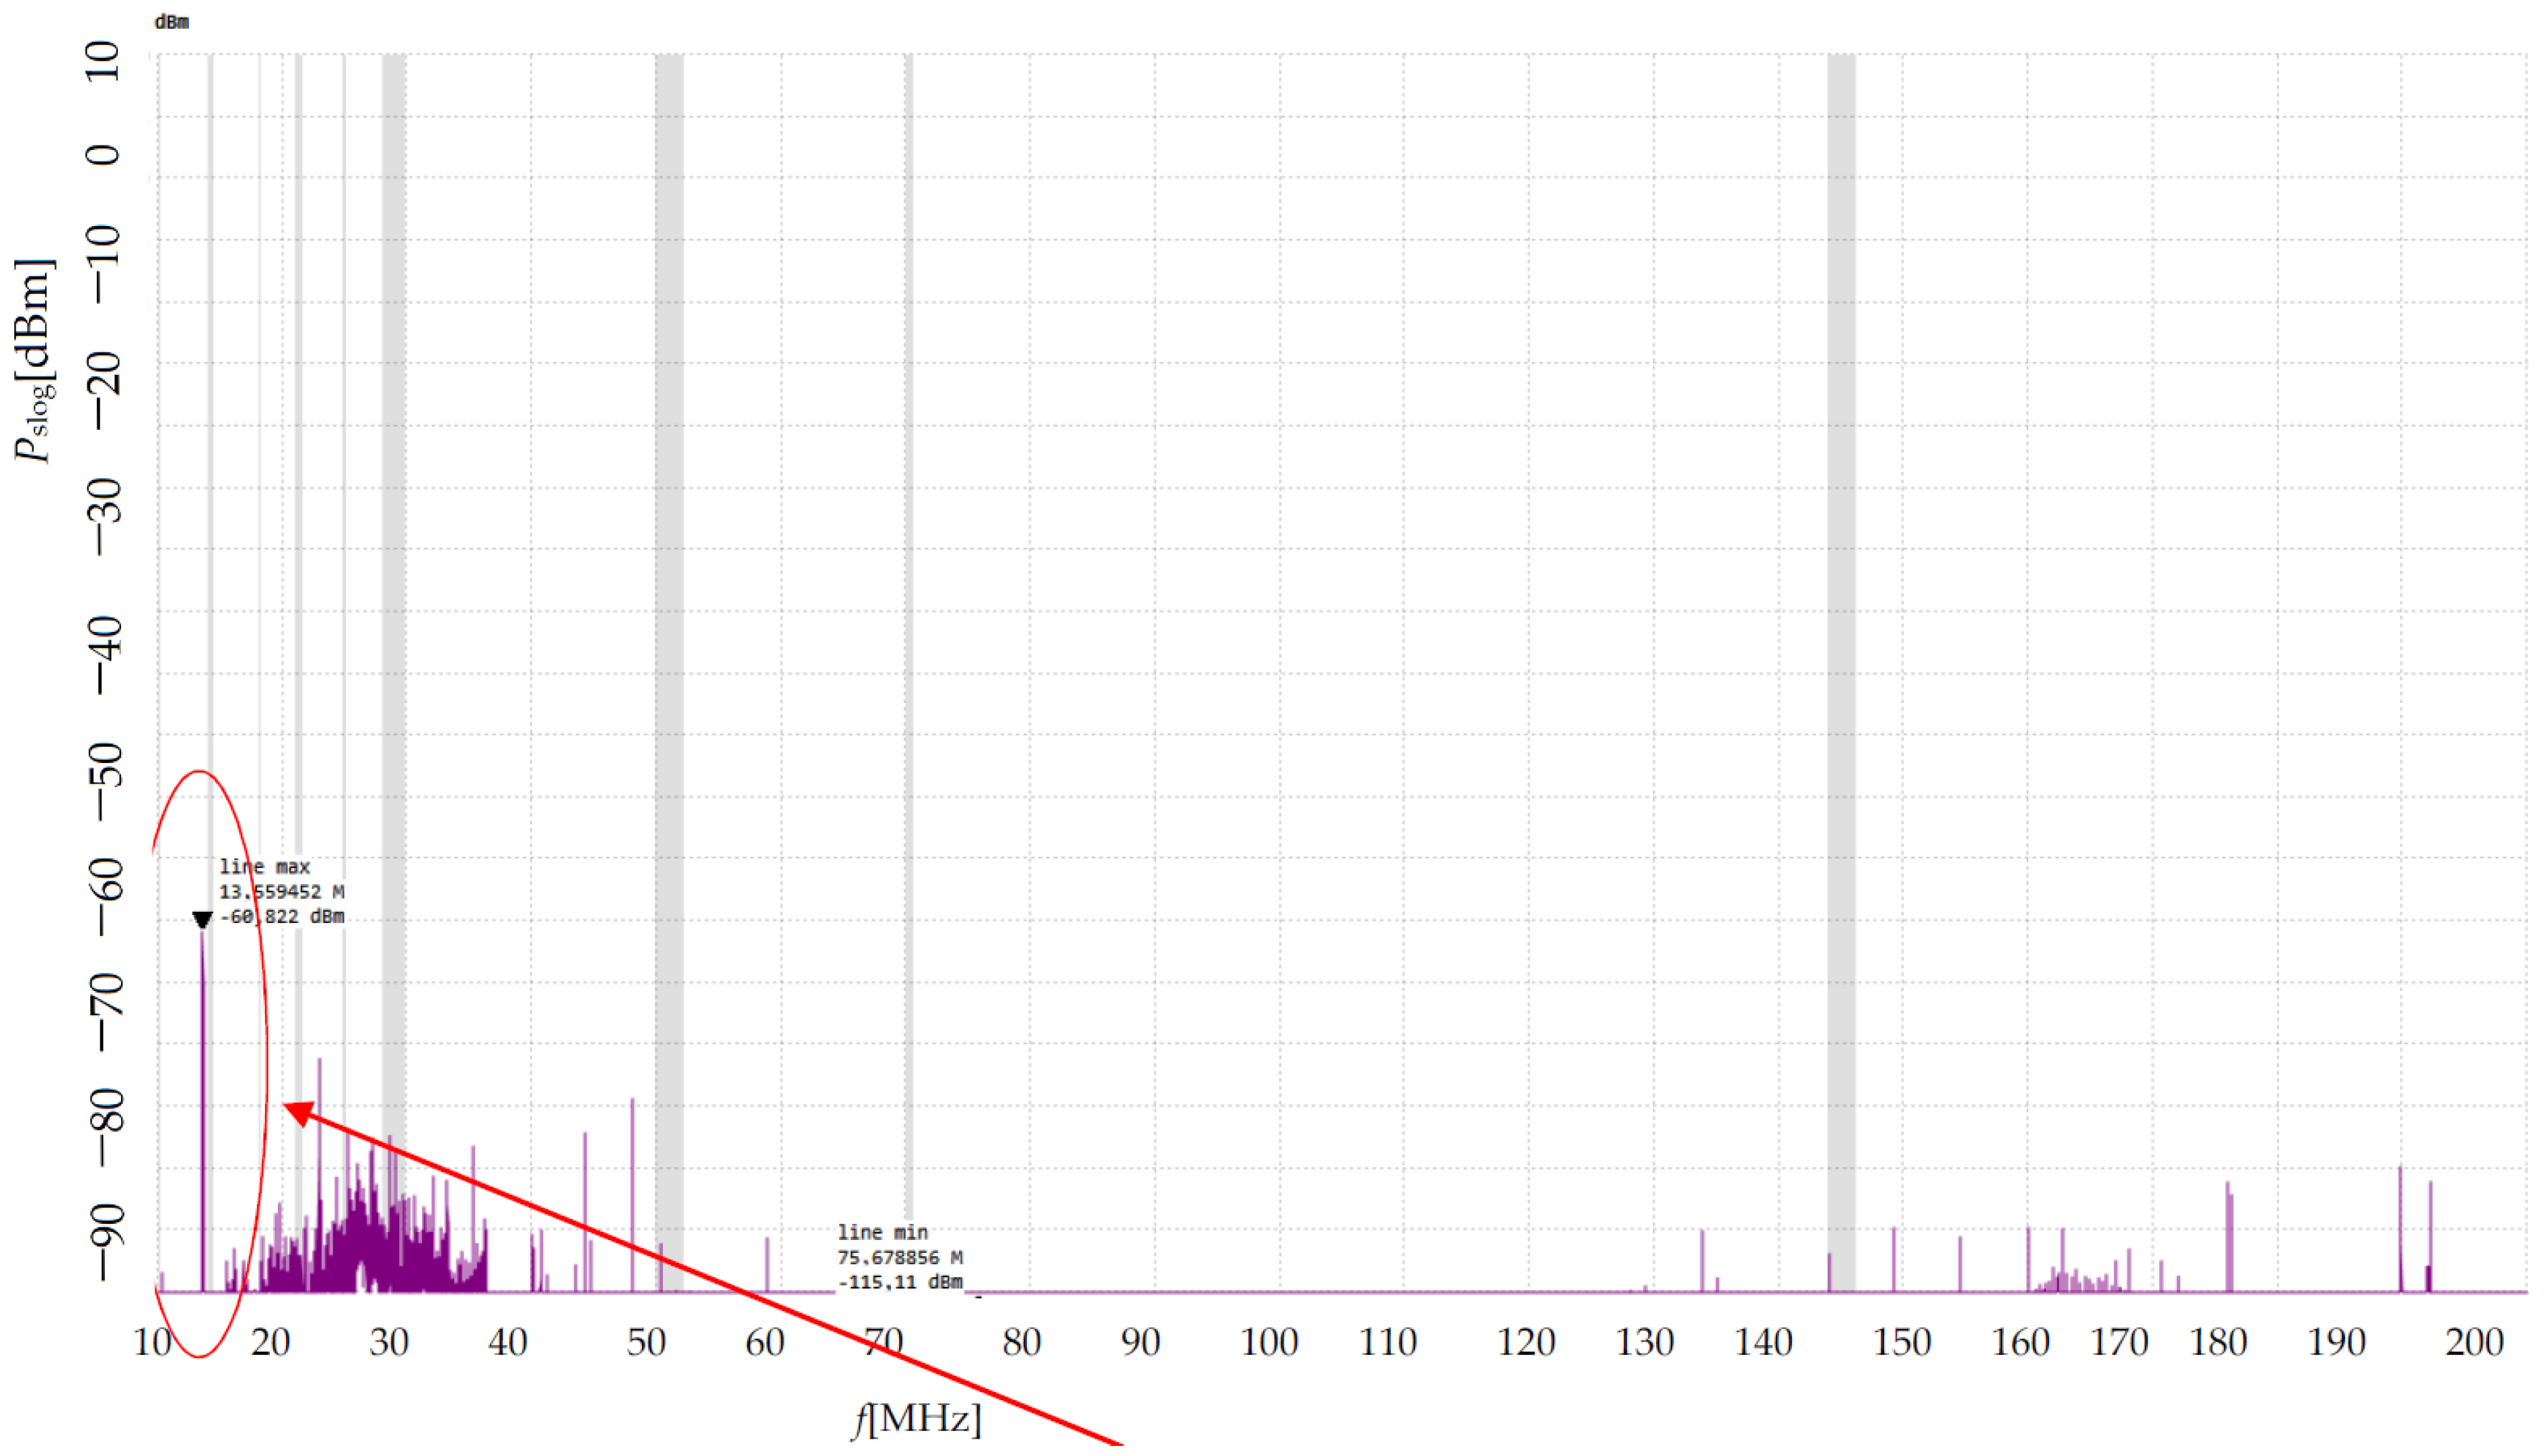
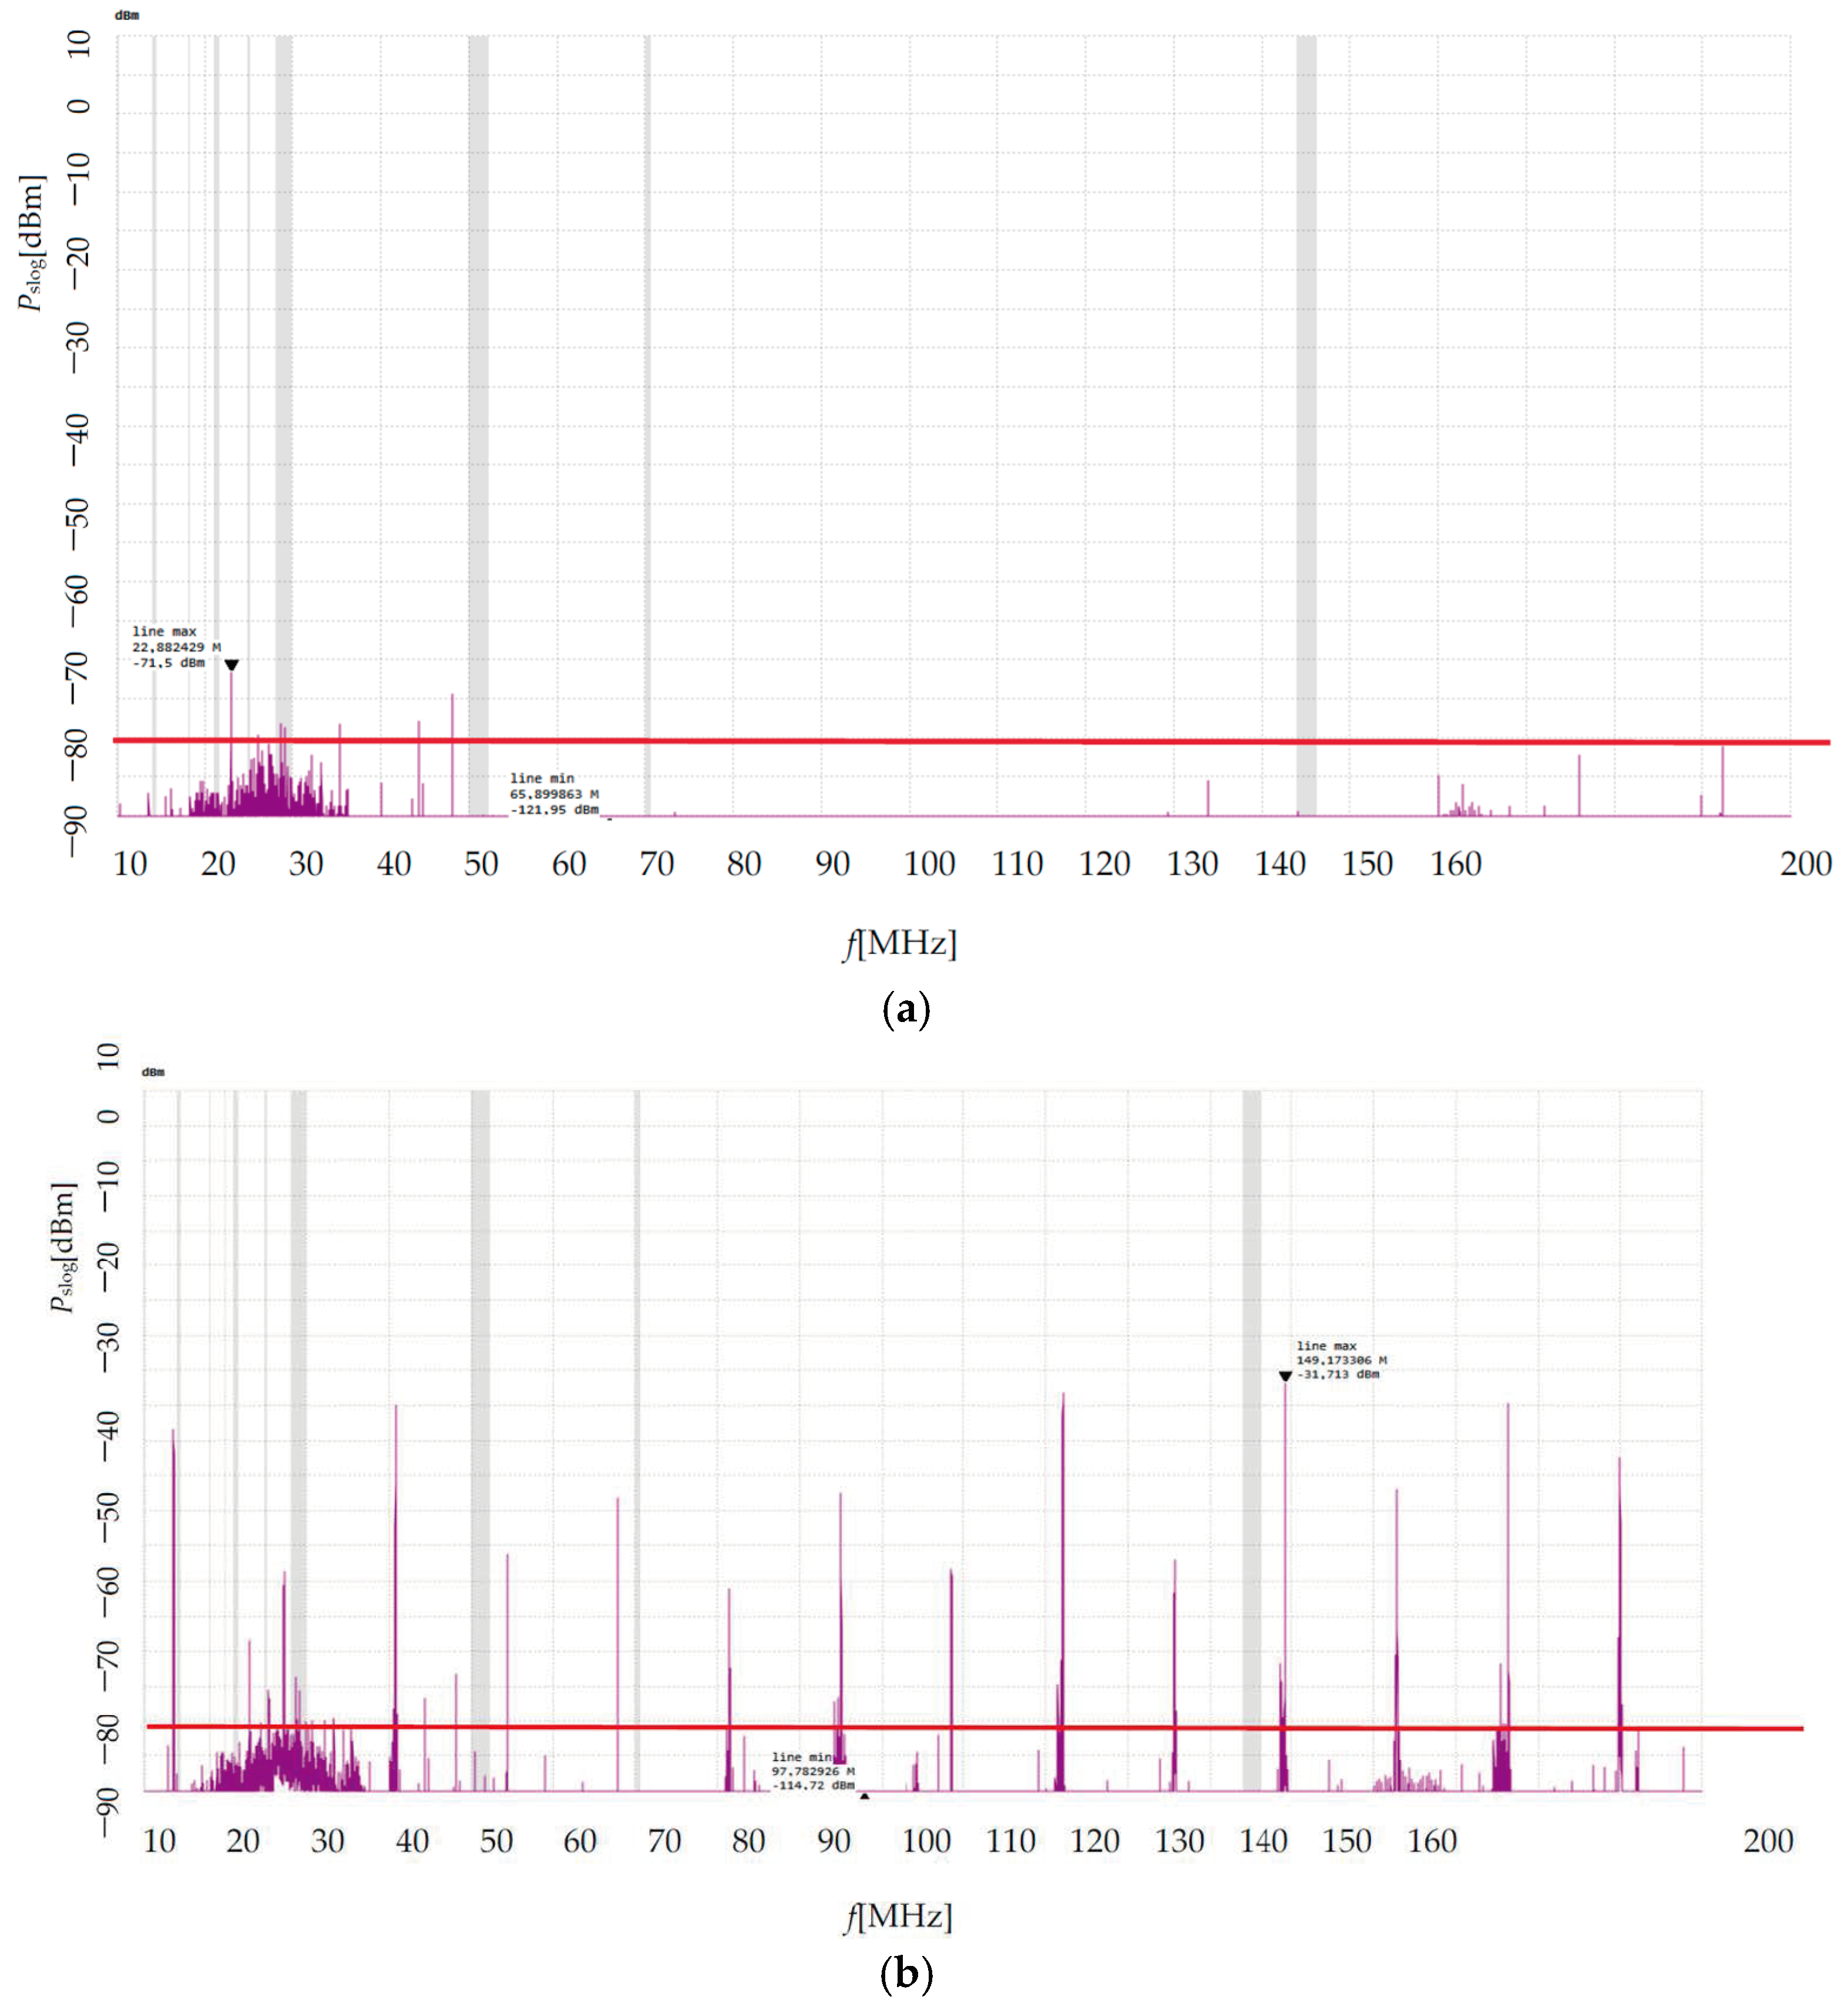
Figure 7 shows the spectral background before sample modification for the frequency band
f = 10 MHz to 200 MHz. It is necessary to respect this background because its shielding for industrial application is quite technically and financially demanding. Therefore, the evaluation was performed by evaluating the spectrum without the sample and with the sample. There is then an evident difference when comparing both records in the effect on the distribution of the power spectrum
Pslog due to the interaction of plasma with the sample. As a result, there will be a change in the reflected/absorbed power (amplitude magnitude)
Pslog, and another effect is a change in the composition of the spectrum—the appearance of new spectral lines for the reasons previously mentioned.
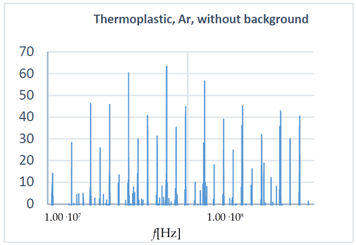
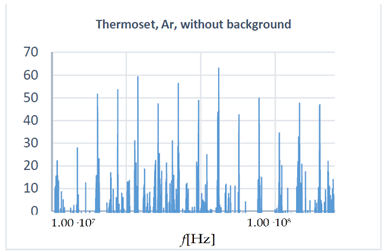
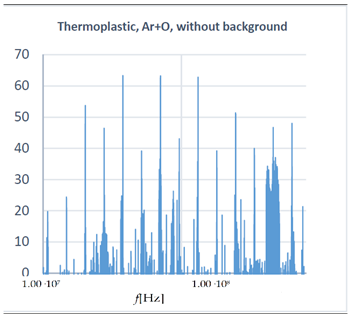
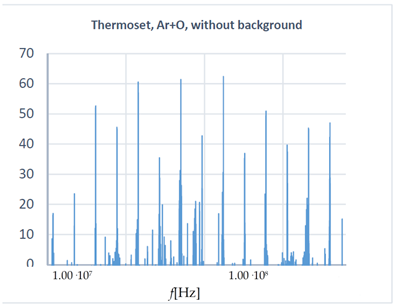
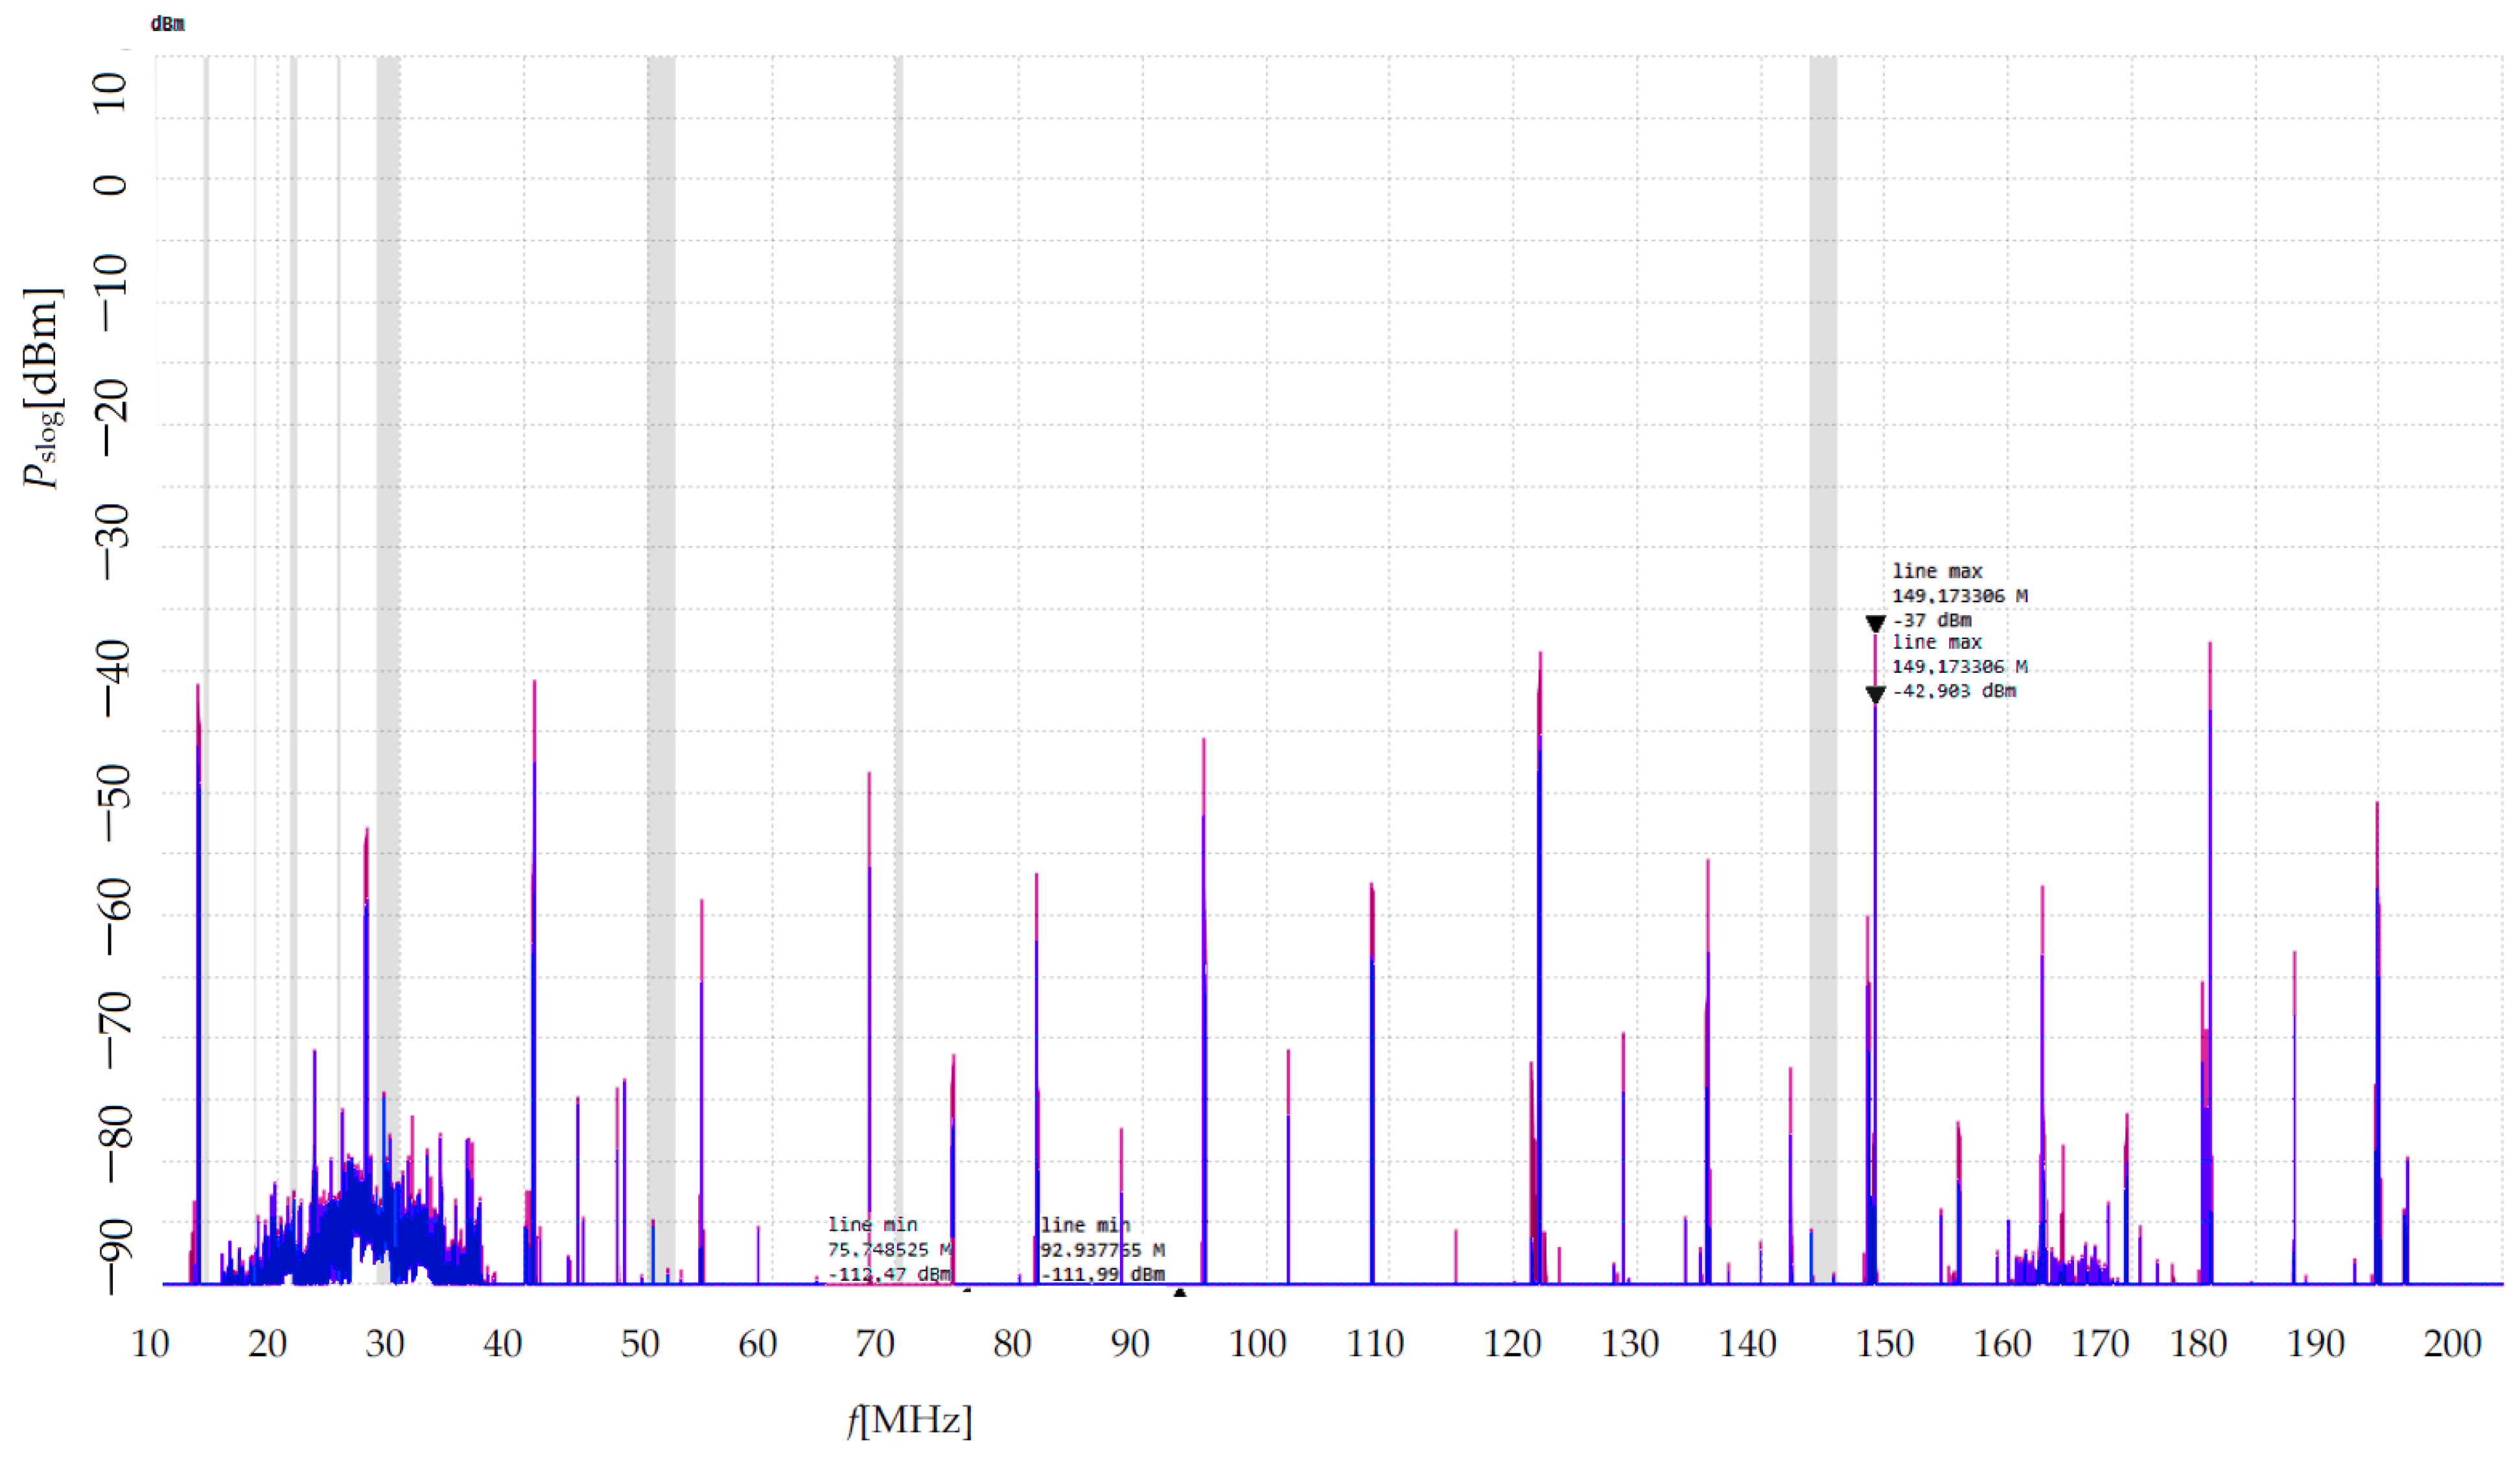
Figure 8 shows that the difference is not significant for plasma with an argon atmosphere and interaction with the thermoplastic sample. Only new lines appeared in the 115 MHz, 165 MHz and 180 MHz region. However, for plasma with an argon atmosphere, significant lines or bands of lines appeared for application to a thermoset sample, as shown in
Figure 9. This is a band increase in Pslog power in the 13.56 MHz, 27 MHz, 43 MHz, 85 MHz, 130 MHz, 180 MHz and 210 MHz region.
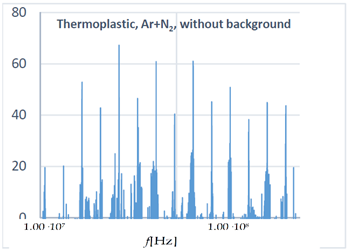
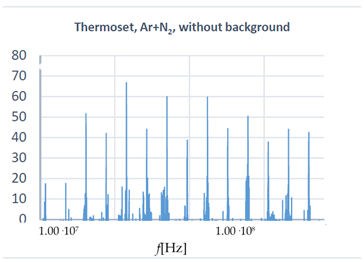
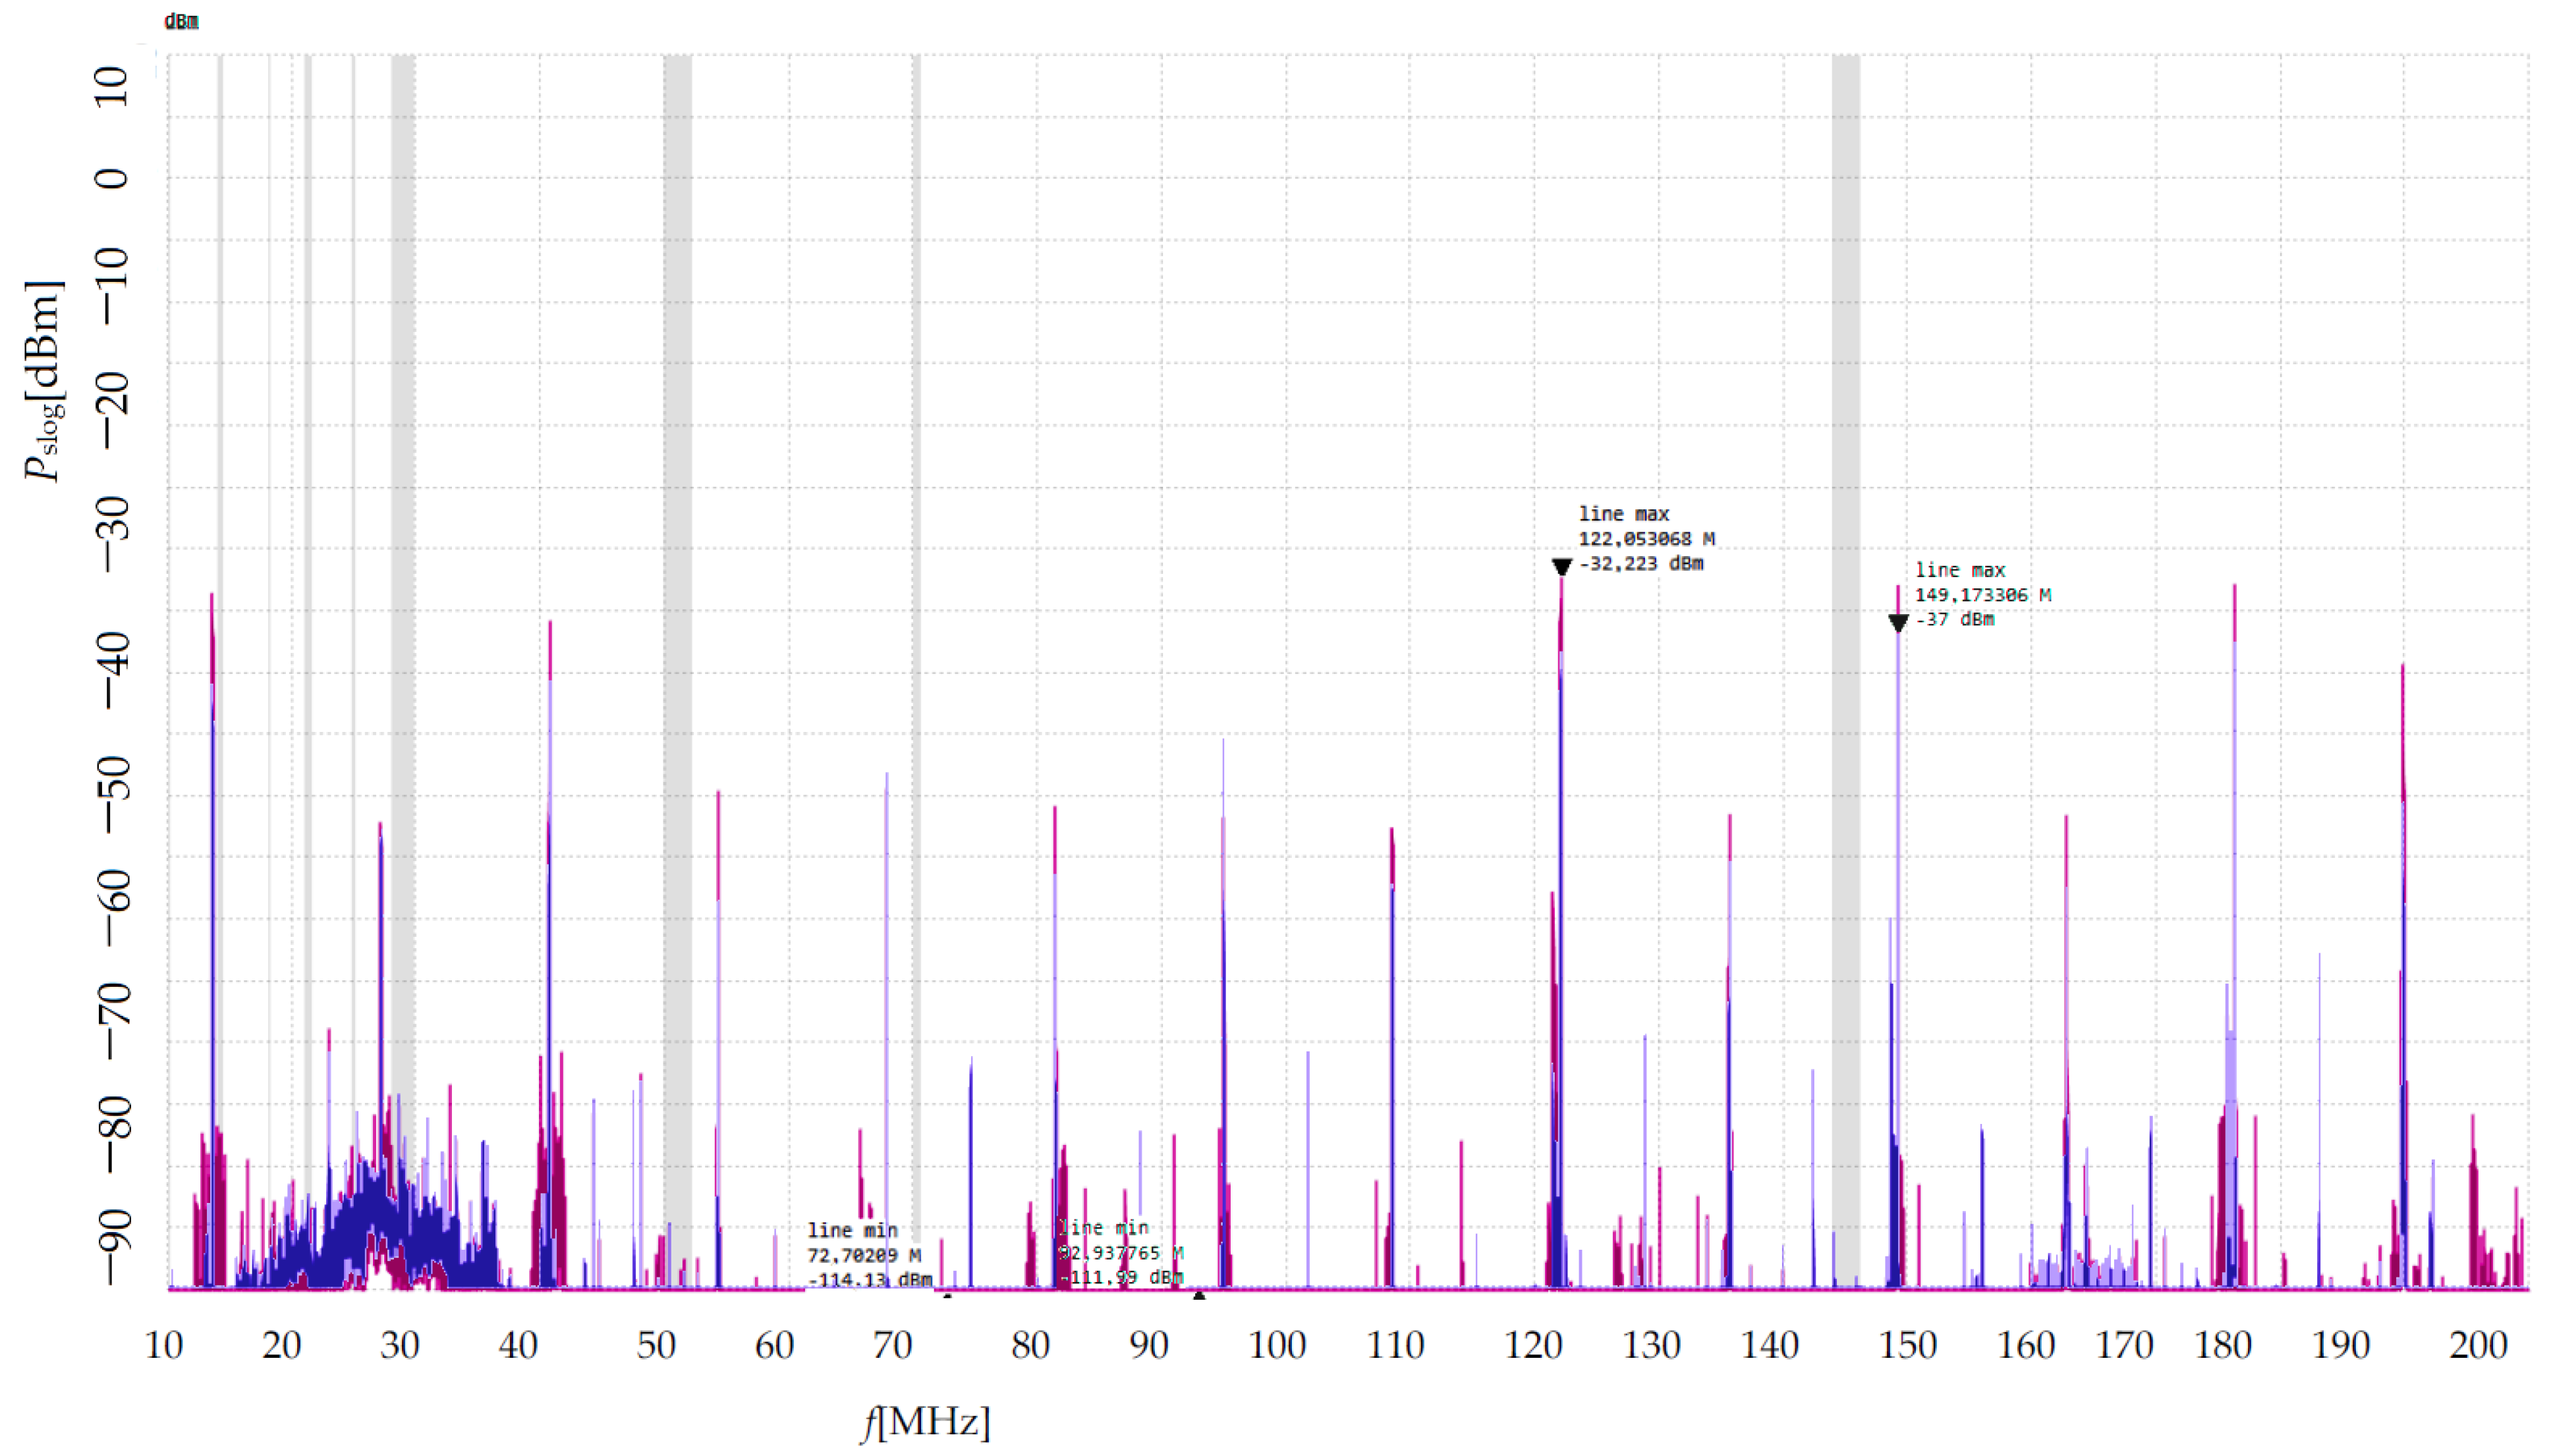
Figure 10 shows a comparison and evaluation of the argon–nitrogen atmosphere plasma applied to a thermoset sample. It is evident that the spectrum is changed only in the 40 MHz, 140 MHz and 150 MHz region, and the lines around 180 MHz frequency. The thermoplastic sample with an argon–nitrogen atmosphere reacted in the range of 13.56 MHz, 42 MHz, 45 MHz, 55 MHz, 85 MHz, 93 MHz, 120 MHz, 140 MHz, 150 MHz, 180 MHz and 190 MHz, as shown in
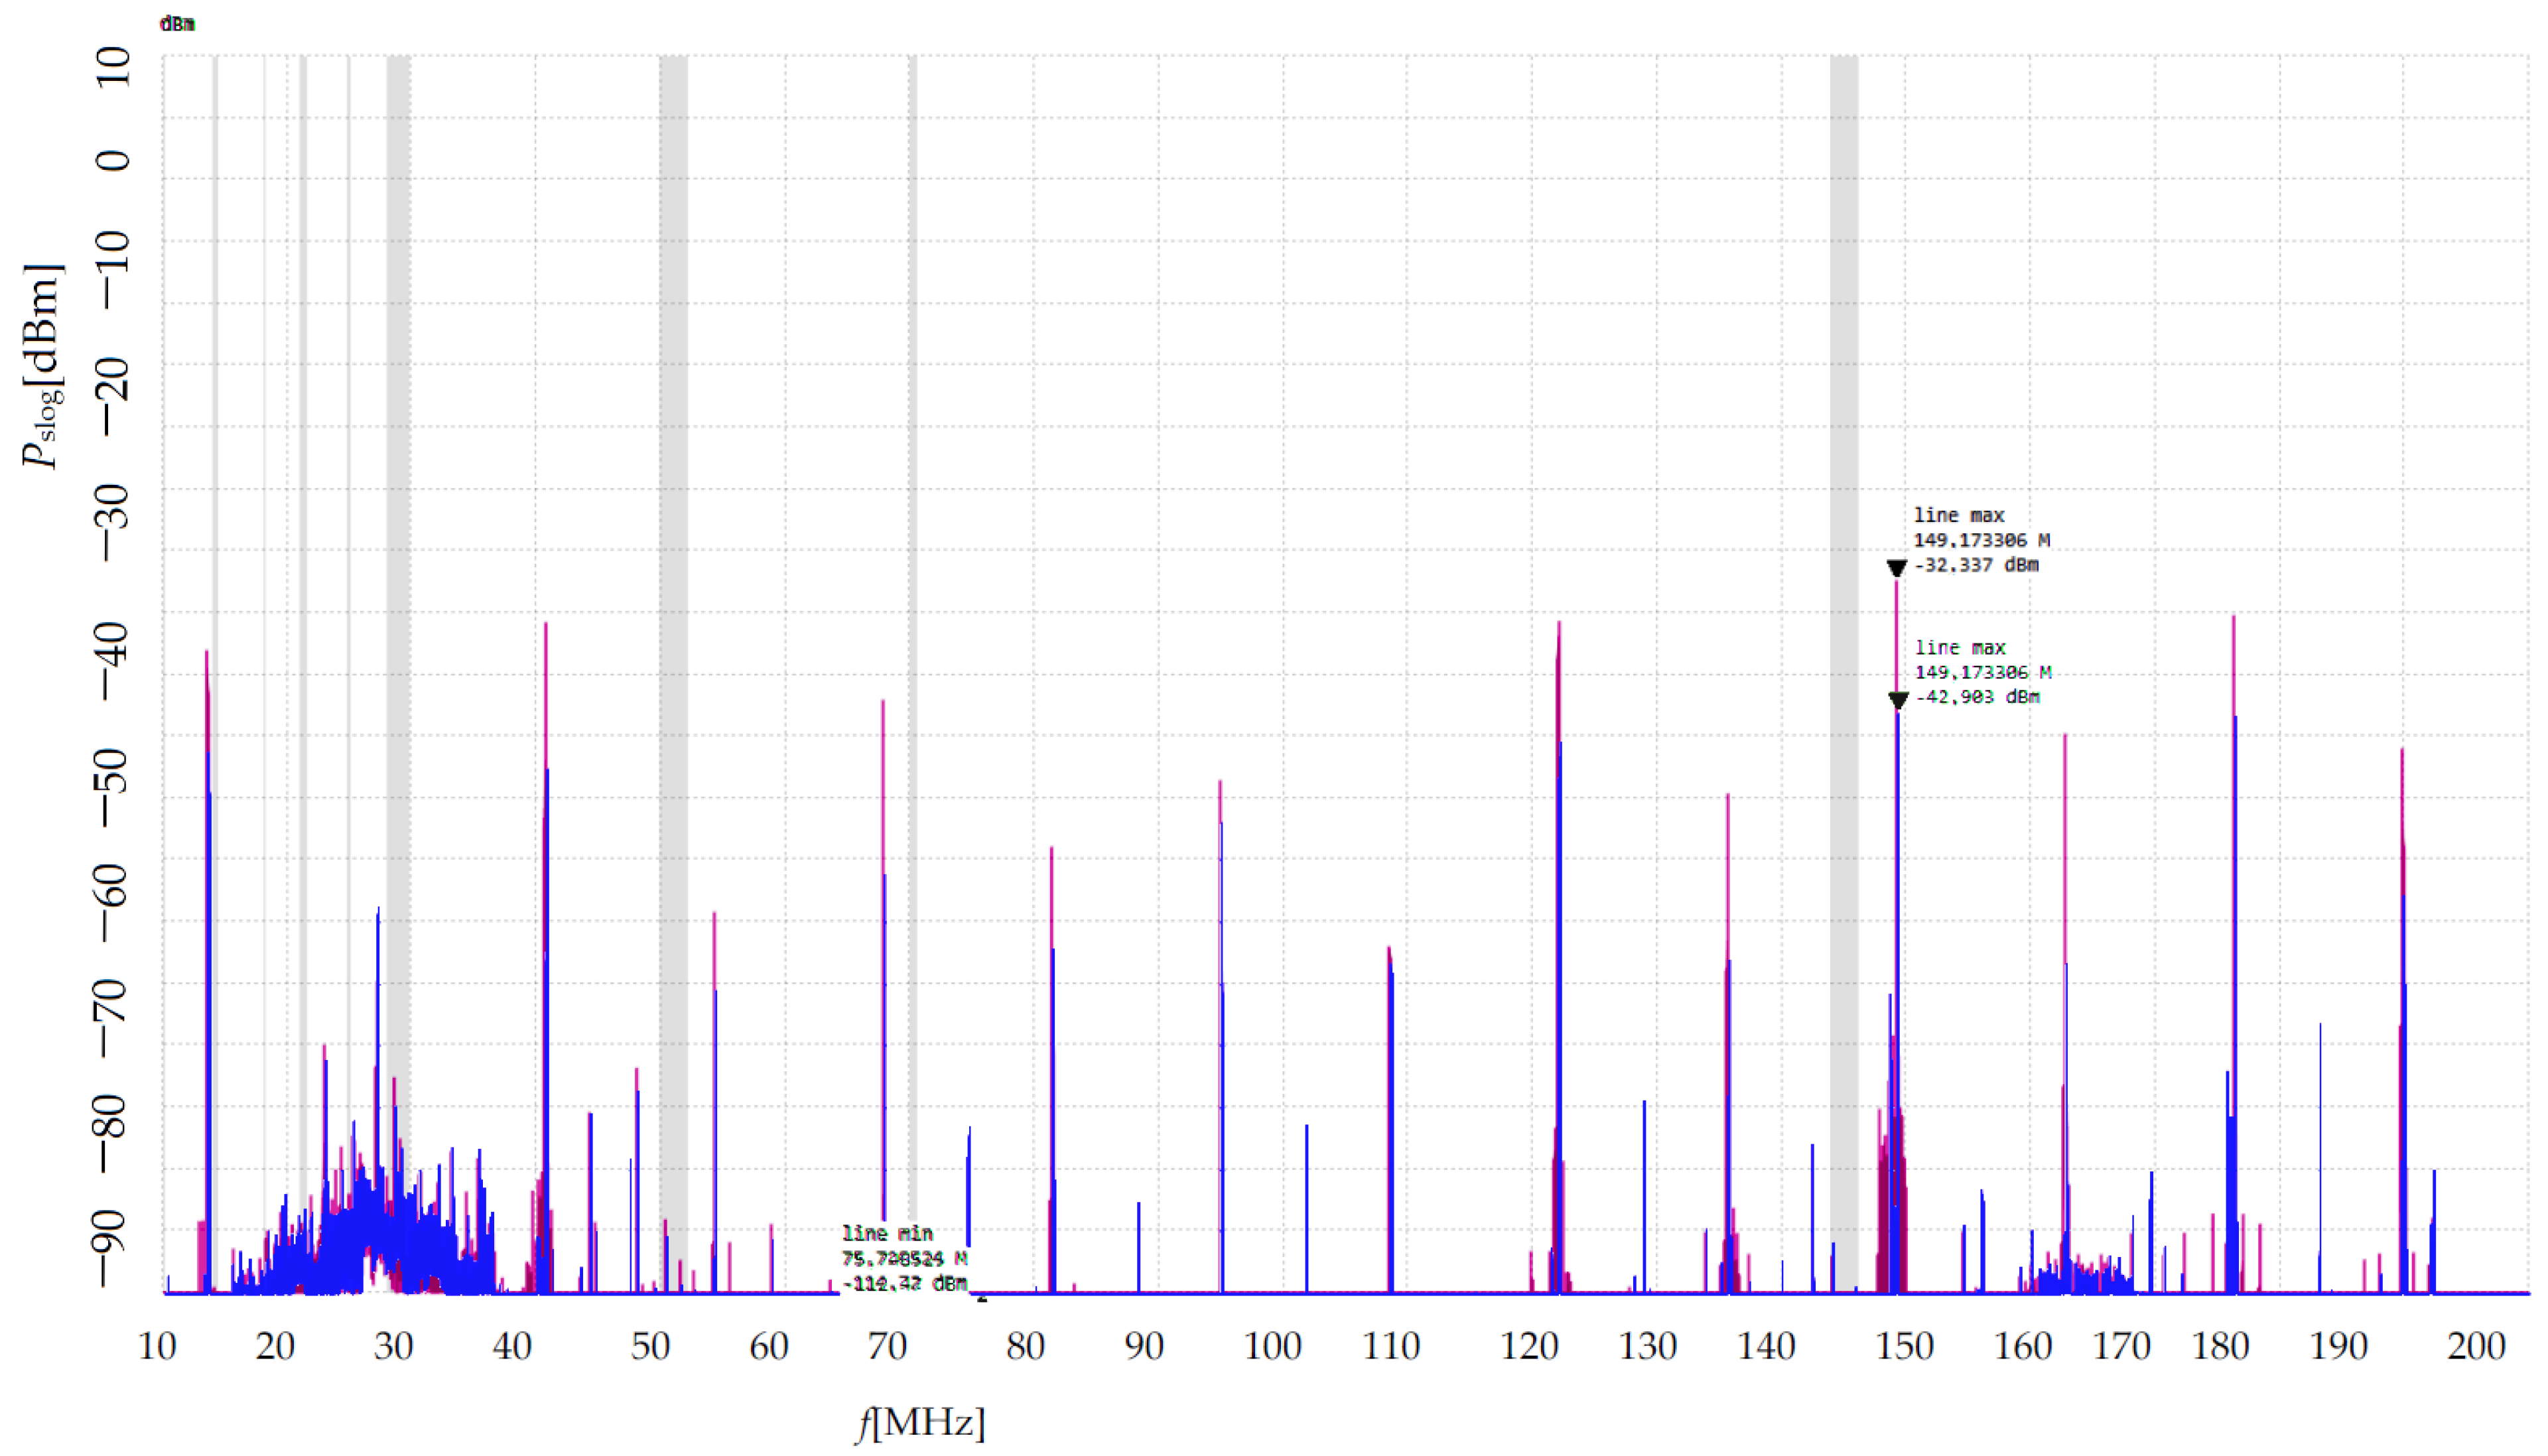
Figure 11. The argon–oxygen atmosphere of the plasma in the thermoset sample, as shown in
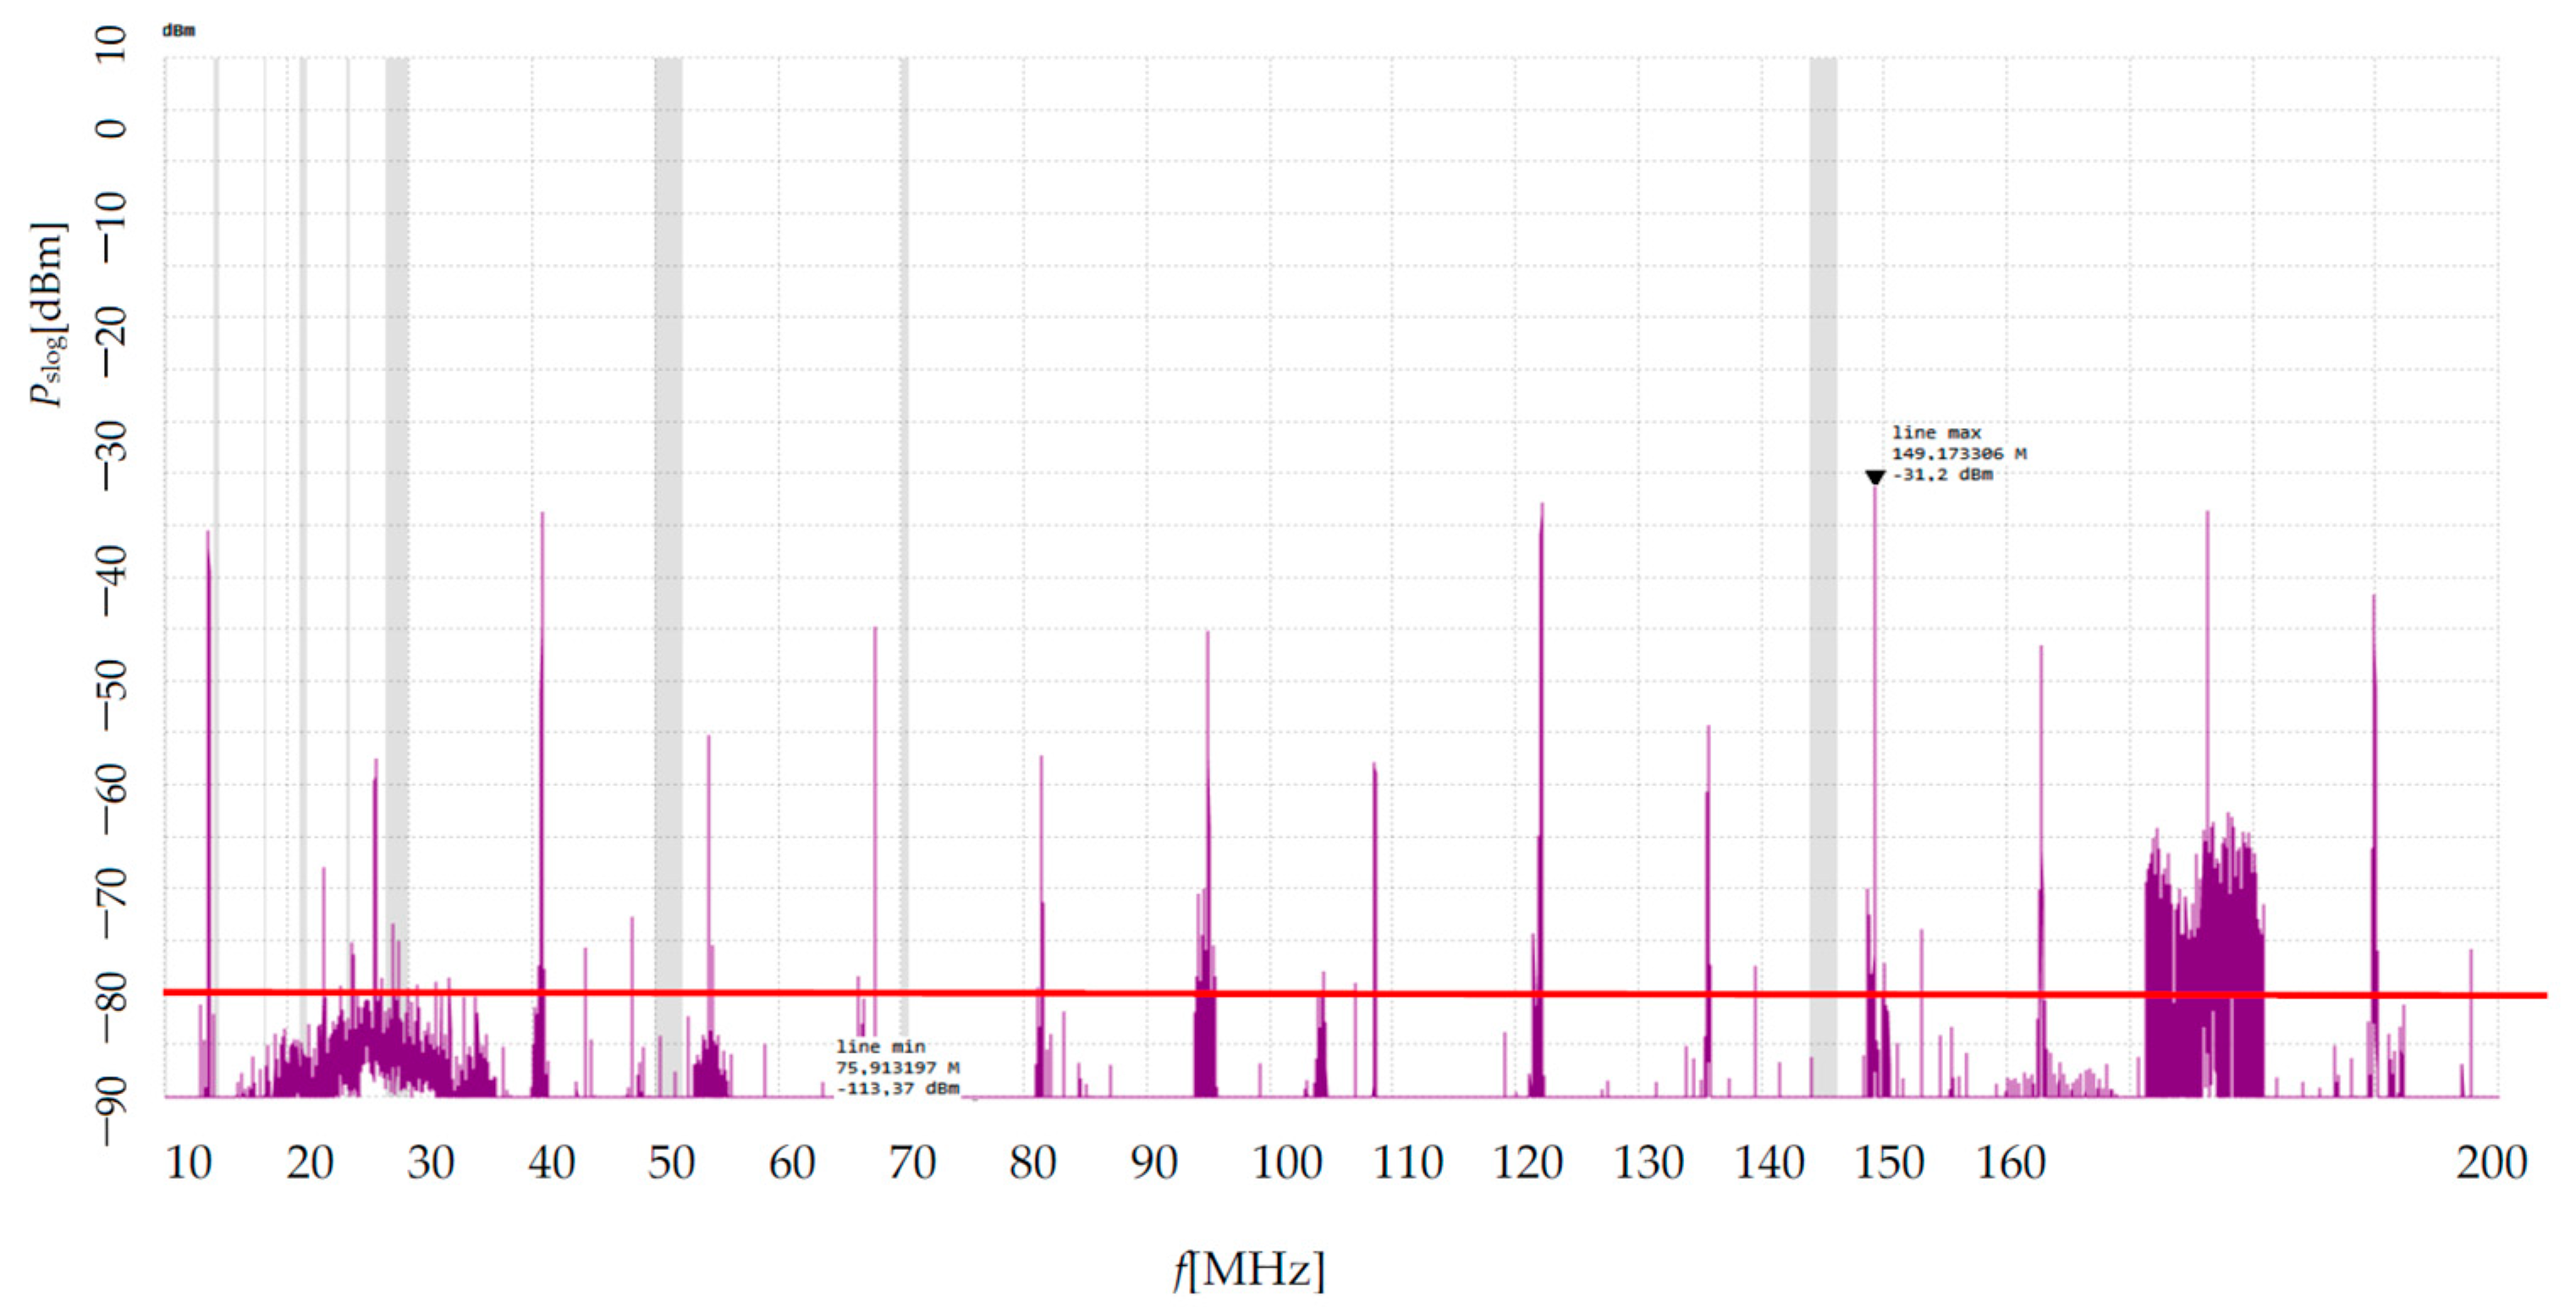
Figure 12, does not cause significant spectral responses; there are clear changes in the 80 MHz, 96 MHz and 180 MHz band. However, in this atmosphere, the change in the spectrum when applied to the thermoplastic sample is very responsive, as shown in
Figure 13. There is a visible change in the spectrum in the range of 13.56 MHz, 55 MHz, 70 MHz, 80 MHz, 95 MHz, 105 MHz and 150 MHZ and very large changes in the frequency range of 175–185 MHz.
A comparison of the spectra with these parameters is summarized in
Table 1. It can be seen that the thermoset and thermoplastic samples react differently to the composition of gases entering the plasma, while maintaining the same excitation HF power of the plasma chamber. According to the density and amplitudes of the power spectrum,
Pslog corresponds to the comparison with the evaluated change in surface resistance of the treated sample. From the further evaluations, it is clear that the highest change in surface resistance of the thermoplastic was achieved for the argon–oxygen atmosphere, as shown in
Table 1, which corresponds to the spectrum in
Figure 13 and the large change in the region of 175 to 185 MHz. For the thermoset sample and the change in surface resistance, argon plasma appears to be the most advantageous, as shown in
Table 1, and this corresponds to the spectrum in
Figure 9 with a very wide band and density of changes in the spectrum. In future, we will also try to uncover the basic or proven causes of the origin of spectral lines. A complete and complete description of the composition of the entire measured electromagnetic spectrum is a matter of deeper targeted research, which is not the subject of our contribution.
4. Interpretation of Modeled and Measured Data
In order to better understand the cause and context of the appearance of typical spectral lines when applying plasma to the sample surface, it is necessary to consider the behavior of plasma as an electromagnetic phenomenon when in contact with the sample. For this purpose, a number of numerical models were used, which are listed below or have been previously published [
13,
14,
28,
29]. A radio-frequency (RF) slot plasma nozzle with an active plasma width of
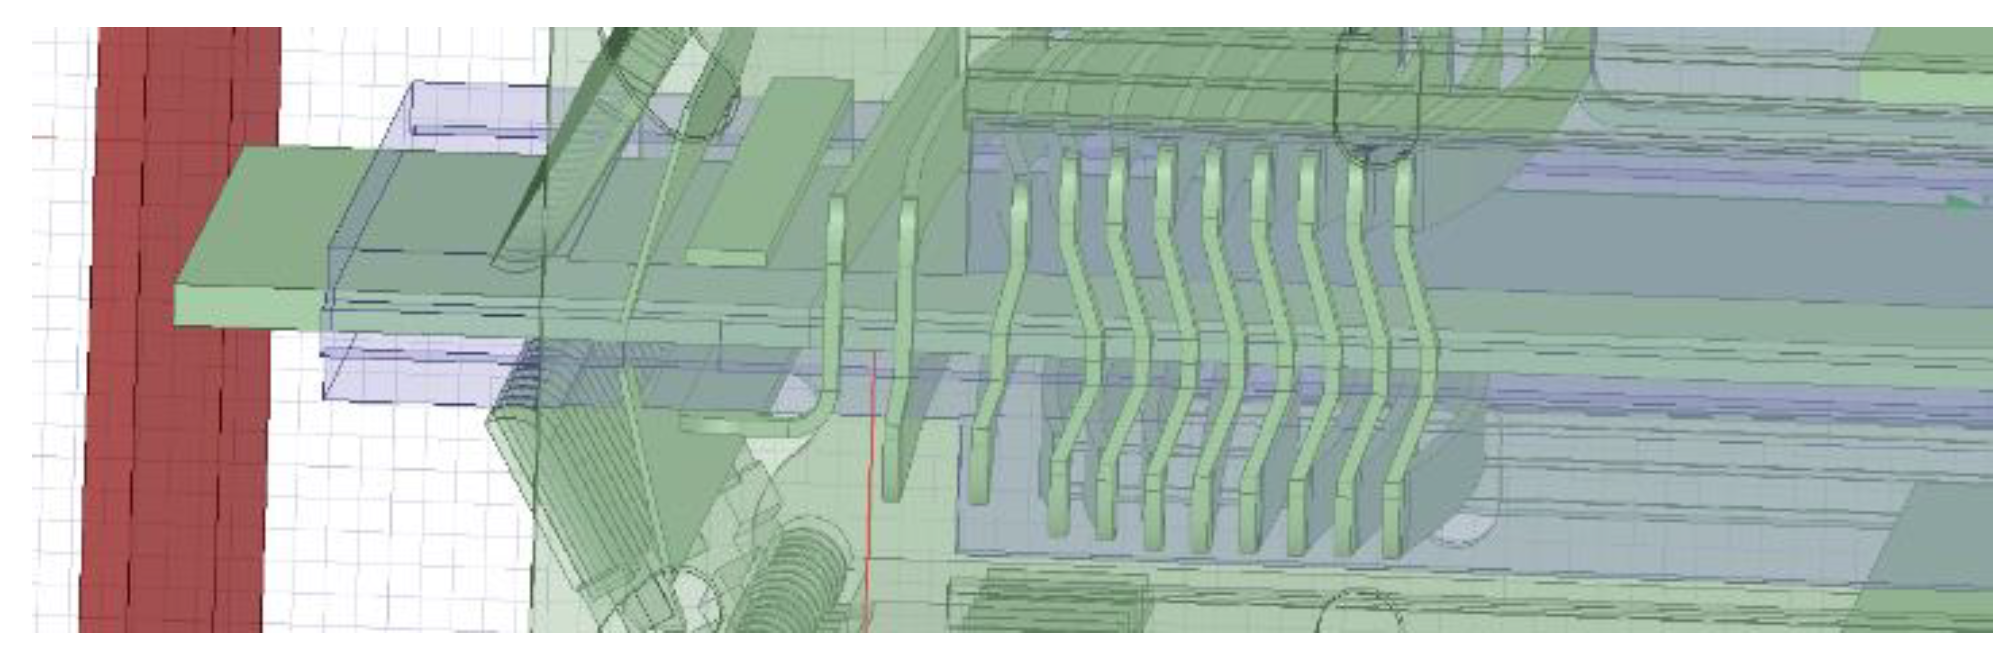
wg = 150 mm was used for the surface treatment of the tested polymer insulation samples, as shown in
Figure 14. This figure shows the geometry of the chamber, which was numerically modeled using the finite element method [
30,
31] in the ANSYS [
30] HFSS module, where
Pout = 500 W, under an argon and other atmosphere. The evaluation of numerical models and comparison with experiments is complemented by research from the field of radio-frequency methods [
32,
33]. Currently, FEM numerical models are used from the perspective of the mechanistic concept of the matter [
34,
35,
36,
37,
38] or only a narrow part of the electromagnetic spectrum from the perspective of optics [
39]. Our problem and its model extend into the field of electrohydrodynamics [
1] and specifically deal with the electromagnetic field [
40] with the formulation of the telegraph equation.
A numerical model used for chamber geometry modelling and to evaluate electromagnetic quantities, i.e., the frequency dependence of the
S and
Z parameters [
13] of the laboratory experiment [
14,
15,
16] shown in
Figure 14, was constructed based on solving the reduced Maxwell’s equations and the formulated wave equation in ANSYS [
30].
where
is the complex vector magnetic potential,
denotes the complex scalar electric potential,
represents the complex wave number,
ε stands for the electric permittivity,
μ signifies the magnetic permeability,
is the complex specific electric charge, and
is the current density.
Model (1) and the modeling method were previously described in detail and verified experimentally in the papers [
16,
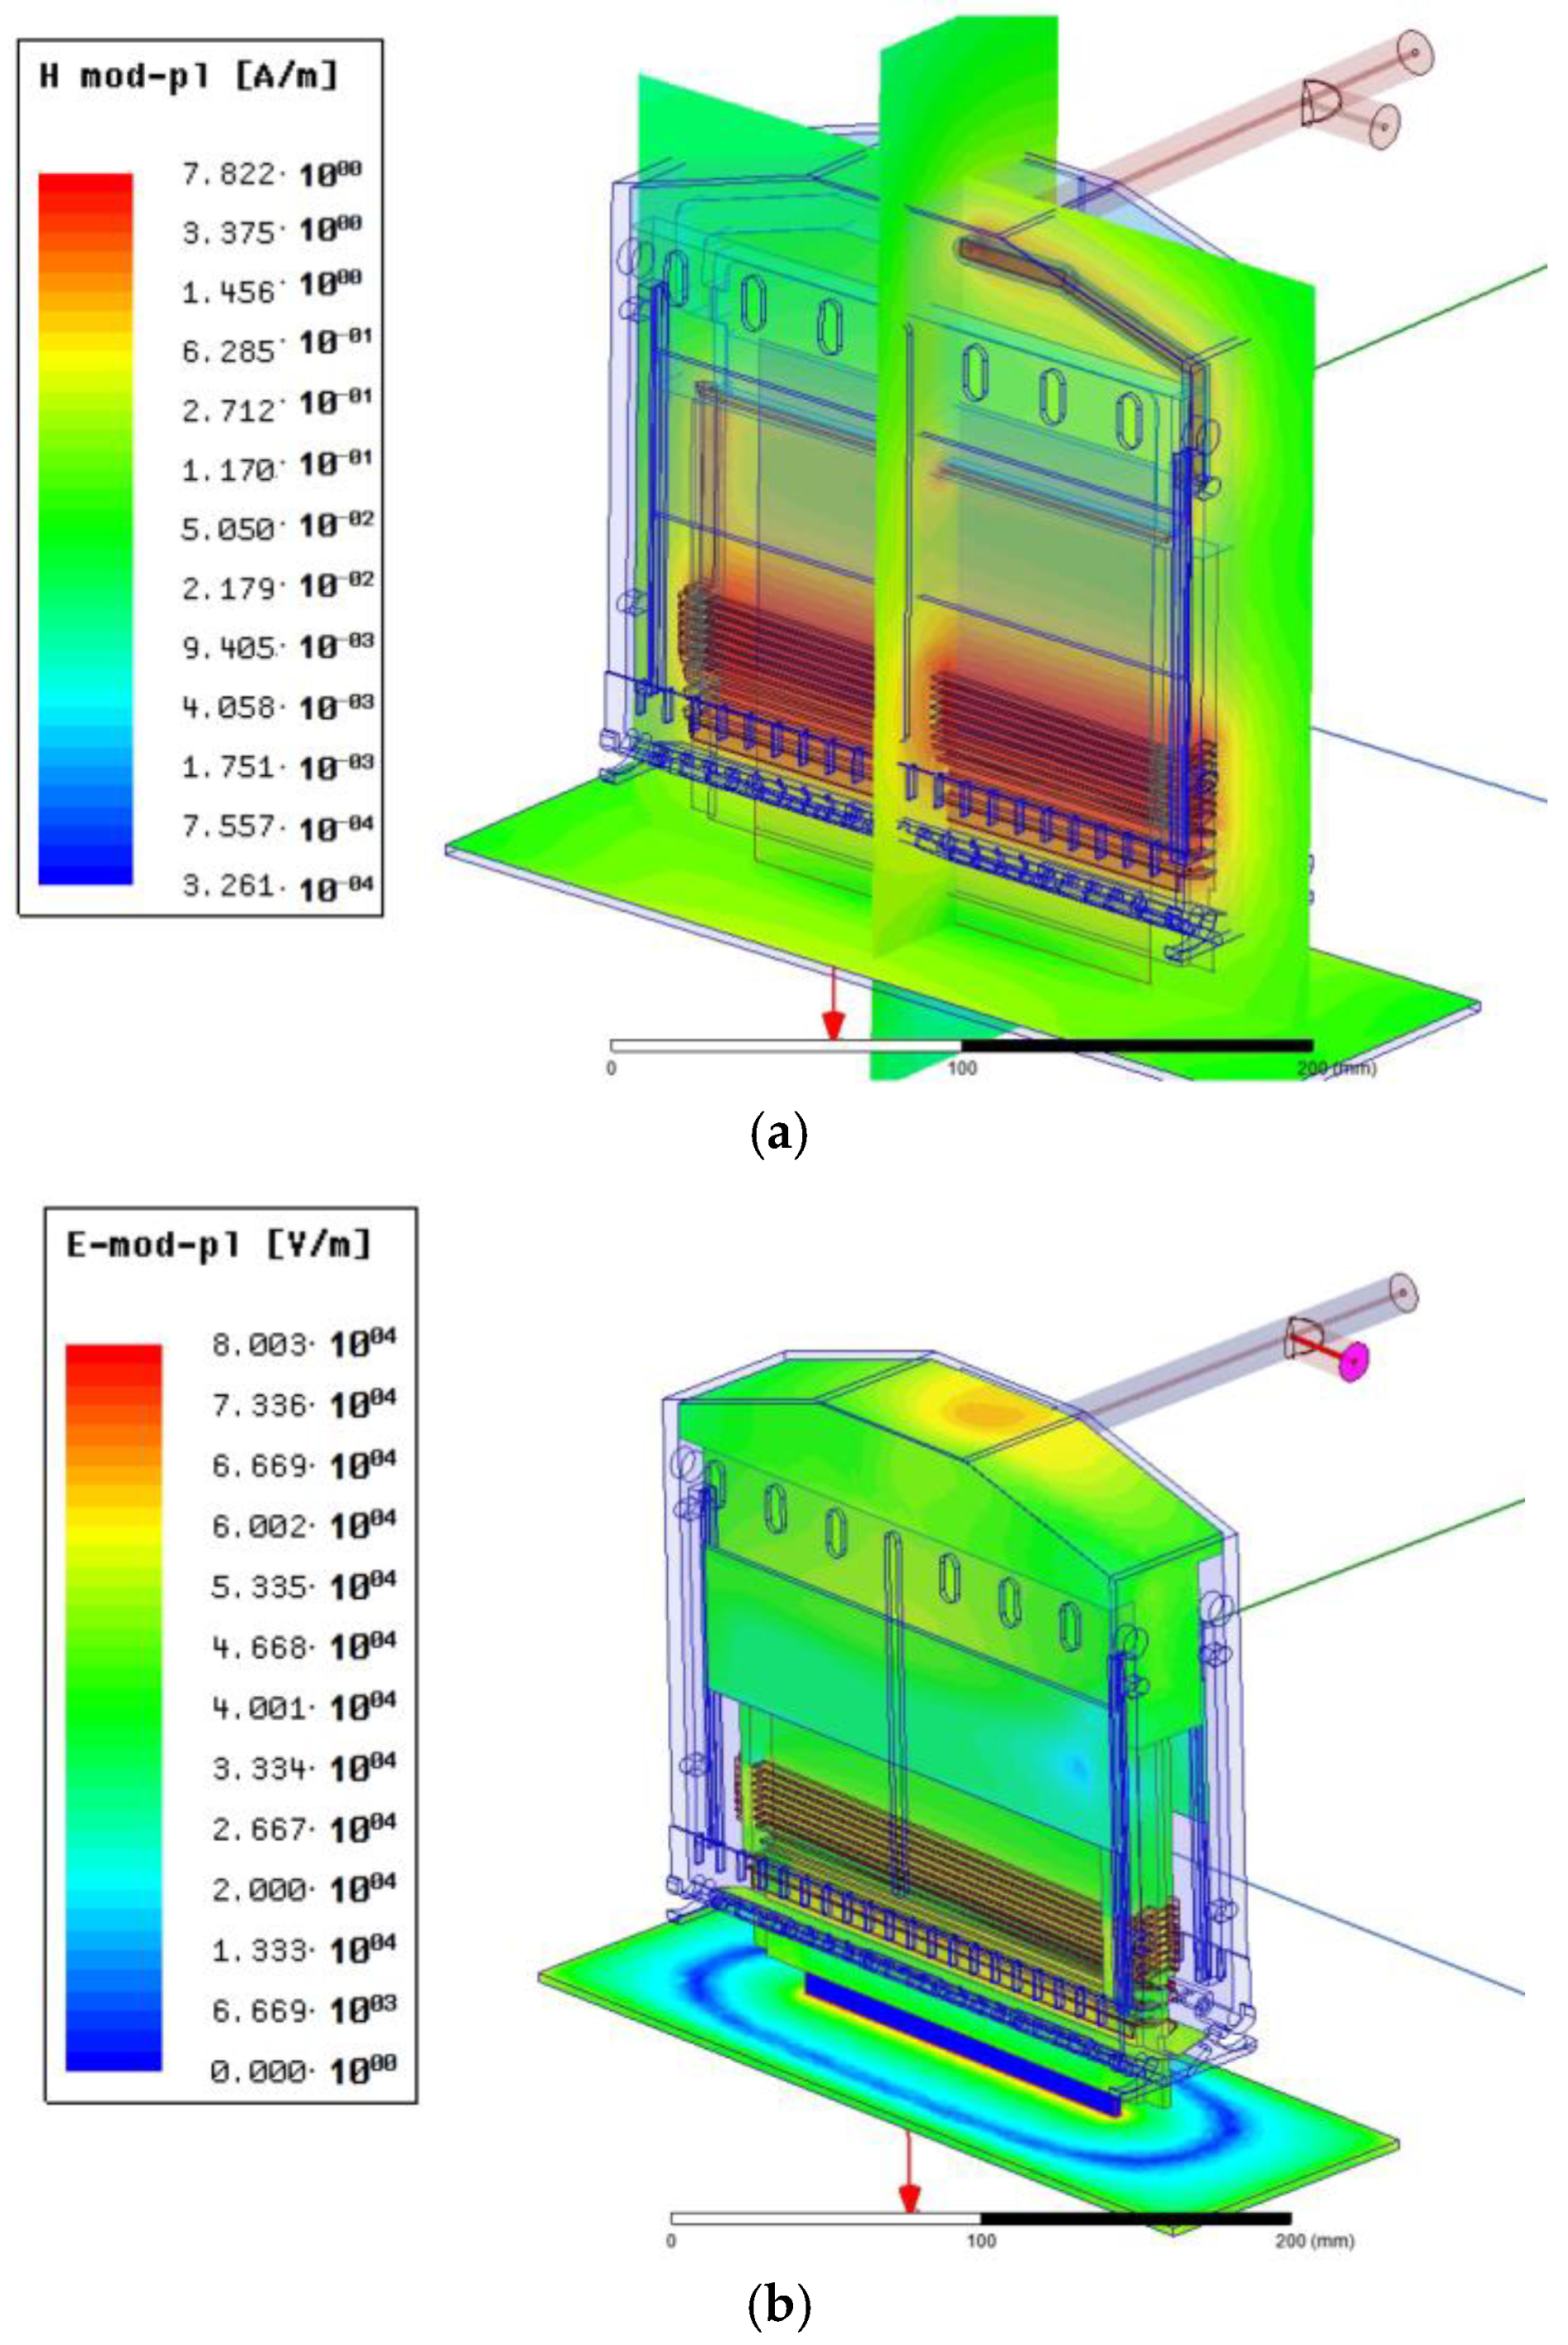
28]. The analysis results for the critical parts of the chamber are shown in
Figure 15 and
Figure 16. The figures show the distribution of the magnetic field intensity components
H in the area of the chamber winding and the plasma discharge slot, in addition to the distribution of the electric field intensity components
E.The analysis results provide quantitative evaluation of the electromagnetic field distribution at the sample surface, as shown in
Figure 15.
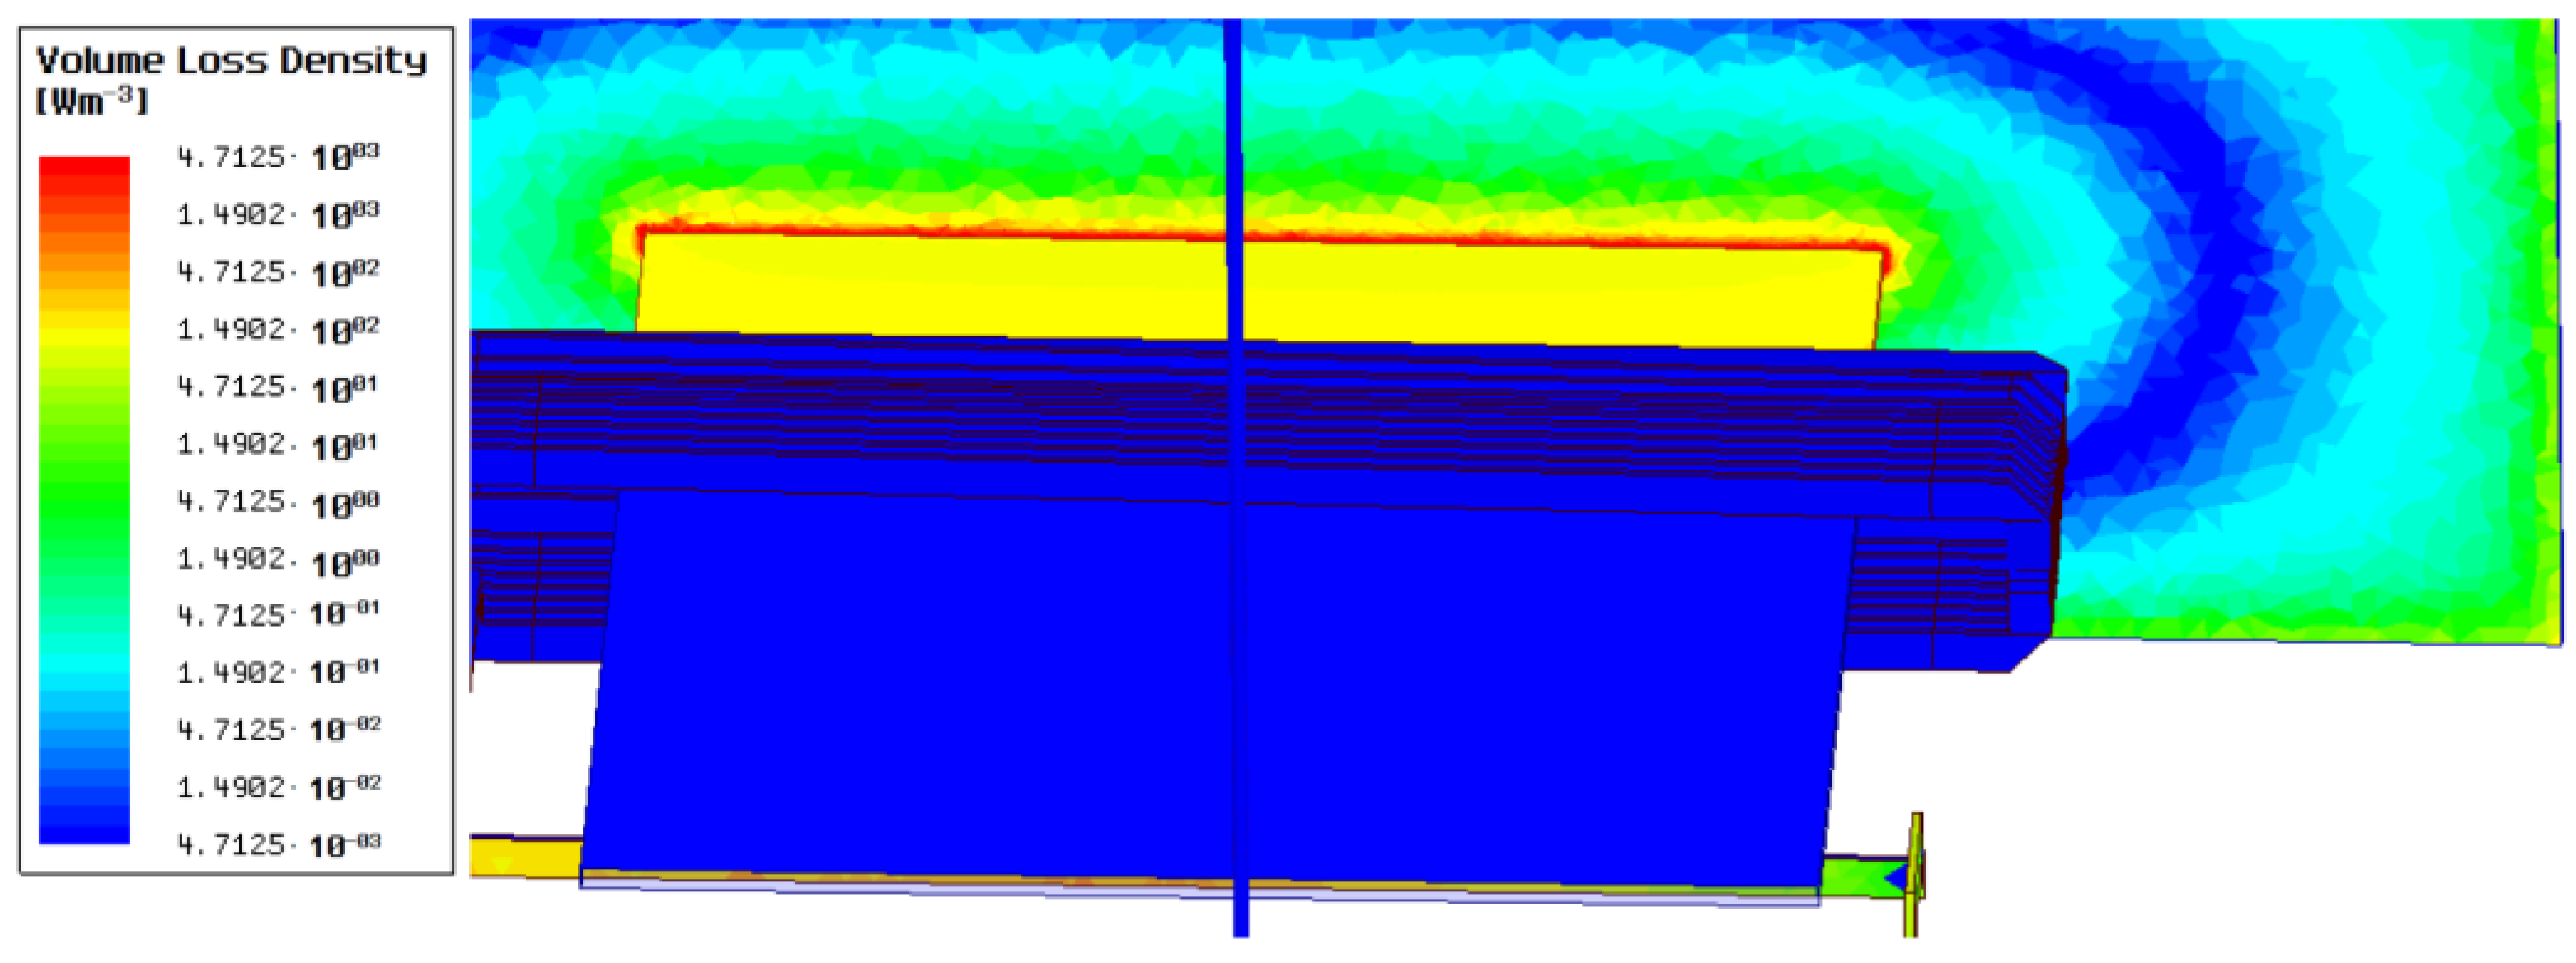
Figure 16 illustrates the distribution of the power volume loss density
p[Wm
−3] in the area of the plasma discharge in contact with the modified dielectric surface generated by the slot chamber at the nominal chamber excitation power
Pout = 500 W for an argon atmosphere.
The above-mentioned deterministic analyses can be considered as an evaluation of the discharge from the macroscopic concept of the model, especially of a quantitative nature. A detailed model of the coupled microscopic concept of the model with the macroscopic one is time-consuming and therefore an experimental approach was used to supplement the model of the described problem. Experimental observation with the addition of the wave model of a partial part of the plasma discharge clarifies the origin and relevance of some lines in the RF spectrum.
The following records from a high-speed camera (Photron FASTCAM SA-X2 high-speed camera parameters: 160,000 fps, shutter speed 5000 ns) and the performed experiment from the area of stochastic observation and recording were used in this analysis. In
Figure 17, an X-type vertex is visible in the area of the beam impact on the dielectric substrate. It is known and theoretically explained [
1]. Since this is a dynamic phenomenon and the plasma discharge is characterized by the movement of the electric charge
q[C], this effect is a source of an electromagnetic wave that can be captured in the spectrum of the scanned spectral density. The moving charge forms an electric current
i(
t) for a time change (
dt).The specific force density
fq acting on a moving electric charge
q [
20] in an electromagnetic field can be expressed by the following relation:
where
B is the magnetic flux density vector in the space of a moving electrically charged particle with volume density
ρ,
v denotes the mean velocity of the particle, and
E represents the electric intensity vector. Therefore, the volume density of the force acting on moving electrically charged particles with charge
q and number
Nq of volume
V in the considered region is as follows:
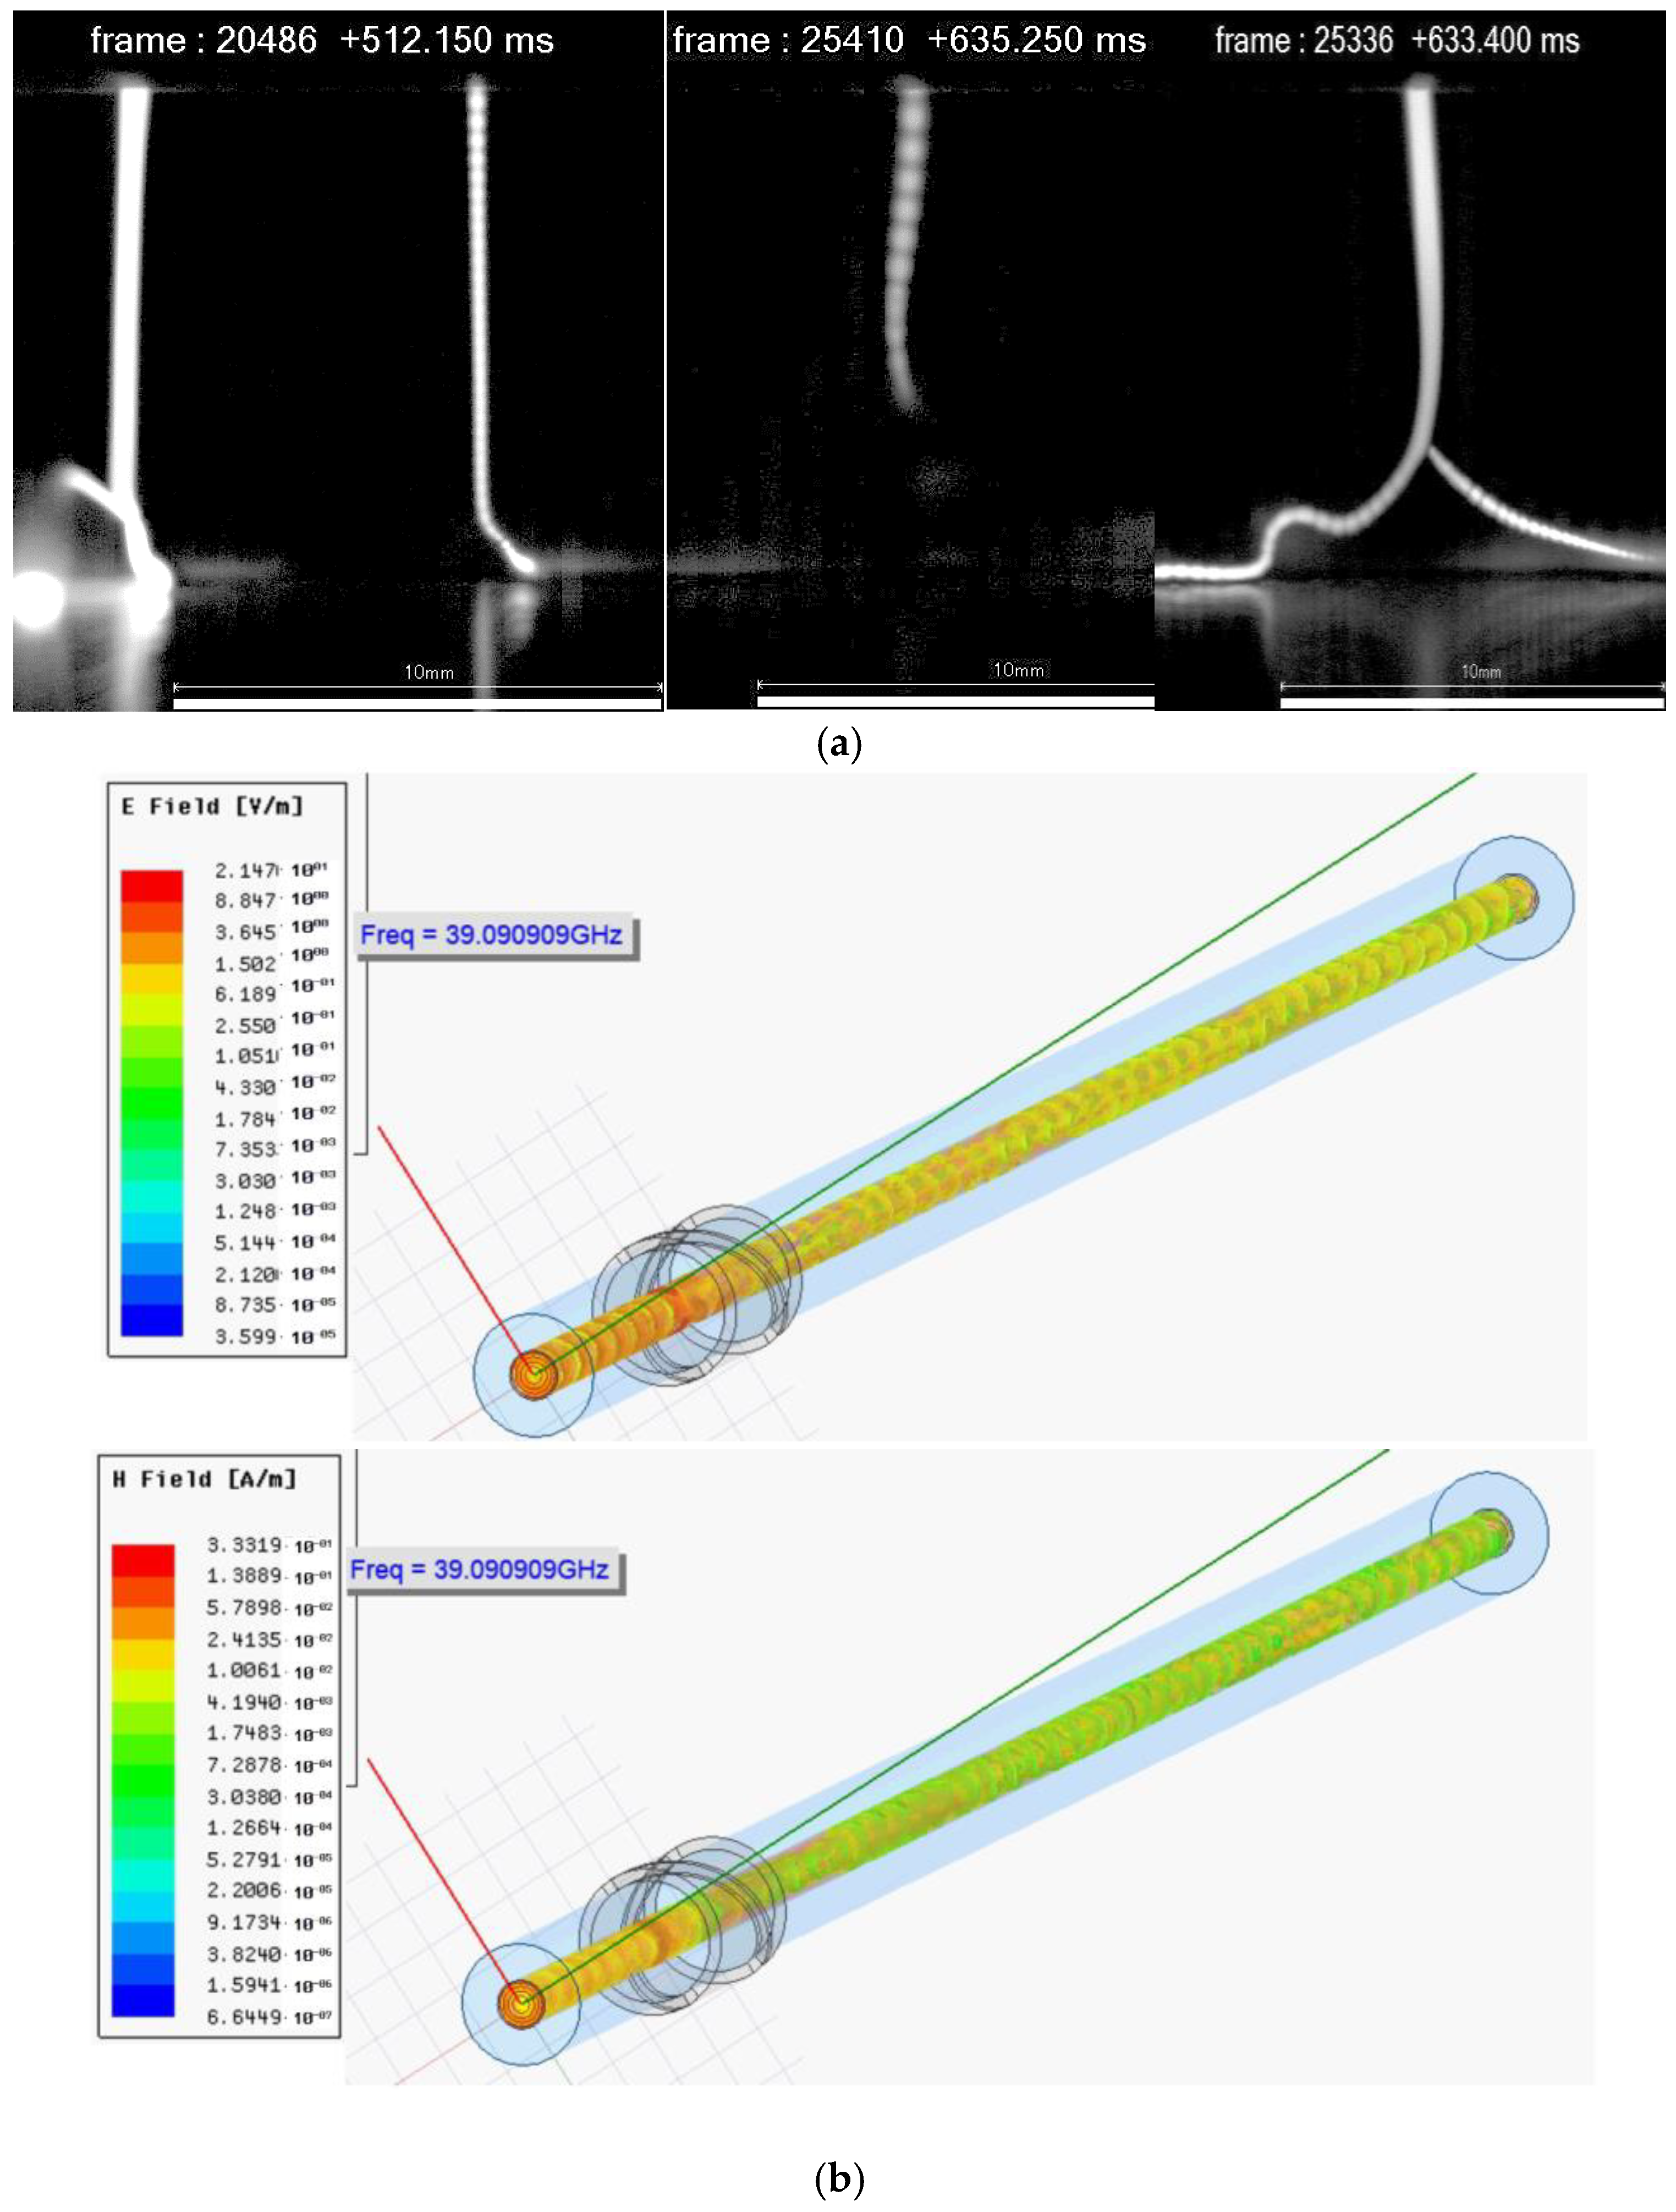
Thus, the effect generates a specific spectrum for the plasma produced by the chamber, depending on the generator power, plasma atmosphere, content and type of precursors, type and quality of the sample surface and other parameters. In the observed and scanned discharge, an O-type vertex can be seen [
1], as shown in
Figure 18a. This has two possible origins. The first is the formation of a standing wave during the transition from the chamber area to an inhomogeneous environment with a different impedance
Z. The second is due to the geometry, gas composition and plasma discharge parameters, as can be observed, for example, in
Figure 18b with a previously experimentally verified numerical model [
28,
29].
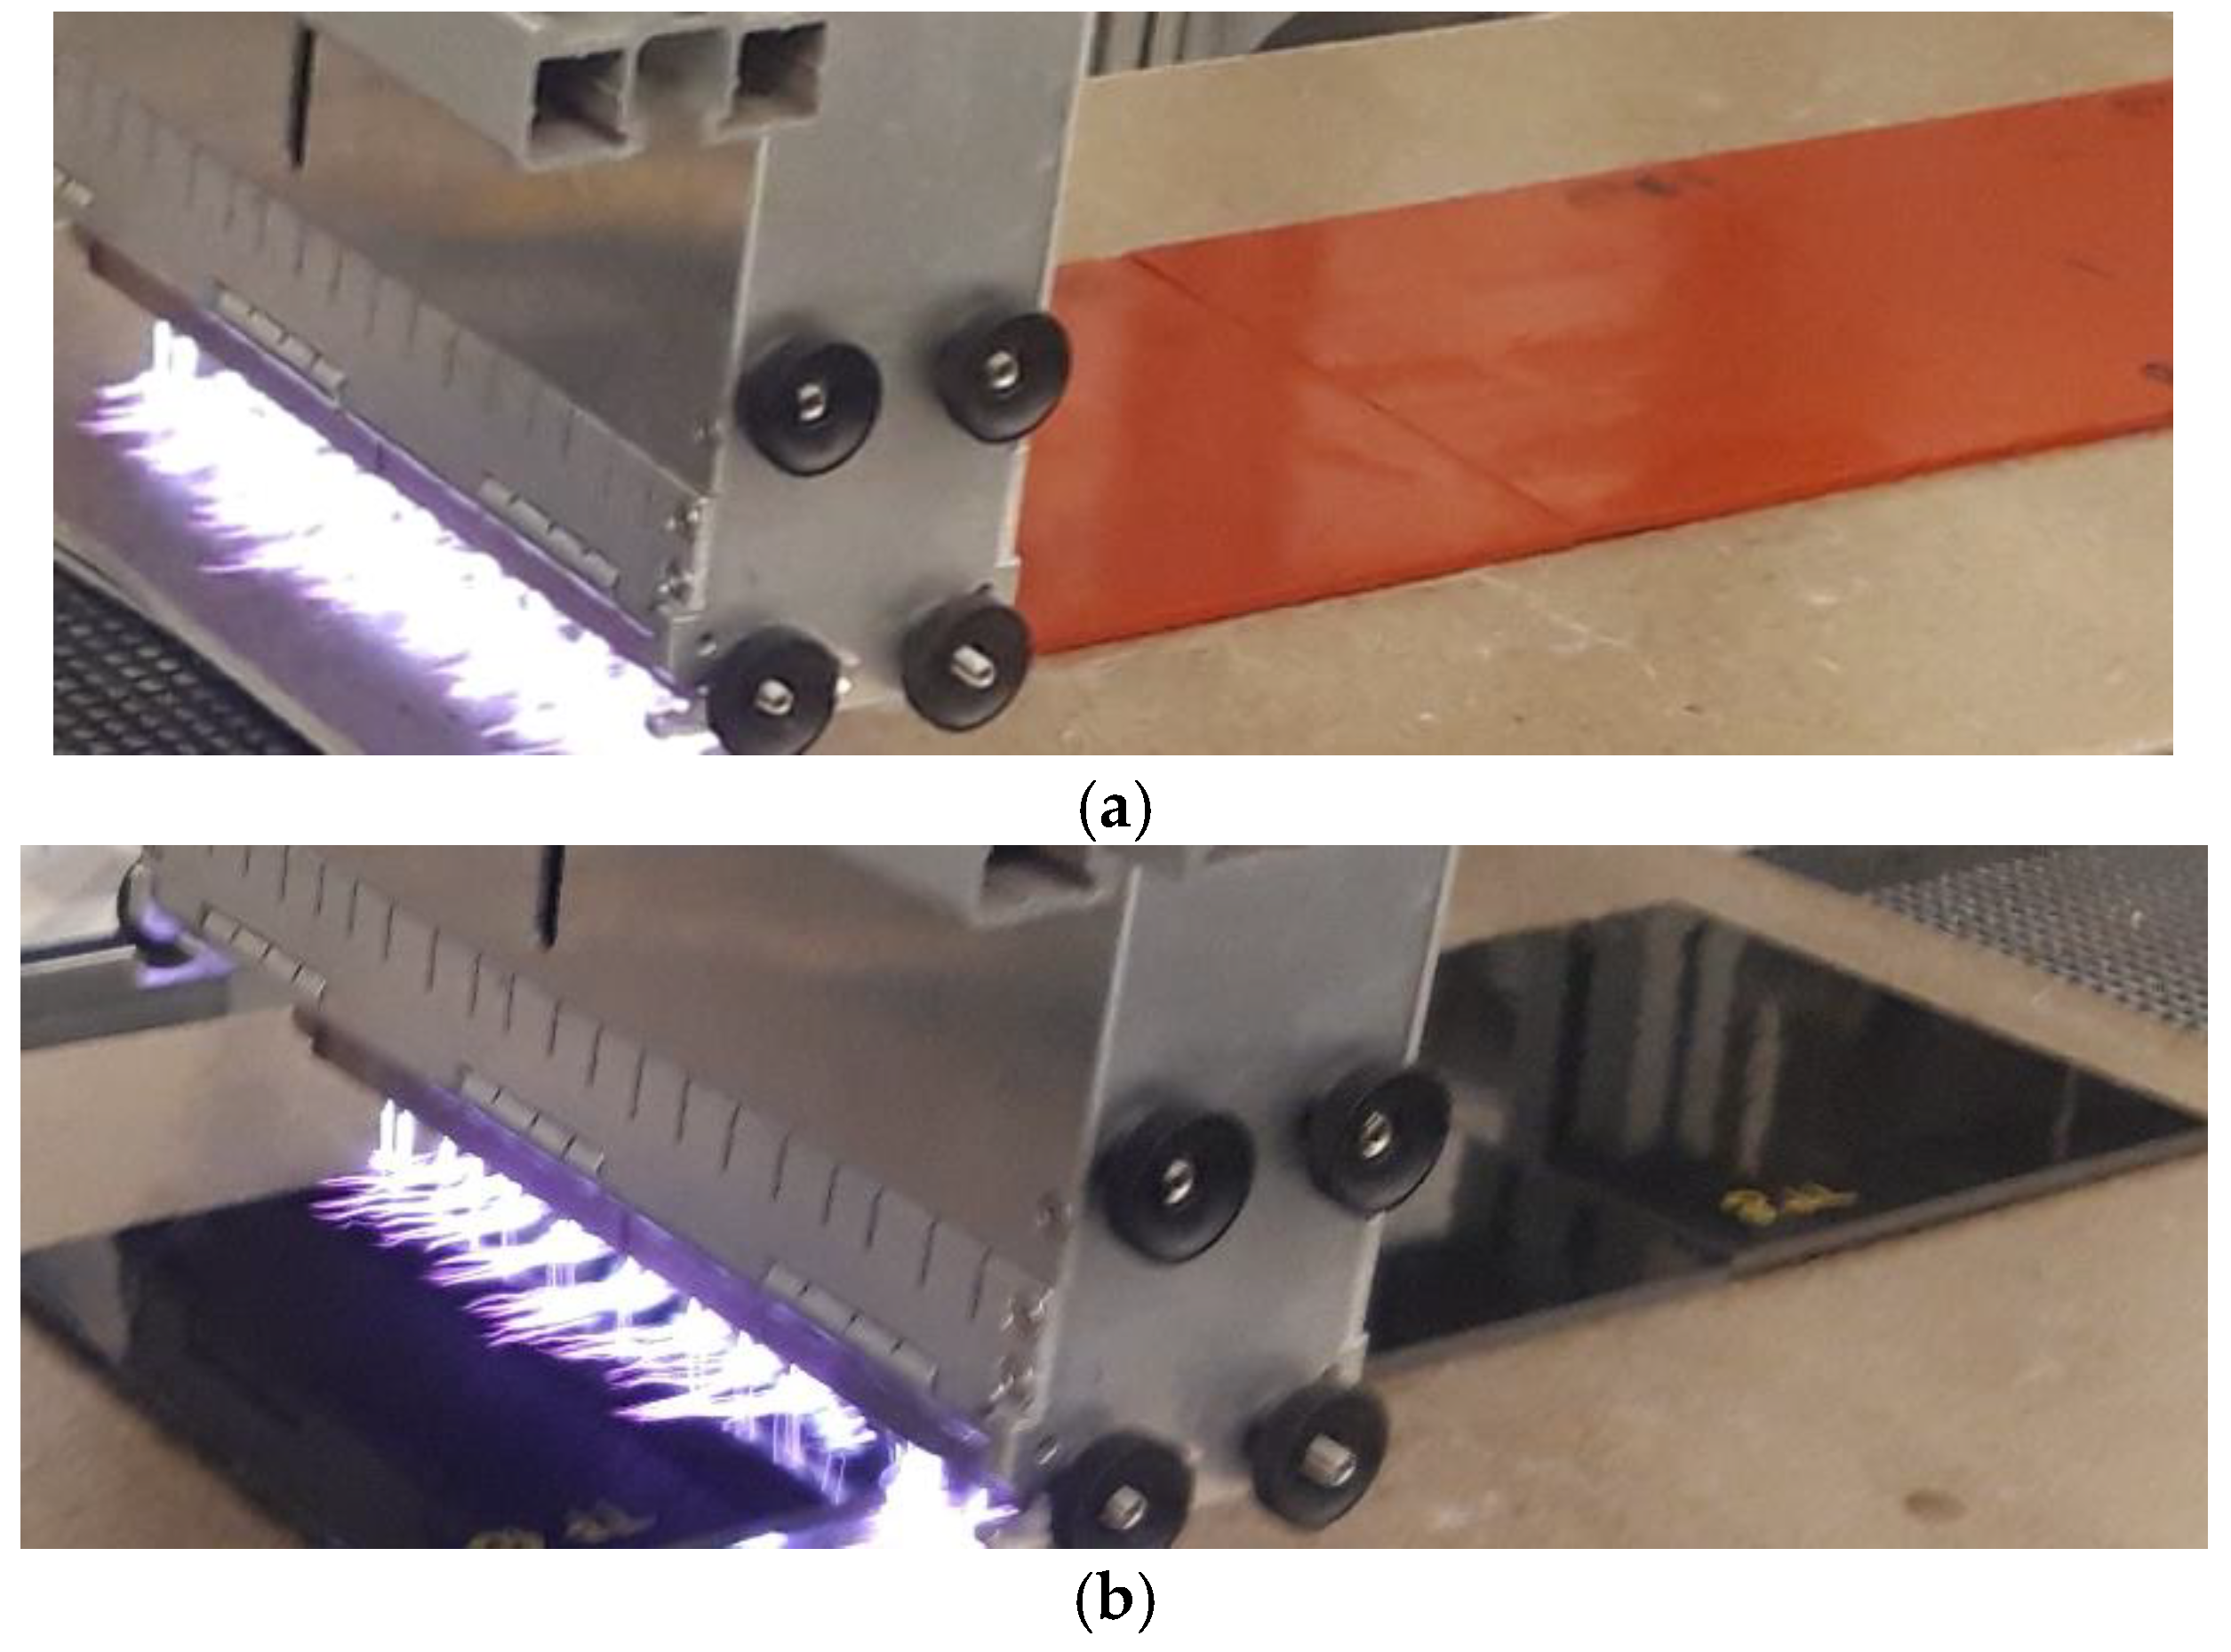
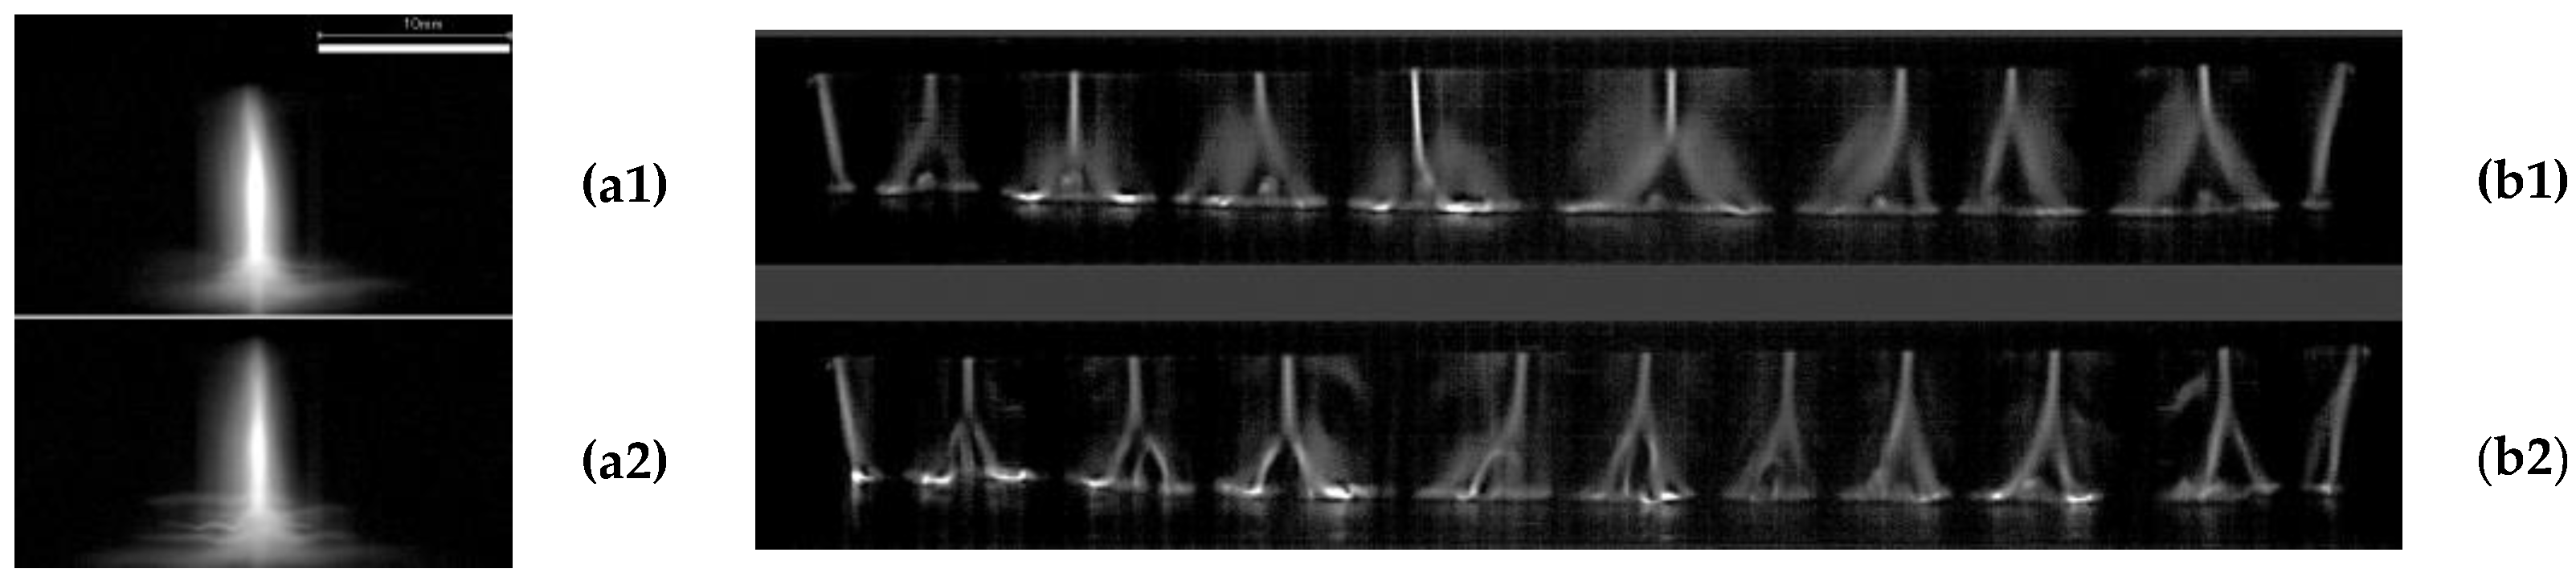
Furthermore, from the experiment and the stochastic approach to the discharge above the sample surface, it is possible to evaluate the different shaping of the dynamic behavior of the movement of electric charge depending on the type of gas composition, as shown in
Figure 19 with a dynamic discharge in pure Ar gas, depending on the discharge excitation power and the gas flow volume through the chamber. A marked difference in the discharge shape at the surface is visible in
Figure 20; in the Ar atmosphere, the oxygen content was changed parametrically depending on the power supplied to the chamber and the atmospheric flow volume.
These typical changes in the shape, length and distribution of the electric charge current path, of course, change the composition and distribution of the scanned RF spectrum of the power Ps generated during the plasma discharge applied to the dielectric samples.
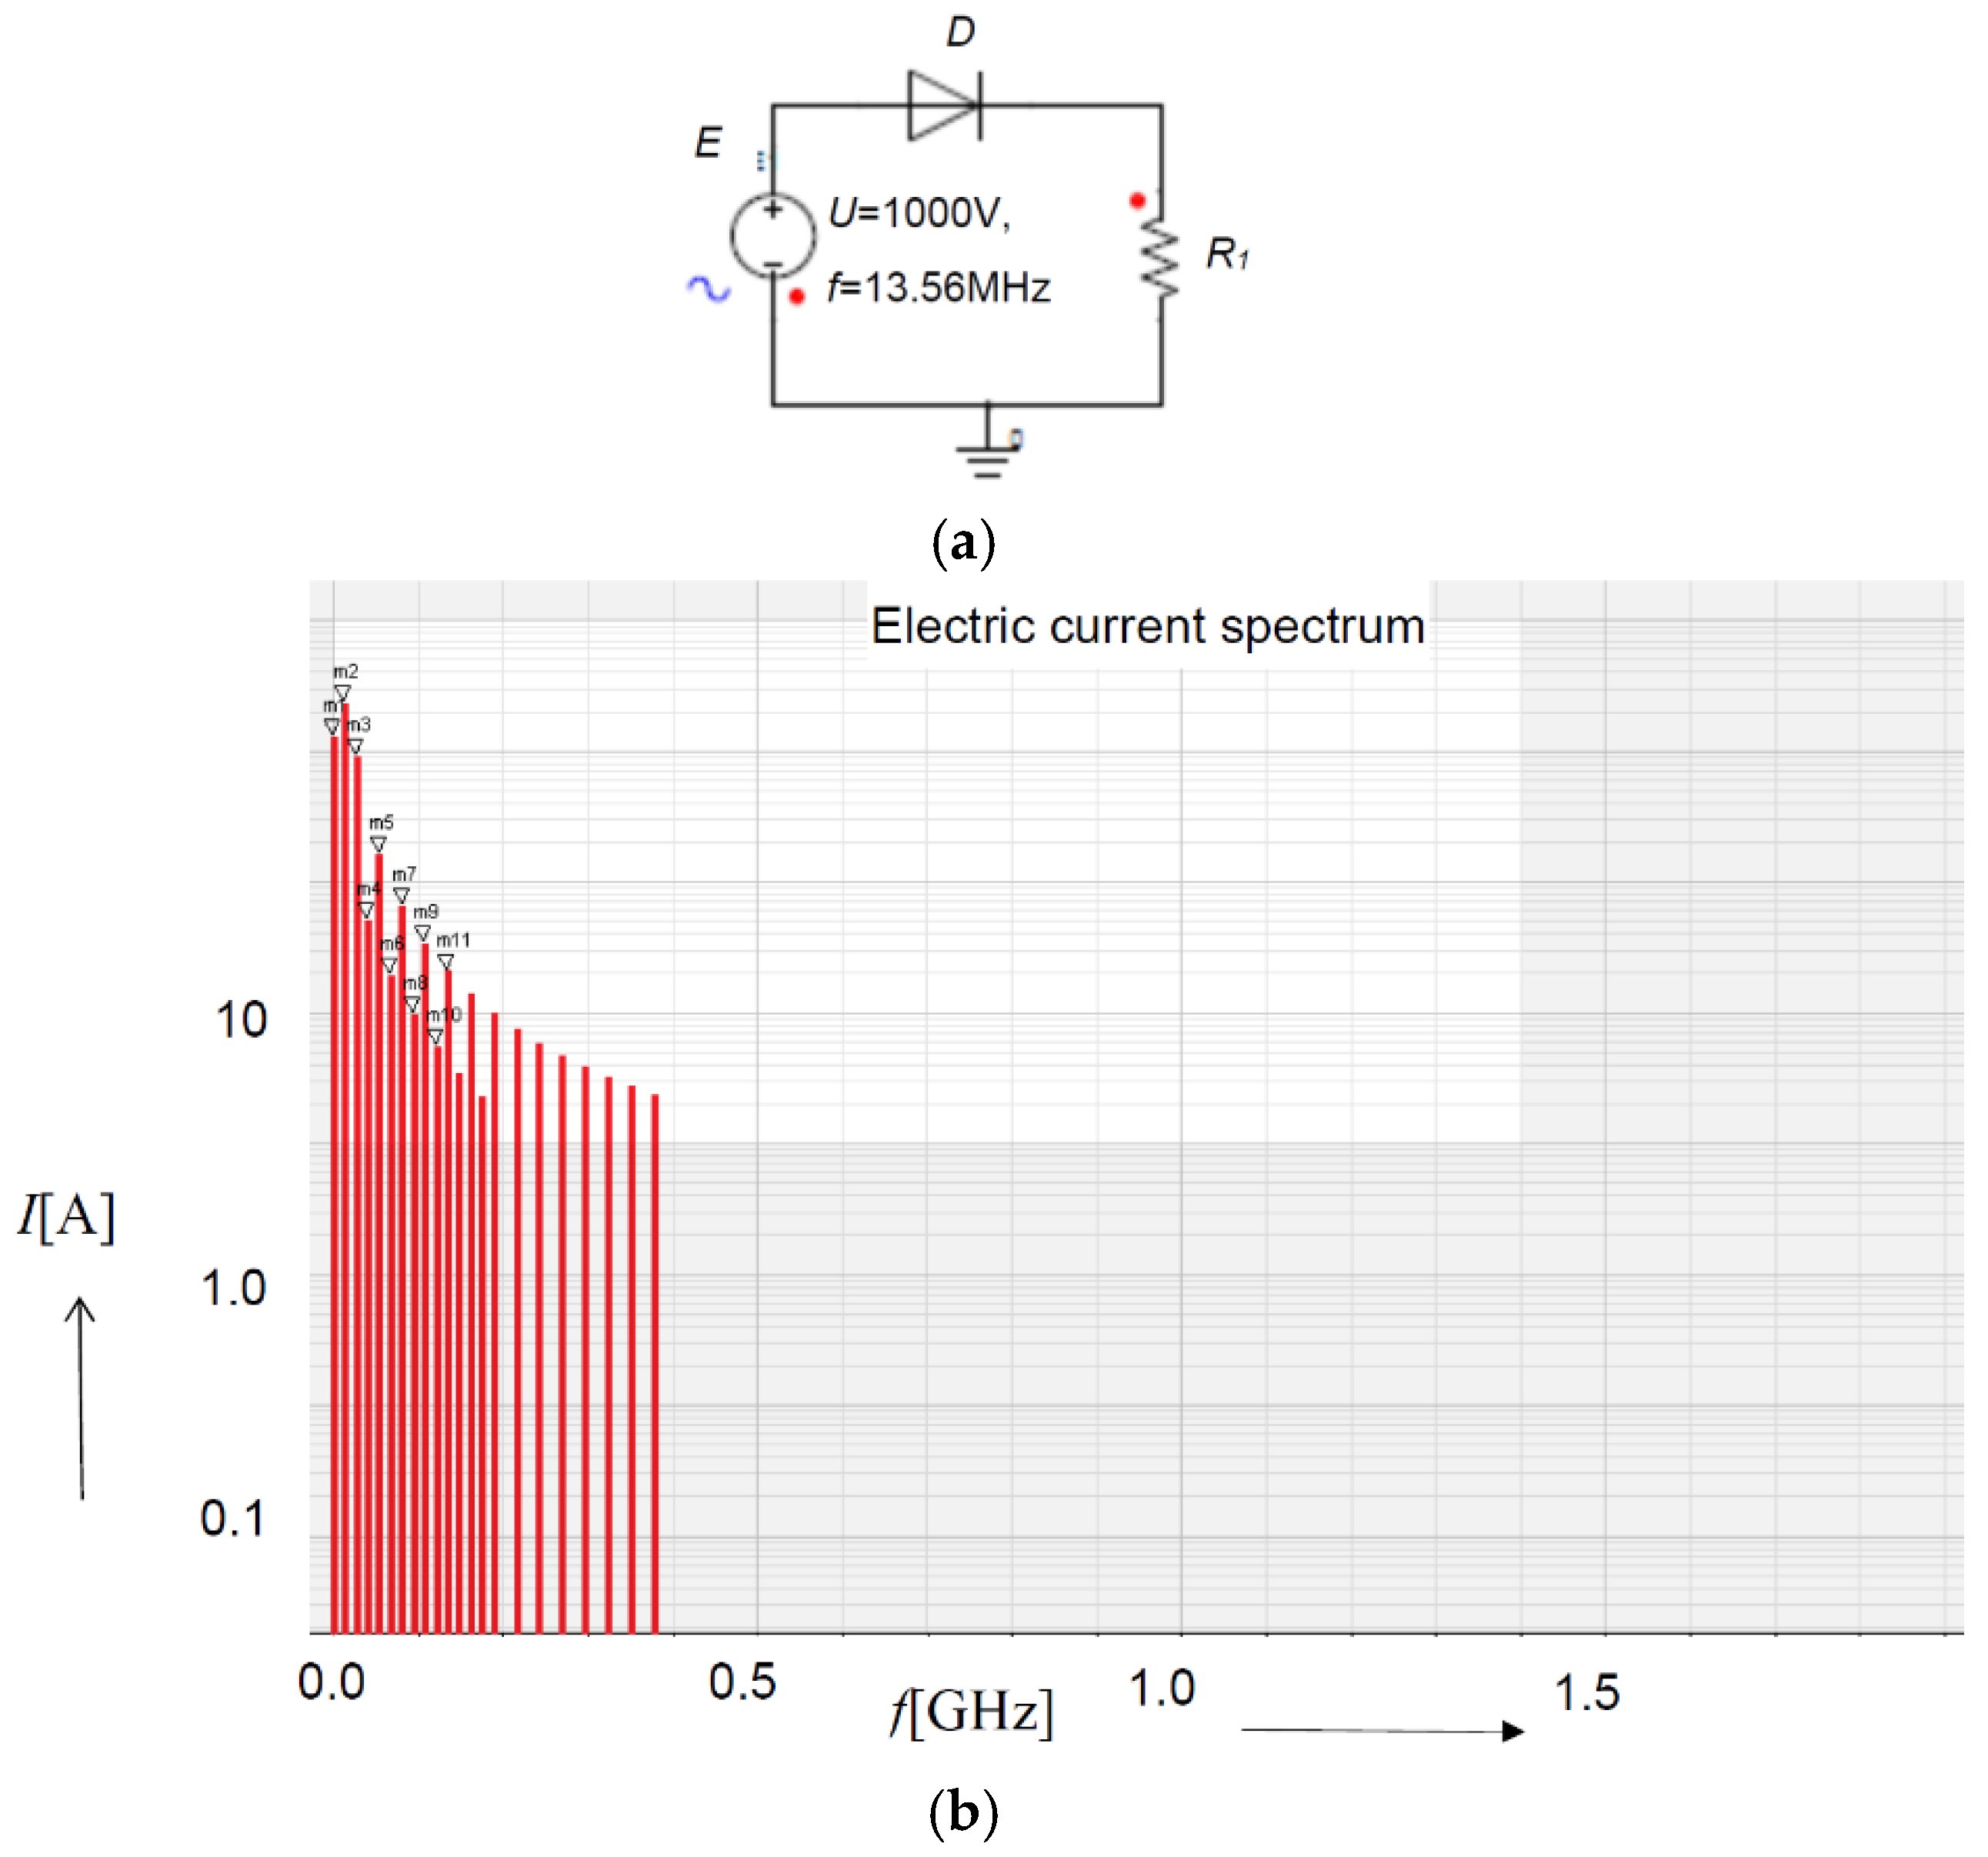
As proved by comparing the model and the experiment [
13,
26], the basic spectral lines closest to the excitation frequency of the generator
f = 13.56 MHz can be well predicted by the deterministic macroscopic model with concentrated parameters with the setting of several parameters in the substitute model of the electric circuit with a nonlinear element as shown in
Figure 21. The parameters of the nonlinear element can be directly set from the physical parameters of the generated plasma discharge. It is necessary to consider the composition of the (stochastically conceived) plasma in the chamber when describing the specific electrical conductivity. From the perspective of the model with distributed parameters, the resulting characteristic of the nonlinear element
D of the model with concentrated parameters is formed, where
U is the electric voltage between the anode and the cathode in the plasma chamber,
R1 is the linear load expressing the parameters of the plasma discharge and the magnitude of the electric current through the circuit, etc. Specific electrical conductivity is created by the movement of electrically charged carriers. These can be described as follows as a function of electrical conductivity.
From the microscopic view of the EMG field of plasma, the nonlinearity of the electrical conductivity γ in the generated plasma channel is introduced as a parameter describing the density of the electrical charge
q, similar to the nanomaterial model in work [
28]. The method for defining a specific parameter of electrical conductivity can also be compiled for the generated plasma.
where
x,
y,
z are the spatial coordinates, and
q is the electric charge. From the analysis and experimental verifications carried out so far [
13,
26], the electrical conductivity
γ was formulated taking into account the mobility of the electric charge carriers, with both electrons and ions in the plasma discharge, and the following relation was obtained:
where
Tn is the temperature of the neutrals,
Ti,Ar denotes the temperatures of the ions and the argon,
TOH represents the temperature of the rotating OH molecule,
TN2…q expresses the temperature of the N
2 and other molecules, and
Te denotes the temperature of the electrons. Due to this dependence on the modeled electrical conductivity, the spectrum of the detected signals can be evaluated down to the spectral lines of the individual ions.
Changes in frequencies and the system of grouping of spectral lines of sensed RF signals generated by a plasma discharge can be caused by a change in the behavior of the plasma discharge with a different type of dielectric substrate, including both systematic (thermoplastic, thermoset, according to the type of polymer used, type of filler, type of binder in the composite, etc.) and manufacturing tolerance (differences in the exact chemical composition, differences in the deviations of the parameters of the binder, filler, polymer parameters, etc.). Changes in frequencies and the system of spectral lines can be caused by differences in the morphology of the dielectric material.
The received frequency spectra were obtained during scanning not only during the movement of the plasma over the surface of the samples, but also when passing over their rising and falling edges of the material. It should be noted that the plasma also dynamically interacts with the edges of the samples (front, back, side) during the movement of the samples, since the width of the plasma generated by the nozzle is larger than the width of the samples. The height of the edges of the samples is approx. 5 mm. In the spectral lines, those caused by the intrinsic dynamical effects of the interaction of the plasma and the surface of the material may appear.
One of the causes is, for example, the morphology of the affected material sample, or its 3D geometry and macrostructure. This effect occurs as a response coupling in the EMG field of the plasma and the sample surface depending on the chemical composition and micro-/macro-morphology of the sample material. Therefore, to eliminate these possible instantaneous changes, an accumulation of sk = 64 is used when scanning the spectrum, and the averaged spectrum is further recorded. It is evident from the experiments that the spectrum sensed in this way is stable and does not change either the frequency or the amplitude of the evaluated power.
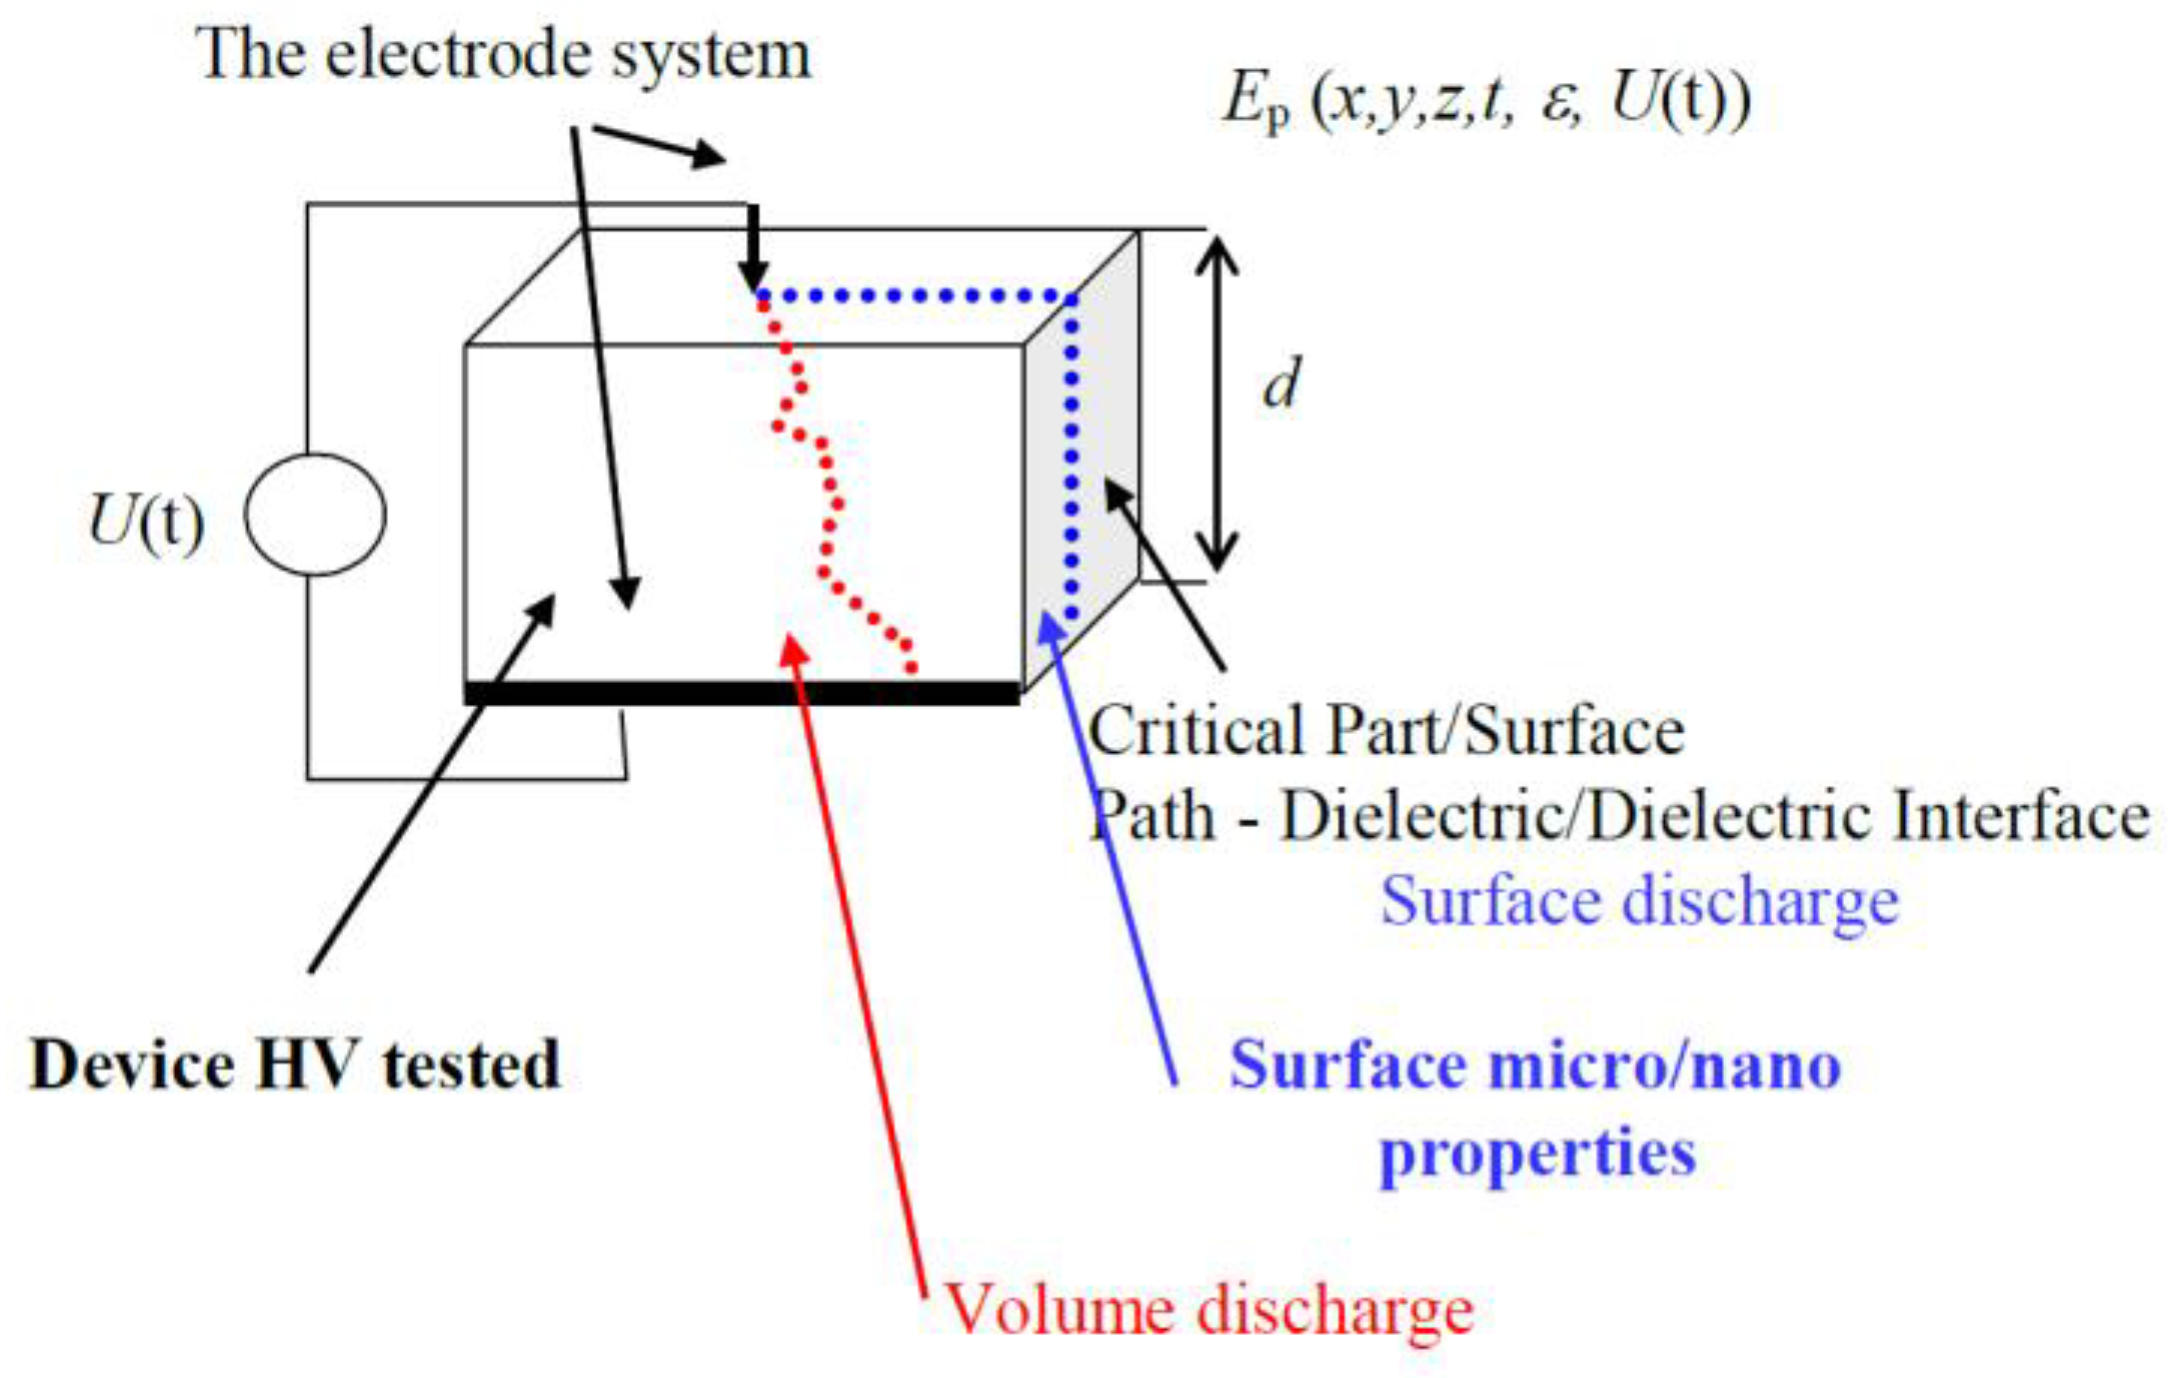
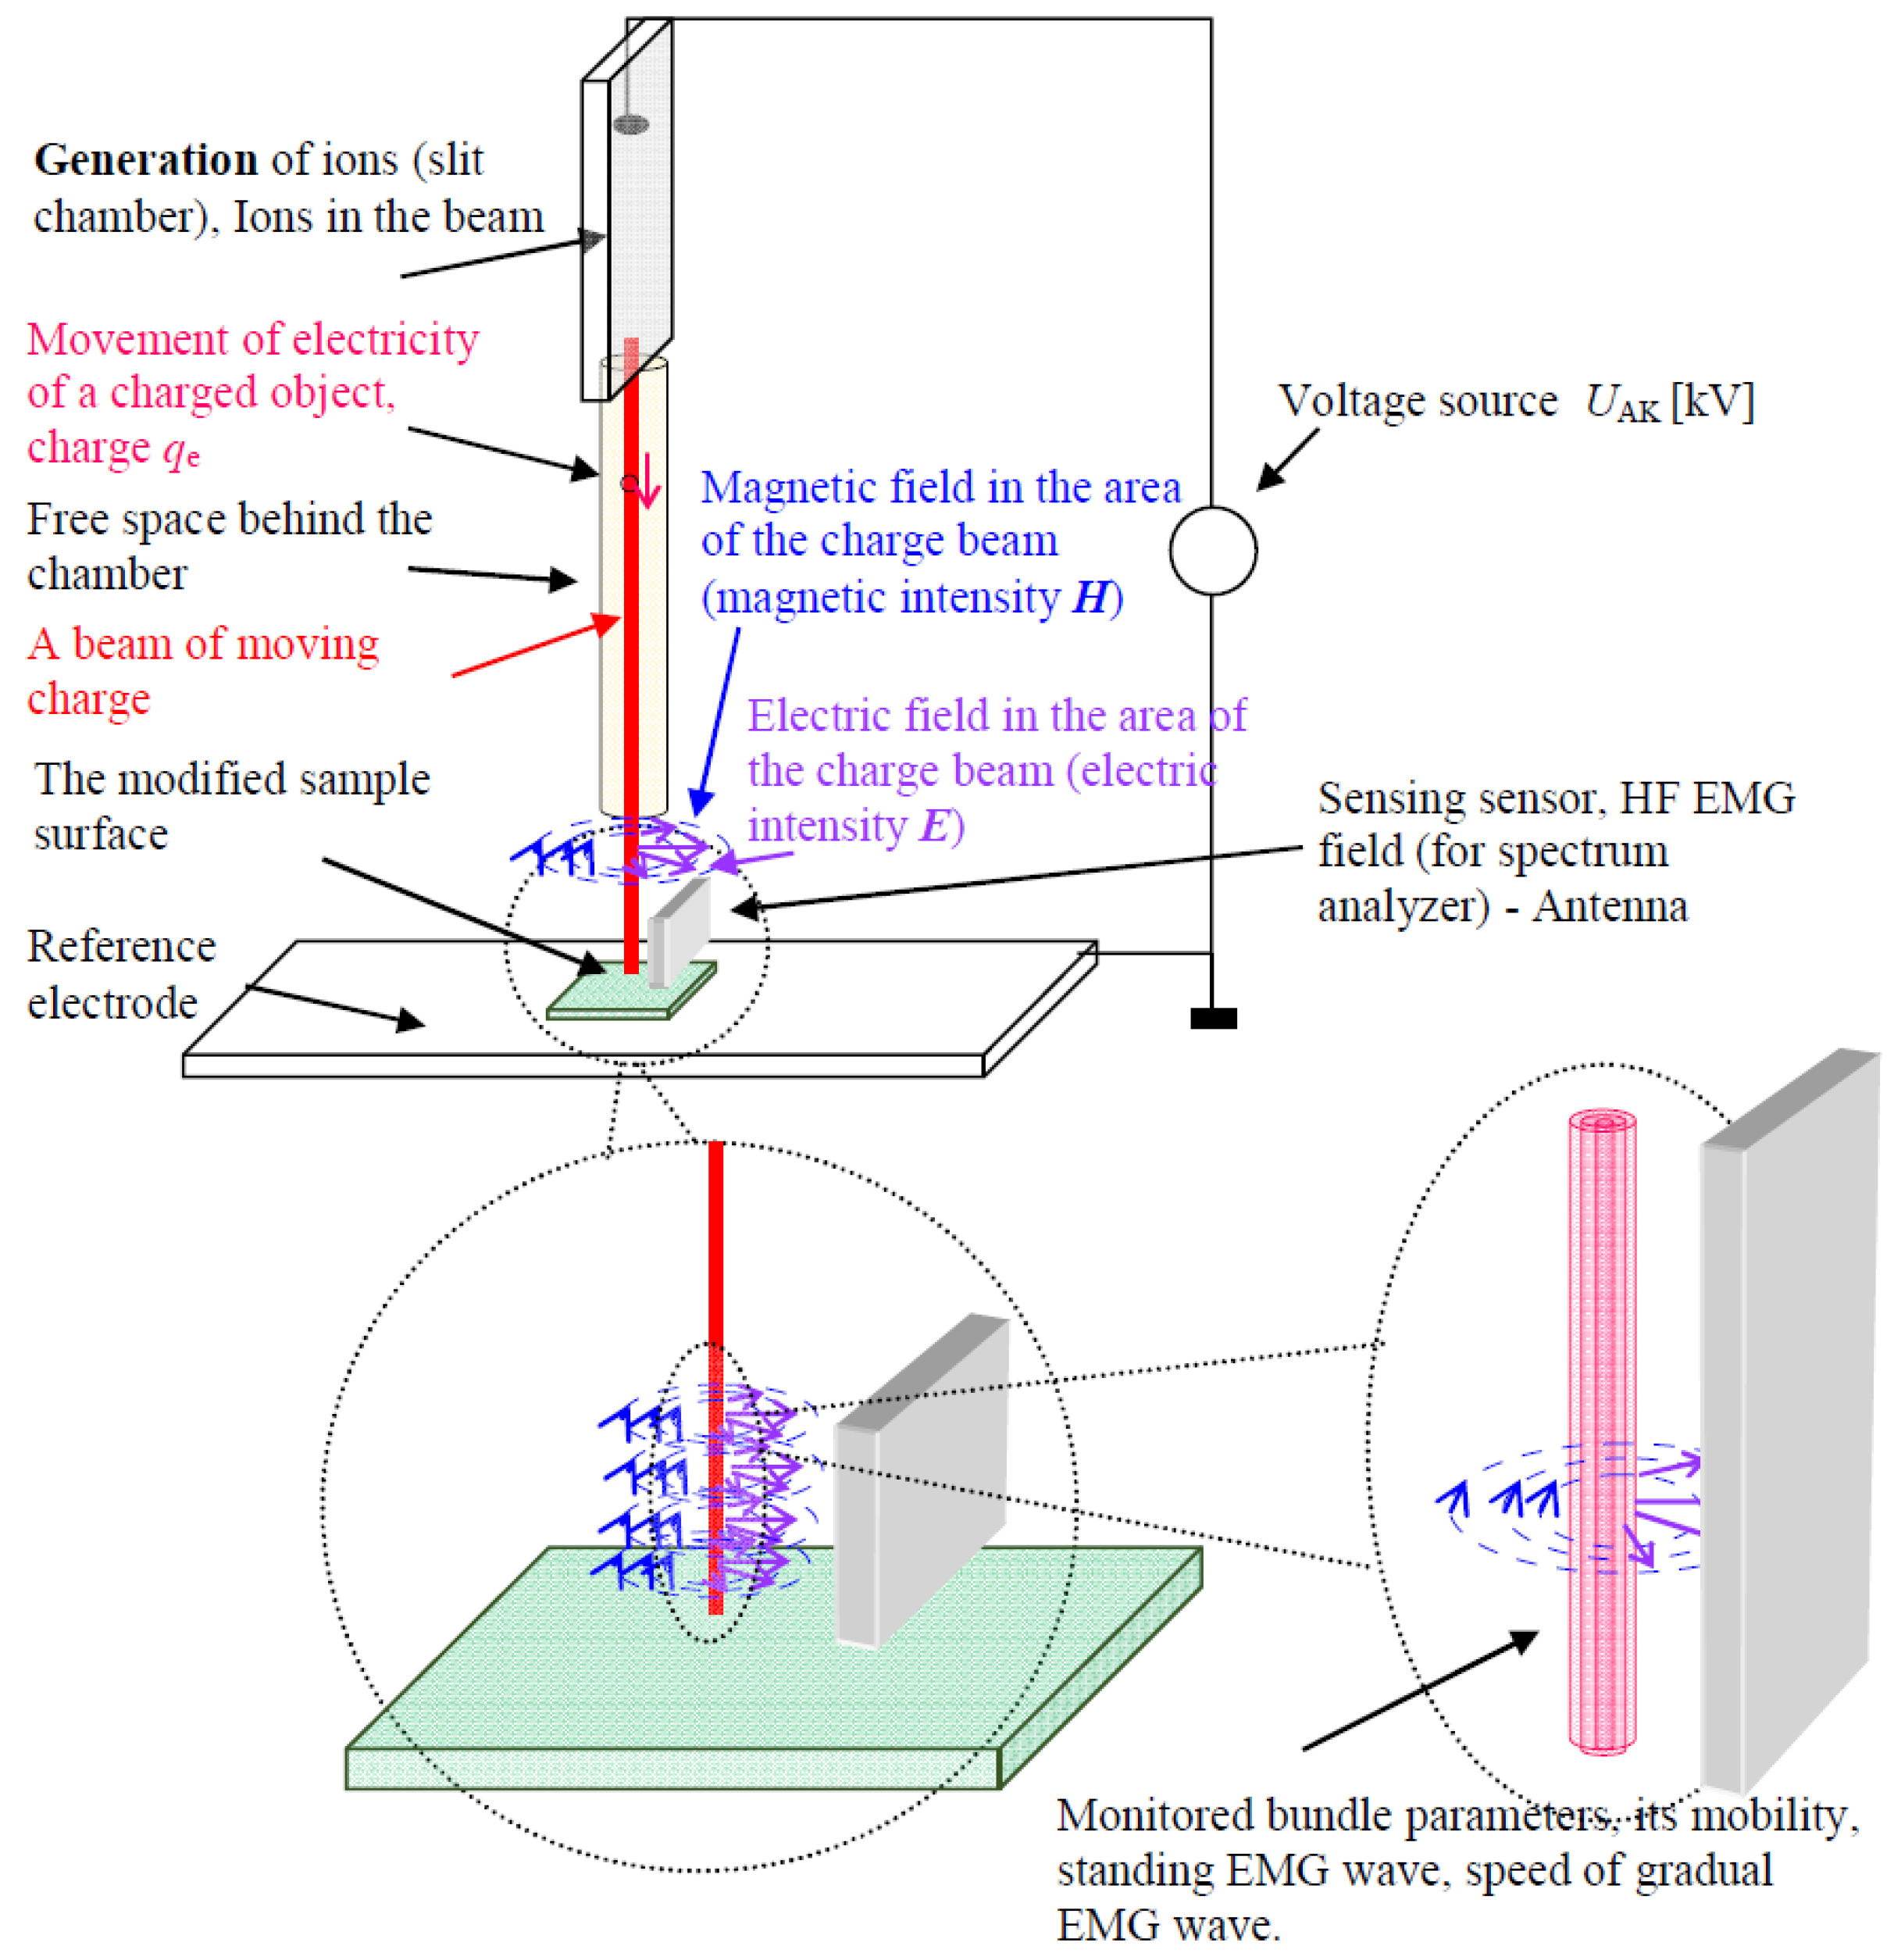
To clarify the measured and recorded frequency spectra, the arrangement of the plasma chamber and the modified surface of the dielectric sample is shown schematically in
Figure 22. To clarify the measured and recorded frequency spectra, the arrangement of the plasma chamber and the modified surface of the dielectric sample is shown schematically in
Figure 21a.
Figure 23 shows a comparison of the power
Ps in the laboratory without an ignited plasma discharge, without switching on the RF power generator and with the RF generator switched on. It can be found that the differences in the frequency and amplitude of the sensed spectrum are in the range of 5 dBm. One can observe the spectral line of the excitation generator at the frequency
fg = 13.56 MHz.
For a quantitative assessment of the quality of the sensed spectrum of signals, it is convenient to convert the power quantity
Pslog from dBm units to mW units.
Then, for example, PsdBm= 5 dBm is the power PsmW = 3.162 mW; PsdBm= −120 dBm is adequate power at PsmW = 1.00 pW; PsdBm = −125 dBm represents the power PsmW = 0.3162 pW. Therefore, for example, the difference in the background power spectrum of the laboratory (PsdBm = −120 dBm and PsdBm = −125 dBm) is ΔPsmW = 0.6837 pW.
The above combined or hybrid modeling approach explains the underlying causes of the measured spectra. These include the shape of the plasma generating chamber, the gas composition, the generator power delivered, the distance from the surface, and the type of sample surface. We will return to the addition of fundamental effects later. For the industrial methodology of monitoring the quality of dielectric surface treatment and long-term comparison of individual products, it is necessary to assess the measured power spectra during surface treatment as follows:
- (A)
The tracking frequencies f in the power spectrum Pslog in the range f = 10–200 MHz.
- (B)
Monitoring the Pslog power spectrum in the range −90 dBm to −80 dBm.
- (C)
Monitoring the Pslog power spectrum in the range of 0 dBm to −80 dBm.
These levels then have continuity and a telling ability in the area of the design of the composition of the gases entering the plasma chamber generator, the reaction with the dielectric surface, the quality of the dielectric materials and their repeatability during production, compliance with the production technology and possibly the prediction of the quality of the surface treatment with the aim of increasing its resistance to surface electrical strength
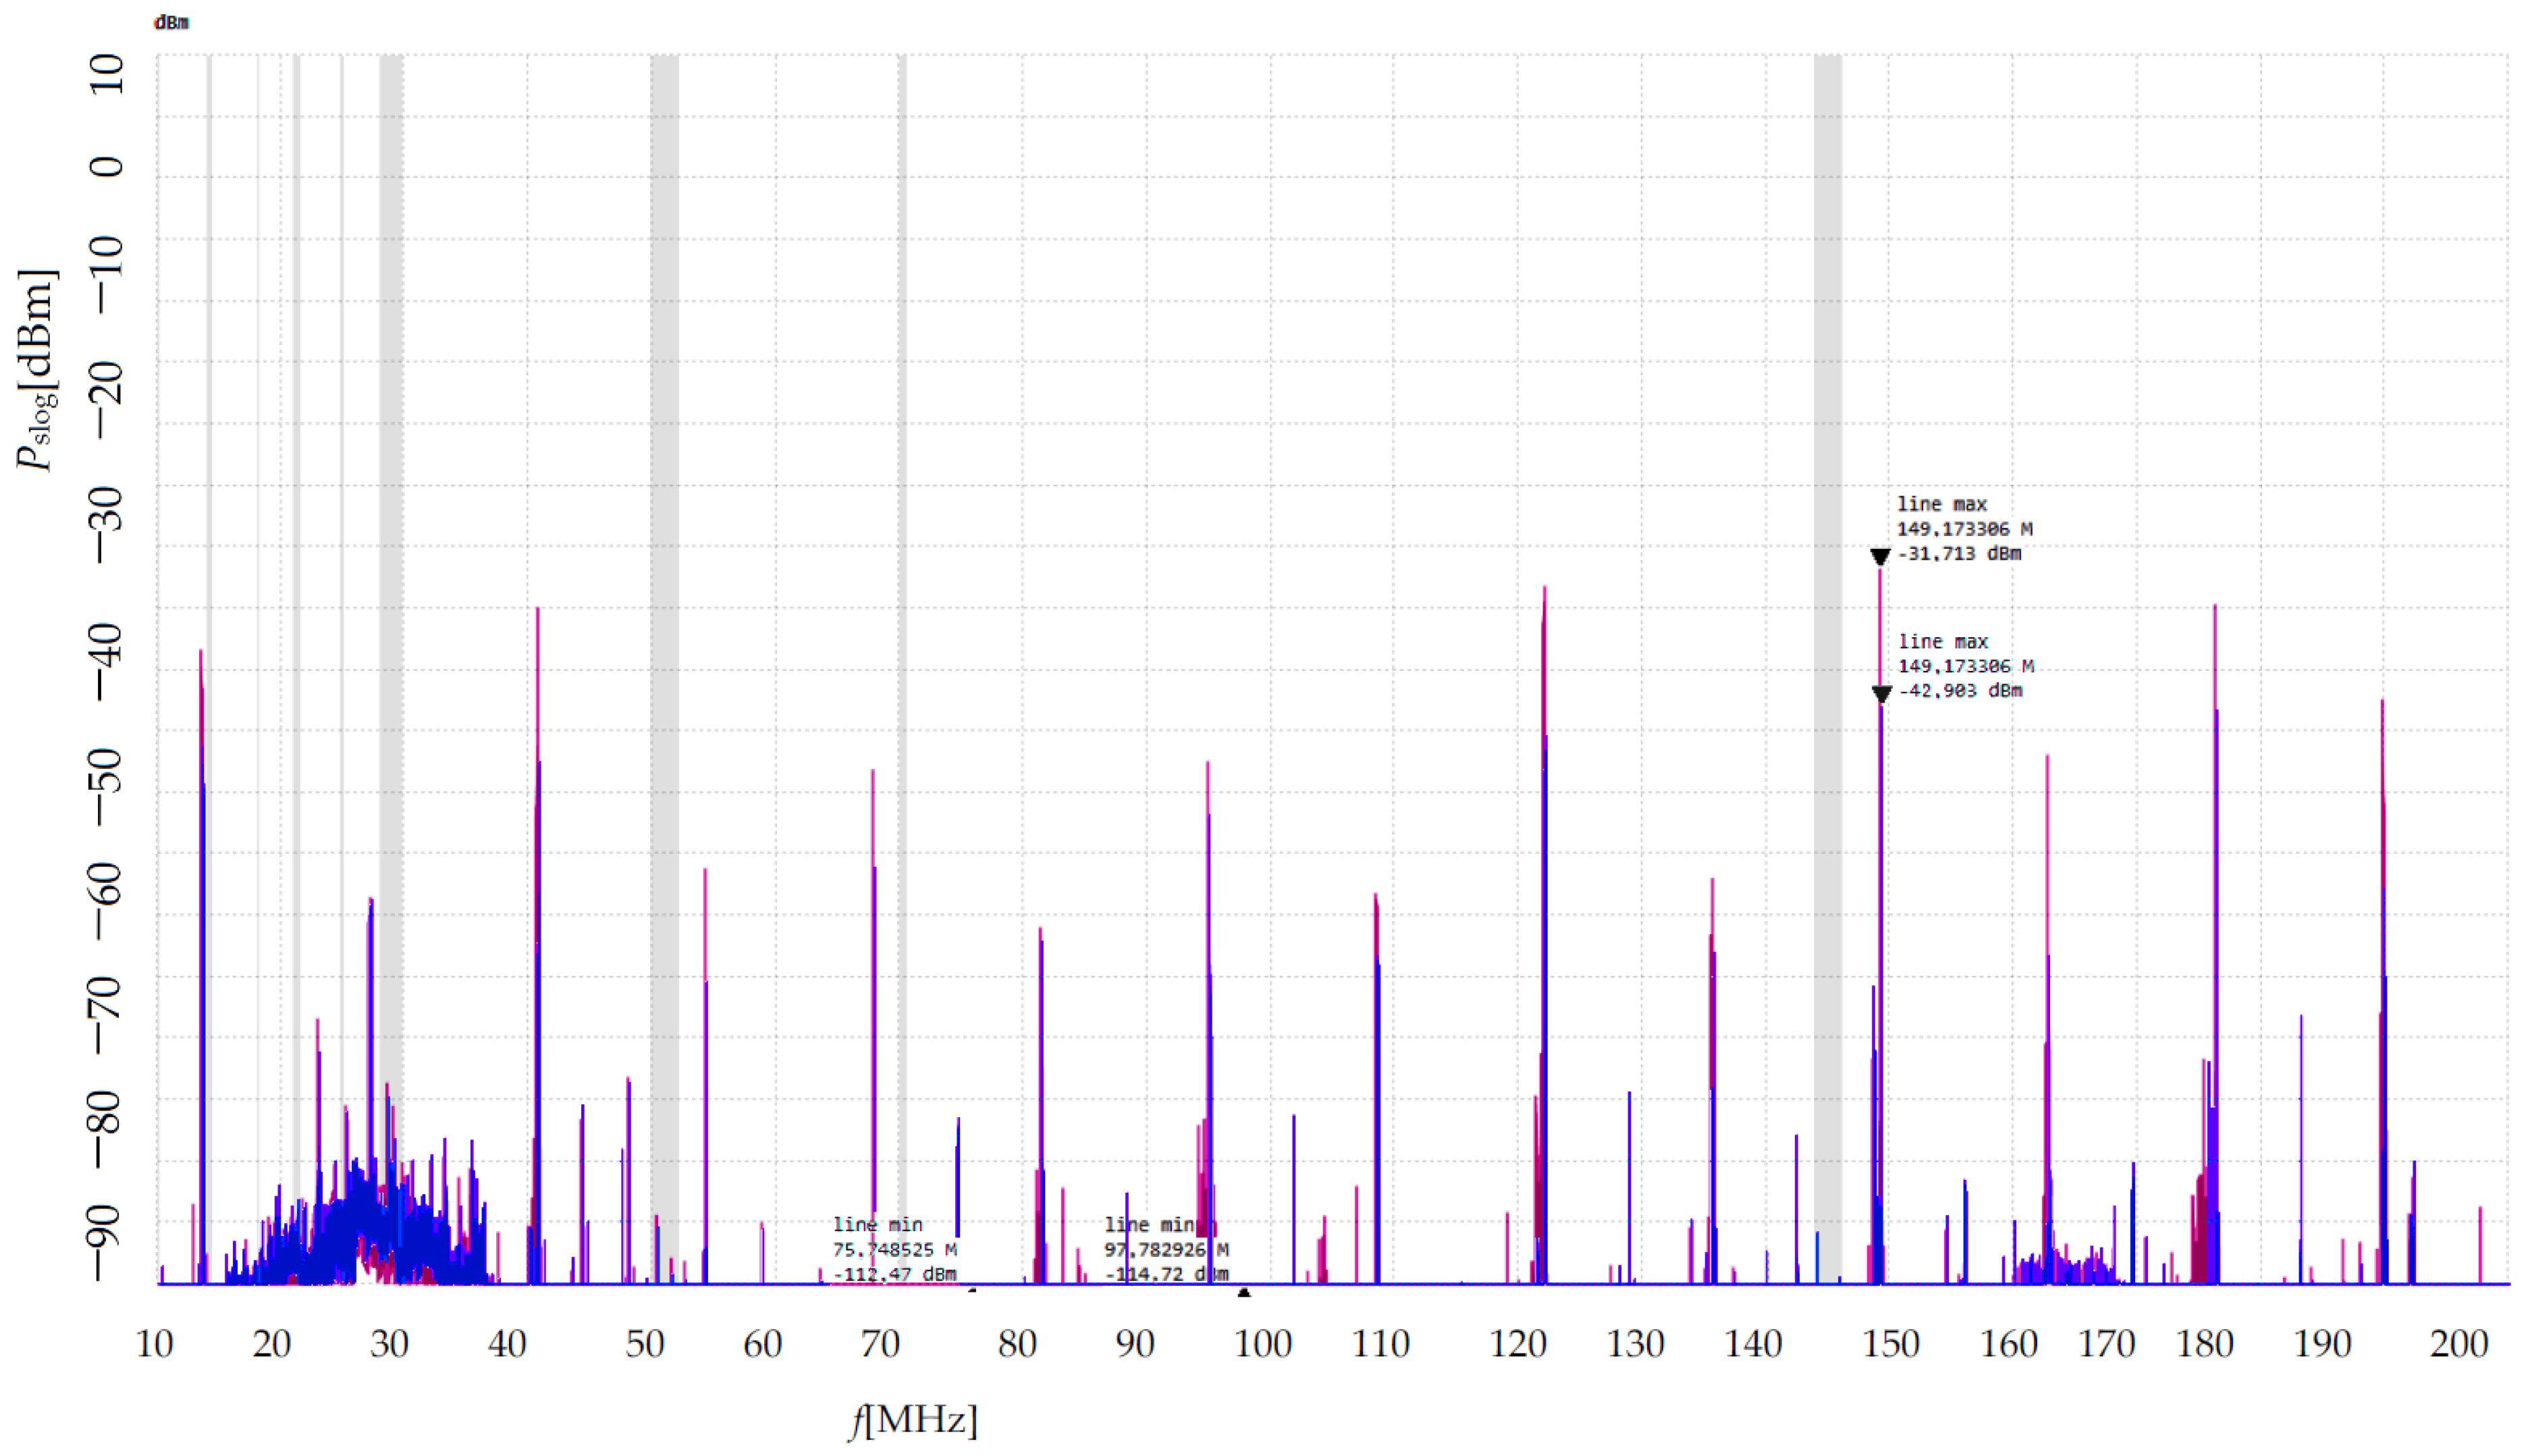
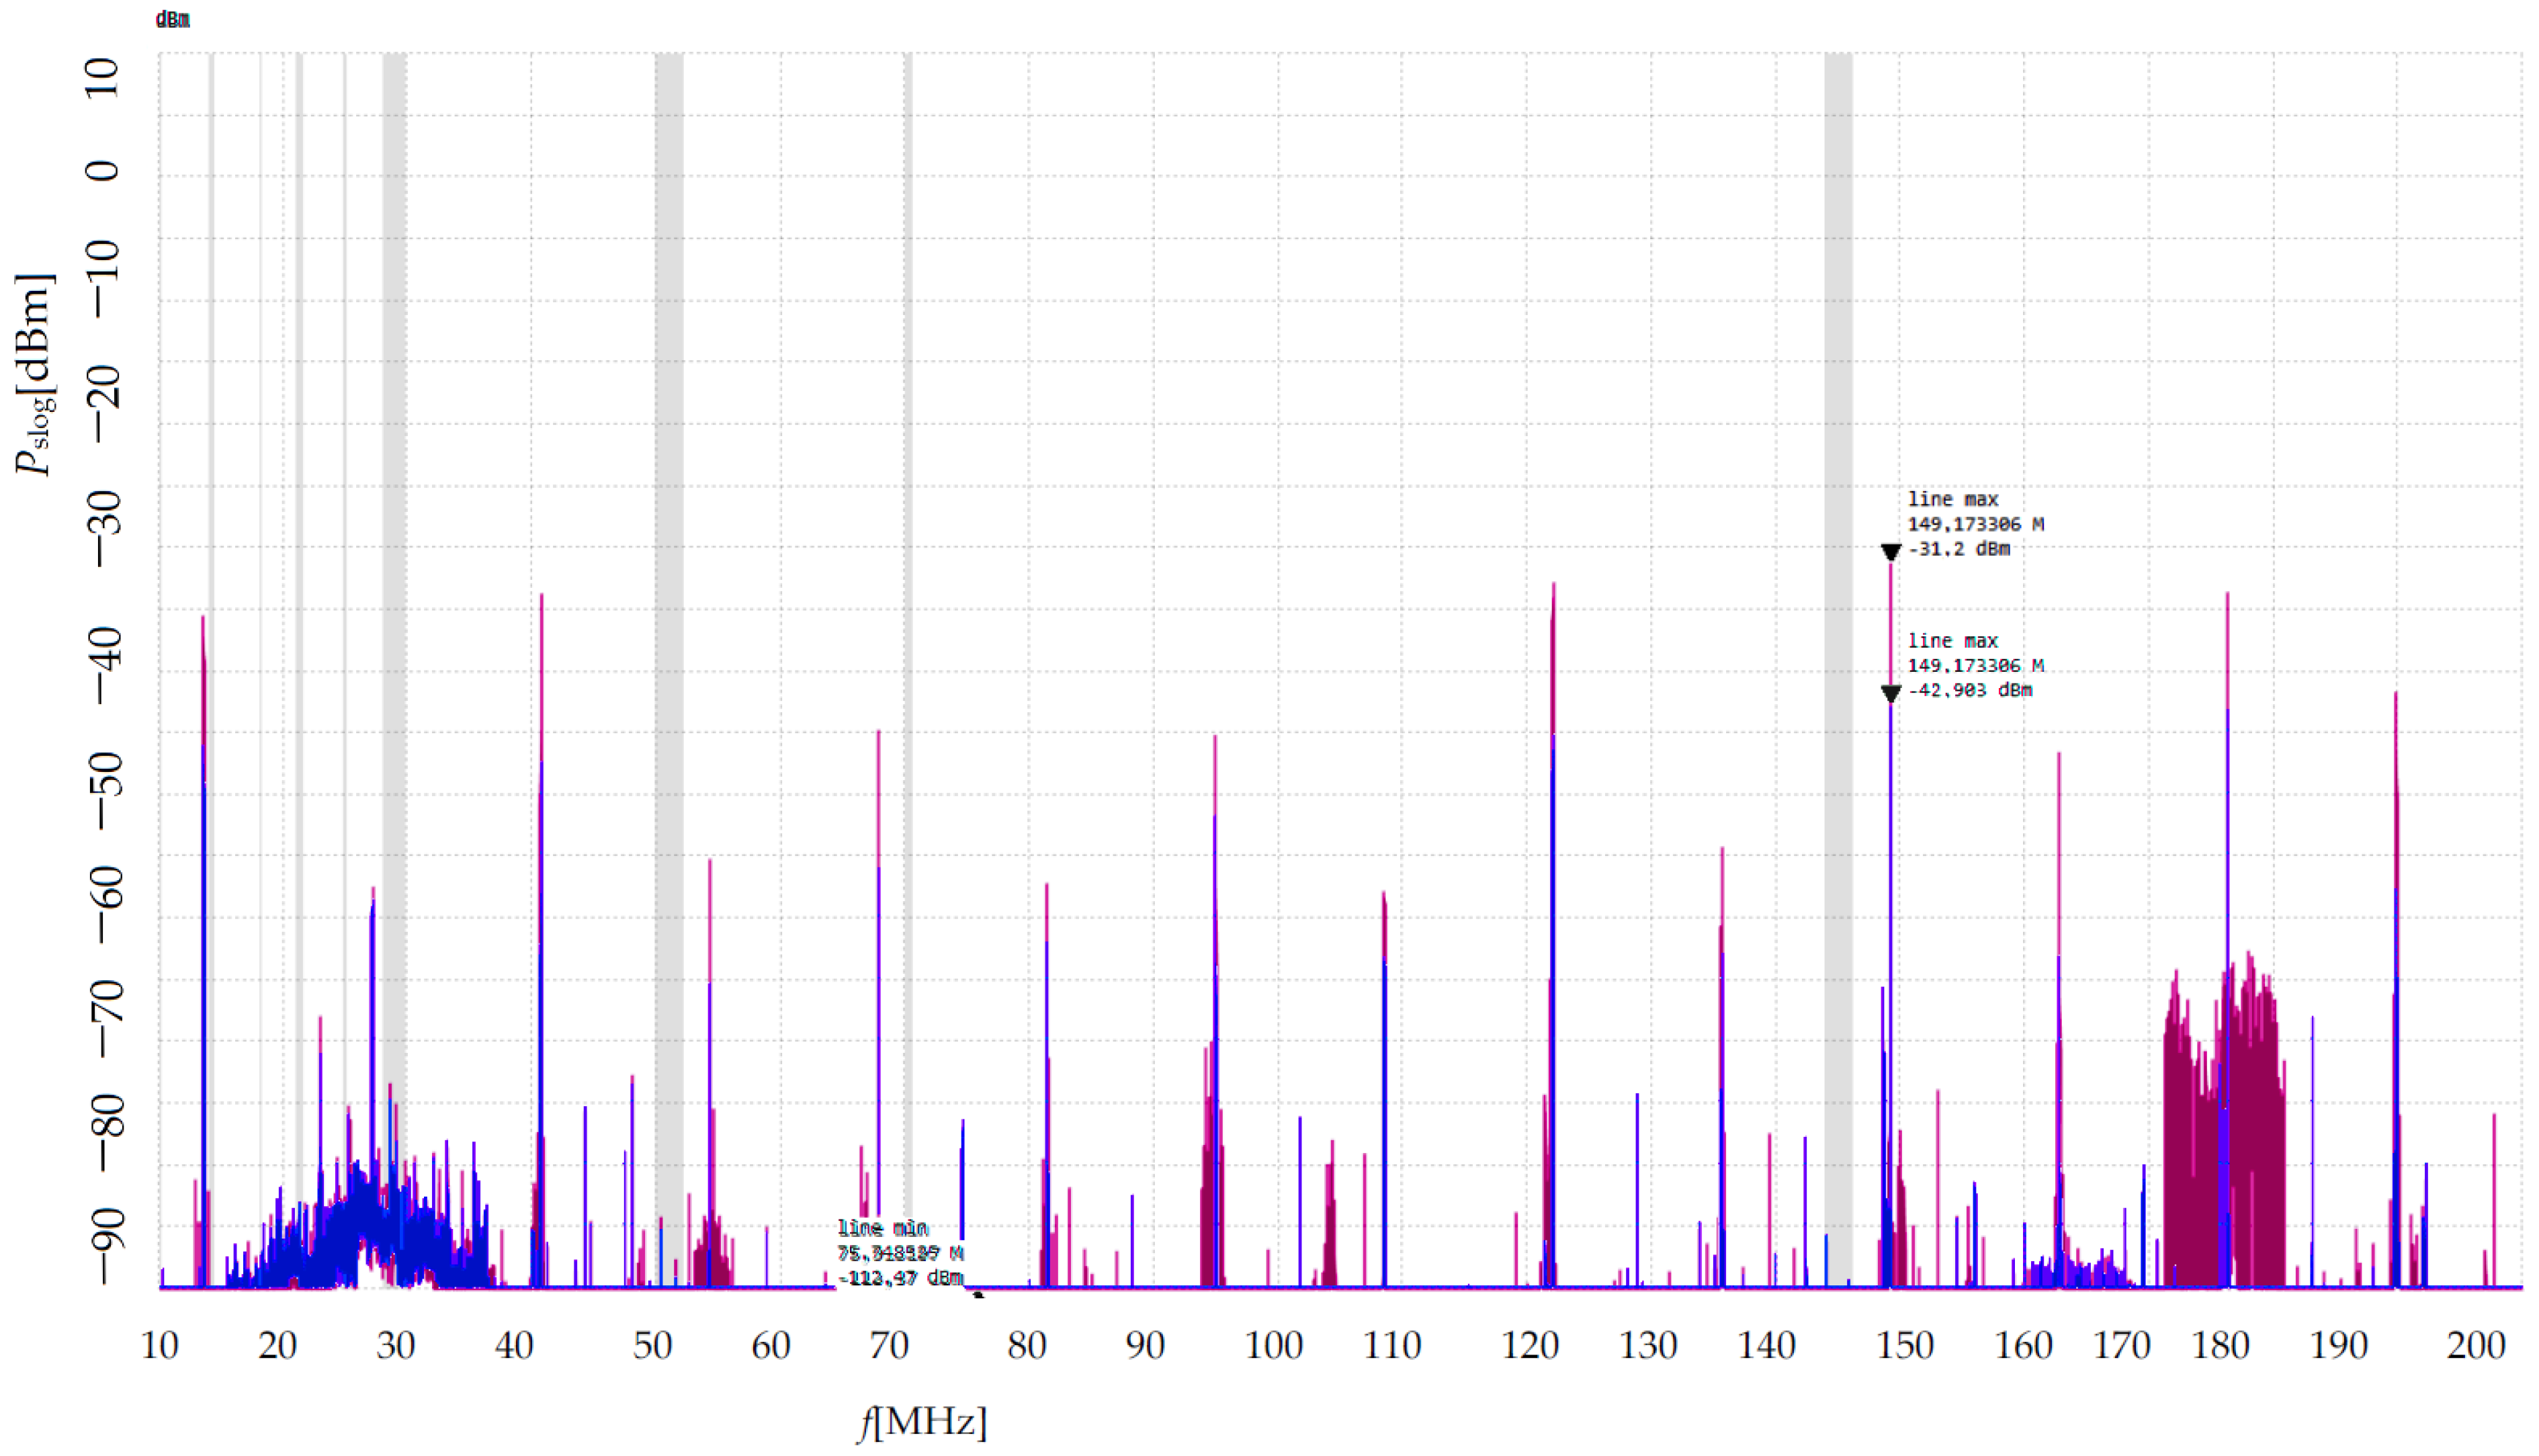
Ep. An example and a simple comparison are shown in
Figure 24 and
Figure 25. In this comparison example, we can see the fundamental differences in the spectra in the
f = 170–180 MHz region. For a basic understanding of the informativeness of recorded power spectra, it is necessary to realize what effects cause power generation in the frequency band regions, as shown in
Figure 26.
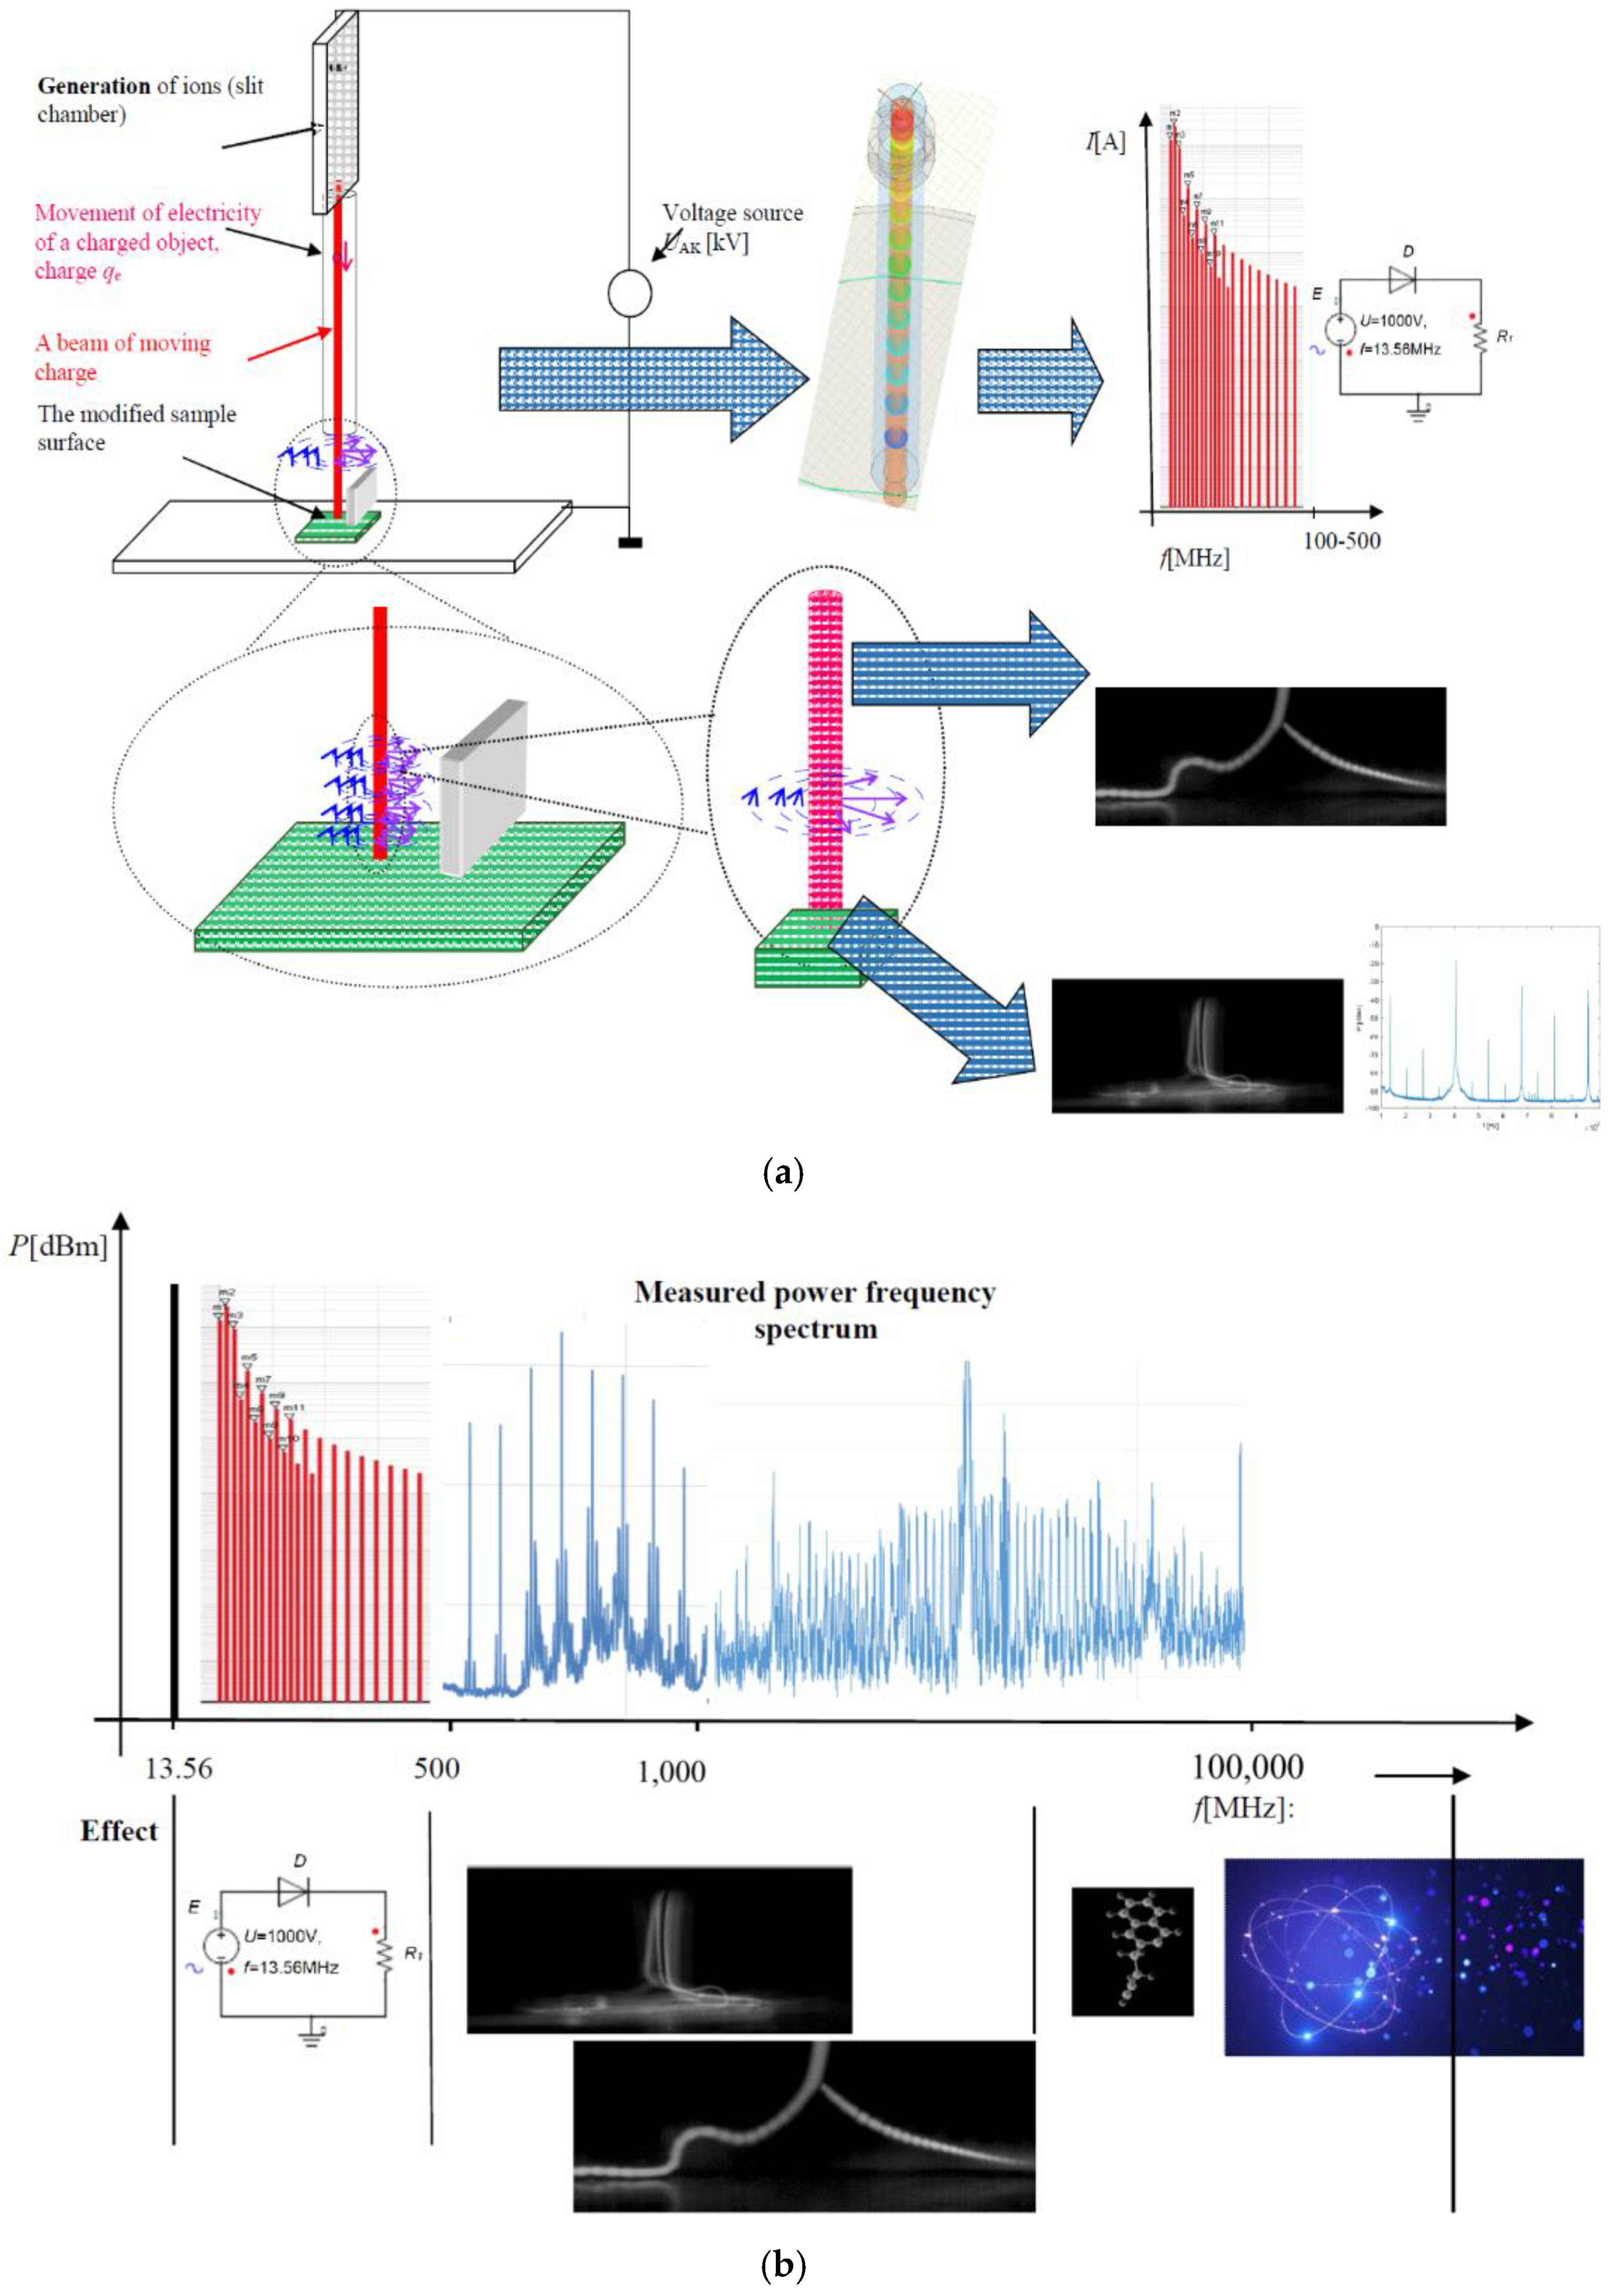
In
Figure 26a, a slit chamber is indicated as a source of plasma discharge that impinges on the modified surface of the dielectric sample. The beam itself behaves as a non-linear element within the framework of burning and maintaining a stable plasma, which can be calibrated and described parametrically [
29]. This entire effect generates a spectrum of typical waveforms up to a frequency maximum of
fmax = 100–500 MHz depending on the gas composition, gas flow, precursors and supplied RF power. Another effect occurs when the beam hits the surface of the dielectric. Depending on the composition of the plume and the power, a high-frequency standing wave may appear, creating characteristic “bead” structures. A standing electromagnetic wave can be described and numerically modeled over the entire length of the discharge beam, as shown in
Figure 18 [
29,
33]. This phenomenon can manifest itself in the frequency spectrum between
f = 20 GHz and 1000 GHz. The composition of plasma and the resulting RF power cause the breakdown of gases into charge carriers such as electrons, ions and other components of molecules that are captured in the electrical conductivity function of the session (5). The movement of charged objects in this way causes the formation of a spectrum, probably up to a frequency of
f = 100 GHz to 200 THz (X PHz). It depends on the supplied RF power, gas composition, precursors, dielectric surface composition, gas flow rate and other parameters.


