Abstract
The aging population has created a significant challenge affecting the world; social and healthcare systems need to ensure elderly individuals receive the necessary care services to improve their quality of life and maintain their independence. In response to this need, developing integrated digital solutions, such as IoT based wearable devices combined with artificial intelligence applications, offers a technological platform for creating Ambient Intelligence (AI) and Assisted Living (AAL) environments. These advancements can help reduce hospital admissions and lower healthcare costs. In this context, this article presents an IoT application based on MEMS (micro electro-mechanical systems) sensors integrated into a state-of-the-art microcontroller (STM55WB) for recognizing the movements of older individuals during daily activities. human activity recognition (HAR) is a field within computational engineering that focuses on automatically classifying human actions through data captured by sensors. This study has multiple objectives: to recognize movements such as grasping, leg flexion, circular arm movements, and walking in order to assess the motor skills of older individuals. The implemented system allows these movements to be detected in real time, and transmitted to a monitoring system server, where healthcare staff can analyze the data. The analysis methods employed include machine learning algorithms to identify movement patterns, statistical analysis to assess the frequency and quality of movements, and data visualization to track changes over time. These approaches enable the accurate assessment of older people’s motor skills, and facilitate the prompt identification of abnormal situations or emergencies. Additionally, a user-friendly technological solution is designed to be acceptable to the elderly, minimizing discomfort and stress associated with using technology. Finally, the goal is to ensure that the system is energy-efficient and cost-effective, promoting sustainable adoption. The results obtained are promising; the model achieved a high level of accuracy in recognizing specific movements, thus contributing to a precise assessment of the motor skills of the elderly. Notably, movement recognition was accomplished using an artificial intelligence model called Random Forest.
Keywords:
ambient assisted living; MEMS; Internet of Things; edge machine learning; IMU; HAR; healthcare 1. Introduction
Life expectancy has increased due to advancements in the medical field and the evolution of technological solutions that support medicine. These advancements include diagnostic imaging [1], analyses of biomedical signals [2], the use of artificial intelligence to read medical records and formulate therapeutic plans [3], virtual reality for training and practicing surgical procedures [4], health trackers [5], augmented reality [6], and emotional state recognition through facial expressions [7]. The rapid increase in the aging population leads to challenges such as cognitive impairment and severe health conditions, negatively affecting independence, quality of life, and the sustainability of healthcare systems [8]. Several additional factors must be considered, including the shift in the traditional family model (where women typically cared for older adults), reduced opportunities for socialization, cuts in financial resources for the healthcare system, and a lack of an adequate social assistance system.
An effective home care system can mitigate these issues by reducing public spending and improving quality of life. Digital technologies powered by artificial intelligence can create innovative solutions that enhance intelligent home care systems for older adults. These systems can monitor vital signs and daily activities [9] and detect critical situations that require immediate intervention. Recognizing daily activities is crucial for maintaining a healthy lifestyle, supporting patient rehabilitation, and identifying changes in older adults’ activities that may indicate serious health problems.
Task identification is achieved using artificial intelligence that analyzes activity data from various sources, including wearable sensors, smartphones [10], photographic devices, and CCTV cameras [11]. Moreover, since many older adults experience social isolation, digital assistive technologies can foster connections with family members and other stakeholders, enhancing their quality of life.
In this context, an IoT application based on MEMS sensors integrated with a state-of-the-art microcontroller (STM55WB) was developed for the recognition of movements such as grasping, circular movement, walking and leg flexion. The collected data are processed using machine learning algorithms and transmitted to a monitoring system server. The console’s real-time visualization of detected movements enables healthcare professionals to analyze movement trends and gain valuable insights into the motor status of elderly individuals. This information allows for appropriate therapeutic actions.
This system aims to enhance the quality of life for older adults by providing continuous support and reducing the need for hospital interventions. Additionally, it is designed to be energy-efficient and cost-effective, promoting its sustainability for widespread adoption. Below, we outline the system’s implementation steps, from hardware configuration to data analysis and result visualization. This article is organized as follows: an introduction outlining the objectives and significance of integrated digital solutions for the care of older adults; Section 2, which describes the technologies used in healthcare systems, focusing on IoT wearable devices based on MEMS sensors for movement recognition; Section 3, which includes various testimonies related to the study; Section 4, detailing the methodology for analyzing movements (grasping, arm circular motion, leg flexion, and walking) and implementing the continuous monitoring system; Section 5, presenting the results of the study and highlighting the model’s accuracy in recognizing specific movements and assessing motor skills; Section 6, in which we analyze the qualitative aspects of the methodology and the technology’s acceptability and usability based on the results; and finally, the Section 7 summarizes the main findings of the study and discusses future implications for technology in enhancing the quality of life and independence of older adults.
2. IoT and MEMS Technologies
Ambient Assisted Living (AAL) uses IoT technology and artificial intelligence to support older people, making the home smart [12,13]. The combination of IoT and AI creates advanced platforms to analyze the data collected, improving medical diagnosis and treatment [14]. With networks such as 5G/6G, data are transferred to cloud systems for telemedicine and remote robotic surgery.
Wearables with MEMS sensors monitor diseases such as high blood pressure, heart failure, obesity, and diabetes, improving home care and reducing healthcare costs [15]. MEMS sensors, integrated with artificial intelligence models, recognize human activities (HARs) with high accuracy [16]. Sensors for activity recognition include wearable physiological sensors, IR motion sensors, acoustic sensors, household objects, magnetic sensors, environmental sensors, and video cameras [17]. However, video cameras have privacy and image quality concerns, so MEMS sensors are preferred for activity monitoring [18]. The technological development of MEMS sensors has made it possible to obtain reliable data on movement and orientation, stimulating research in various application fields, such as the study of synthetic touch sensors [19].
The main MEMS sensors are accelerometers, gyroscopes, and magnetometers (IMUs Inertial Measurement Units). Accelerometers measure linear acceleration, gyroscopes measure angular velocity, and magnetometers measure the strength of the magnetic field. These sensors can be combined to form nine-axis inertial sensors, which are used to determine motion, orientation, and direction (Figure 1). The IMU can accumulate errors over time, but filtering and merging sensor data can reduce these errors.
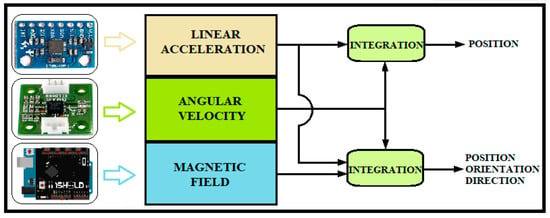
Figure 1.
IMU fusion.
The Kalman filter is a widely used algorithm for estimating unknown variables, minimizing mean square error. For non-linear movements, techniques such as the extended Kalman filter (EKF) or the unscented Kalman filter (UKF) can be used.
MEMS are used in healthcare to monitor the health of the elderly, collect vital data, and detect hazardous situations. Thanks to edge computing, they can process data locally, reducing cloud traffic. IMUs are used in various medical fields, from physiological monitoring to fall risk assessment and rehabilitation.
3. Related Work
There is a vast amount of literature on using inertial sensors for position and orientation estimation, addressing various application fields and the challenges associated with estimating and parameterizing orientation [20]. The accuracy of these predictions depends on the choice of the prediction model and the algorithm employed [21]. Improving accuracy remains a significant research challenge.
Researchers have gathered diverse experiences in building human motion tracking models based on Inertial Measurement Units (IMUs). These include introducing new sensing techniques, positioning sensors at different body parts, and combining them with wireless communication technologies. Huang et al. [22] examined the strengths and weaknesses of approaches based on IMUs and multi-view imagery. Supporting their findings, Prasad et al. [23] demonstrated that it is possible to identify six fundamental human activities using a simple sensor. Ronao et al. [24] collected smartphone activity identification data and applied a hidden Markov model to classify the six typical human activities. Mo et al. [25] developed an online physical activity recognition system using wireless wearable sensors that can be recharged through body energy harvesting. This recognition was achieved using a Random Forest (RF) algorithm. Yan et al. [26] conducted an in-depth investigation into using sensors for healthcare, examining all aspects related to the design of human activity recognition (HAR) systems. They analyzed different types of wearables, environmental sensors, and hybrid sensors, highlighting their strengths and weaknesses. Additionally, they elaborated on data preprocessing, feature learning, and classification techniques. In particular, they focused on manual and automatic feature extraction creation.
Several applications have been developed with interesting methodological approaches. Tao et al. [27] proposed a new method for recognizing human activities using an attention mechanism with multiple IMU sensors placed at various body locations. The captured signals were preprocessed in the frequency domain, and the most discriminating features were extracted. They introduced a sensor attention mechanism to determine the importance of specific sensors integrated into a trainable deep neural network (DNN) layer. A focus-based casting module was utilized to represent the features precisely. Five public datasets covering daily activities, sports, and automotive maintenance tasks were used to evaluate their model. The results demonstrate superior performance compared to state-of-the-art methods.
Qing [28] developed a model to correct drift and attitude angle errors in MEMS sensors and the Zigbee network for capturing human movement. He employed a Kalman filter algorithm to compensate for errors, integrating information from the gyroscope, accelerometer, and magnetometer. To enhance tracking accuracy, he applied an algorithm based on sensor sensitivity and another that considered the connections and limitations of human joints. Testing involved sensor data from the wrists, elbows, and shoulders of five subjects across 40 postures. The average essential tracking accuracy was 0.075 m, which improved by 15% with advanced algorithms. Additionally, a backpropagation (BP) neural network was used for the motion identification module, aiming to create a human recognition system on the Android platform to detect falls and generate early alarms, resulting in a more efficient and accurate model than others.
Xefteris et al. [29] studied the performance of wearable Inertial Measurement Unit (IMU) sensors and vital signs for human activity recognition (HAR), specifically in patients with motor disorders. They employed a feature selection (FS) technique [30] to extract the most relevant features from the PAMAP2 public dataset [31], which includes data from three IMUs, a heart rate sensor, and a temperature sensor. Measurements were recorded from nine subjects engaged in 12 different activities. The study utilized five classifiers—CART, Random Forest (RF), k-nearest neighbors (kNN), Linear Discriminant Analysis (LDA), and Support Vector Machines (SVM)—alongside feature fusion techniques like concatenation and Principal Component Analysis (PCA). The experiments revealed that the RF classifier, initially achieving an accuracy of 86.64%, improved significantly with different blending modes, reaching approximately 95% with RF and CART. In particular, the Gradient Boosting Machine (GBM) stack late fusion mode further enhanced accuracy. The best feature selection technique identified was Recursive Feature Elimination (RFE). When comparing the results with other studies using the same dataset, the methods applied in this study demonstrated the highest performance.
Yang et al. [32] developed a wearable device with multiple sensors to collect muscle activity and movement data simultaneously. Instead of using EMG electrodes, they utilized air pressure sensors [33,34] to measure muscle activity more practically and cost-effectively. The prototype includes a control module, an IMU, an air pressure module, and a power module. Researchers collected data from seven men and one woman performing 11 activities over three hours. The extracted features were used as input for five classification algorithms: k-nearest neighbors (kNN), decision trees (DT), naïve Bayes (NB), Support Vector Machines (SVM), and Random Forest (RF). They conducted three classification experiments: Activity Pattern Classification. (APC), Movement Classification (MC), and Combined Classification (CC). The results indicate that DT, NB, and RF performed best, with CC achieving the highest accuracy, precision, recall, and F-measure averages. This highlights the performance improvement resulting from integrating air pressure capabilities into the device.
Patil et al. [35] created a model that combines LiDAR signals and inertial sensors to estimate human 3D poses in real time. This approach addresses the limitations of vision-based, IMU-based, or heterogeneous sensor methods. LiDAR data track body position, while IMU data estimate the orientation and position of joints. The study used an Ouster OS-0 LiDAR sensor and Xsens IMU sensors to monitor and reconstruct the pose on a 3D avatar. Subjects were asked to walk, sit, and move toward a table to test the system. The system’s accuracy was measured, demonstrating an error margin of 2.82 cm for the pelvis and 2.42 cm for the foot. This confirmed the enhanced accuracy of tracking human movement using multiple heterogeneous sensors.
4. Materials and Methods
In innovative healthcare, monitoring behaviors and analyzing the movements of older adults provides valuable insights for diagnostic and therapeutic planning. Sensors allow for the recognition of a range of human activities, from simple to complex. Currently, various sensors employing different technologies are available [36]. This article presents a technology-based system (MEMS) that detects patient movements and transmits this information to a monitoring system. The motor state is assessed by analyzing the recorded movements. To achieve this, a miniature sensor node, known as a MEMS Inertial Measurement Unit (IMU), is integrated into a Microcontroller Unit (MCU). The motion detection results are also displayed on smartphones, using BLE module (Bluetooth Low Energy). Data preprocessing and feature extraction occur onsite, which minimizes data transmission and reduces the load on the host machine. The MEMS data related to the activities performed are processed using sci-kit-learn to identify movements such as grasping, circular arm movement, walking, and leg flexion. The system is powered by the STM32WB55 microcontroller (STMicroelectronics NV-Agrate, Agrate Brianza, Italy), facilitating the development of IoT applications that utilize Edge Machine Learning technology [37] (Figure 2).

Figure 2.
Functional diagram.
The following is a description of the device used, aimed at enhancing the technical understanding and reproducibility of the system. It highlights the performance optimizations and safety measures that have been implemented. Information regarding the firmware components offers insight into the interaction between hardware and software, ensuring integration and compatibility with other technologies. Additionally, the firmware description emphasizes advancements such as Bluetooth Low Energy and dual-core microcontrollers. Furthermore, by providing firmware details, this document supports research by serving as a benchmark for other researchers working on similar projects, ultimately facilitating knowledge-sharing and collaboration.
4.1. Hardware
The STM32WB55G device is a dual-core wireless microcontroller with Bluetooth® 5.3 and IEEE 802.15.4. It integrates an Arm® Cortex-M0®+ for low-level operations and a Cortex-M4® for the main application. It manages Bluetooth and 802.15.4 communications through a dedicated controller. It supports DSP instructions, includes a built-in debugger and programmer, and is powered by a CR2032 battery. It has flash memory up to 1 Mbyte, SRAM up to 256 Kbytes, a Quad-SPI interface, and a 0.96-inch OLED display. It incorporates the ISM330DHCX module with a 3D digital accelerometer and gyroscope, and advanced features such as SPI/I2C interface, sensor hubs, intelligent FIFOs, machine learning cores, a pedometer, and a temperature sensor (Figure 3). The firmware release version is 1.2.0, and it was released on 7 November 2023.
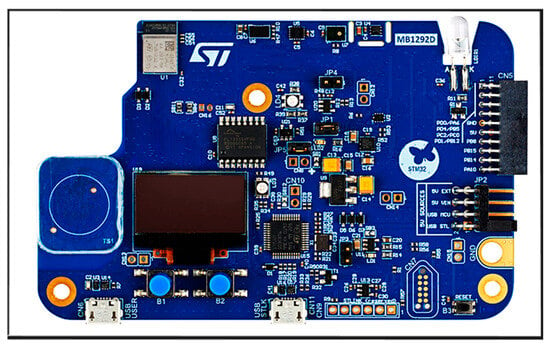
Figure 3.
STM32WB55G lay-out (font: ST User Manual UM2825).
The cost of the device is approximately USD 68. This cost-effectiveness, combined with its energy efficiency, makes the device a viable option for widespread adoption in health monitoring systems.
4.2. Software
Several software applications were used to develop the prototype. STM32CubeWB supports the overall development process, while STM32CubeMX configures the microcontrollers. STM32CubeIDE is a multi-OS development tool, and STM32CubeProgrammer is responsible for programming STM32 products. Additionally, X-Cube-MEMS1 collects environmental and motion data.
The integrated development environment (IDE) facilitates configuration, code generation, compilation, and debugging. The development phases include initial configuration with STM32CubeMX, programming, debugging using STM32CubeProgrammer, and performing firmware updates for the Bluetooth® LE configuration. Motion data are gathered through X-Cube-MEMS1, and Figure 4 illustrates the various phases of prototype development.

Figure 4.
Flow chart of the prototype’s development.
The software is activated using the “ST-LINK” function. To configure the Bluetooth® LE hardware, the coprocessor’s firmware must be updated before flashing the BLE wireless stack. This process occurs in two steps; first, initiate the Firmware Update Service (FUS), ensuring that the correct rail is selected, and then update the Bluetooth LE wireless stack. The firmware release version is 1.2.0, which was released on 7 November 2023. Updating the FUS is crucial to ensure security and compatibility and introduce new features, all essential for the optimal performance of the Bluetooth® LE configuration. Download the latest version of STM32CubeProgrammer and the FUS firmware from the STMicroelectronics website to perform the update.
Connect the STM32WB55G board to a computer using a USB cable and launch STM32CubeProgrammer. Verify the current FUS version on the board, load the new FUS firmware file, and follow the on-screen instructions to complete the update. Finally, confirm that the new FUS version has been successfully installed.
Data Acquisition
The continuous monitoring of older adults is essential for ensuring their safety and well-being. As people age, they may experience a decline in motor skills, increasing their risk of falls and other medical emergencies. To tackle these challenges, it is crucial to develop monitoring systems that are accurate, reliable, user-friendly, and acceptable to older individuals.
In this context, the proposed system employs advanced technologies, including the MEMS sensors and the STM32WB55 microcontroller, to detect and analyze the movements of elderly individuals. This system is designed to integrate the ongoing, real-time monitoring of daily activities. The data collected by the sensors are processed and analyzed using machine learning algorithms, such as Random Forest, to classify activities and identify any anomalies.
Monitoring patient behavior and tracking the physical movements of the hand and arm are essential for the early detection of any abnormalities or changes in movement patterns that may signal emerging health problems. Grip is crucial for assessing hand strength and coordination, which are essential for everyday tasks such as lifting objects or using tools. The flexion of the legs provides useful indications to understand the conditions of stability and balance. In addition, it allows for the early identification of musculoskeletal pathologies. Circular arm motion analysis helps understand the mobility and strength of the upper extremities, which are important for lifting objects or dressing. Walking is a key indicator of overall mobility and balance, and monitoring this movement can help prevent falls and assess the need for rehabilitation interventions. Continuous monitoring enables healthcare professionals to intervene quickly when anomalies are detected, thereby enhancing the safety and well-being of older patients. Additionally, the collection of long-term data allows for the personalization of rehabilitation programs and facilitates ongoing progress monitoring over time.
In intelligent care, the human activity recognition (HAR) system monitors patient behavior and captures data on the physical movements of the hand and arm, offering valuable guidance for diagnostic and therapeutic support. These physical movements not only provide essential information, but also interact with the environment. In a smart home, specific actions can be controlled through gestures, such as adjusting light intensity, changing radio volume, and turning appliances on or off [38].
A HAR model primarily consists of three phases: data collection, feature extraction, and classification. Recent improvements in algorithms mainly focus on enhancing the extraction and classification steps. However, the quality and size of the raw data collected significantly impact the model’s efficiency and accuracy. For inertial data acquisition, the X-CubeMEMS1 software (v.11.1.0, released on 16 December 2024) enhances the functionality of the STM32Cube. It is a comprehensive package that includes drivers capable of recognizing sensors and collecting data on temperature, humidity, pressure, and motion. This software is compatible with STM32CubeMX and can be downloaded and installed directly within it. It also includes advanced motion libraries as middleware.
For data fusion, the MotionFX library implements a sensor fusion algorithm that utilizes a digital filter based on Kalman theory [39] to combine data from multiple sensors and mitigate the limitations of individual sensors. The six-axis sensor fusion process relies only on accelerometer and gyroscope data. While it has lower computational requirements, it does not provide information on the device’s absolute orientation, making it suitable for fast movements where absolute orientation is not necessary.
For inertial signals, the ISM330DHCX module, which includes an accelerometer and gyroscope, is utilized. This module represents the latest generation of sensors and offers improved accuracy and performance compared to previous STM sensors. A noteworthy feature is the integrated machine learning core (MLC), which serves as a classification engine based on decision tree logic. While earlier inertial sensors had 256 nodes, the new models now include 512 nodes. They employ eight configurable decision trees to process information, enabling them to capture, analyze, and classify specific tasks. This ability to perform processes directly within the sensor, rather than relying on a microcontroller, significantly reduces power consumption and enhances the potential for edge computing applications. The MLC contributes to increased accuracy by offloading work from the central processor, while the built-in sensors effectively identify motion data.
Additionally, the module offers a variety of filters and statistical features.
- Filters: high-pass, bandpass, and user-defined first- or second-order IIR.
- Functionality: mean, variance, energy, peak-to-peak, peak detector, and minimum, maximum.
During the implementation phase, the sensors are calibrated to correct errors in the raw data.
The primary factors affecting HAR’s performance are bias error and random noise.
Five subjects performed four movements for data acquisition, each repeated twice on different days. These movements, which include grasping, walking, circular arm movement, and leg flexion, differ from activities usually classified in HAR.
The movements of grasping, walking, circular arm movement, and leg flexion are distinct from activities typically classified in human activity recognition (HAR). The decision to analyze these atypical movements is based on their valuable insights into the functional capacity of older adults.
These movements were selected due to their clinical relevance and impact on quality of life. Unlike everyday movements such as simple gestures or postures, the chosen movements provide detailed and specific information about the users’ health status and functional abilities. This approach allows personalized interventions, offering tailored recommendations and therapies based on collected data. It also helps prevent accidents by identifying risks of falls or losses of mobility early, ultimately improving the quality of life by supporting the older people in daily activities and promoting their independence and well-being.
The selection of these specific movements marks a significant advancement in monitoring and supporting older adults. The file motion_server_app. c is utilized for data acquisition. It is a firmware component designed to handle the acquisition and processing of motion data. The process can be summarized in the block diagram of Figure 5 which provides an overview of the firmware design phases for acquiring the gyroscope and accelerometer data capacity of older adults, as follows:

Figure 5.
Data acquisition flow chart.
- Sampling rate setting;
- Data acquisition;
- Data processing.
The diagram depicting the accelerometer data is shown in Figure 6, while that depicting the gyroscope data will be similar, with the variant of the definition of angular velocities.
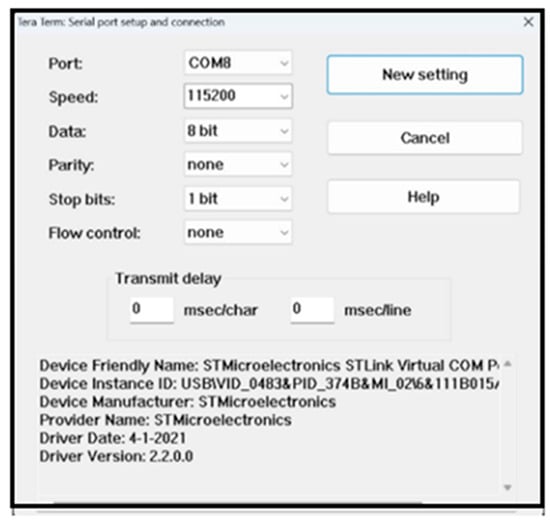
Figure 6.
TERA TERM parameters.
The data collected from the sensors, specifically the gyroscope and accelerometer, are stored in a CSV file. In this file, the last column represents the target variable, while the other columns contain the feature characteristics. These acquired data undergo a preprocessing phase. During preprocessing, the features are standardized using the Standard Scaler. This step enhances the model’s performance by ensuring that all features are on the same scale, which is particularly important for machine learning algorithms sensitive to data scale variations. It is important to note that no over-sampling or under-sampling techniques were applied to address any imbalances in the target classes. The microcontroller utilizes a module (app_ble.c) for data transmission. Users can monitor the messages exchanged through a virtual COM window by configuring the Tera Term software (version 5.4.0, released on 2 March, 2024) with the appropriate connection settings (Figure 6).
The data produced with statistical features were then transferred to the classification model.
4.3. Predictive Models
Predictive models are statistical tools that forecast unknown events or activities based on historical data. They leverage machine learning (ML) algorithms to enhance decision-making. Some of the most popular predictive models include Support Vector Machines (SVM), hidden Markov models (HMM), Dynamic Bayesian Models (DBM), Random Forests (RF), Decision Trees (DT), neural networks, and logistic regression models.
Machine learning enables machines to learn and operate independently without being pre-programmed. It requires structured and categorized data to classify new data. The learning process can take various forms: supervised, unsupervised, semi-supervised, and reinforcement learning. The main objective is to create a system that learns the relationships between data and encapsulates this knowledge within a model.
In supervised learning, a model is constructed using labeled training data to predict future data. Supervised learning algorithms can be divided into two categories: classification, where the output is a binary qualitative variable (true or false), and regression, where the output is a continuous numerical value. On the other hand, unsupervised learning works with unlabeled input data to identify patterns that can help address clustering or association problems. Clustering organizes objects into homogeneous groups. Semi-supervised learning combines both labeled and unlabeled data. Reinforcement learning has no predefined input–output relationships and depends on interactions with the environment, rewarding actions that lead to the desired outcome while penalizing errors.
Both neural network models and logistic regression models can be utilized for human activity recognition (HAR) classification.
4.3.1. Artificial Neural Network
Artificial neural networks (ANNs) are deep learning models inspired by the workings of the human brain. These models, organized into layers (inputs, hidden, and outputs), can learn relationships between input and output variables to make predictions. Each node is connected to others via weights and thresholds, and the learning process takes place through training with large amounts of data. Common types of neural networks include feed-forward networks, convolutional neural networks (CNNs), and recurrent neural networks (RNNs).
4.3.2. Logistic Regression
Logistic regression is a supervised learning algorithm used for binary and multi-class classification tasks. It calculates the probability of belonging to a specific class, producing outputs between 0 and 1. It uses the logistic function (sigmoid) to estimate the probability of an event (Figure 7) [40]. It can be represented by Equation (1),
where e = Euler number, and y = value of the dependent variable. Logistic regression is versatile and can be applied to numerical and categorical data, offering discrete outputs and using the maximum likelihood estimation (MLE) method.
p = 1/1 + e−y
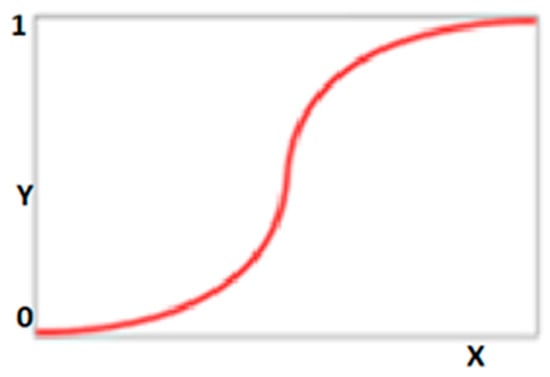
Figure 7.
Logistic function.
This study used the Random Forest model to classify human activities. Several reasons justify this choice, highlighting the advantages and unique characteristics of this algorithm. Random Forest demonstrates substantial accuracy in predictions, which is particularly important for recognizing human activities in applications such as physical rehabilitation and health monitoring. Compared to other algorithms, Random Forest is less prone to overfitting by combining multiple decision trees. This allows the model to generalize better to unseen data, enhancing its reliability in real-world scenarios. The algorithm effectively manages complex and noisy data, such as information from accelerometers and gyroscopes. Aggregating decisions from multiple trees helps filter out noise and improve prediction quality. Random Forest measures feature importance, allowing us to identify which sensors or data features are most relevant for classifying activities. This can help optimize the system and reduce model complexity. The algorithm is highly scalable and can be applied to large datasets without significant performance loss, which is beneficial when working with real-time sensor data collected over extended periods. Random Forest is relatively simple to implement and train, making it easier to develop and maintain the model. The algorithm is resilient to changes in input data, allowing it to adapt well to variations in movement or environmental conditions while maintaining high accuracy.
5. Data Analysis
This research aimed to develop a firmware that could do the following: collect inertial signals using a microcontroller with an embedded module capable of processing tasks locally, predict the activities being performed, and transfer the collected data to a server to assess the motor skills of monitored adults.
Figure 8 shows the diagram of the process steps.
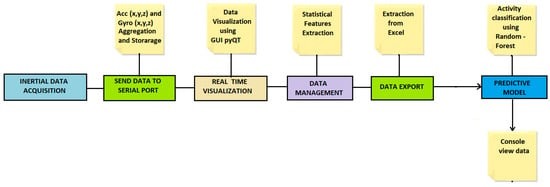
Figure 8.
Flow of process steps.
A program called “graph” has been developed to enable real-time visualization on both the local PC and the remote server console. It features a GUI that utilizes the PyQtGraph libraries to display the temporal diagrams of the detected activities.
5.1. Data Set
The inertial data collected every 50 milliseconds can be used to identify four activities: grasping, walking, limb flexion, and arm circular movement. Here, these data are gathered from five subjects, three males and two females, aged between 35 and 50. Each activity is repeated twice on different days in a realistic setting within the Biorobotics Laboratory at the University of Florence. The subjects wear the STM32WB55G device, which incorporates the ISM330DMCX sensor. This device is compact and lightweight, with approximate dimensions of 85 mm × 54 mm × 1.6 mm and a total weight of around 40 g, including the battery. It is designed to securely attach to the body using an adjustable elastic strap, ensuring comfort and stability during movement. Depending on the activity being monitored, the device can be fastened around the upper arm, wrist, or upper limb.
For walking, the device is typically positioned on the upper arm or wrist to capture the arm swing and overall body motion accurately. The adjustable strap ensures that the device remains securely in place without causing discomfort, allowing for natural movement. The energy consumption for this activity is approximately 1.03 J.
For arm circular movements, the device is attached to the upper arm to monitor the circular motion of the arm. This placement allows the sensors to detect the full range of motion and angles of the arm, resulting in precise data for analyzing motor skills. The energy consumption for arm circular movements is approximately 0.95 J.
In grasping activities, the device is secured to the wrist to capture the fine motor movements of the hand and fingers. This positioning ensures that the sensors accurately detect the grasping motion and grip strength, with an energy consumption of approximately 0.89 J.
For leg flexion activities, the device is attached to the upper leg or thigh to monitor the flexion and extension of the knee joint. This allows the sensors to detect precise movements and angles, providing valuable data for motor skill analysis. The energy consumption for leg flexion is approximately 0.93 J.
This setup facilitates accurate data collection while minimizing user discomfort. The device’s lightweight and compact design ensures it does not interfere with daily activities, making it suitable for the continuous monitoring of older people.
The dataset contains 60,000 samples. The data are organized into matrices for the accelerometer and gyroscope for each of the four activities detected. Each matrix consists of 1500 rows and six columns, where the rows represent timestamps, and the columns correspond to the Cartesian axes that help identify the type of activity being performed. The first three columns of each matrix represent the triaxial inertial data, while the following three columns indicate the type of activity, the reference date, and the timestamp. The data collected pertain to activities carried out by adults for 60 s. Readings are recorded with precise timestamps and time intervals (delta times), indicating the duration of each measurement.
Using the “graph” script, a program written specifically for this purpose, we extracted statistical features for each activity, concentrating on the accelerometer and gyroscope data. We compiled a complete set of sensor readings and calculated various statistical features for each axis of both sensors. The Energy from Motion (ENMO) values were calculated to better differentiate between sedentary and light physical activities. This information aids the researchers in analyzing movement patterns, changes in orientation, and other physical activities throughout the recorded period. The statistical features include the mean, mode, median, variance, standard deviation, mean deviation, root mean square, count, minimum, maximum, and various percentiles. Utilizing these features enhances the model’s accuracy in classifying the activities performed. Below is a description of how each feature contributes to the classification.
Starting with the mean, the grasping activity may show a lower average movement value than other activities, as grasping involves smaller and more controlled movements. In contrast, the circular motion of the arm may present a higher average due to a wider range of motion. The average for leg flexion could vary depending on the intensity and frequency of the flexes, while walking might reveal a moderate average, reflecting continuous and regular movement.
Regarding the mode, the grasping activity could indicate the most common hand position during the action. The circular motion of the arm may demonstrate the most frequent arm position throughout the movement. This could represent the most common flexion angle, while walking may reflect the more frequent leg position during movement.
Considering the median, the grasping activity may yield a value close to the mean, pointing to consistent movements. The circular arm movement could result in a higher median, indicating wider movements. The median for leg flexion might display variability similar to the average, while walking could present a stable median, reflecting regular movement.
Regarding variance and standard deviation, the grasping activity will likely have low values, indicating controlled and consistent movements. In contrast, the circular movement of the arm may exhibit high values due to the variability of wide motions. The flexion of the legs may show varying values, which depend on the intensity of the flexion. Walking is expected to produce moderate values, reflecting its regularity.
When analyzing the average deviation and the root mean square, the grasping activity may again show low values, suggesting smooth movements. The arm’s circular movements might present higher values due to their variability. Leg flexion could display values similar to those seen in variance, while walking will likely have moderate values that signify regular movement.
Examining the minimum and maximum values shows that the grasping activity may have closely grouped values, indicating restricted movement. The circular movement of the arm is expected to show a significant difference between the minimum and maximum, reflecting its wide range of motion. The flexion of the legs may also exhibit variable differences, depending on the intensity of the flexion, while walking might display moderate differences that indicate consistent movement.
Considering percentiles, the grasping activity could have closely grouped percentiles, signifying an even distribution of movements. The circular arm movements may show a wide range of percentiles, reflecting their variability. The flexion of the legs might exhibit varying percentiles similar to variance, whereas walking could demonstrate moderate percentiles that indicate regular movement.
Finally, in terms of counting, the grasping activity may have a high count if it occurs frequently. The circular movement of the arm may vary depending on the duration of the activity. Leg flexion could also have a high count if performed repetitively, while walking and is expected to produce a moderate count that reflects the duration of the walk.
In real time, we sent the graphical representation of movement data to the monitoring system using the “graph” script to be displayed on the remote console (Figure 9, Figure 10, Figure 11 and Figure 12). Medical staff will later evaluate the motor skills of the monitored subjects in clinic to decide which therapeutic actions to take.

Figure 9.
Arm circular movement.
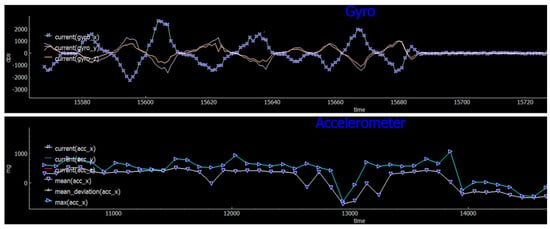
Figure 10.
Grasping.
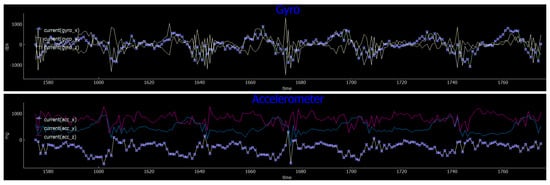
Figure 11.
Legs flexion.
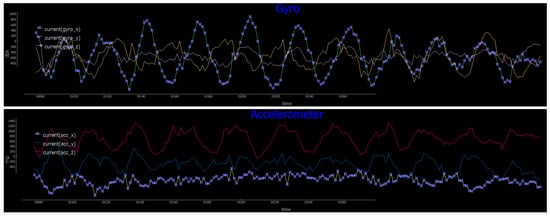
Figure 12.
Walking.
Connecting a Xiaomi Redmi Note 11 Pro smartphone to the STM32WB55G via Bluetooth Low Energy (BLE) and using the Android STBLE sensor app allows us to view the data transmitted by the sensors. The app allows us to plot these data on a phone screen (see Figure 13) and log them for future transfers.
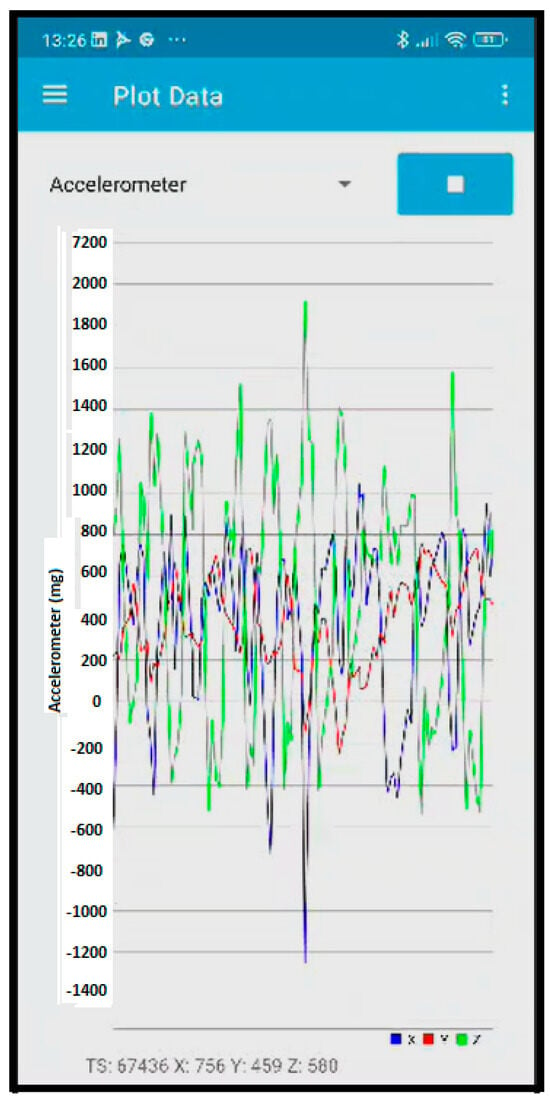
Figure 13.
Screenshot of smartphone.
The acquired data and its statistical features are then sent to a predictive model designed to recognize the activities being performed.
5.2. Evaluation and Analysis Methodology
This section outlines the methods used to conduct tests, measure energy consumption, evaluate motor capacity, and analyze the system’s use. The goal is to provide a detailed description of the procedures adopted to ensure the accuracy and reliability of the obtained results.
The tests were designed to simulate real-world usage conditions, enabling a comprehensive system performance evaluation. Energy consumption was measured using precision instrumentation, while motor capacity was assessed through specific tests tailored to meet user needs. Additionally, the analysis of system usage considered various aspects, including functionality, usability, and overall usefulness.
Tests were conducted using a series of standardized exercises that assessed balance, mobility, and muscle strength.
Test Methodology
- Description: Participants must grasp and lift objects of different sizes and weights.
- Results: The Random Forest model achieved 0.998576 accuracy, 0.9998675 precision, 0.998775 recall, and a 0.998763 F1-score.
- Description: Participants must perform circular arm movements, both clockwise and counterclockwise.
- Results: The Random Forest model achieved 0.998885 accuracy, 0.998875 precision, 0.998885 recall, and a 0.998857 F1-score.
- Description: Participants must perform leg push-ups, alternating between deep and light push-ups.
- Results: The Random Forest model achieved 0.998665 accuracy, 0.998657 precision, 0.998665 recall, and a 0.998648 F1-score.
Walking:
- Description: Participants must walk on a set path, either in a straight line or with changes of direction.
- Results: The Random Forest model achieved 0.998885 accuracy, 0.998765 precision, 0.998786 recall, and a 0.998783 F1-score.
The data collected can be used to personalize interventions and improve users’ quality of life. In addition, the system has proven helpful in identifying fall risks and monitoring progress in rehabilitation programs.
The energy consumed was calculated by measuring the current obtained with a digital multimeter. The multimeter was set to current measurement mode, and the probes were connected to the terminals of the device while it was running. The current value was read directly from the multimeter display. This method allowed us to obtain accurate and reliable measurements of the current consumed during the tests. The average energy consumed was 0.95 J (calculated taking into account V = 3.3 V and t = 60 s).
An analysis of computational efficiency was focused on processing times, energy consumption and latency.
Processing Time: Our system utilizes the STM32WB55 microcontroller, which is recognized for its energy efficiency and processing capabilities. The average processing time is 50 ms per detection cycle. This reduced processing time is crucial for real-time applications, such as monitoring the health of older people, where rapid responses are essential.
Power Consumption: Thanks to its low-power optimized architecture, the STM32WB55 microcontroller consumes an average of 16.5 mW during active processing. This feature is particularly advantageous for wearable devices that require extended battery life.
Latency is a vital metric for human activity recognition applications, as it directly impacts system responsiveness. Low latency is necessary to ensure the system can quickly respond to changes in activity. Based on tests, with a processing time of 50 ms per cycle, the total latency amounts to 110 ms (50 ms processing time plus 60 ms average communication time for the TCP/IP protocol).
Additional analyses were conducted, including evaluations of motor ability and the practical application of the model.
Assessing the motor skills of older adults is essential for monitoring their health and well-being. While preliminary tests were initially performed on younger subjects, these early results provide a strong foundation for expanding the research to older populations. The system described in this study classifies specific actions the subjects perform and offers a comprehensive assessment of their motor skills. This process is vital for identifying any abnormalities or declines in motor abilities, enabling timely and targeted interventions. The assessment methodology is based on several parameters, including the following:
- Efficiency. This measures the speed and fluidity of movements by evaluating the time taken to complete a task and the accuracy of the movements;
- Safety. This examines stability and the risk of falls while performing tasks, measured by the number of accidents or near-accidents recorded during monitoring;
- Independence. This determines the patient’s degree of autonomy in performing daily activities, assessed by how often the patient requires assistance to complete tasks.
The findings for the mentioned parameters are as follows:
- Efficiency. The average time to complete the grasping task was 5 s, with a movement accuracy of 99%;
- Safety. An accident occurred during walking tests, and some issues were observed during leg flexion;
- Independence. Assistance was requested only once for grasping an object across all tests conducted throughout the day.
These preliminary results provide a foundation for expanding research to older adults. The continuous monitoring system allows for observing and analyzing specific movements, such as grasping, walking, leg flexion, and circular arm movements. These movements were chosen for their clinical relevance and impact on the quality of life for older adults.
Integrating this IoT application into remote care services enhances the quality of life for elderly individuals and supplies healthcare professionals with valuable information to assess motor skills. The system enables the timely identification of any decline in motor skills, promoting targeted and personalized interventions.
To evaluate the model’s usage, participants were asked to provide ratings from 1 to 5 based on the following parameters:
- Functionality. This parameter assesses the speed of the model’s responses;
- Usability. This parameter evaluates how easy it is to use the model;
- Utility. This parameter measures the model’s effectiveness in promoting user independence.
Table 1 presents a rating scale with specific meanings assigned to each value.

Table 1.
Table of evaluation parameters.
The evaluations obtained are presented in Table 1.
Figure 14 shows the values of the mean and standard deviation of the three parameters examined.
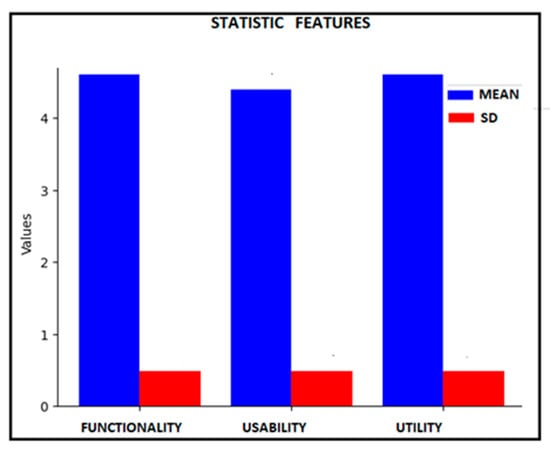
Figure 14.
Statistic features.
Based on user feedback, the characteristics of each movement (grasping, arm circular movement, walking, and leg flexion) were assessed in terms of ergonomics and reliability.
Ergonomics refers to how easy it is to perform a movement without causing stress or fatigue. In contrast, reliability indicates users’ perceptions of the movement’s stability and error-free execution.
Using the evaluation scale defined earlier, an average rating close to 5 was achieved, as illustrated in Figure 15.
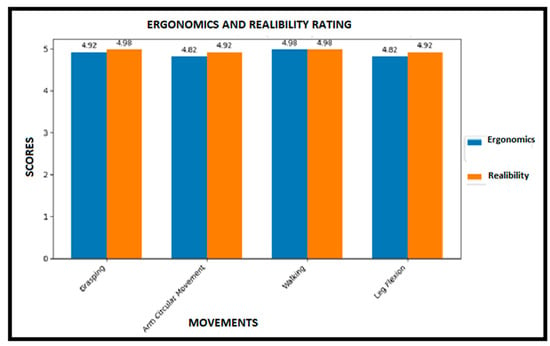
Figure 15.
Ergonomics and reliability rating.
In light of the results, the model has proven effective and easy to use, and as having a simple user interface. However, its current limitation is that it can only be utilized in scientific environments and with non-elderly subjects. Extending its application to real-world environments involving older individuals is essential to fully validate the model, as it is currently regarded as a potential tool.
In the context of this study, extending the application to older subjects will allow us to assess how the model responds to age-related factors such as slower movements, difficulty in movement, and tremors, which are commonly seen in conditions like Parkinson’s disease.
Older adults tend to move more slowly due to decreased muscle strength and coordination, which can impact the accuracy of the sensors in detecting and classifying movements. Additionally, difficulty in movement often results in irregular or incomplete motions, leading to potential errors in activity classification. Tremors can introduce noise into sensor data, interfering with the model’s ability to recognize tasks accurately.
To address these challenges, the model incorporates several features. Standardizing data characteristics ensures that all variables are measured on the same scale, allowing the model to treat data uniformly. This standardization helps the model recognize slower movements such as a leg flexion performed by an older person as valid, rather than classifying them as abnormalities.
Data filtering is also crucial for reducing the noise caused by tremors, which are prevalent in older adults. Techniques like the Kalman filter can merge data from multiple sensors and minimize noise. For instance, if an elderly person experiences tremors, the Kalman filter can assist in differentiating genuine movements from the tremors, thereby enhancing the accuracy of task recognition.
Furthermore, extracting statistical characteristics allows for the more effective capturing of variations in older adults’ movements. Statistical features such as mean, variance, and standard deviation are particularly beneficial. For example, the average acceleration data can indicate the general activity level, while the variance may reveal the erratic movements. By utilizing these features, the model can better adapt to the specific movement patterns of older adults, accurately recognizing activities even when movements are slower or less coordinated.
Finally, employing robust models such as Random Forest, which are less prone to overfitting, can significantly enhance the model’s ability to generalize to older movements, thereby reducing classification errors.
The movement patterns of older adults can vary significantly from one individual to another. Random Forest is a machine learning technique that creates multiple decision trees and combines their outcomes to make a final prediction. This method enhances the model’s ability to recognize activities in various conditions accurately. Furthermore, customizing the model can help identify and rectify age-related errors. For instance, if the model detects a specific walking pattern for an older individual, it can adapt to recognize this pattern as expected for that person. This customization is achieved through continuous learning, where the model is regularly updated with new data to enhance its accuracy.
The extension of this model for elderly users has been postponed to a second phase, as it requires a careful and methodical approach, which will take time to define and organize. The key activities include the following:
- Obtaining Ethics Committee approval ensures that all activities are conducted ethically;
- Identifying elderly participants and their available caregivers for involvement in the study;
- Ensuring that all participants give their informed consent;
- Involving experts to guarantee the quality and accuracy of evaluations;
- Conducting tests to assess the cognitive abilities of participants;
- Developing a detailed protocol to guide all activities;
- Providing adequate training on the use of the model;
- Carrying out tests according to the established protocol;
- Collecting and analyzing the data obtained from the tests;
- Gathering feedback on the ratings provided;
- Adjusting the model based on the feedback received;
- Offering emotional and psychological support to participants to ensure their well-being throughout the process;
- Organizing follow-up sessions to monitor progress and provide additional support;
- Promoting community involvement to raise awareness and support for older individuals.
5.3. Prediction
The predictive model used is called “Random Forest”. This model is based on a supervised learning algorithm and employs a bagging technique that utilizes a collection of decision trees to make predictions. The supervised learning algorithm leverages an ensemble learning method for regression, which combines the predictions from multiple machine learning algorithms to produce more accurate results than any single model.
One key benefit of the Random Forest model is its ability to reduce overfitting, a common issue associated with individual decision trees. The model is structured as a series of decision trees, each constructed from a random subset of the training data. Each tree independently predicts outcomes based on another random subset of the data, and the final prediction is determined by a majority vote among all the trees.
A critical feature of the Random Forest model is the randomness in selecting attributes for each tree. This randomness decreases the correlation among the trees, improving the overall robustness of the model. The entire process can be broken down into several phases, as follows:
- Creating subsets. For each node in a tree, a random subset of traits is selected from the original dataset. This subset is typically much smaller than the total number of available features;
- Choosing the best feature. From the randomly selected traits, the feature that best separates the data is determined using a quality measure, such as entropy or the Gini index;
- Repeating the process. This process is repeated for each node in every tree within the forest, ensuring that each tree is constructed using a different subset of characteristics;
- Setting hyperparameters. Before training the model, several important hyperparameters must be configured (see Table 2).
 Table 2. Hyperparameters of Random Forest.
The Grid Search technique was employed to identify parameters that optimize model predictions. This process involved defining a grid of parameters and the number of cross-validation folds. The parameters considered were as follows:
- n_estimators, [100, 200,];
- max_depth, [None, 10,];
- min_samples_split, [2, 5,];
- min_samples_leaf, [1, 2,];
- max_features, [auto, sqrt].
All possible combinations of these parameters were evaluated. The model was trained and assessed for each combination using cross-validation (n = 5). The combination that resulted in the best performance was selected as the optimal set of parameters.
The ‘fit’ method was used to train the model on each combination of parameters, and a dedicated function was employed to identify the best combination. The model was trained and evaluated five times, using a different portion of the data as the test set. The optimal parameters identified were as follows:
- n_estimators, 100;
- max_depth, none;
- min_samples_split, 2;
- min_samples_leaf, 1.
The total number of iterations conducted while searching for the optimal parameters was 160, corresponding to the number of combinations specified in the grid.
The training phase used 80% of the acquired data.
With the next prediction step, the model correctly recognized the four predicted activities.
To validate the reliability of the model, the following metrics were derived: accuracy, precision, recall, and F1 (see Table 3).

Table 3.
Evaluation metrics.
The model can make highly accurate predictions based on these values. The next step is to represent the ROC and AUC curves (Figure 16).
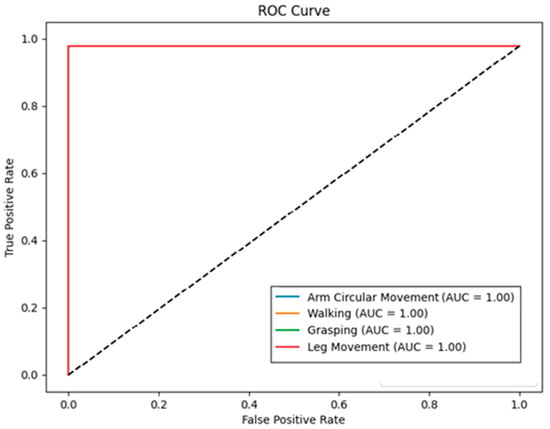
Figure 16.
ROC curve.
Figure 16 illustrates the ROC curve representing the classification model’s performance. The False Positive Rate (FPR) is shown on the y-axis, and the True Positive Rate (TPR) is displayed on the x-axis. The area under the curve represents the AUC (Area Under the Curve). This value indicates how well the model can differentiate between the various asset classes examined. A value of 1 means that the model can accurately identify positive and negative classes without errors.
To validate the performance, the model was compared with another neural network, the self-normalizing neural network (SNN). This type of neural network is designed to keep the activation of its neurons within a desired range without requiring external normalization techniques, such as batch normalization. Each layer is normalized and serves as input to the next layer. SNNs utilize self-normalizing neural activations that automatically converge toward a mean of zero and a unit variance. This is achieved through the SELU (Scaled Exponential Linear Unit) activation function. The SELU function accelerates convergence during training, allowing it to learn faster and more effectively than other activation functions without additional processing. The SELU can be expressed mathematically as follows:
f(x) = λ × x if x > 0
f(x) = λ × α(ex − 1) if x ≤ 0
f(x) = λ × α(ex − 1) if x ≤ 0
Graphically, it can be represented as in Figure 17.
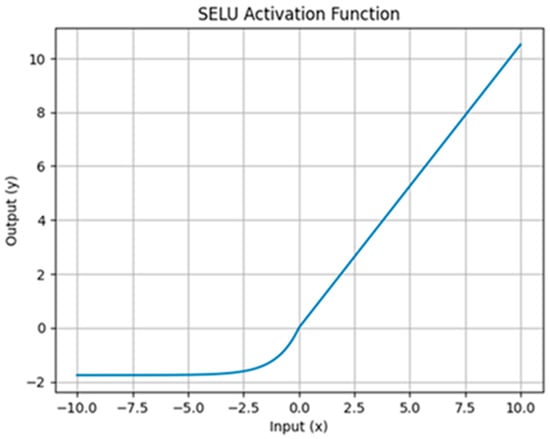
Figure 17.
SELU function.
The SELU (Scaled Exponential Linear Unit) function is continuous and differentiable throughout its entire domain, including the origin. This property ensures there are no jumps or discontinuities in the curve, which is beneficial for optimization during the training of neural networks.
In the positive region (X > 0), the SELU function behaves linearly. This means the output increases proportionally with the input. The scale parameter, approximately equal to 1.0507, determines the slope of the curve in this region.
In the negative region (X < 0), the SELU function applies an exponential transformation. This transformation keeps the output close to zero, but not exactly zero, which helps mitigate the “dying ReLU” problem, where neurons stop updating during training. The alpha parameter, approximately 1.67326, influences the curve in this region.
The convergence property of SELU networks allows them to trend towards a mean of zero with unit variance, enabling the training of deep networks with many layers and making the learning process highly robust.
The metrics obtained were as follows (see Table 4).

Table 4.
Evaluation metrics.
The ROC curve was also derived for the SNN network (Figure 18).
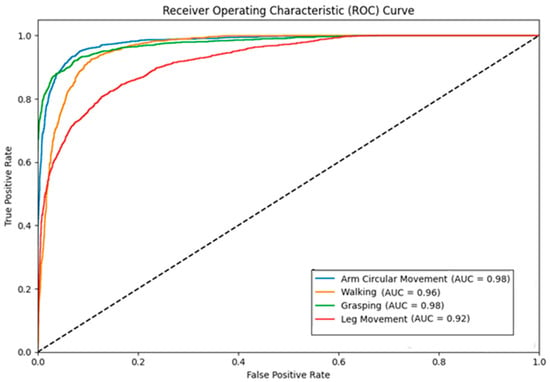
Figure 18.
ROC curve.
The metrics compared between the suggested model and others have shown that the Random Forest model significantly outperforms the SNN in all key indicators. A detailed examination of the individual metrics reveals the following:
- Accuracy reflects the proportion of correct forecasts out of the total forecasts made. The Random Forest model achieves impressive accuracy rates of 0.998885 for arm circular movements, 0.998885 for walking, 0.998576 for grasping, and 0.998665 for leg flexion, correctly classifying most samples. In contrast, the SNN model has an accuracy of 0.91 for arm circular movements, 0.87 for walking, 0.87 for grasping, and 0.67 for leg flexion, indicating more classification errors;
- Precision is defined as the proportion of true positives among all samples classified as positive. The Random Forest model has a precision of 0.998875 for arm circular movements, 0.998765 for walking, 0.998675 for grasping, and 0.998657 for leg flexion, accurately predicting positive classes across all samples. Conversely, the SNN model has a precision of 0.84 for arm circular movements, 0.79 for walking, 0.88 for grasping, and 0.81 for leg flexion. This suggests that the SNN has a higher likelihood of false positives, meaning samples classified as positive may not be;
- Recall measures the proportion of true positives among all positive samples. The Random Forest model demonstrates recall rates of 0.998885 for arm circular movements, 0.998786 for walking, 0.998775 for grasping, and 0.998665 for leg flexion, successfully identifying 100% of positive samples. In comparison, the SNN model’s recall is only 0.91 for arm circular movements, 0.87 for walking, and 0.87 for grasping, indicating it fails to identify a significant number of positive samples, resulting in a higher incidence of false negatives;
- F1 Score is the harmonic average of precision and recall, providing a balanced measure of a model’s performance. The Random Forest model achieves F1 scores of 0.998857 for arm circular movements, 0.998783 for walking, 0.998763 for grasping, and 0.998648 for leg flexion, reflecting a good balance between precision and recall. In contrast, the SNN model’s F1 scores are 0.87 for arm circular movements, 0.83 for walking, 0.88 for grasping, and 0.74 for leg flexion, indicating difficulties in maintaining an effective balance between these metrics.
The evaluation also included the ROC curves generated for the proposed model and the comparison network. Once again, the Random Forest model demonstrated superior performance.
Overall, the best performance metrics indicate that the Random Forest model is more reliable and accurate in predicting activities, effectively minimizing false positives and negatives.
In the field of human activity recognition (HAR), the choice of predictive model is crucial to ensure accuracy and reliability. In this study, we initially compared two models, Random Forest and Self-normalizing Neural Network (SNN). While both models demonstrated good performance, with Random Forest showing increased accuracy and robustness, the need arose to explore further solutions that could further improve the ability to recognize tasks. The model chosen was the LSTM (Long Short-Term Memory). This network represents an advanced solution for the recognition of human activities, thanks to their ability to manage timelines and capture long-term dependencies. This makes it ideal for analyzing continuous and complex movements, improving accuracy in recognizing activities that develop over time. Unlike traditional models, LSTMs are designed to store relevant information for extended periods, making them ideal for analyzing sequential data such as those from wearable sensors. They can better handle time variations in data, improving accuracy in recognizing complex tasks. In addition, their structure reduces the risk of overfitting, ensuring the greater generalization of the model. The LSTM architecture is composed of memory units that can retain information for long periods. Each LSTM unit has three main ports: the input port, the output port, and the forgetfulness port. These ports regulate the flow of information across the network, allowing the LSTM to remember or forget relevant information. To implement an LSTM model for HAR, the data acquired by the sensors (accelerometer and gyroscope) are divided into timelines. These sequences are then used as input to the LSTM network. The network learns the temporal characteristics of the data, improving the accuracy in the recognition of activities. The results obtained with this network, whose architecture is represented in the diagram in Figure 19, were equally significant (Figure 19).

Figure 19.
LSTM architecture.
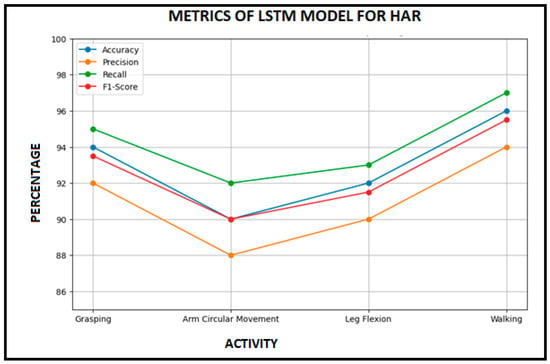
Figure 20.
LSTM metrics.

Table 5.
Evaluation metrics.
The model showed remarkable performance, with results such as the following (Table 5).
Comparing the two models, it is observed that the Random Forest model performed better than the LSTM model. However, the LSTM model demonstrated a strong ability to recognize human activities, especially for movements involving complex timelines.
Random Forest’s integration with LSTM for human activity recognition can create a more robust, accurate, and adaptable system. This combination leverages the strengths of both models, improving performance and reducing errors, offering a complete solution for human activity recognition. Integration offers numerous advantages, especially when it comes to analyzing timelines. While Random Forest is very effective at providing an accurate classification of static features, it fails to capture temporal dependencies. In contrast, LSTM is designed to manage timelines and capture long-term dependencies in data. This makes it ideal for analyzing continuous and complex movements, improving accuracy in recognizing activities that develop over time.
Another aspect to consider is the frequency of data sampling. Random Forest can effectively handle sampled data at different frequencies, providing robust classification. On the other hand, LSTM can leverage high-frequency data to capture fine details of movements, while low-frequency data can be used to reduce noise and improve model stability. The integration of the two models allows these aspects to be balanced, optimizing precision and overall robustness.
When it comes to motion characteristics, Random Forest can effectively classify parameters such as acceleration, speed, and rotation. However, LSTM can analyze the timelines of these features, capturing dynamic variations and improving the understanding of complex movements. This combination allows for a more complete and accurate view of human activities.
Managing transitions between different tasks is another strength of RF-LSTM integration. Random Forest can provide the accurate classification of individual activities, while LSTM can manage transitions between different activities, capturing time dependencies and improving accuracy in recognizing activities that change over time. This is especially useful for tasks that involve continuous movement and smooth transitions.
Additionally, Random Forest can effectively classify tasks of different durations, providing a solid foundation for analysis. LSTM, on the other hand, can handle long-running tasks, capturing time dependencies and improving accuracy in recognizing tasks that develop over time. The integration of the two models allows them to effectively manage tasks of different durations, improving overall accuracy.
Finally, noise filtering is a crucial aspect of improving data quality. Random Forest is robust to noisy data and can effectively handle noise in sensory data. LSTM can leverage preprocessing techniques, such as noise filtering, to improve data quality and capture time dependencies. The integration of the two models makes it possible to reduce noise and improve the overall quality of recognition
In addition to the benefits of integrating the two models, it is important to consider some unique features of Random Forest that make it an excellent choice for asset classification.
First, Random Forest is known for its robustness, and tends to be less prone to overfitting than models like neural networks. This feature may explain its superior performance in analysis. In addition, Random Forest is more interpretable than neural networks, allowing a better understanding of the features that significantly influence predictions. Another aspect to consider is training time—neural networks often require longer training times and more computational resources than Random Forest.
These factors lead to the conclusion that Random Forest is an excellent choice for asset classification. Considering its characteristics compared to a logistic regression model, which represents another type of machine learning algorithm, the validity of the choice can be confirmed in relation to the type of movements examined. In particular, several advantages emerge related to the ability to manage nonlinearities, provide estimates of the importance of variables and tolerate missing data, as well as versatility.
The management of nonlinearities is particularly effective with Random Forest, which manages data with nonlinear relationships and complex interactions between variables. This is crucial for motion detection, where patterns can be highly non-linear. In contrast, logistic regression, being a linear model, can struggle to capture complexities in motion data.
Another important aspect is robustness and accuracy. Random Forest, being a set of decision trees, tends to be more robust and less prone to overfitting than individual models. This leads to greater accuracy in forecasting. On the other hand, logistic regression can be more susceptible to overfitting, especially with complex, non-linear data.
Random Forest provides an estimate of the importance of variables, allowing one to identify which characteristics of movements (such as grip, arm movement, leg flection, walking) are most relevant to predictions. Logistic regression, while it can provide coefficients for variables, does not offer the same clarity and interpretability in relation to relative importance as Random Forest.
When it comes to handling missing data, Random Forest is more tolerant, and can handle it more effectively during training. Logistic regression, on the other hand, requires the more careful management of missing data, such as imputation, which can introduce bias.
Finally, versatility is another point in favor of Random Forest, which can be used for both classification and regression problems, offering more flexibility for any future extensions of the project. Logistic regression, on the other hand, is limited to binary or multi-class classification problems.
6. Discussion
This paper proposes a model for recognizing human movements developed as part of an assistance service for vulnerable or moderately fragile older adults. The project aims to promote healthy lifestyles and facilitate health monitoring. The system has several key functions, including the following:
- -
- Motion tracking;
- -
- Data analysis to identify potential anomalous situations.
Caregivers guide older adults to perform activities such as grasping, walking, flexing their legs, and making circular arm movements to monitor their motor skills. The chosen technology is user-friendly and space-efficient, which enhances its acceptability among older users. The system is designed to minimize any discomfort elderly individuals may experience while using technology. Furthermore, caregivers play a crucial role in helping older adults overcome their reluctance towards technology by providing practical guidance on how to use these tools. This model has several distinguishing features compared to other studies and applications in human activity recognition.
Technology: This system utilizes a multi-protocol dual-core wireless STM55WB microcontroller, renowned for its energy efficiency and robust processing capabilities. It is well-suited for developing IoT applications in edge machine learning. It is ideal for wearable devices requiring low power consumption while maintaining high performance. The technology integrates a high-performance 3D digital accelerometer and a 3D digital gyroscope with machine learning cores. This combination effectively captures linear acceleration and rotational movements, enabling the precise detection of specific actions such as grasping, arm circular movements, leg flexion, and walking. The model is optimized to recognize these movements, which are essential for applications in the physical rehabilitation, health monitoring, and gesture control of devices.
Methodology: The approach employs Random Forest as a predictive model. Random Forest is advantageous as it can manage large datasets and deliver accurate, robust predictions. Its resistance to overfitting makes it ideal for real-world applications. The model is also scalable, including additional movements or sensors, which enhances its detection and recognition capabilities. This flexibility enables the system to be adapted to meet various needs and applications. Furthermore, the methodology includes a continuous learning algorithm that improves the system’s accuracy over time by adapting to the specific movement patterns of individual users.
Type of classes used: The movements analyzed signify a significant advancement in monitoring and supporting older adults. This focused approach generates valuable data, enhances quality of life, and facilitates personalized interventions. The system categorizes movements into various classes, such as fine motor skills (e.g., grasping small objects), gross motor skills (e.g., walking), and complex movements (e.g., arm circular movements). This classification allows for a comprehensive assessment of an individual’s motor abilities and helps in tailoring specific rehabilitation programs.
Features: The device is designed for ease of use and low power consumption. It includes a mode of use that makes it easy for seniors to interact, ensuring they can use the device with minimal assistance. The system’s compact design makes it easy to wear and carry, enhancing its convenience for everyday use. In addition, the device offers real-time feedback and alerts, allowing for an immediate response to any anomalies detected in the user’s movements. Integration with healthcare applications allows caregivers and healthcare professionals to remotely monitor the health status of the elderly, ensuring timely interventions and continuous support.
Many human activity recognition systems rely on multiple accelerometers or various combinations of sensors, which can be cumbersome. Using several sensors often leads to inconsistent motion observations across devices, resulting in increased costs and complications in application usage, which can be uncomfortable for the wearer. In contrast, this model utilizes a single sensor that has proved efficient during the classification phase, achieving satisfactory accuracy. The reliable data obtained support our choice to use an inertial module as the sole input for the prediction model. Previous studies have successfully employed single sensors in their methodologies [23,41,42].
In classifying human activities, the literature reveals numerous studies that employ different prediction models, yielding varying results. The model hypothesized in the article is designed for monitoring the health of the elderly in home or nursing home settings, and the testimonials report varied applications, including physical rehabilitation contexts, health monitoring, and the gesture control of devices. It also focuses on specific movements such as grasping, leg flexion, circular arm movement and walking, while the testimonies examine a different range of activities, including daily and sports movements. For example, Tao et al. [27] analyzed daily, sports, and automotive maintenance activities. This difference may reflect the different needs and objectives of the various studies, as well as the different technologies and methodologies used. Other authors offer an overview of various studies and similar applications using inertial sensors for monitoring human activities. For example, Huang et al. [22] examined the strengths and weaknesses of IMU-based approaches and multi-view images, while Prasad et al. [23] demonstrated that it is possible to identify six fundamental human activities with a simple sensor. These testimonials highlight the effectiveness of MEMS sensors in activity monitoring and their applicability in various settings, such as physical rehabilitation and health monitoring. One of the main differences between the hypothetical model and the testimonies concerns the technology used. While the hypothesized model focuses on a specific microcontroller (STM55WB) with built-in MEMS sensors, the testimonies report a variety of sensors and technologies, including multiple sensors and different data fusion techniques. For example, Huang et al. [22] use multi-view images, while Mo et al. [25] employ wearable sensors that can be recharged via body energy. This variety of approaches can offer different benefits, such as increased accuracy and robustness, but also increased complexity and cost. Another significant difference concerns the artificial intelligence algorithms used. The model hypothesized in the article uses the Random Forest for the classification of activities, while the testimonies vary the algorithms used, including neural networks, hidden Markov models, and other machine learning techniques. For example, Ronao et al. [24] apply hidden Markov models, while Mo et al. [25] use Random Forest. This diversity of algorithms can affect the accuracy and robustness of the task recognition system.
This study chose to use the Random Forest algorithm as an alternative to the neural networks commonly employed by other researchers. The transformation of accelerometric data into classes that were input into the prediction model demonstrated the efficiency of the Random Forest algorithm. The results indicate that, in most cases, events were accurately identified, with performance exceeding that of previous studies using neural networks. The validity of the Random Forest algorithm as a predictive model has been established in earlier experiments, where it was compared with various neural networks [43,44]. Random Forest enhances classification outcomes by randomizing data. Shuffling the order of the data, a valuable preprocessing step in machine learning offers several benefits for model training. First, it helps avoid order bias, preventing the model from learning patterns based on the specific data sequence, which could hinder generalization to new, unseen data. By introducing diversity and breaking away from fixed patterns, shuffling improves the model’s ability to generalize effectively. This process is especially crucial for reducing overfitting, as it prevents the model from memorizing patterns associated with the order of the data.
The novelty of this work lies in its simplified recognition method, high recognition accuracy, reduced computational load through local processing, diversity of recognizable activities, and its potential for integration and communication with smart home technologies and IoT platforms for monitoring activities.
The model proposed in the article provides a specific and targeted solution for monitoring the health of older people, emphasizing ease of use and sustainability. However, testimonials highlight various approaches and technologies that can deliver benefits, including increased accuracy and robustness. These alternatives may also introduce greater complexity and cost.
While the proposed system is effective, it has some limitations due to the types of subjects and the testing environment utilized. The tests were conducted with healthy, young participants. Future experimentation with older individuals and those with limited mobility is necessary. Additionally, the tests were conducted in simulated living environments with limited obstacles. Extending these tests to real home settings and nursing homes with various layouts would be beneficial. Future research could also explore movements beyond those typically studied and evaluate the effectiveness of integration into a smart home system. Using a hybrid approach that combines RF with convolutional neural networks (CNNs) or Long Short-Term Memory (LSTM) networks can enhance the robustness and generalization capabilities of the classification system. While Random Forest models offer stability and interpretability, neural networks are more adept at adapting to complex variations in data.
7. Conclusions
This work proposes an IoT application designed to classify specific actions performed by older adults. It utilizes an embedded sensor in the STM32WB55G microcontroller. The Android STBLE sensor app can also access the data on smartphones. This solution is notable for its simplicity, as it does not require additional wearable sensors that may inconvenience users, while remaining low-cost and energy-efficient.
The STM32WB55G microcontroller significantly simplifies the design process by providing an internal programming environment that allows for quick application creation, compilation, and debugging. The results indicate strong performance, confirming that the proposed system can accurately recognize the studied activities.
The study aims to improve motion data transfer within smart homes, expanding capabilities beyond vital sign monitoring and fall detection. This work employs the Random Forest algorithm to recognize multiple activities from a device worn on the body, demonstrating reasonable accuracy across all activity classes.
Integrating this IoT application into remote care services can broaden its utility for a larger population of patients. Healthcare professionals can monitor patient behavior through this system, offering valuable insights into their neurological status as part of a comprehensive human activity recognition system. The effectiveness of the chosen forecasting model encourages further investigations to expand the range of recognizable activities.
In the future, there are plans to develop features that allow system customization to meet each user’s specific needs, enhancing usability and acceptance. Additionally, creating more intuitive and accessible user interfaces for older adults will help reduce the discomfort and stress associated with using technology. This expansion aims to improve the overall management of users’ lives.
Author Contributions
Conceptualization, L.B. and M.V.; methodology, L.B. and G.A.; software, L.B. and F.C.; validation, L.B., G.A., F.L., D.P., F.C. and M.V.; formal analysis, L.B., D.P. and F.L.; investigation, L.B. and F.L.; resources, L.B. and D.P.; data curation, D.P.; writing—original draft preparation, L.B. and M.V.; writing—review and editing, L.B., G.A., F.L., D.P., F.C. and M.V.; visualization, L.B., G.A. and F.L.F.; supervision, L.B. All authors have read and agreed to the published version of the manuscript.
Funding
This research received no external funding.
Institutional Review Board Statement
Not applicable.
Informed Consent Statement
Not applicable.
Data Availability Statement
The data presented in this study are available on request from the corresponding author due to privacy.
Conflicts of Interest
Author Francesco Cotroneo was employed by the company Nophys srl. The remaining authors declare that the research was conducted in the absence of any commercial or financial relationships that could be construed as a potential conflict of interest.
References
- Parween, S.; Asthana, A.; Nahar, P. Fundamentals of Image-Based Assay (IBA) System for Affordable Point of Care Diagnostics. Microchem. J. 2023, 186, 108345. [Google Scholar] [CrossRef]
- Feng, B.; Yu, T.; Wang, H.; Liu, K.; Wu, W.; Long, W. Editorial: Machine learning and deep learning in biomedical signal analysis. Front. Hum. Neurosci. 2023, 17, 1183840. [Google Scholar] [CrossRef] [PubMed]
- Giordano, C.; Brennan, M.; Mohamed, B.; Rashidi, P.; Modave, F.; Tighe, P. Accessing Artificial Intelligence for Clinical Decision-Making. Front. Digit. Health 2021, 3, 645232. [Google Scholar] [CrossRef]
- Mao, R.Q.; Lan, L.; Kay, J.; Lohre, R.; Ayeni, O.R.; Goel, D.P.; Sa, D. Immersive Virtual Reality for Surgical Training: A Systematic Review. J. Surg. Res. 2021, 268, 40–58. [Google Scholar] [CrossRef] [PubMed]
- Ummels, D.; Beekman, E.; Braun, S.M.; Beurskens, A.J. Using an Activity Tracker in Healthcare: Experiences of Healthcare Professionals and Patients. Int. J. Environ. Res. Public Health 2021, 18, 5147. [Google Scholar] [CrossRef]
- Brockmeyer, P.; Wiechens, B.; Schliephake, H. The Role of Augmented Reality in the Advancement of Minimally Invasive Surgery Procedures: A Scoping Review. Bioengineering 2023, 10, 501. [Google Scholar] [CrossRef]
- Bibbò, L.; Cotroneo, F.; Vellasco, M. Emotional Health Detection in HAR: New Approach Using Ensemble SNN. Appl. Sci. 2023, 13, 3259. [Google Scholar] [CrossRef]
- Assistance to the Elderly Who Are Not Self-Sufficient in Italy 7. Report 2020/2021. Available online: https://www.luoghicura.it/wp-content/uploads/2020/12/NNA_2020_7%C2%B0_Rapporto.pdf (accessed on 12 February 2025).
- Bibbò, L.; Carotenuto, R.; Della Corte, F.; Merenda, M.; Messina, G. Home care system for the elderly and pathological conditions. In Proceedings of the 7th International Conference on Smart and Sustainable Technologies (SpliTech), Split/Bol, Croatia, 5–8 July 2022; pp. 1–7. [Google Scholar] [CrossRef]
- Straczkiewicz, M.; James, P.; Onnela, J.P. A systematic review of smartphone-based human activity recognition methods for health research. NPJ Digit. Med. 2021, 4, 148. [Google Scholar] [CrossRef]
- Sharma, V.; Gupta, M.; Kumar Pandey, A.; Mishra, D.; Kumar, A. A Review of Deep Learning-based Human Activity Recognition on Benchmark Video Datasets. Appl. Artif. Intell. 2022, 36, 2093705. [Google Scholar] [CrossRef]
- Cicirelli, G.; Marani, R.; Petitti, A.; Milella, A.; D’Orazio, T. Ambient Assisted Living: A Review of Technologies, Methodologies and Future Perspectives for Healthy Aging of Population. Sensors 2021, 21, 3549. [Google Scholar] [CrossRef]
- Pham, M.; Mengistu, Y.; Do, H.; Sheng, W. Delivering home healthcare through a Cloud-based Smart Home Environment (CoSHE). Future Gener. Comput. Syst. 2018, 81, 129–140. [Google Scholar] [CrossRef]
- Chen, B.; Wan, J. Emerging Trends of ML-based Intelligent Services for Industrial Internet of Things (IIoT). In Proceedings of the Computing, Communications and IoT Applications (ComComAp), Shenzhen, China, 26–28 October 2019; pp. 135–139. [Google Scholar] [CrossRef]
- Rayan, A.; Zafar, I.; Rajab, H.; Zubair, M.A.M.; Maqbool, M.; Hussain, S. Impact of IoT in Biomedical Applications Using Machine and Deep Learning. In Machine Learning Algorithms for Signal and Image Processing; Wiley: Hoboken, NJ, USA, 2023; pp. 339–360. [Google Scholar] [CrossRef]
- Chen, K.; Zhang, D.; Yao, L.; Guo, B.; Yu, Z.; Liu, Y. Deep learning for sensor-based human activity recognition: Overview, challenges and opportunities. ACM Comput. Surv. 2021, 54, 1–40. [Google Scholar] [CrossRef]
- Liu, H.; Gamboa, H.; Schultz, T. Sensor-Based Human Activity and Behavior Research: Where Advanced Sensing and Recognition Technologies Meet. Sensors 2023, 23, 125. [Google Scholar] [CrossRef]
- Kumar, R.; Sagar, L.K.; Awasthi, S. Human Activity Recognition from Video Clip. In Intelligent Computing in Engineering. Advances in Intelligent Systems and Computing; Solanki, V., Hoang, M., Lu, Z., Pattnaik, P., Eds.; Springer: Singapore, 2020; Volume 1125. [Google Scholar] [CrossRef]
- Bayer, I.S. MEMS-Based Tactile Sensors: Materials, Processes and Applications in Robotics. Micromachines 2022, 13, 2051. [Google Scholar] [CrossRef]
- Kok, M.; Jeroen, D.; Hol, J.D.; Schön, T.B. Using Inertial Sensors for Position and Orientation Estimation. Found. Trends Signal Process. 2017, 11, 1–153. [Google Scholar] [CrossRef]
- Dey, N.; Williams, J. Valid Inference for Machine Learning Model Parameters. arXiv 2023, arXiv:2302.10840. [Google Scholar] [CrossRef]
- Huang, F.; Zeng, A.; Liu, M.; Lai, Q.; Xu, Q. DeepFuse: An IMU-Aware Network for Real-Time 3D Human Pose Estimation from Multi-View Image. In Proceedings of the IEEE Winter Conference on Computer Vision Applications (WACV), Snowmass, CO, USA, 1–5 March 2020; pp. 418–427. [Google Scholar] [CrossRef]
- Prasad, A.; Tyagi, A.K.; Althobaiti, M.M.; Almulihi, A.; Mansour, R.F.; Mahmoud, A.M. Human Activity Recognition Using Cell Phone-Based Accelerometer and Convolutional Neural Network. Appl. Sci. 2021, 11, 12099. [Google Scholar] [CrossRef]
- Ronao, C.A.; Cho, S.B. Human activity recognition using smartphone sensors with two-stage continuous hidden Markov models. In Proceedings of the 10th IEEE International Conference on Natural Computation (ICNC), Xiamen, China, 19–21 August 2014; pp. 681–686. [Google Scholar]
- Mo, L.; Lu, X.; Feng, Z.; Hua, W. Online Human Daily Activity Recognition with Rechargeable Wearable Sensors. Sens. Mater. 2017, 29, 1353–1365. [Google Scholar] [CrossRef][Green Version]
- Yan, W.; Shuang, C.; Hongnian, Y. A survey on wearable sensor modality centred human activity recognition in health care. Expert Syst. Appl. 2019, 137, 167–190. [Google Scholar] [CrossRef]
- Tao, W.; Chen, H.; Leu, M.; Yi, Z.; Qin, R. Attention-Based Sensor Fusion for Human Activity Recognition Using IMU Signals. arXiv 2021, arXiv:2112.11224. [Google Scholar]
- Liu, Q. Human motion state recognition based on MEMS sensors and Zigbee network. Comput. Commun. 2022, 181, 164–172. [Google Scholar] [CrossRef]
- Xefteris, V.R.; Tsanousa, A.; Mavropoulos, T.; Meditskos, G.; Vrochidis, S.; Kompatsiaris, I. Human Activity Recognition with IMU and Vital Signs Feature Fusion. In MultiMedia Modeling; Jónsson, B.Þ., Gurrin, C., Tran, M.-T., Dang-Nguyen, D.-T., Hu, A.M.-C., Thanh, B.H.T., Huet, B., Eds.; Springer: Cham, Switzerland, 2022; Volume 13141, pp. 287–298. [Google Scholar] [CrossRef]
- Nweke, H.F.; Teh, Y.W.; Mujtaba, G.; Al-Garadi, M.A. Data fusion and multiple classifier systems for human activity detection and health monitoring: Review and open research directions. Fusion 2019, 46, 147–170. [Google Scholar] [CrossRef]
- Reiss, A.; Stricker, D. Introducing a new benchmarked dataset for activity monitoring. In Proceedings of the 2012 16th International Symposium on Wearable Computers, Newcastle, UK, 18–22 June 2012; pp. 108–109. [Google Scholar]
- Yang, D.; Huang, J.; Tu, X.; Ding, G.; Shen, T.; Xiao, X. A Wearable Activity Recognition Device Using Air-Pressure and IMU Sensors. IEEE Access 2019, 7, 6611–6621. [Google Scholar] [CrossRef]
- Tao, L.; Zhang, K.N.; Tian, H.; Liu, Y.; Wang, D.Y.; Chen, Y.Q.; Yang, Y.; Ren, T.L. Graphene-Paper Pressure Sensor for Detecting Human Motions. ACS Nano 2017, 11, 8790–8795. [Google Scholar] [CrossRef]
- Fu, Z.; He, X.; Wang, E.; Huo, J.; Huang, J.; Wu, D. Personalized Human Activity Recognition Based on Integrated Wearable Sensor and Transfer Learning. Sensors 2021, 21, 885. [Google Scholar] [CrossRef]
- Patil, A.K.; Balasubramanyam, A.; Ryu, J.Y.; Chakravarthi, B.; Chai, Y.H. An Open-Source Platform for Human Pose Estimation and Tracking Using a Heterogeneous Multi-Sensor System. Sensors 2021, 21, 2340. [Google Scholar] [CrossRef]
- Fu, B.; Damer, N.; Kirchbuchner, F.; Kuijper, A. Sensing Technology for Human Activity Recognition: A Comprehensive Survey. IEEE Access 2020, 8, 83791–83820. [Google Scholar] [CrossRef]
- Fanariotis, A.; Orphanoudakis, T.; Kotrotsios, K.; Fotopoulos, V.; Keramidas, G.; Karkazis, P. Power Efficient Machine Learning Models Deployment on Edge IoT Devices. Sensors 2023, 23, 1595. [Google Scholar] [CrossRef] [PubMed]
- Chua, S.L.; Foo, L.K.; Guesgen, H.W.; Marsland, S. Incremental Learning of Human Activities in Smart Homes. Sensors 2022, 22, 8458. [Google Scholar] [CrossRef]
- Welch, G.; Bishop, G. An Introduction to Kalman Filter. Int. Conf. Comput. Graph. Interact. Tech. 1995, 1, 1–16. [Google Scholar] [CrossRef]
- Richardson, A. Logistic Regression: A Self-Learning Text, 3rd ed.; David, G., Kleinbaum, M.K., Eds.; International Statistical Review; Springer: New York, NY, USA, 2011; Volume 79, p. 296. [Google Scholar]
- Farkas, I.; Doran, E. Activity Recognition from Acceleration Data Collected with a Tri-axial Accelerometer. Acta Tech. Napoc. Electron. Telecommun 2011, 52, 38–43. [Google Scholar]
- Sukor, A.S.A.; Zakaria, A.; Rahim, N.A. Activity recognition using accelerometer sensor and machine learning classifiers. In Proceedings of the IEEE 14th International Colloquium on Signal Processing & Its Applications (CSPA), Penang, Malaysia, 9–10 March 2018; pp. 233–238. [Google Scholar] [CrossRef]
- Nurwulan, N.R. Performance evaluation of decomposition methods in perturbed walking. Rev. d’Intelligence Artif. 2020, 34, 45–50. [Google Scholar] [CrossRef]
- Maroco, J.; Silva, D.; Rodrigues, A.; Guerreiro, M.; Santana, I.; de Mendonça, A. Data mining methods in the prediction of dementia: A real-data comparison of the accuracy, sensitivity and specificity of linear discriminant analysis, logistic regression, neural networks, support vector machines, classification trees and random forests. BMC Res. Notes 2011, 4, 299. [Google Scholar] [CrossRef] [PubMed]
Disclaimer/Publisher’s Note: The statements, opinions and data contained in all publications are solely those of the individual author(s) and contributor(s) and not of MDPI and/or the editor(s). MDPI and/or the editor(s) disclaim responsibility for any injury to people or property resulting from any ideas, methods, instructions or products referred to in the content. |
© 2025 by the authors. Licensee MDPI, Basel, Switzerland. This article is an open access article distributed under the terms and conditions of the Creative Commons Attribution (CC BY) license (https://creativecommons.org/licenses/by/4.0/).