
In Vitro Analysis and Assessment of the Bioavailability of Selected Minerals and B Vitamins in Kefir Enriched with Microalgae


Abstract
1. Introduction
2. Materials and Methods
2.1. Tested Material
2.2. In Vitro Digestion
2.3. Mineralization
2.4. Protein Analysis
2.5. Phosphorus Analysis
2.6. Iron Analysis
2.7. Analysis of Iodine
2.8. Vitamin B2 Analysis
2.9. Vitamin B12 Analysis
2.10. Statistical Analyses
3. Results
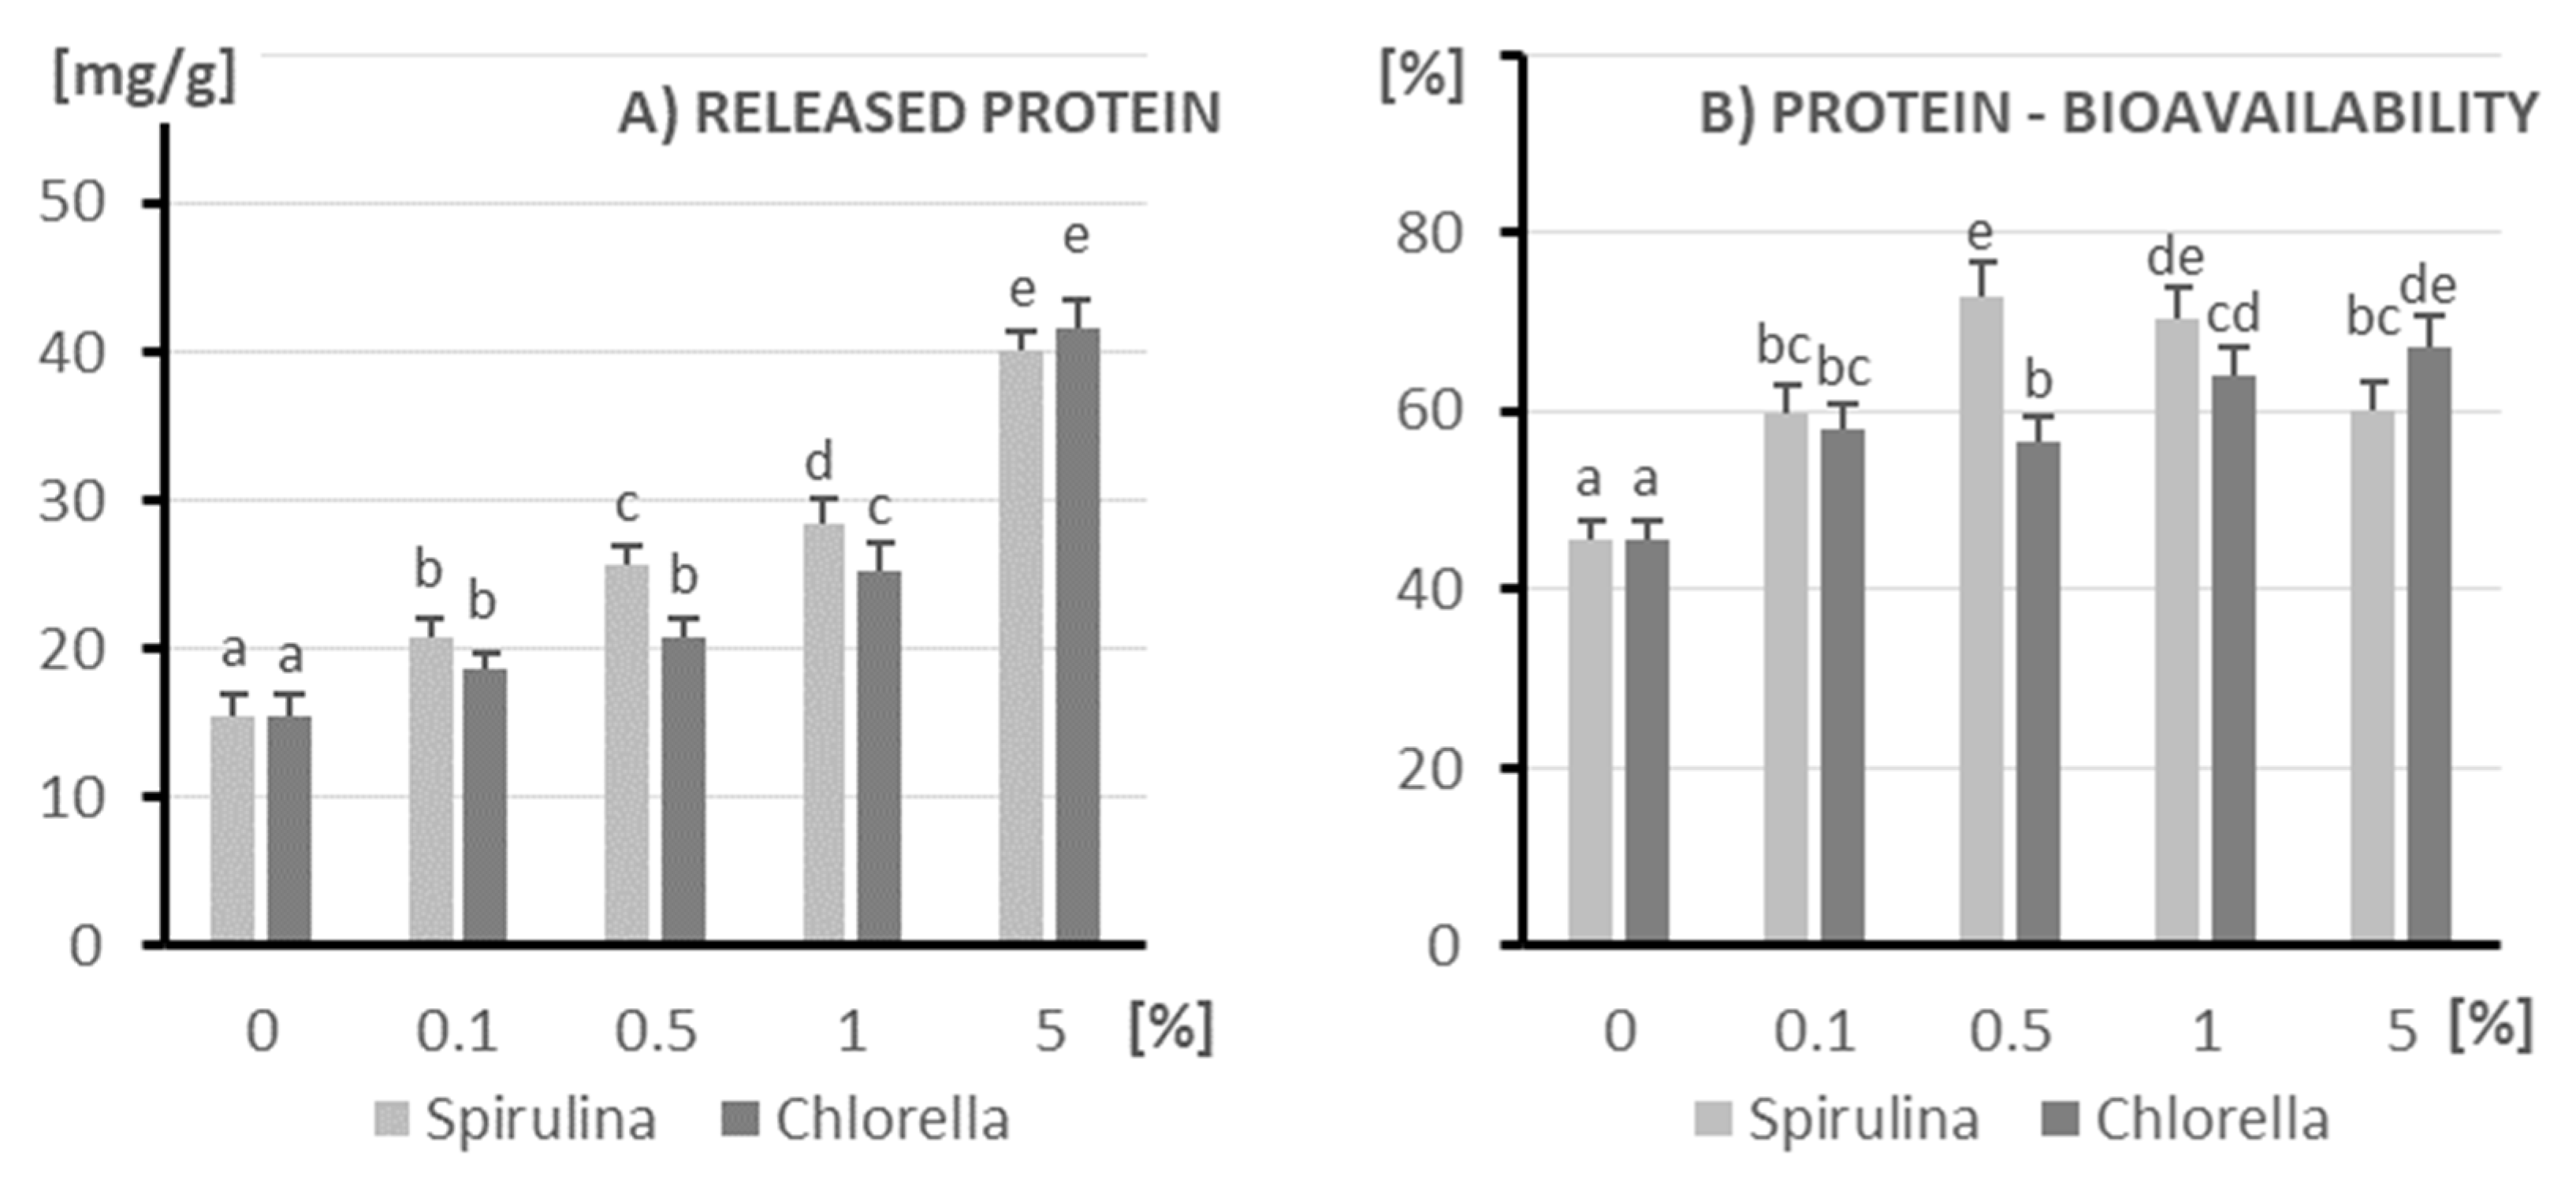
3.1. Protein
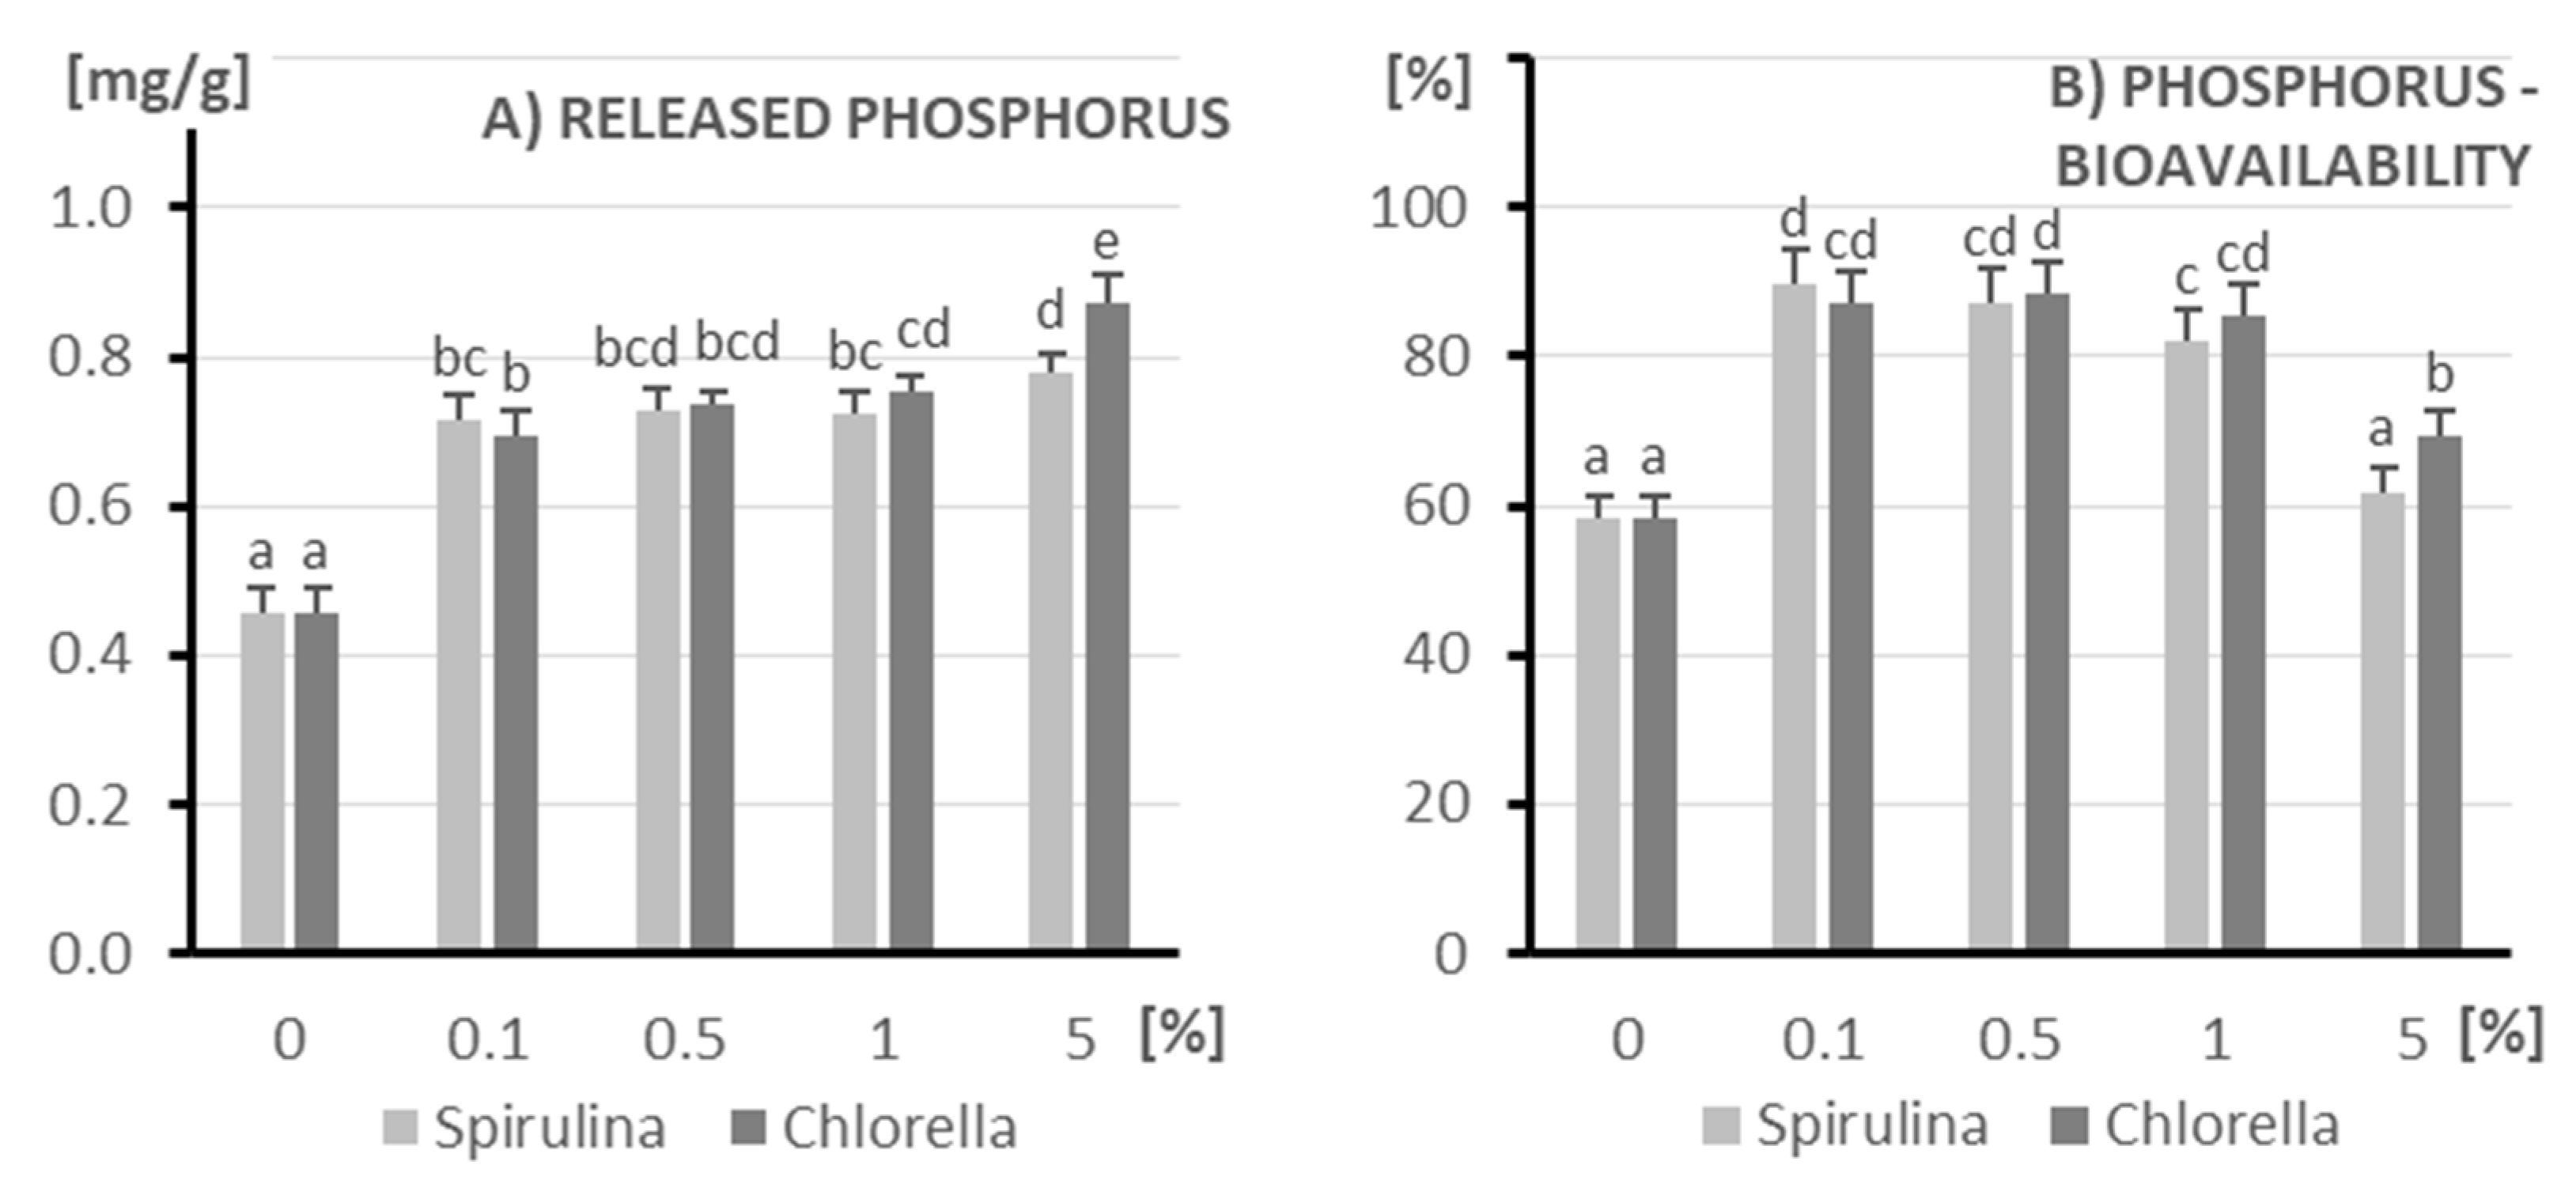
3.2. Phosphorus
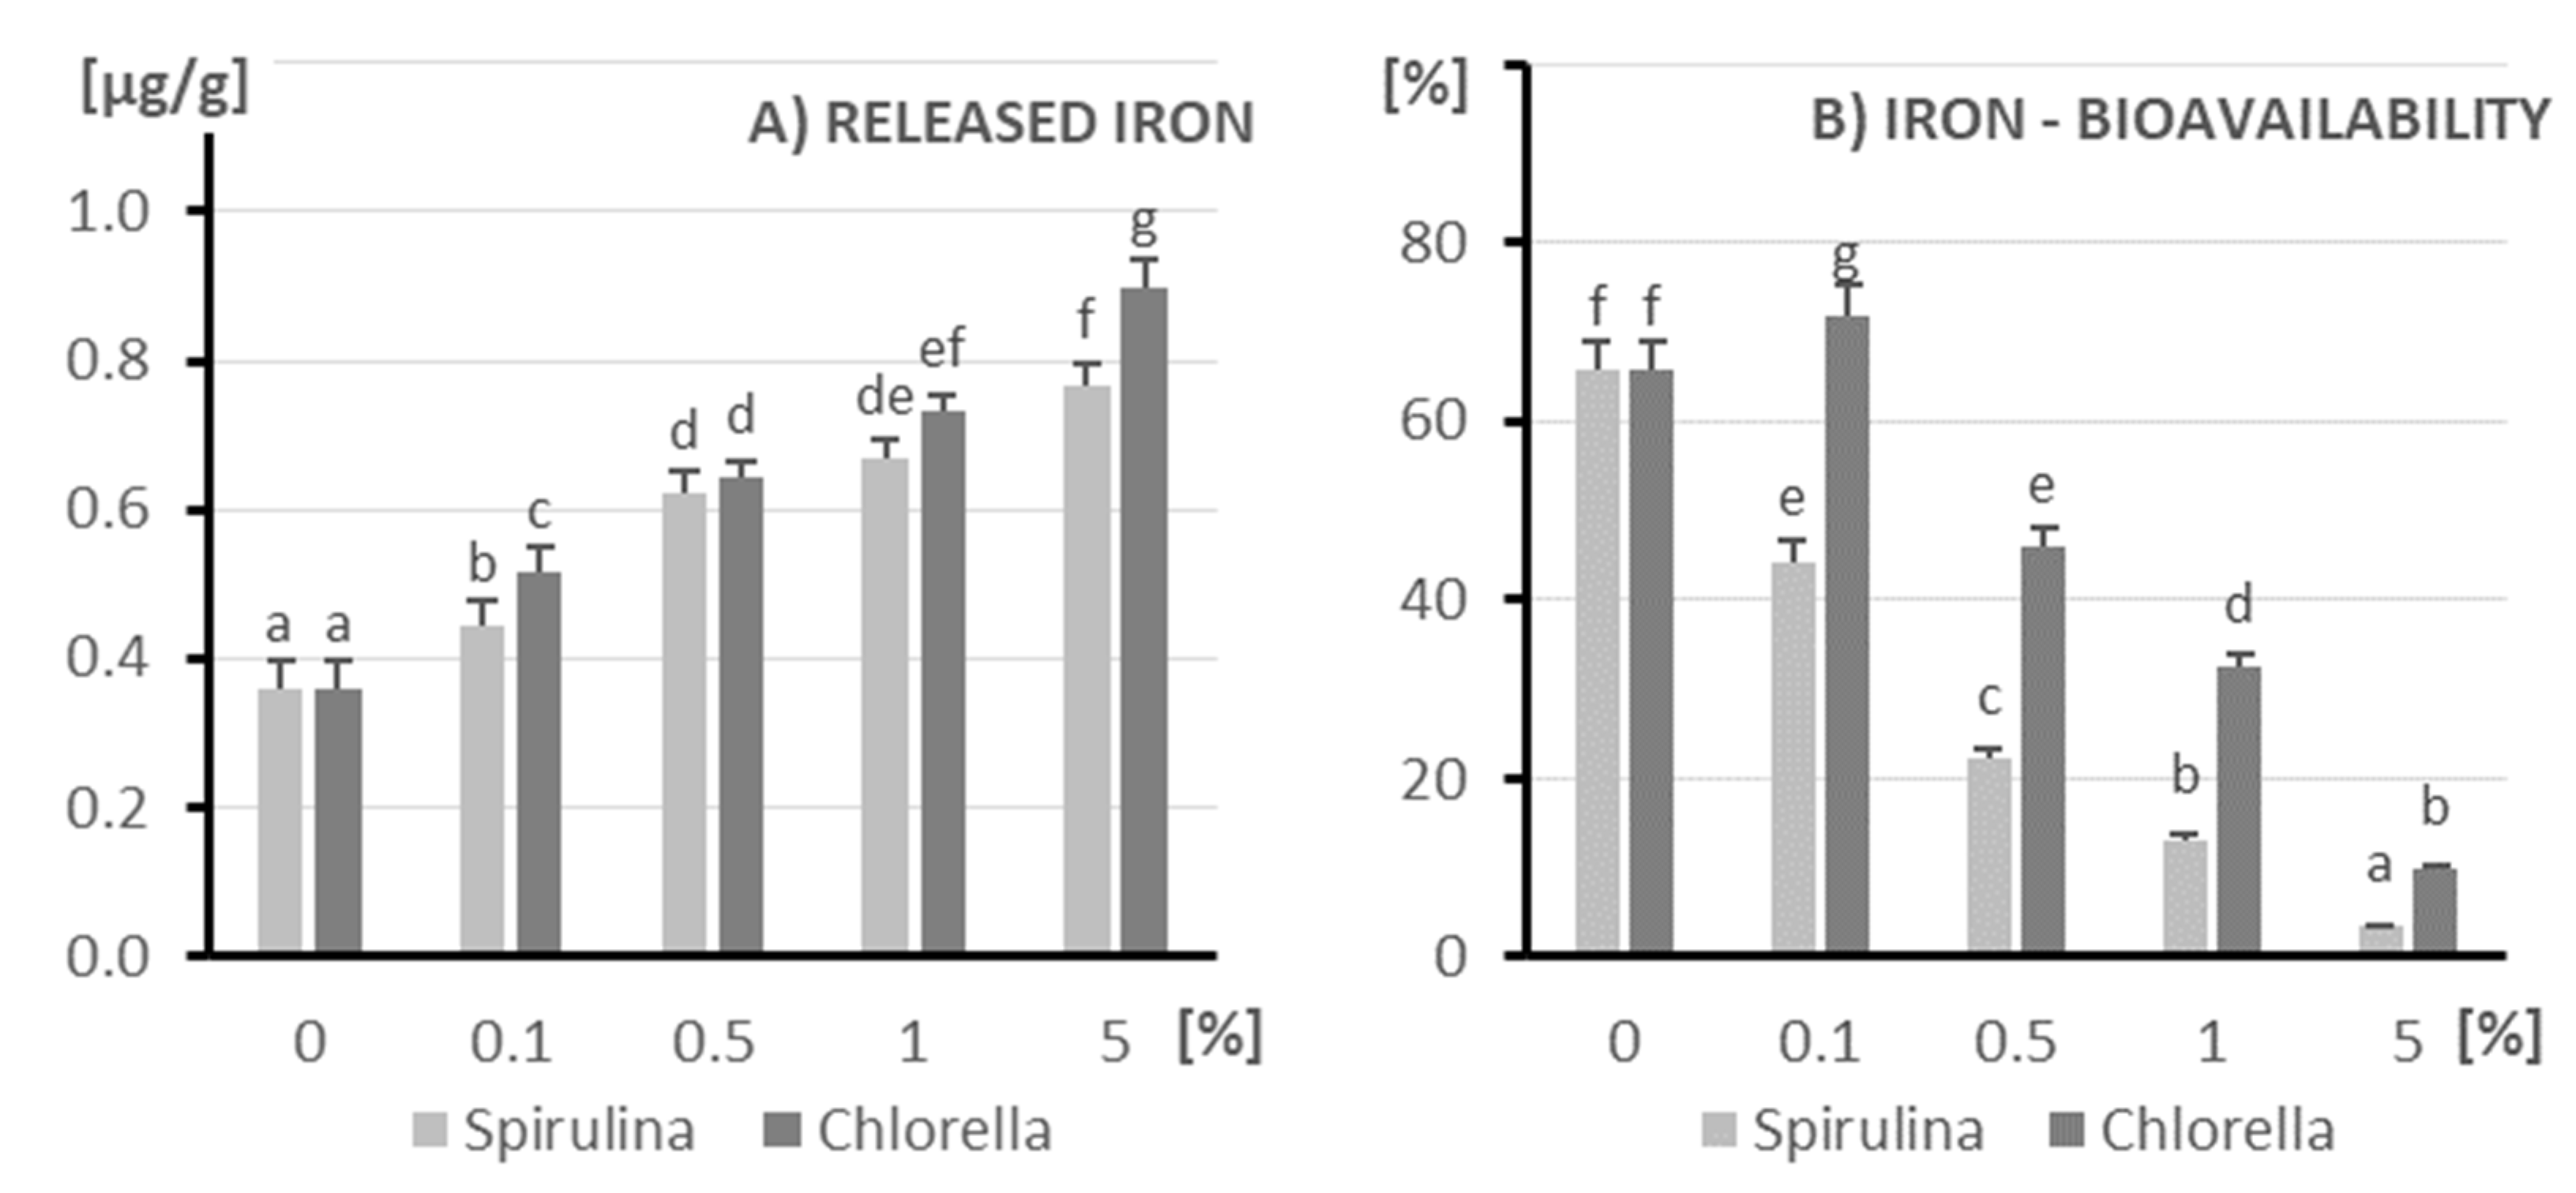
3.3. Iron
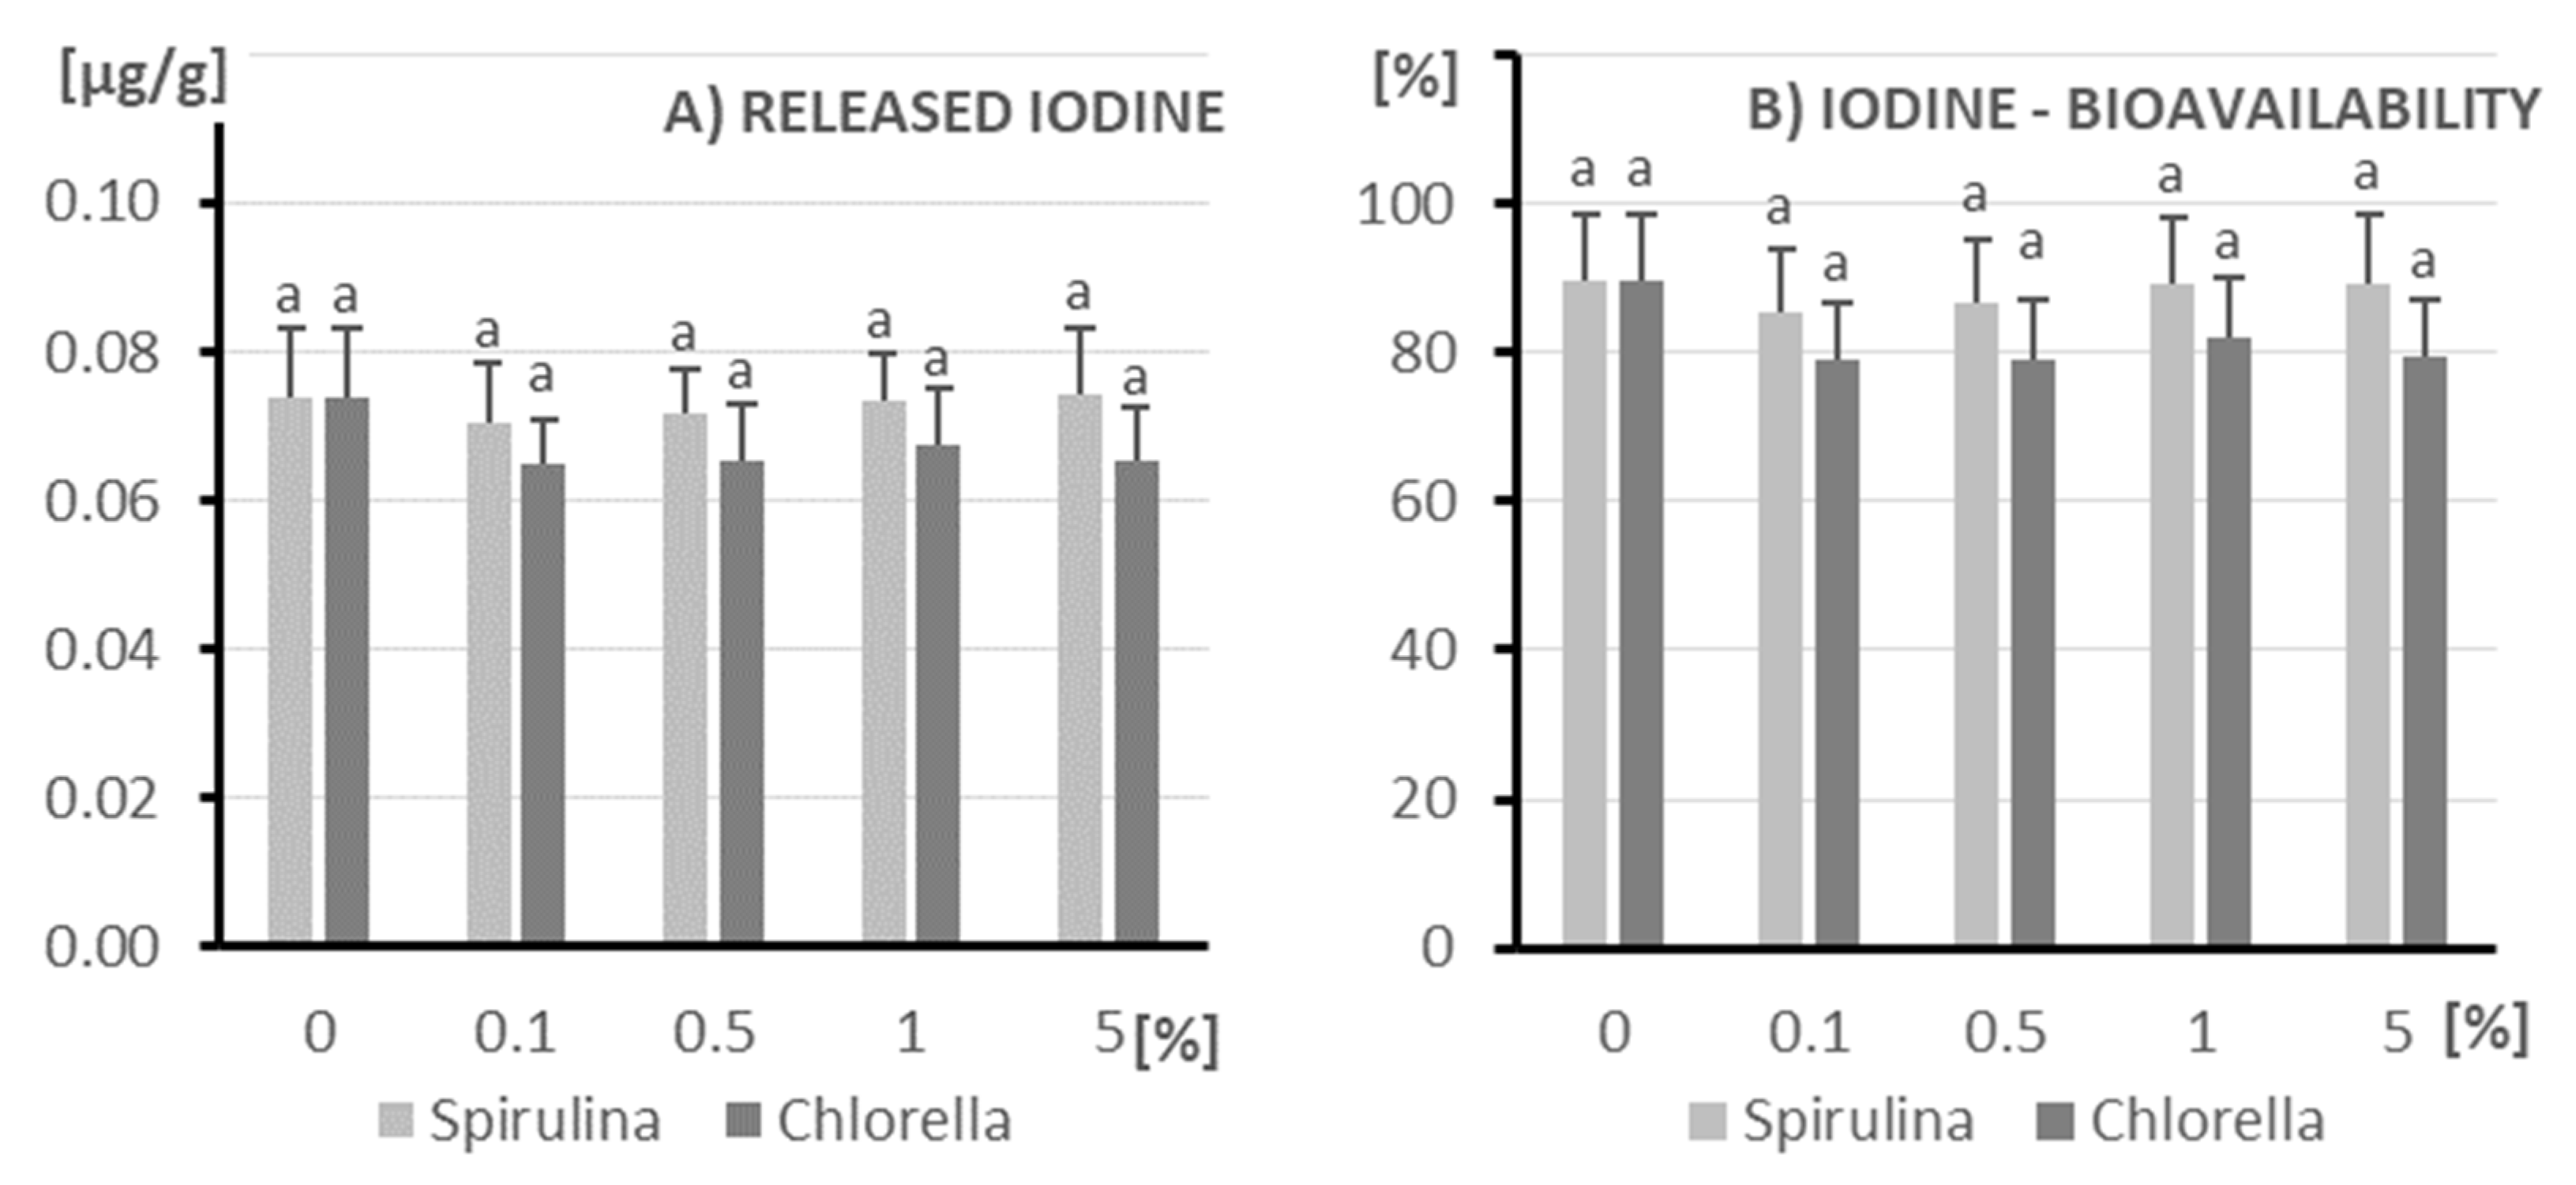
3.4. Iodine
3.5. Vitamin B2
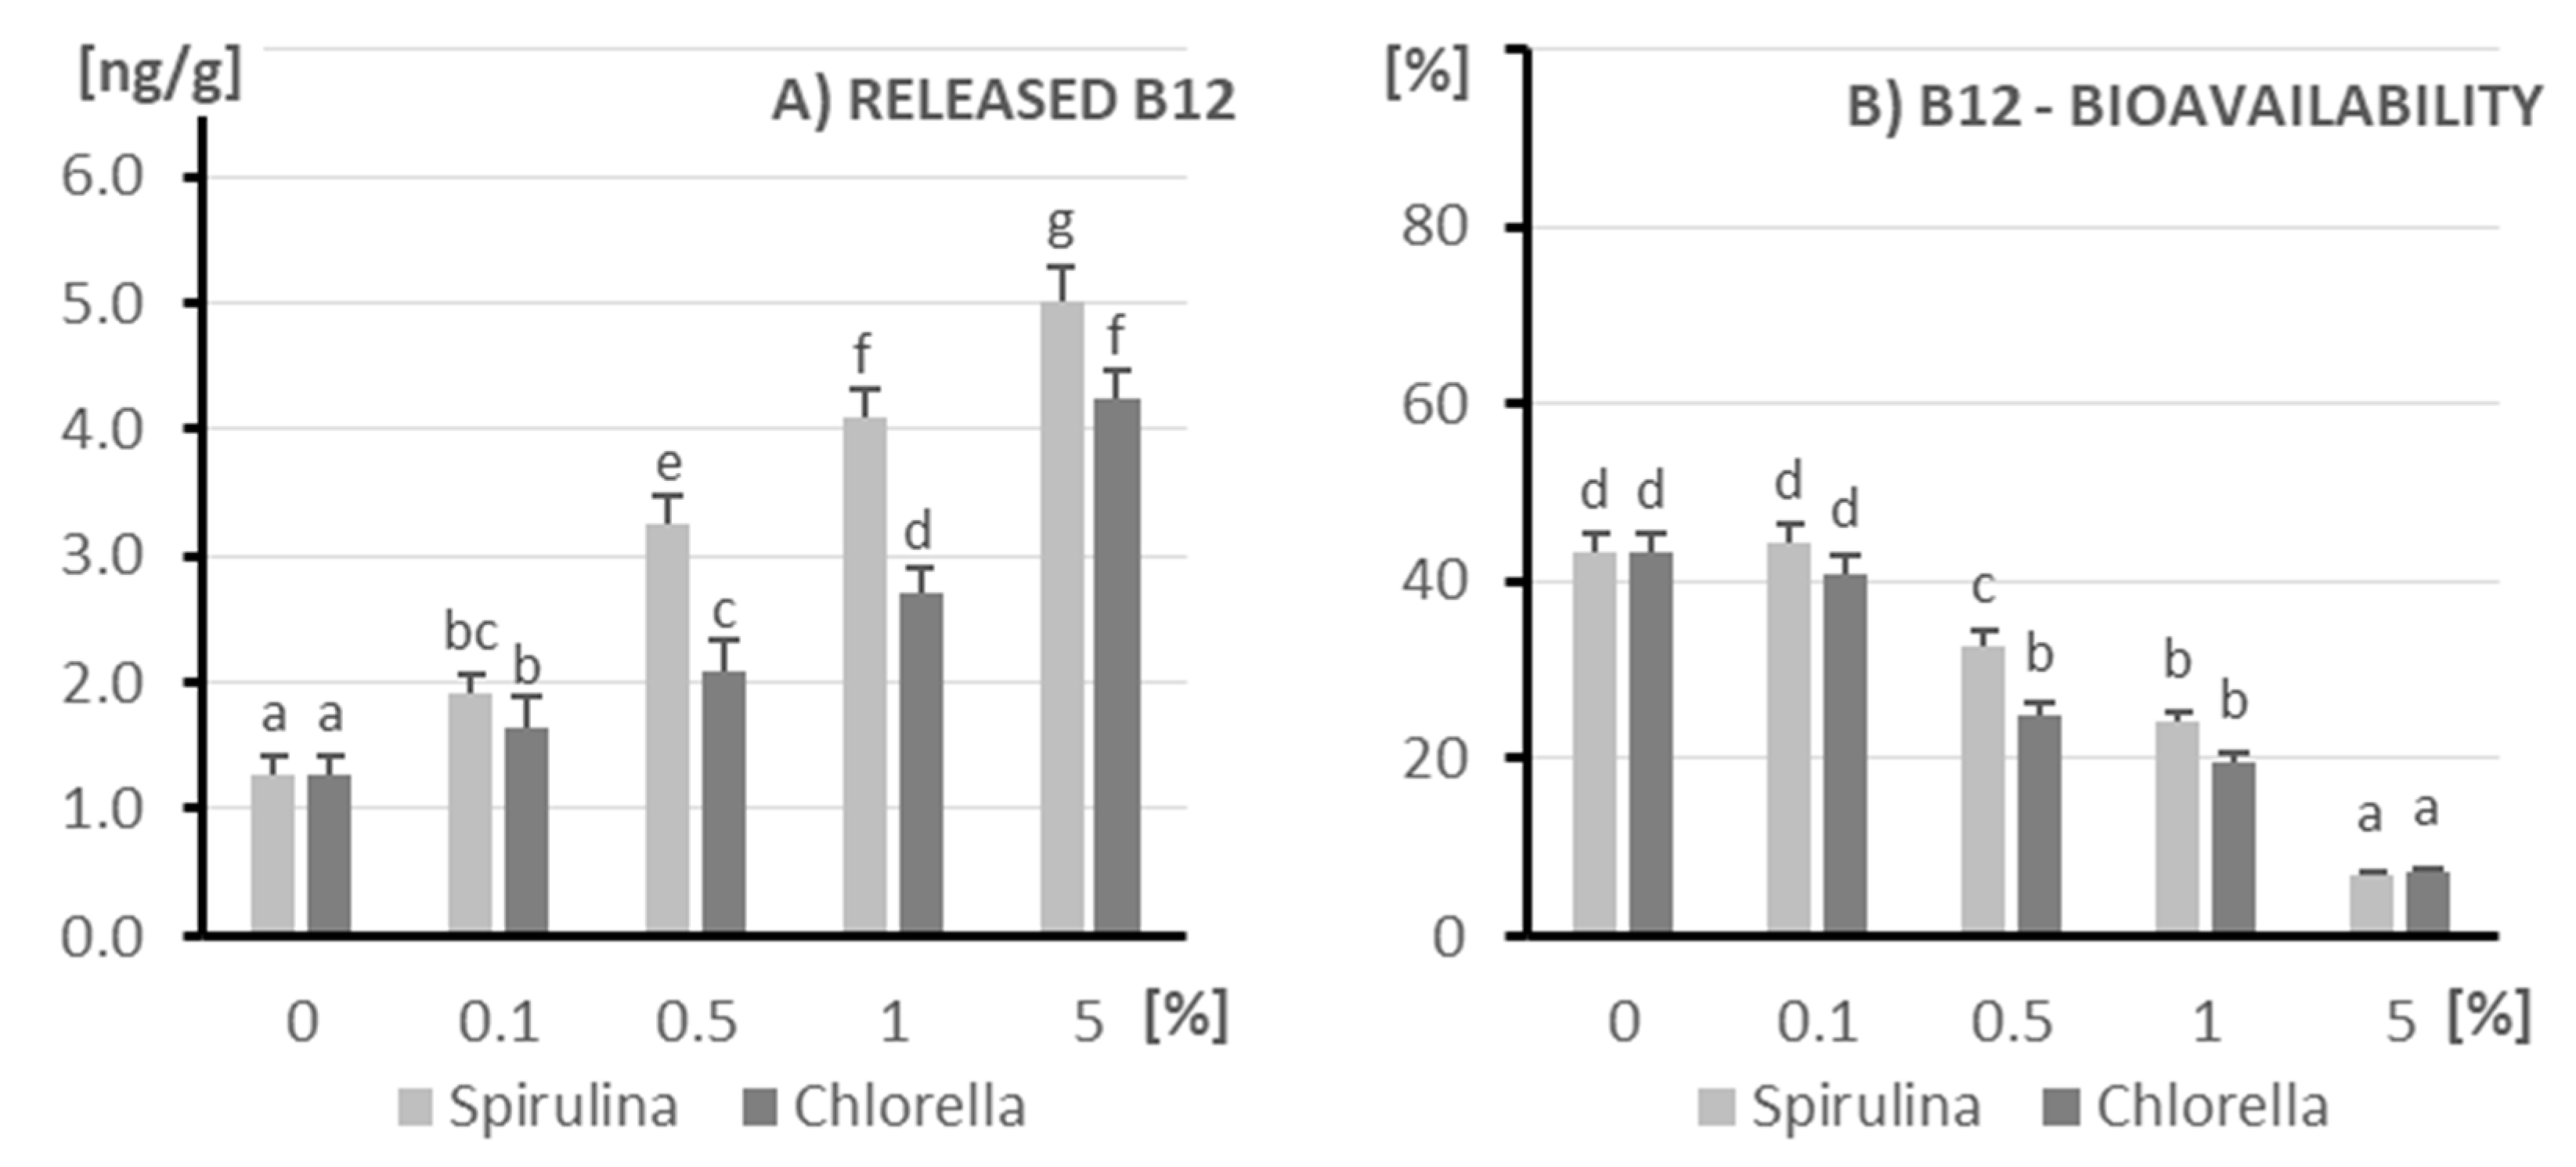
3.6. Vitamin B12
4. Discussion
5. Conclusions
Author Contributions
Funding
Institutional Review Board Statement
Informed Consent Statement
Data Availability Statement
Acknowledgments
Conflicts of Interest
References
- Sanguigni, V.; Manco, M.; Sorge, R.; Gnessi, L.; Francomano, D. Natural Antioxidant Ice Cream Acutely Reduces Oxidative Stress and Improves Vascular Function and Physical Performance in Healthy Individuals. Nutrition 2017, 33, 225–233. [Google Scholar] [CrossRef] [PubMed]
- Turgut, T.; Cakmakci, S. Investigation of the Possible Use of Probiotics in Ice Cream Manufacture. Int. J. Dairy Technol. 2009, 62, 444–451. [Google Scholar] [CrossRef]
- Becker, E.W. Microalgae for Human and Animal Nutrition. In Handbook of Microalgal Culture; Amos, R., Qiang, H., Eds.; Wiley: Hoboken, NJ, USA, 2013; pp. 461–503. [Google Scholar]
- Dohaish, E.; Dhahri, M.A.; Omar, H. Potential application of the blue-green alga (Spirulina platensis) as a supplement in the diet of nile tilapia (Oreochromis niloticus). Appl. Ecol. Environ. Res. 2018, 16, 7883–7902. [Google Scholar] [CrossRef]
- Gouveia, L.; Marques, A.E.; Sousa, J.M.; Moura, P.; Bandarra, N.M. Microalgae—Source of Natural Bioactive Molecules as Functional Ingredients. Food Sci. Technol. Bull. Funct. Foods 2010, 7, 21–37. [Google Scholar] [CrossRef]
- Voloshin, R.A.; Rodionova, M.V.; Zharmukhamedov, S.K.; Nejat Veziroglu, T.; Allakhverdiev, S.I. Review: Biofuel Production from Plant and Algal Biomass. Int. J. Hydrogen Energy 2016, 41, 17257–17273. [Google Scholar] [CrossRef]
- de Boer, L. Biotechnological Production of Colorants. Adv. Biochem. Eng. Biotechnol. 2013, 143, 51–89. [Google Scholar] [CrossRef]
- Sun, H.; Wang, Y.; He, Y.; Liu, B.; Mou, H.; Chen, F.; Yang, S. Microalgae-Derived Pigments for the Food Industry. Mar. Drugs 2023, 21, 82. [Google Scholar] [CrossRef]
- Andrade, L.M.; Andrade, C.J.; Dias, M.; Nascimento, C.A.; Mendes, M.A. Chlorella and Spirulina Microalgae as Sources of Functional Foods, Nutraceuticals, and Food Supplements; an Overview. MOJ Food Process. Technol. 2018, 6, 45–58. [Google Scholar] [CrossRef]
- Pehlivanov, I.; Gentscheva, G.; Nikolova, K.; Andonova, V. Some Applications of Arthrospira platensis and Algae in Pharmaceutical and Food Technologies. Biointerface Res. Appl. Chem. 2024, 14, 32. [Google Scholar] [CrossRef]
- Fleurence, J. Seaweed Proteins: Biochemical, Nutritional Aspects and Potential Uses. Trends Food Sci. Technol. 1999, 10, 25–28. [Google Scholar] [CrossRef]
- Nuhu, A.A. Spirulina (Arthrospira): An Important Source of Nutritional and Medicinal Compounds. J. Mar. Sci. 2013, 2013, 325636. [Google Scholar] [CrossRef]
- Manirafasha, E.; Ndikubwimana, T.; Zeng, X.; Lu, Y.; Jing, K. Phycobiliprotein: Potential Microalgae Derived Pharmaceutical and Biological Reagent. Biochem. Eng. J. 2016, 109, 282–296. [Google Scholar] [CrossRef]
- Byczyński, Ł.; Duliński, R. The effect of the addition of algae to rye bread on the content and in vitro availability of selected micro- and macroelements. Food Sci. Technol. Qual. 2022, 29, 86–98. [Google Scholar] [CrossRef]
- Batista, A.P.; Niccolai, A.; Fradinho, P.; Fragoso, S.; Bursic, I.; Rodolfi, L.; Biondi, N.; Tredici, M.R.; Sousa, I.; Raymundo, A. Microalgae Biomass as an Alternative Ingredient in Cookies: Sensory, Physical and Chemical Properties, Antioxidant Activity and In Vitro Digestibility. Algal. Res. 2017, 26, 161–171. [Google Scholar] [CrossRef]
- Donato, N.R.; de Melo Queiroz, A.J.; Feitosa, R.M.; de Figueirêdo, R.M.F.; dos Santos Moreira, I.; de Lima, J.F. Production of Cookies Enriched With Spirulina platensis Biomass. J. Agric. Stud. 2019, 7, 323–342. [Google Scholar] [CrossRef]
- La Torre, C.; Caputo, P.; Cione, E.; Fazio, A. Comparing Nutritional Values and Bioactivity of Kefir from Different Types of Animal Milk. Molecules 2024, 29, 2710. [Google Scholar] [CrossRef]
- Rosa, D.D.; Dias, M.M.S.; Grześkowiak, Ł.M.; Reis, S.A.; Conceição, L.L.; Peluzio, M.D.C.G. Milk Kefir: Nutritional, Microbiological and Health Benefits. Nutr. Res. Rev. 2017, 30, 82–96. [Google Scholar] [CrossRef]
- Otles, S. Ozlem Cagindi Kefir: A Probiotic Dairy-Composition, Nutritional and Therapeutic Aspects. Pakistan J. Nutr. 2003, 2, 54–59. [Google Scholar]
- Yilmaz-Ersan, L.; Ozcan, T.; Usta-Gorgun, B.; Ciniviz, M.; Keser, G.; Bengu, I.; Keser, R.A. Bioaccessibility and Antioxidant Capacity of Kefir-Based Smoothies Fortified with Kale and Spinach after in Vitro Gastrointestinal Digestion. Food Sci. Nutr. 2024, 12, 2153–2165. [Google Scholar] [CrossRef]
- Perales, S.; Barberá, R.; Lagarda, M.J.; Farré, R. Fortification of Milk with Calcium: Effect on Calcium Bioavailability and Interactions with Iron and Zinc. J. Agric. Food Chem. 2006, 54, 4901–4906. [Google Scholar] [CrossRef]
- Szmejda, K.; Duliński, R.; Byczyński, Ł.; Karbowski, A.; Florczyk, T.; Żyła, K. Analysis of the Selected Antioxidant Compounds n Ice Cream Supplemented with Spirulina (Arthrospira platensis) Extract. Biotechnol. Food Sci. 2018, 82, 41–48. [Google Scholar] [CrossRef]
- Bosnea, L.; Terpou, A.; Pappa, E.; Kondyli, E.; Mataragas, M.; Markou, G.; Katsaros, G. Incorporation of Spirulina platensis on Traditional Greek Soft Cheese with Respect to Its Nutritional and Sensory Perspectives. In Proceedings of the 1st International Electronic Conference on Food Science and Functional Foods, Online, 10–25 November 2020; MDPI: Basel, Switzerland, 2020; p. 99. [Google Scholar]
- Lv, K.; Yuan, Q.; Li, H.; Li, T.; Ma, H.; Gao, C.; Zhang, S.; Liu, Y.; Zhao, L. Chlorella pyrenoidosa Polysaccharides as a Prebiotic to Modulate Gut Microbiota: Physicochemical Properties and Fermentation Characteristics In Vitro. Foods 2022, 11, 725. [Google Scholar] [CrossRef]
- Ovando, C.A.; Carvalho, J.C.D.; Vinícius de Melo Pereira, G.; Jacques, P.; Soccol, V.T.; Soccol, C.R. Functional Properties and Health Benefits of Bioactive Peptides Derived from Spirulina: A Review. Food Rev. Int. 2018, 34, 34–51. [Google Scholar] [CrossRef]
- Çelekli, A.; Özbal, B.; Bozkurt, H. Challenges in Functional Food Products with the Incorporation of Some Microalgae. Foods 2024, 13, 725. [Google Scholar] [CrossRef] [PubMed]
- Hosseinkhani, N.; McCauley, J.I.; Ralph, P.J. Key Challenges for the Commercial Expansion of Ingredients from Algae into Human Food Products. Algal Res. 2022, 64, 102696. [Google Scholar] [CrossRef]
- Lowry, O.H.; Rosebrough, N.J.; Farr, A.L.; Randall, R.J. Protein measurement with the Folin phenol reagent. J. Biol. Chem. 1951, 193, 265–275. [Google Scholar] [CrossRef] [PubMed]
- Fiske, C.H.; Subbarow, Y. The Colorimetric Determination of Phosphorus. J. Biol. Chem. 1925, 66, 375–400. [Google Scholar] [CrossRef]
- Pyenson, H.; Tracy, P.H. A 1,10—Phenanthroline Method for the Determination of Iron in Powdered Milk. J. Dairy Sci. 1945, 28, 401–412. [Google Scholar] [CrossRef]
- PN-EN 15111—2008; Foodstuffs—Determination of Trace Elements—Determination of Iodine by ICP-MS (Inductively Coupled Plasma Mass Spectrometry). Polish Committee of Standardization: Warsaw, Poland, 2007. (In Polish)
- Smoleń, S.; Kowalska, I.; Halka, M.; Ledwozyw-Smoleń, I.; Grzanka, M.; Skoczylas, Ł.; Czernicka, M.; Pitala, J. Selected Aspects of Iodate and Iodosalicylate Metabolism in Lettuce Including the Activity of Vanadium Dependent Haloperoxidases as Affected by Exogenous Vanadium. Agronomy 2020, 10, 1. [Google Scholar] [CrossRef]
- Starzyńska-Janiszewska, A.; Stodolak, B.; Duliński, R.; Baczkowicz, M.; Mickowska, B.; Wikiera, A.; Byczyński, L. Effect of Solid-State Fermentation Tempe Type on Antioxidant and Nutritional Parameters of Buckwheat Groats as Compared with Hydrothermal Processing. J. Food Process Preserv. 2016, 40, 298–305. [Google Scholar] [CrossRef]
- Gentscheva, G.; Nikolova, K.; Panayotova, V.; Peycheva, K.; Makedonski, L.; Slavov, P.; Radusheva, P.; Petrova, P.; Yotkovska, I. Application of Arthrospira platensis for Medicinal Purposes and the Food Industry: A Review of the Literature. Life 2023, 13, 845. [Google Scholar] [CrossRef] [PubMed]
- Puyfoulhoux, G.; Rouanet, J.M.; Besançon, P.; Baroux, B.; Baccou, J.C.; Caporiccio, B. Iron Availability from Iron-Fortified Spirulina by an In Vitro Digestion/Caco-2 Cell Culture Model. J. Agric. Food Chem. 2001, 49, 1625–1629. [Google Scholar] [CrossRef]
- Allen, L.H. Bioavailability of Vitamin B12. Int. J. Vitam. Nutr. Res. 2010, 80, 330–335. [Google Scholar] [CrossRef]
- Watanabe, F.; Katsura, H.; Takenaka, S.; Fujita, T.; Abe, K.; Tamura, Y.; Nakatsuka, T.; Nakano, Y. Pseudovitamin B12 Is the Predominant Cobamide of an Algal Health Food, Spirulina Tablets. J. Agric. Food Chem. 1999, 47, 4736–4741. [Google Scholar] [CrossRef]
- Watanabe, F.; Yabuta, Y.; Bito, T.; Teng, F. Vitamin B12-Containing Plant Food Sources for Vegetarians. Nutrients 2014, 6, 1861–1873. [Google Scholar] [CrossRef]
- Wu, Q.; Liu, L.; Miron, A.; Klímová, B.; Wan, D.; Kuča, K. The Antioxidant, Immunomodulatory, and Anti-Inflammatory Activities of Spirulina: An Overview. Arch. Toxicol. 2016, 90, 1817–1840. [Google Scholar] [CrossRef]
- Fradique, M.; Batista, A.P.; Nunes, M.C.; Gouveia, L.; Bandarra, N.M.; Raymundo, A. Incorporation of Chlorella Vulgaris and Spirulina Maxima Biomass in Pasta Products. Part 1: Preparation and Evaluation. J. Sci. Food Agric. 2010, 90, 1656–1664. [Google Scholar] [CrossRef]
- Rodríguez De Marco, E.; Steffolani, M.E.; Martínez, C.S.; León, A.E. Effects of Spirulina Biomass on the Technological and Nutritional Quality of Bread Wheat Pasta. LWT-Food Sci. Technol. 2014, 58, 102–108. [Google Scholar] [CrossRef]
- da Silva, S.C.; Fernandes, I.P.; Barros, L.; Fernandes, Â.; José Alves, M.; Calhelha, R.C.; Pereira, C.; Barreira, J.C.M.; Manrique, Y.; Colla, E.; et al. Spray-Dried Spirulina platensis as an Effective Ingredient to Improve Yogurt Formulations: Testing Different Encapsulating Solutions. J. Funct. Foods 2019, 60, 103427. [Google Scholar] [CrossRef]
- Atallah, A.A.; Morsy, O.M.; Gemiel, D.G. Characterization of Functional Low-Fat Yogurt Enriched with Whey Protein Concentrate, Ca-Caseinate and Spirulina. Int. J. Food Prop. 2020, 23, 1678–1691. [Google Scholar] [CrossRef]
- Vlasenko, I.; Bandura, V.; Semko, T.; Fialkovska, L.; Ivanishcheva, O.; Palamarchuk, V. Innovative Approaches to the Development of a New Sour Milk Product. Potravin. Slovak J. Food Sci. 2021, 15, 970–981. [Google Scholar] [CrossRef] [PubMed]
- Kaczmarczyk, E.; Łukasiak, J.; Szczurowski, K.; Prusakowski, M. Preparation of Iron(II) and Selenium(IV) Dietary Supplements by Their Biotransformation in Arthrospira Sp. Food Sci. Technol. Qual. 2024, 31, 199–210. [Google Scholar] [CrossRef]
- Piskin, E.; Cianciosi, D.; Gulec, S.; Tomas, M.; Capanoglu, E. Iron Absorption: Factors, Limitations, and Improvement Methods. ACS Omega 2022, 7, 20441–20456. [Google Scholar] [CrossRef]
- Isani, G.; Ferlizza, E.; Bertocchi, M.; Dalmonte, T.; Menotta, S.; Fedrizzi, G.; Andreani, G. Iron Content, Iron Speciation and Phycocyanin in Commercial Samples of Arthrospira Spp. Int. J. Mol. Sci. 2022, 23, 13949. [Google Scholar] [CrossRef]
- Abo-Shady, A.M.; Gheda, S.F.; Ismail, G.A.; Cotas, J.; Pereira, L.; Abdel-Karim, O.H. Antioxidant and Antidiabetic Activity of Algae. Life 2023, 13, 460. [Google Scholar] [CrossRef]
- Kougia, E.; Ioannou, E.; Roussis, V.; Tzovenis, I.; Chentir, I.; Markou, G. Iron (Fe) Biofortification of Arthrospira platensis: Effects on Growth, Biochemical Composition and in Vitro Iron Bioaccessibility. Algal Res. 2023, 70, 103016. [Google Scholar] [CrossRef]
- Rutar, J.M.; Hudobivnik, M.J.; Nečemer, M.; Mikuš, K.V.; Arčon, I.; Ogrinc, N. Nutritional Quality and Safety of the Spirulina Dietary Supplements Sold on the Slovenian Market. Foods 2022, 11, 849. [Google Scholar] [CrossRef]
- Batista, A.P.; Gouveia, L.; Bandarra, N.M.; Franco, J.M.; Raymundo, A. Comparison of Microalgal Biomass Profiles as Novel Functional Ingredient for Food Products. Algal Res. 2013, 2, 164–173. [Google Scholar] [CrossRef]
- Safi, C.; Zebib, B.; Merah, O.; Pontalier, P.Y.; Vaca-Garcia, C. Morphology, Composition, Production, Processing and Applications of Chlorella Vulgaris: A Review. Renew. Sustain. Energy Rev. 2014, 35, 265–278. [Google Scholar] [CrossRef]
- Brown, M.R.; Jeffrey, S.W.; Volkman, J.K.; Dunstan, G.A. Nutritional Properties of Microalgae for Mariculture. Aquaculture 1997, 151, 315–331. [Google Scholar] [CrossRef]
- Niccolai, A.; Chini Zittelli, G.; Rodolfi, L.; Biondi, N.; Tredici, M.R. Microalgae of Interest as Food Source: Biochemical Composition and Digestibility. Algal Res. 2019, 42, 101617. [Google Scholar] [CrossRef]
- Hernández, H.; Nunes, M.C.; Prista, C.; Raymundo, A. Innovative and Healthier Dairy Products through the Addition of Microalgae: A Review. Foods 2022, 11, 755. [Google Scholar] [CrossRef] [PubMed]
- Wolak, N.; Zawrotniak, M.; Gogol, M.; Kozik, A.; Rapala-Kozik, M. Vitamins B1, B2, B3 and B9—Occurrence, Biosynthesis Pathways and Functions in Human Nutrition. Mini-Rev. Med. Chem. 2016, 17, 1075–1111. [Google Scholar] [CrossRef] [PubMed]
- Ottaway, P.B. Stability of Vitamins during Food Processing and Storage. In Chemical Deterioration and Physical Instability of Food and Beverages; Skibsted, L.H., Risbo, J., Andersen, M.L., Eds.; Woodhead Publishing: Sawston, UK, 2010; pp. 539–560. ISBN 9781845694951. [Google Scholar]
- Olive Li, Y.; Dueik González, V.P.; Diosady, L.L. Microencapsulation of Vitamins, Minerals, and Nutraceuticals for Food Applications. In Microencapsulation in the Food Industry: A Practical Implementation Guide; Academic Press: Cambridge, MA, USA, 2014; pp. 501–522. [Google Scholar] [CrossRef]
- Schwechheimer, S.K.; Park, E.Y.; Revuelta, J.L.; Becker, J.; Wittmann, C. Biotechnology of Riboflavin. Appl. Microbiol. Biotechnol. 2016, 100, 2107–2119. [Google Scholar] [CrossRef]
- Russo, P.; Capozzi, V.; Arena, M.P.; Spadaccino, G.; Dueñas, M.T.; López, P.; Fiocco, D.; Spano, G. Riboflavin-Overproducing Strains of Lactobacillus Fermentum for Riboflavin-Enriched Bread. Appl. Microbiol. Biotechnol. 2014, 98, 3691–3700. [Google Scholar] [CrossRef]
- Doets, E.L.; In’t Veld, P.H.; Szczecińska, A.; Dhonukshe-Rutten, R.A.M.; Cavelaars, A.E.J.M.; Van ’t Veer, P.; Brzozowska, A.; De Groot, L.C.P.G.M. Systematic Review on Daily Vitamin B12 Losses and Bioavailability for Deriving Recommendations on Vitamin B12 Intake with the Factorial Approach. Ann. Nutr. Metab. 2013, 62, 311–322. [Google Scholar] [CrossRef]
- Duliński, R.; Byczyński, Ł.; Karbowski, A. The Effect of Arthrospira platensis (Spirulina) Addition on the Content of Selected Mineral Elements, Carotenes, and Antioxidant Potential in Alginate Gel Beads. Int. J. Food Eng. 2020, 16, 20190053. [Google Scholar] [CrossRef]
- Wang, Z.J.; Shi, H.L.; Wang, P. The Online Morphology Control and Dynamic Studies on Improving Vitamin B12 Production by Pseudomonas Denitrificans with Online Capacitance and Specific Oxygen Consumption Rate. Appl. Biochem. Biotechnol. 2016, 179, 1115–1127. [Google Scholar] [CrossRef]
- van den Berg, H.; Brandsen, L.; Sinkeldam, B.J. Vitamin B-12 Content and Bioavailability of Spirulina and Nori in Rats. J. Nutr. Biochem. 1991, 2, 314–318. [Google Scholar] [CrossRef]
- Merchant, R.E.; Phillips, T.W.; Udani, J. Nutritional Supplementation with Chlorella Pyrenoidosa Lowers Serum Methylmalonic Acid in Vegans and Vegetarians with a Suspected Vitamin B12 Deficiency. J. Med. Food 2015, 18, 1357–1362. [Google Scholar] [CrossRef]


| Nutritional Value Per 100 g of Product | |||
|---|---|---|---|
| Kefir | Spirulina (Arthrospira platensis) | Chlorella (Chlorella pyrenoidosa) | |
| Protein | 3.4 g (3.2 g) | 68.5 g (57.5 g) | 58.9 g (60 g) |
| Phosphorus | 75 mg (n.d.) | 876 mg (n.d.) | 1014 mg (n.d.) |
| Iron | 0.06 mg (n.d.) | 45.1 mg (58.6 mg) | 17.1 mg (n.d.) |
| Iodine | 8.25 µg (n.d.) | 9.65 µg (1700 µg) | 7.74 µg (860 µg) |
| B2 | 0.131 mg (n.d.) | 3.82 mg (n.d.) | 3.05 mg (n.d.) |
| B12 | 0.292 µg (n.d.) | 140 µg (n.d.) | 110 µg (n.d.) |
Disclaimer/Publisher’s Note: The statements, opinions and data contained in all publications are solely those of the individual author(s) and contributor(s) and not of MDPI and/or the editor(s). MDPI and/or the editor(s) disclaim responsibility for any injury to people or property resulting from any ideas, methods, instructions or products referred to in the content. |
© 2025 by the authors. Licensee MDPI, Basel, Switzerland. This article is an open access article distributed under the terms and conditions of the Creative Commons Attribution (CC BY) license (https://creativecommons.org/licenses/by/4.0/).
Share and Cite
Byczyński, Ł.; Duliński, R.; Smoleń, S. In Vitro Analysis and Assessment of the Bioavailability of Selected Minerals and B Vitamins in Kefir Enriched with Microalgae. Appl. Sci. 2025, 15, 6567. https://doi.org/10.3390/app15126567
Byczyński Ł, Duliński R, Smoleń S. In Vitro Analysis and Assessment of the Bioavailability of Selected Minerals and B Vitamins in Kefir Enriched with Microalgae. Applied Sciences. 2025; 15(12):6567. https://doi.org/10.3390/app15126567
Chicago/Turabian StyleByczyński, Łukasz, Robert Duliński, and Sylwester Smoleń. 2025. "In Vitro Analysis and Assessment of the Bioavailability of Selected Minerals and B Vitamins in Kefir Enriched with Microalgae" Applied Sciences 15, no. 12: 6567. https://doi.org/10.3390/app15126567
APA StyleByczyński, Ł., Duliński, R., & Smoleń, S. (2025). In Vitro Analysis and Assessment of the Bioavailability of Selected Minerals and B Vitamins in Kefir Enriched with Microalgae. Applied Sciences, 15(12), 6567. https://doi.org/10.3390/app15126567