Next Article in Journal
Effect of Microbially Induced Calcium Carbonate Precipitation on Swelling and Performance Degradation of Expansive Soil
Previous Article in Journal
In Vitro Analysis and Assessment of the Bioavailability of Selected Minerals and B Vitamins in Kefir Enriched with Microalgae
 
 
Due to scheduled maintenance work on our database systems, there may be short service disruptions on this website between 10:00 and 11:00 CEST on June 14th.
Article

Identification of Structural Sealant Damage in Hidden Frame Glass Curtain Wall Based on Curvature Mode

1
School of Mechanical and Electronic Engineering, Shandong Jianzhu University, Jinan 250101, China
2
Shandong Construction Development Research Institute, Jinan 250024, China
*
Author to whom correspondence should be addressed.
Appl. Sci. 2025, 15(12), 6568; https://doi.org/10.3390/app15126568
Submission received: 16 April 2025 / Revised: 24 May 2025 / Accepted: 9 June 2025 / Published: 11 June 2025

Abstract

:
To assess structural sealant damage in hidden frame glass curtain walls (HFGCWs) during service, damage states were simulated by controlled cutting with varying incision lengths. Quantitative identification challenges were investigated through natural frequency and curvature modal difference (CMD) analyses at multiple test points. The results indicate that natural frequency decreases with increasing damage severity, while the first-order curvature mode difference (FCMD) exhibits localized abrupt changes in damaged regions. Boundary modes provide more targeted and accurate damage identification. The peak value of the FCMD mutation region enables precise damage localization. A quantitative damage identification threshold of 0.1205 was derived from FCMD distribution characteristics in boundary regions. By leveraging boundary mode features, modal testing efficiency is optimized, reducing the required acquisition nodes and effectively guiding structural sealant damage detection in engineering applications.

1. Introduction

The HFGCW consists of glass panels bonded to an attached frame with structural sealant, which is then connected to beams and columns using pressure blocks and bolts. Due to its lightweight, simple structure, and aesthetic appeal, HFGCWs are widely used in modern buildings [1]. As the building’s peripheral protective structure, curtain walls are continuously exposed to wind loads, rain, and other environmental factors during service. Over time, a structural sealant exhibits aging and damage, potentially leading to safety hazards such as glass panel detachment [2]. Thus, assessing the damaged state of structural sealant in HFGCWs is critical for monitoring safety performance and preventing structural instability [3].
Various non-destructive evaluation methods have been explored for structural sealant inspection. Active thermography, laser Doppler vibrometry, and nonlinear ultrasonic modulation have demonstrated potential for bonding strength assessment and debonding detection [4,5,6]. Lamb wave propagation and laser thermography have shown particular efficacy in interfacial defect characterization [7,8]. While fiber optic sensing and pulse-echo ultrasonics offer high sensitivity, their field applicability is limited by equipment complexity and operational constraints [9,10].
Vibration-based non-destructive testing detected damage by analyzing a structure’s vibration response [11,12]. Signal processing and feature extraction techniques are used to conduct in-depth analysis of the dynamic response signals of structures or equipment to achieve non-destructive identification and evaluation of faults or anomalies [13,14]. Compared to the detection methods mentioned above, vibration-based non-destructive testing enabled structural health assessment through comparative analysis of dynamic characteristics pre- and post-damage, demonstrating particular advantages for internal damage detection [15].
The extraction and analysis of vibration signal characteristics have emerged as predominant methodologies for detecting structural adhesive damage in HFGCWs. The vibration response signal of a glass curtain wall was acquired using a laser Doppler vibrometer and decomposed via wavelet packet transform. The wavelet packet frequency band energy square difference was calculated as the damage index. Through numerical simulation and experimental validation, this method was shown to identify and locate sealant damage effectively [16]. A vibration analysis method based on Driving-point Acceleration Conductance was proposed to identify the construction defects or debonding damage of structural sealant by statistical means (e.g., cumulative difference or relative cumulative difference index) [17,18]. A damage identification method for glass curtain walls was developed based on the Hilbert–Huang Transform (HHT) and transfer function analysis. The HHT was employed to decompose the vibration response signals of the glass curtain wall into Intrinsic Mode Functions (IMFs), after which damage-sensitive parameters were established by evaluating variations in the IMFs’ transfer functions. Damage detection was achieved by integrating the vibration transfer rate function, enabling the effective identification of structural anomalies [19]. A damage identification method for structural sealants in glass curtain walls was developed based on the vibration transfer rate and discrete wavelet transform. The vibration response of the glass curtain wall was simulated using ANSYS R17.0 finite element software, with the frequency response function and vibration transfer rate serving as damage assessment parameters. The discrete wavelet transform was applied to decompose vibration signals and extract damage-sensitive features. Finally, damage identification was achieved by integrating the transfer rate change of vibration signals [20].
Modal parameters demonstrate exceptional sensitivity to stiffness variations induced by structural damage. This approach combines the non-destructive acquisition of natural frequencies and curvature mode shapes with advanced analytical techniques (including deep learning, information entropy, and finite element simulation) to enable both global damage localization and quantitative severity assessment. While initially developed for beam-like structures [21,22,23,24,25,26], the validity was verified by a cantilever and simply supported beam models, showing that the change in curvature mode shape is more significant locally in the damage region, from which the location and extent of damage can be determined [27], and the methodology has been successfully extended to various engineering applications. For high-pile wharf foundations, researchers developed a curvature mode difference (CMD) method incorporating a Mode Deletion Model, achieving precise damage localization through a comparative analysis of pre- and post-damage curvature modes [28]. In the building envelope structure, a two-stage damage detection technique employing Boundary Modal Curvature (BMC) was specifically developed for structural sealants. The method first identifies damaged edges using the Assurance Criteria of BMC (ACBMC), then performs detailed comparative BMC analysis between affected and intact regions for precise localization [29]. For railway systems, crack propagation models quantitatively relate crack parameters to curvature variations, as experimentally validated [30]. A modal curvature-based damage identification method is developed for a 4000-tonne hull-girder simplified ship structure. Finite element simulations with varying stiffness reductions validate its effectiveness in detecting both single and multiple damages [31]. A method leveraging Gaussian process regression and Bayesian recursive partitioning is introduced to identify damage in glass fiber-reinforced polymer (GFRP) materials. This method analyses both numerical and experimental modal shapes, with modal analysis being central to damage identification [32]. Similarly, the Tree Gaussian Process (TGP) method is also based on modal analysis, which provides critical data support. The TGP method compares results across different crack sizes in experimental and finite element model modal shapes to identify manufacturing defects in extruded GFRP thin-walled profiles, highlighting the importance of modal analysis in both approaches [33].
Based on previous research, this investigation proposes a quantitative analysis method for structural sealant damage based on curvature modal. The curvature mode demonstrates significant advantages in detecting local damage by effectively capturing structural stiffness variations. As damage occurs, the local stiffness reduction directly perturbs curvature modes in the vicinity of the damaged location. Consequently, the curvature mode proves to be an effective tool for detecting local damage.

2. Experimental Method

2.1. Theoretical Background

The curvature mode represents the unique curvature distribution of a structure in its bending vibration state for each order of displacement mode. Curvature mode is closely related to the displacement mode and its corresponding curvature distribution. This investigation conducts a modal test of the HFGCWs by uniformly dividing the glass panel into several small units. The corresponding modal parameters, including natural frequency, modal displacement, and damping, are obtained by striking the nodes of these small units with a force hammer. Subsequently, modal identification is analyzed in depth using advanced algorithms.
The HFGCW panel exhibits a significantly larger length and width compared to its thickness, classifying it as a typical thin-plate structure. Thus, the curvature modal theory is investigated using a thin-plate structural model. By adopting the thin-plate structure as the research subject, the modal displacement is derived based on Kirchhoff’s thin-plate theory as follows:
φ m n x , y = A m n sin m π x a sin n π y b
Among them,   A m n represents the modal amplitude, sin m π x a represents the mode function along the x direction, m is the modal orders along the x direction, and a is the width of the x direction; sin n π y b represents the mode function of the y direction, where n is the mode orders of the x direction and b is the width of the y direction.
The curvature modes are obtained by solving for the second-order partial derivatives through the modal displacements as follows:
κ m n , x x = 2 φ m n x 2 ;   κ m n , y y = 2 φ m n y 2 ;   κ m n , x y = 2 φ m n x y
where κ m n ,   x x denotes the x direction curvature mode; κ m n ,   y y denotes the y direction curvature mode; κ m n , x y denotes the torsional curvature mode. The negative sign ensures that the curvature is in the same direction as the sheet’s bending or torsion direction.
The curvature modes in the x direction, y direction, and torsional direction are mathematically formulated as follows:
κ m n , x x = 2 φ m n x 2 = ( m π a 2 φ m n ) = m π a 2 φ m n ( x , y ) κ m n , y y = 2 φ m n y 2 = ( n π b 2 φ m n ) = n π b 2 φ m n ( x , y ) κ m n , x y = 2 φ m n x y = m π a n π b cos ( m π x a ) cos ( n π y b )  
where κ m n ,   x x and κ m n ,   y y are proportional to the φ m n x , y , with scaling factors of ( m π a ) 2 and ( n π b ) 2 , respectively, which reflect the bending characteristics along the x and y directions; κ m n , x y exhibits a cosine distribution.
Directly obtaining a curvature mode is often challenging. However, modal testing techniques are relatively well-developed. Thus, utilizing the characteristic that modal displacements are provided in a grid form within discrete systems, modal tests are conducted to acquire the modal displacements at the collected grid nodes. The curvature modes are then approximated using the central difference method:
κ m n , x x , i , j = φ m n , i + 1 , j 2 φ m n , i , j + φ m n , i 1 , j Δ x 2 κ m n , y y , i , j = φ m n , i , j + 1 2 φ m n , i , j + φ m n , i , j 1 Δ y 2 κ m n , x y , i , j = φ m n , i + 1 , j + 1 φ m n , i + 1 , j 1 φ m n , i 1 , j + 1 + φ m n , i 1 , j 1 4 Δ x Δ y
where i and j denote the indexes of the discrete grid points, corresponding to node i in the x direction and node j in the y direction, respectively; φ m n ,   i , j denotes the value of the modal displacement at the grid point (i, j) in the mth and nth modal shapes; φ m n , i + 1 , j , φ m n , i 1 , j , φ m n ,   i , j + 1   φ m n ,   i , j 1 , φ m n , i + 1 , j + 1 , φ m n , i + 1 , j 1 , φ m n , i 1 , j + 1 , and φ m n , i 1 , j 1 denote the modal displacements at grid points (i + 1, j), (i − 1, j), (i, j + 1), (i, j − 1), (i + 1, j + 1), (i + 1, j − 1), (i − 1, j + 1), and (I − 1, j − 1), respectively; x represents the grid spacing in the x direction; y represents the grid spacing in the y direction.
The undamaged modal displacement is defined as φ m n ,   i ,   j b , with the damaged modal displacement as φ m n ,   i , j a . The modal displacement difference is subsequently calculated using the following expression:
φ m n x , y = φ m n , i , j a φ m n , i , j b
Therefore, the corresponding CMD is defined as follows:
κ m n ,   x x ,   i , j = φ m n , i + 1 , j 2 φ m n ,   i , j + φ m n , i 1 , j Δ x 2 κ m n ,   y y ,   i , j = φ m n ,   i , j + 1 2 φ m n ,   i , j + φ m n ,   i , j 1 Δ y 2 κ m n , x y ,   i , j = φ m n , i + 1 , j + 1 φ m n , i + 1 , j 1 φ m n , i 1 , j + 1 + φ m n , i 1 , j 1 4 Δ x Δ y
where κ m n ,   x x ,   i , j denotes the CMD in the x direction; κ m n ,   y y ,   i , j denotes the CMD in the y direction; κ m n , x y ,   i , j denotes the CMD in torsion.
In thin-plate structures, reduced stiffness directly impacts the curvature mode’s dynamic behavior and mechanical response. Stiffness serves as a critical parameter determining a thin-plate structure’s resistance to bending and torsional deformations [34]. When the stiffness decreases, the deformation characteristics of the plate change, influencing both the distribution and magnitude of the curvature mode.
The bending stiffness of a thin-plate is defined as follows:
D = E h 3 12 ( 1 ν 2 )
where E represents Young’s modulus, h represents the thickness of the sheet, and ν represents Poisson’s ratio.
The stiffness directly impacts the internal forces (bending moments and torques) generated by the curvature mode. The following are the formulas for bending moment and torque:
M m n , x = D ( κ m n , x x + ν κ m n , y y ) M m n , y = D ( κ m n , y y + ν κ m n , x x ) M m n , x y = D ( 1 ν ) κ m n , x y
where M m n , x and M m n , y represent bending moments in the x and y directions, respectively; M m n , x y denotes torque; v denotes damping; M m n , x , M m n , y , and M m n , x y are all proportional to the stiffness. When the local stiffness decreases, the curvature mode must be increased to maintain the equilibrium and ensure the bending moment and torque equilibrium in the vibration mode.

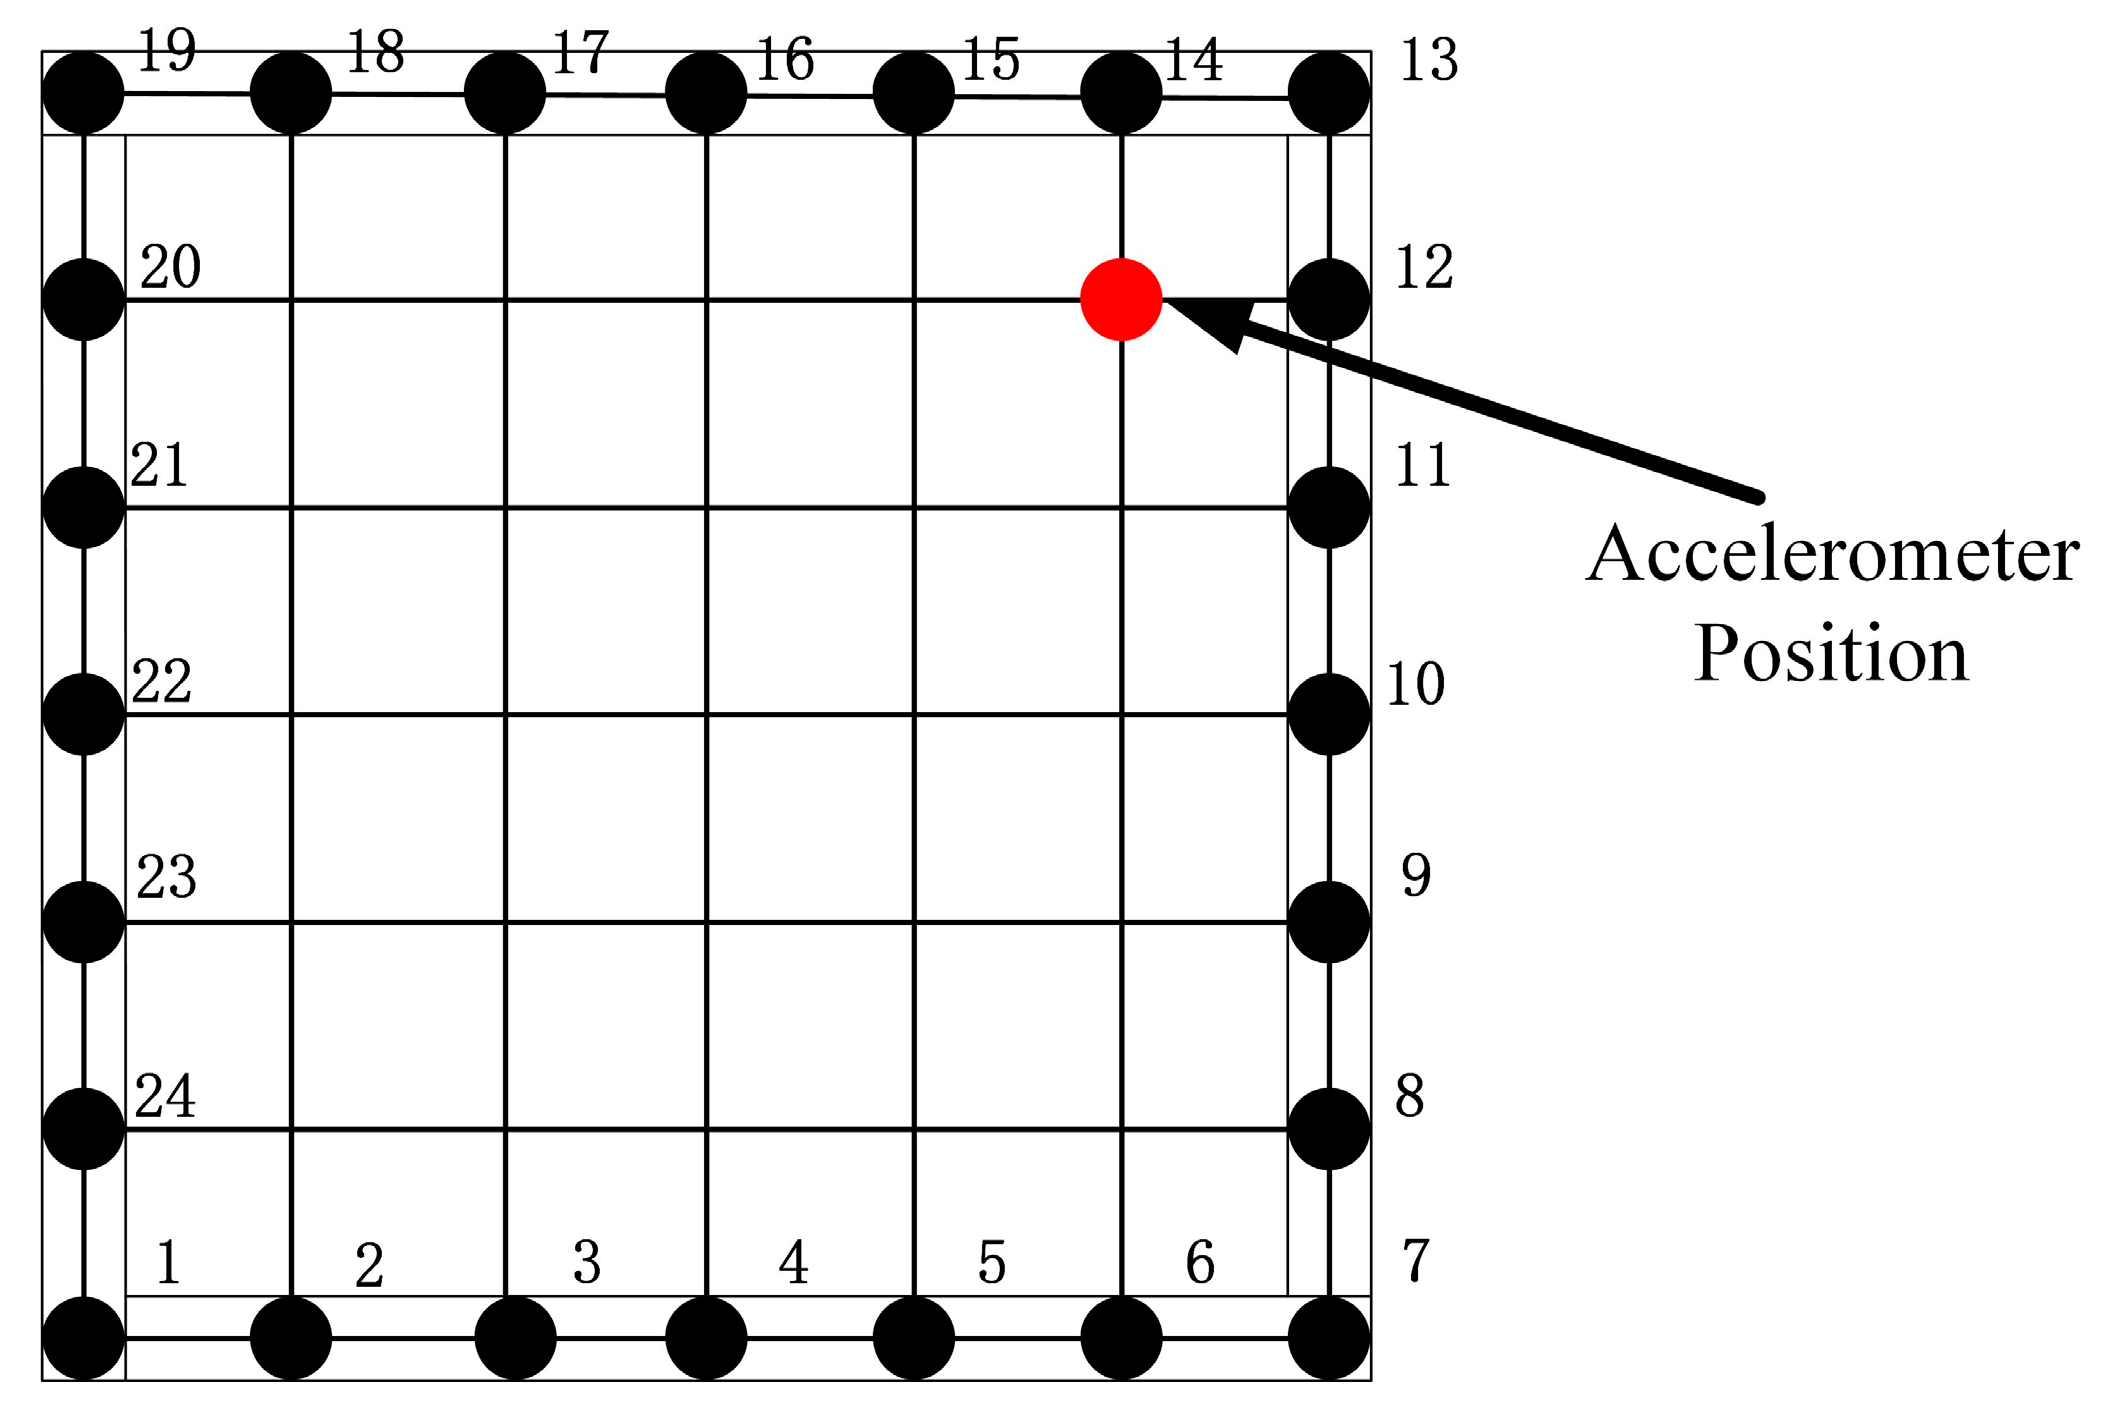
2.2. Experimental Program

The vibration modal analysis instrument used in this modal experiment mainly consists of signal collector, IEPE signal input line, a current loop adapter, an acceleration sensor, a force hammer, a force transducer, and vibration analysis software, as shown in Figure 1. The vibration modal analysis instrument connects to the computer via USB 3.0, while the force hammer is linked to the force transducer to form the excitation system.
In this test, seven HFGCWs were fabricated for testing, each comprising 600 × 600 mm glass panels adhesively bonded to aluminum alloy frames using structural sealant. The panels with sealant joints of 6 mm thickness and 10 mm width are labeled clockwise as A, B, C, and D along the four sides, where blank boundary portions indicate areas of manually cut structural sealant to simulate debonding conditions, as shown in Figure 2. In the experiment, a sponge with sufficiently low stiffness was selected as the supporting material for the sample to simulate the load transfer characteristics of the actual curtain wall system.
To simulate realistic HFGCW failure modes, artificial sealant debonding was introduced beneath the glass panels. Six distinct damage scenarios were designed, varying in both debonding locations and extents, to represent actual service conditions. These experimental conditions are illustrated in Figure 3, with detailed descriptions documented in Table 1.
The test samples were positioned horizontally on a low-stiffness sponge support to simulate simplified elastic boundary conditions. This configuration was chosen to isolate the effects of sealant damage by minimizing external constraints, whereas real-world HFGCWs are vertically installed with rigid mechanical connections (e.g., pressure plates and bolts) that introduce additional stiffness. The horizontal orientation avoids gravity-induced pre-stress in the sealant, which could confound damage detection in small-scale laboratory tests.
While the horizontal support simplifies modal analysis, it may alter curvature mode distributions compared to vertical installations. In upright curtain walls, gravity-induced membrane stresses could stiffen the glass panel, potentially attenuating FCMD amplitudes at damaged edges. Future studies will validate this method in vertical configurations.
The glass panel was uniformly divided into 36 small units with 49 measurement points to investigate the relationship between modal characteristics and structural sealant damage. Accurate modal displacement values were obtained sequentially by tapping each measurement point with a force hammer, which were subsequently processed using MATLAB R2024a software to derive corresponding curvature modal values. The sensor was placed at the 13th measurement point, as shown in Figure 4. The acceleration sensor model used in this experiment was 1A102E-C190101432 with a sensitivity of 2.17 mV/N, the force hammer model was LC02-C190203129 with an axial sensitivity of 1.023 mV/(m/s2), and the sampling frequency was set to 2000 Hz.
The experiments were conducted under controlled laboratory conditions with simplified boundary support (sponge material) to isolate the effects of structural sealant damage. While this approach facilitates fundamental analysis, field applications may involve additional complexities such as rigid mechanical connections, wind loads, and thermal effects, which could influence modal parameters. Future work will extend validation to in situ conditions. The proposed method was validated on a single sample type (600 × 600 mm glass panels with 6 mm sealant thickness) under controlled unilateral debonding damage. Conclusions may not directly apply to panels with significantly different aspect ratios, glass/sealant thicknesses, or multiple/complex damage patterns. Further studies are needed to establish universal thresholds for diverse configurations.

3. Results and Discussions

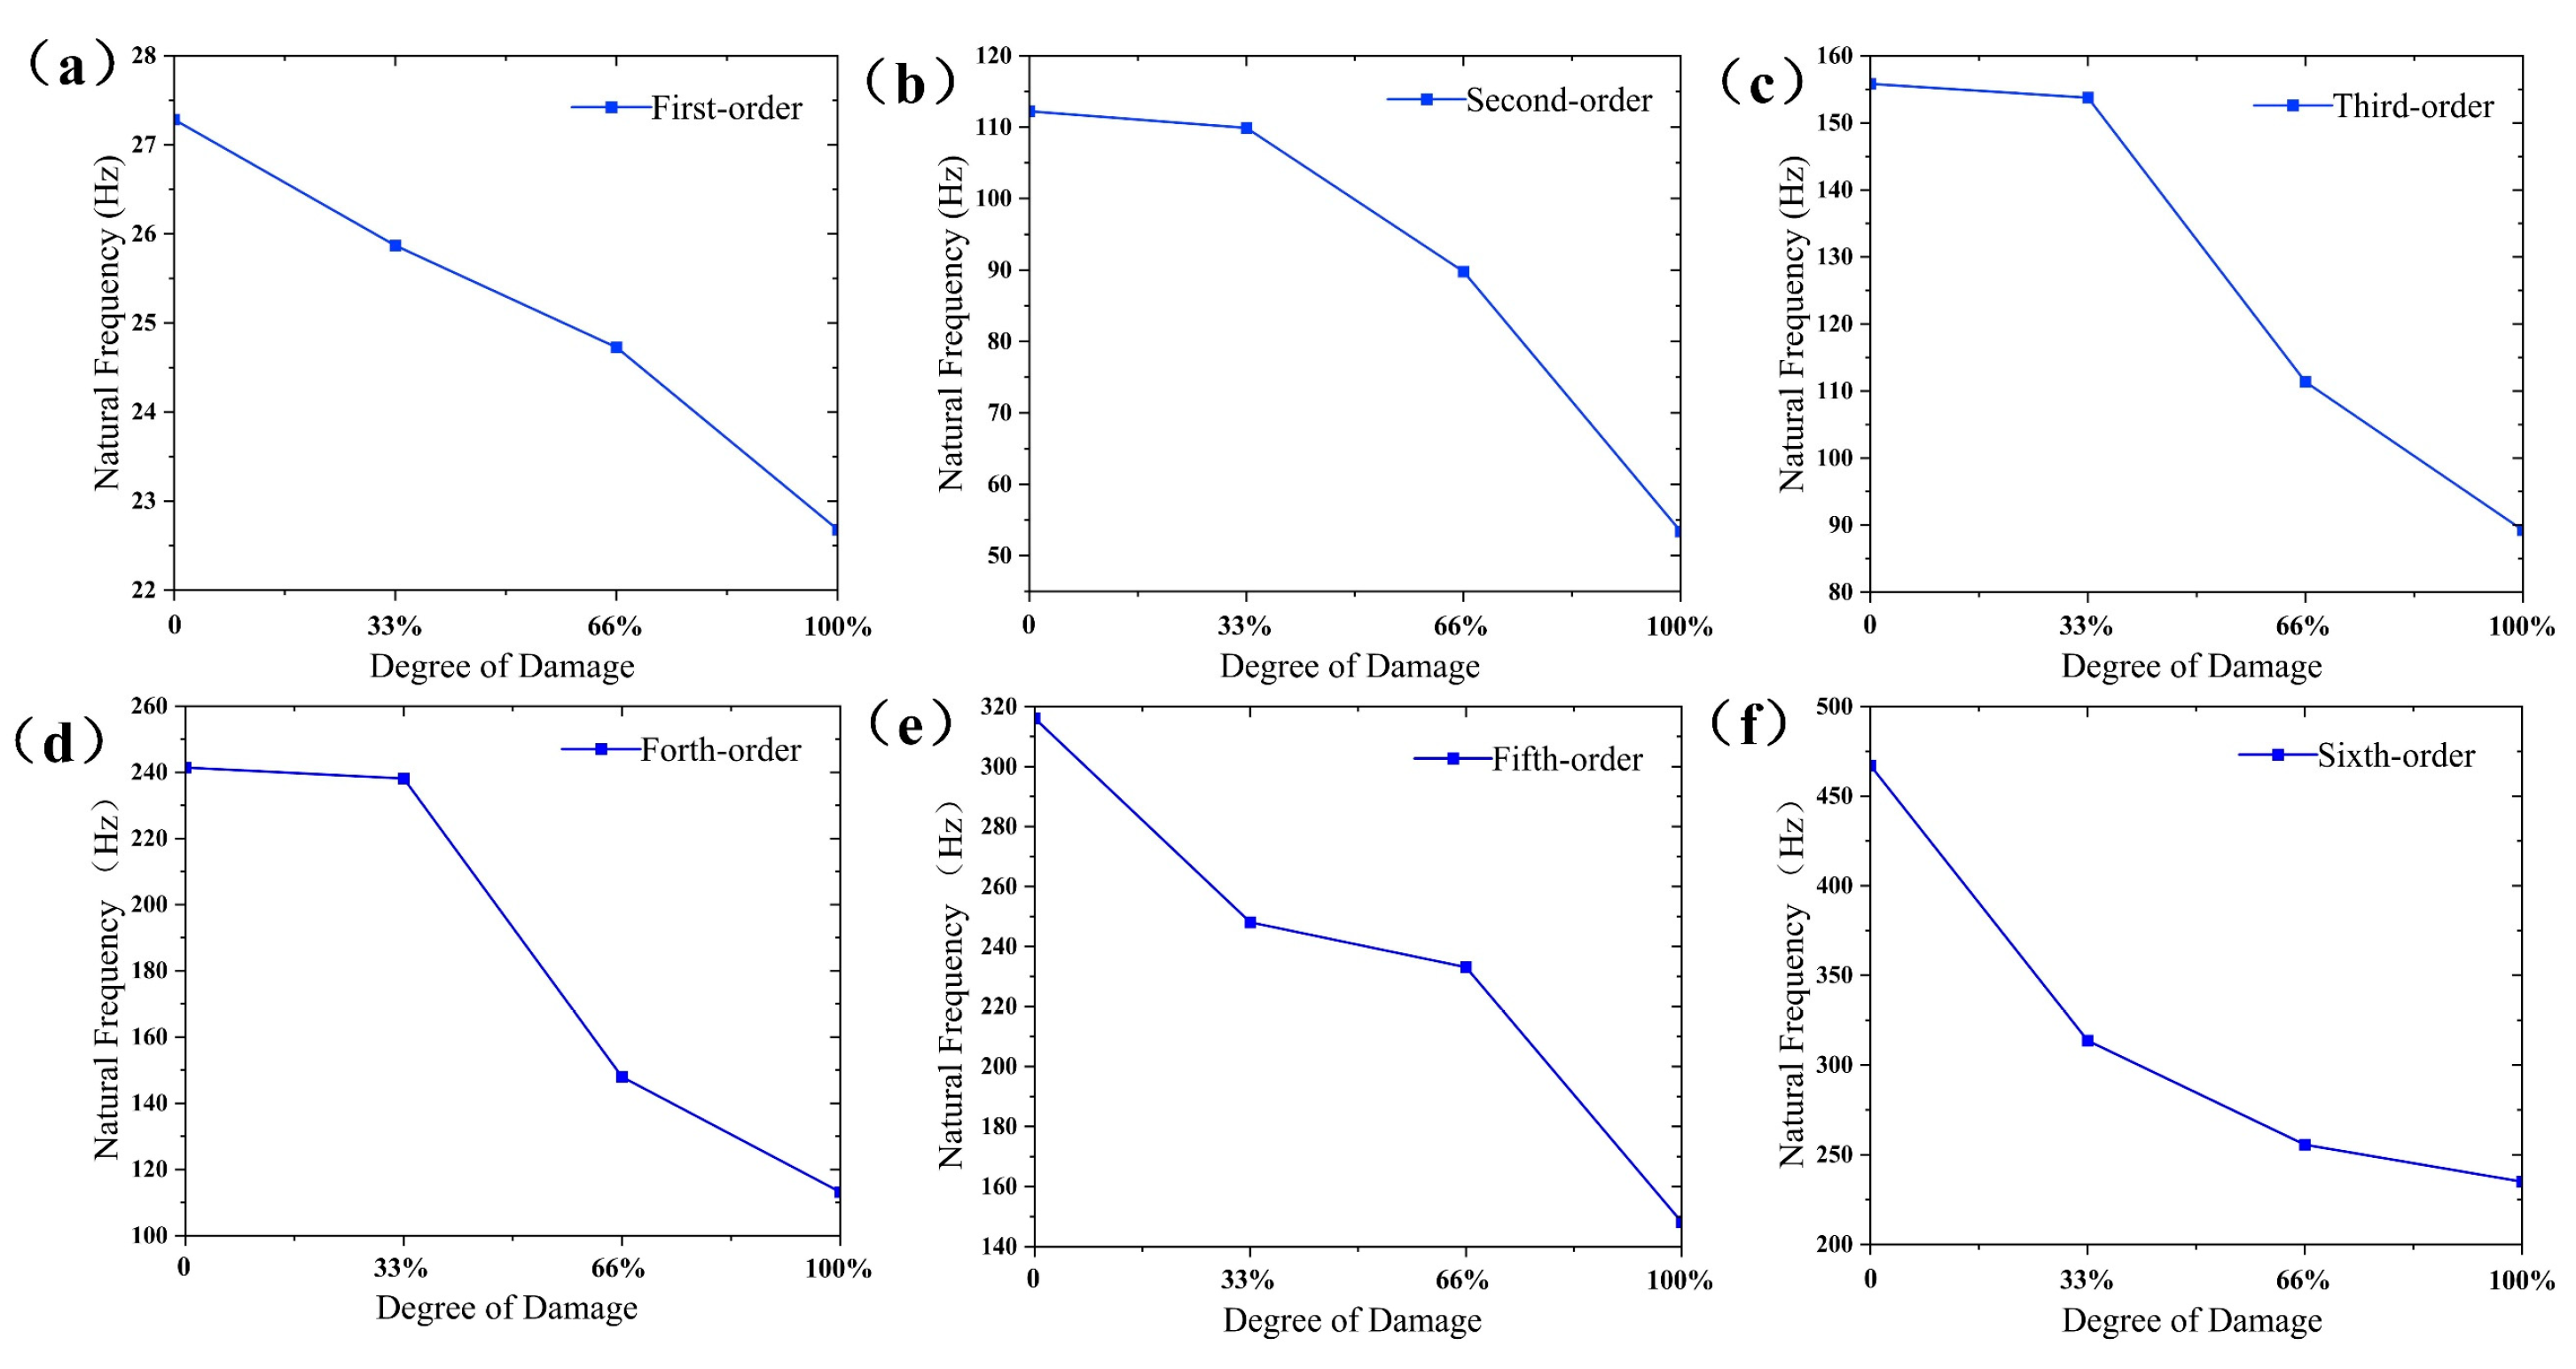
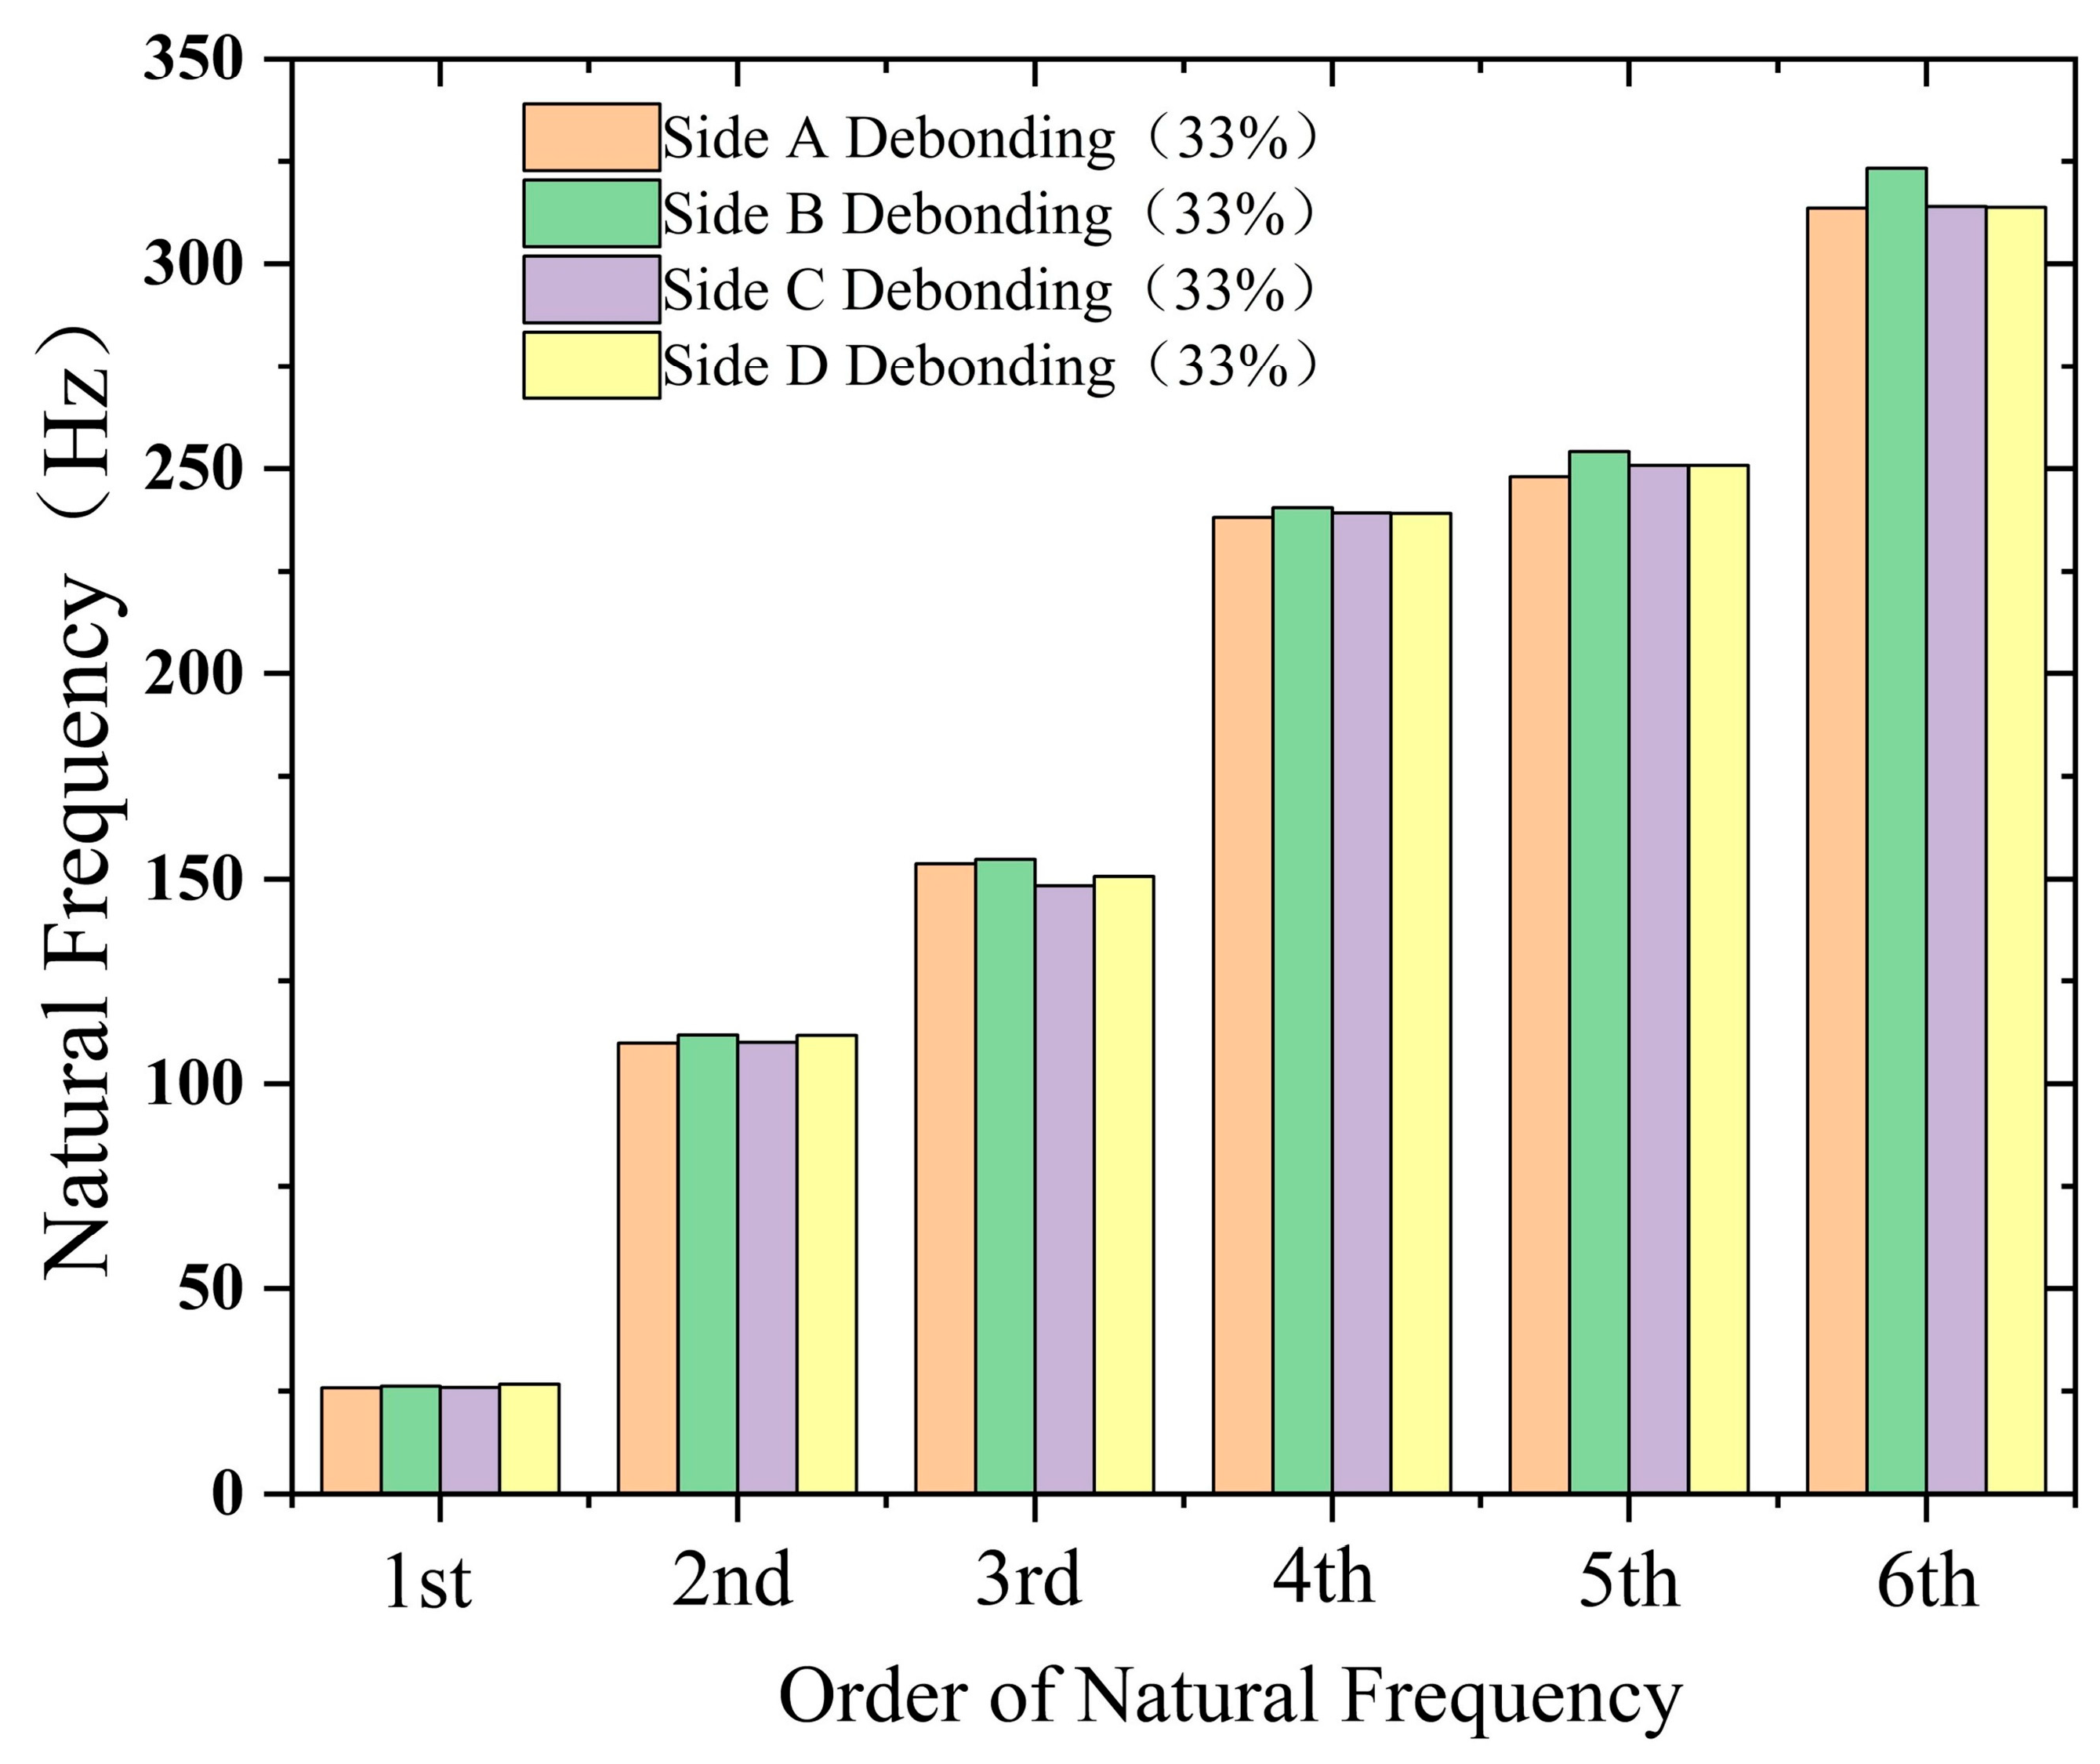
3.1. Damage Identification Based on Natural Frequency

Structural damage leads to changes in stiffness, natural frequency, and damping. The damage identification of the structural sealant in HFGCW could be assessed based on variations in dynamic properties. Specifically, structural damage was identified by analyzing changes in natural frequency under different damage conditions [35,36,37].
The variation in natural frequency changes in the structural sealant in the HFGCWs under unilateral damage conditions was tested, as shown in Figure 5 and Figure 6. The natural frequencies typically demonstrate negligible deviations as damage of equivalent extent occurs at different locations. However, a strong relationship exists between damage extent and natural frequency reduction. First-order natural frequency exhibits limited sensitivity to debonding damage, whereas higher-order natural frequencies (modes 4–6) demonstrate significantly enhanced responsiveness to such damage.
Nevertheless, the fundamental frequency remains easier to obtain. As shown in Figure 5, the fundamental frequency continued to decrease from 27.284 Hz (undamaged) to 22.679 Hz (side A debonding (100%)) in this experimental environment, representing a 16.88% reduction. The data exhibit a pronounced linear relationship between fundamental frequency and sealant debonding extents. For the tested sample configuration, the reduction in fundamental frequency correlates with the percentage of sealant debonding length (Figure 5). It is important to note that the observed relationship between fundamental frequency reduction and sealant debonding extent is specific to the tested sample configuration (600 × 600 mm glass panels with 6 mm sealant thickness). While this demonstrates the proof of concept for damage severity assessment, further validation is required to generalize these findings to panels with different geometries, glass thicknesses, or sealant properties.
As shown in Figure 5, the higher-order natural frequencies (modes 4 and 5) represent a 53.13% reduction as the structural sealant transitions from undamaged states to instances of complete unilateral debonding. Consequently, as structural sealant damage initiates, higher-order frequencies serve as a reliable indicator of its occurrence. However, as shown in Figure 6, natural frequency values remain statistically invariant when equivalent damage occurs at different locations. In summary, while changes in natural frequency can reflect the structural damage state and serve as an indicator for assessing the percentage of sealant debonding length, they are insufficient for accurately identifying the exact location of the damage.

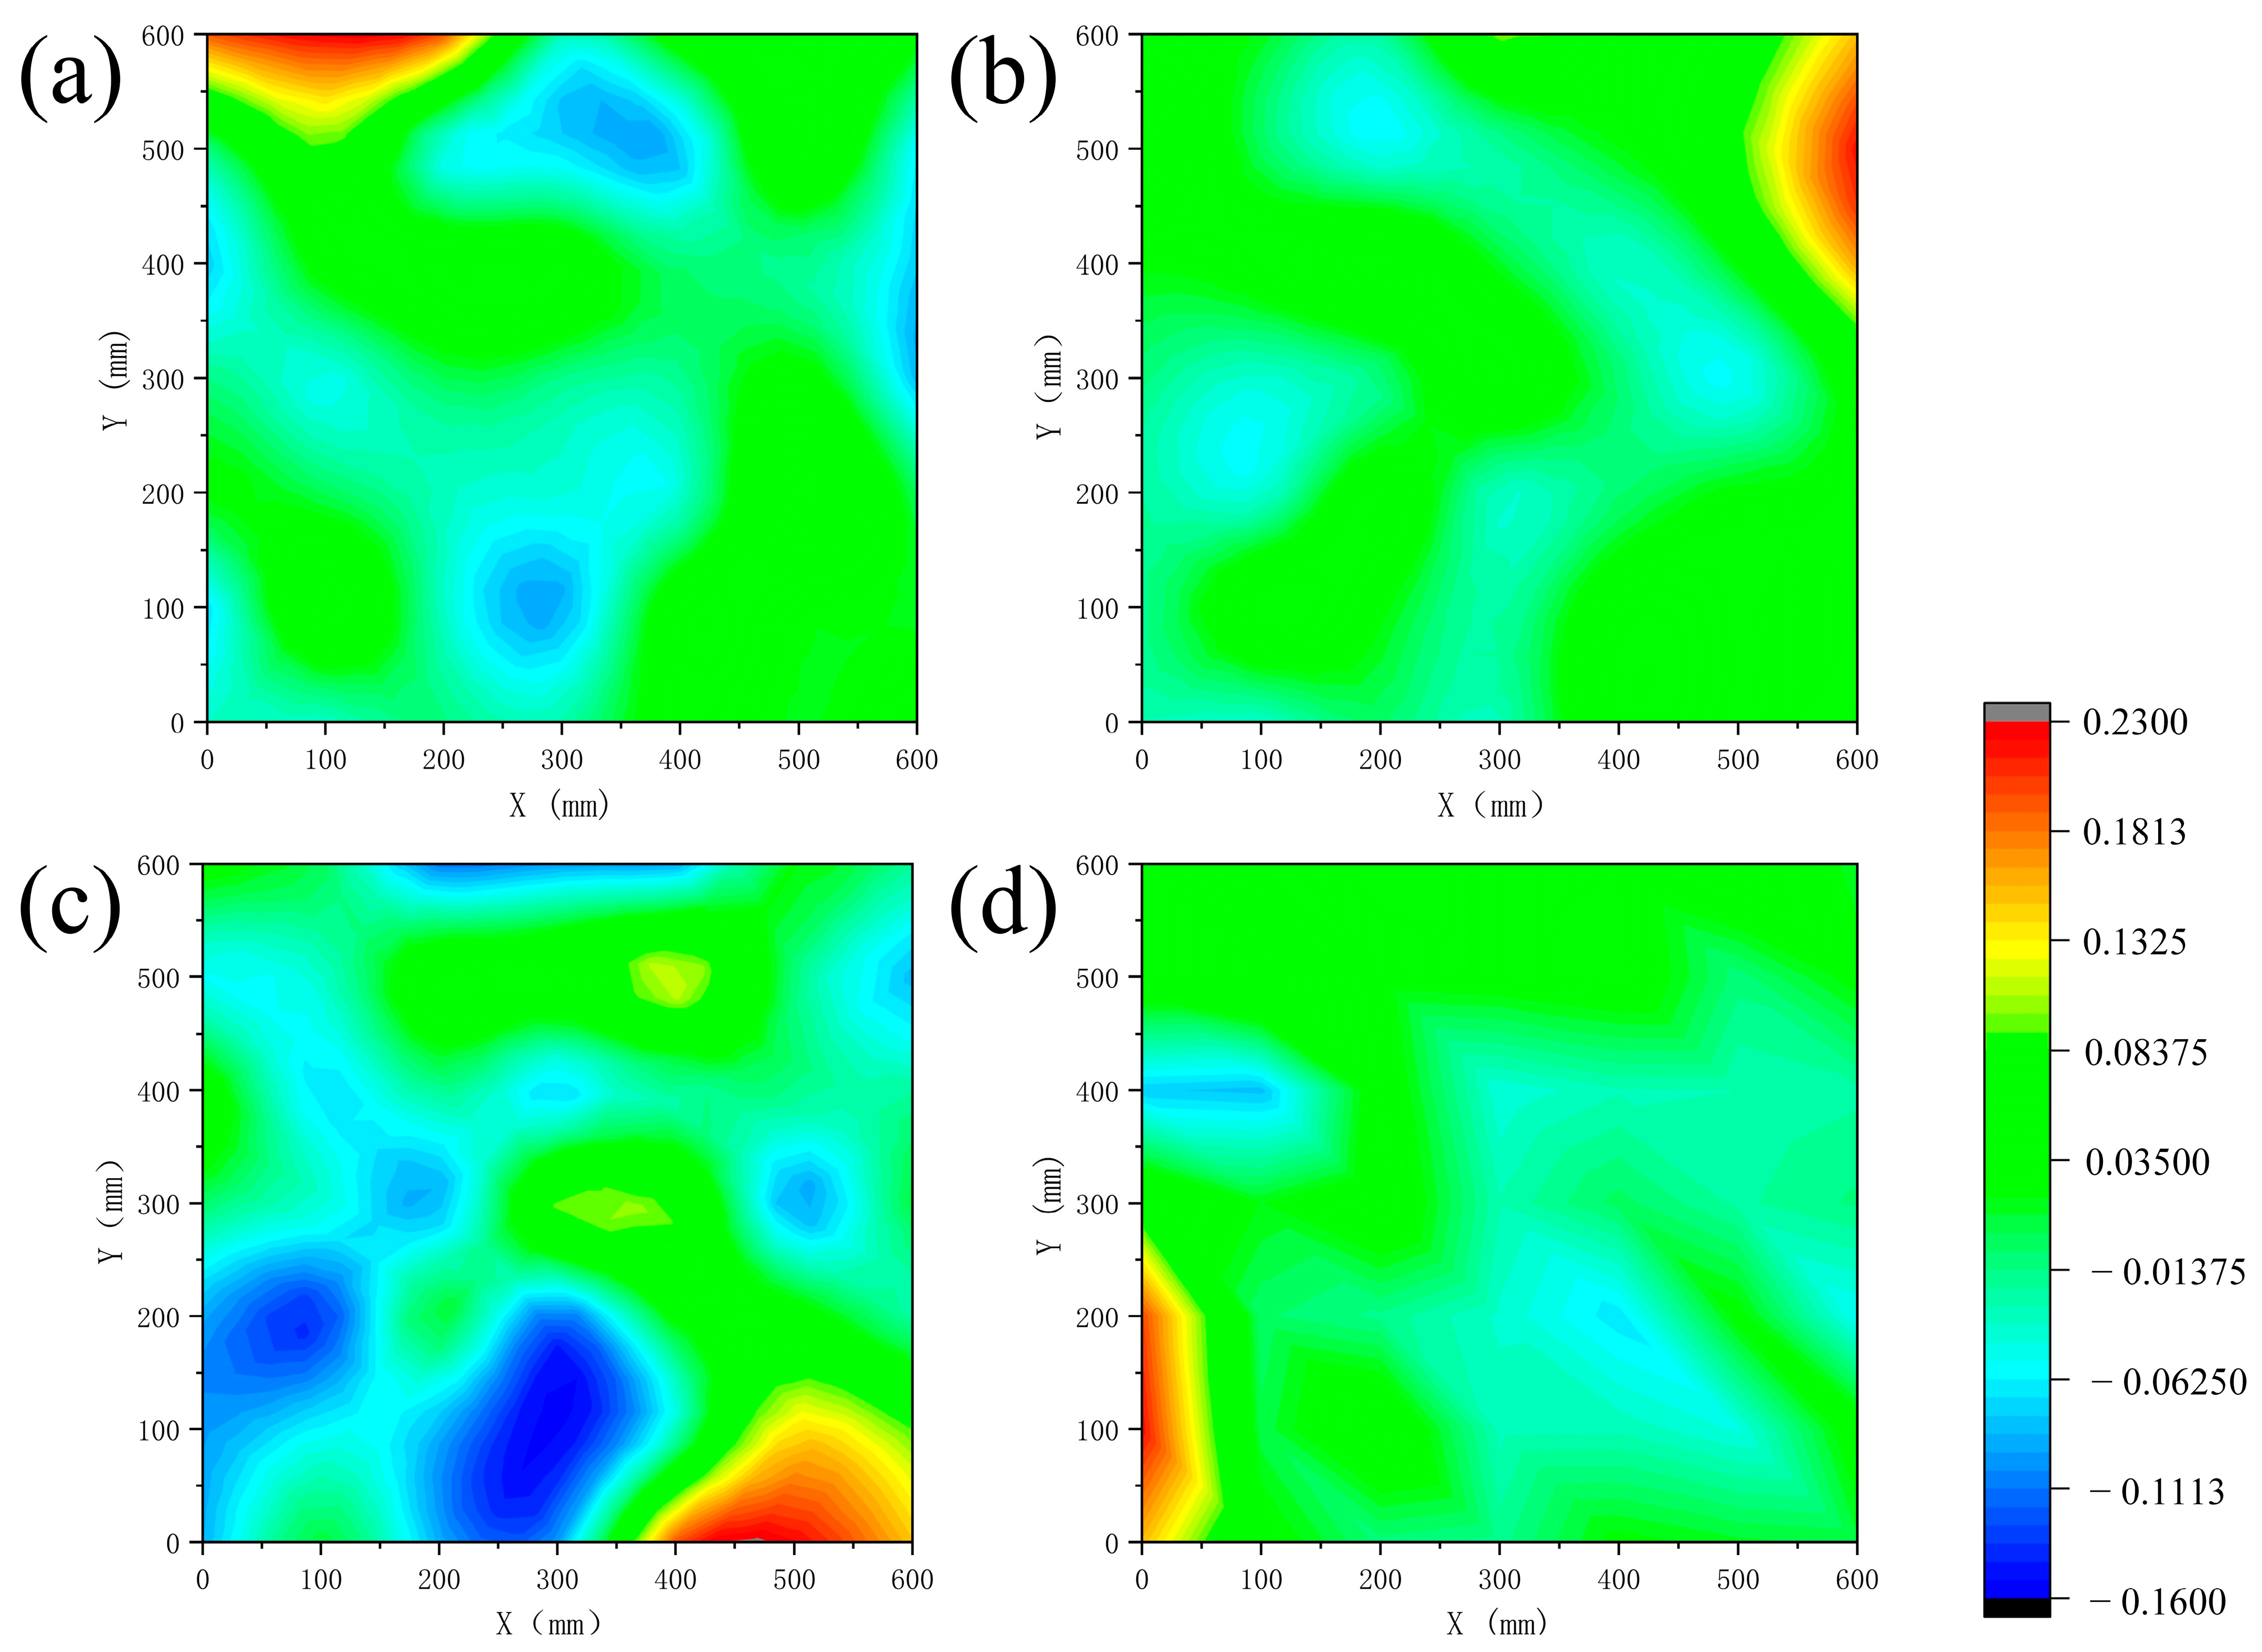
3.2. Damage Identification Based on Curvature Mode Difference

Structural damage induces both global and local stiffness degradation. As Equation (8) demonstrates, decreased local stiffness increases the local curvature modes. Abrupt changes in nodal stiffness are detected before and after damage, which leads to significant modifications in the corresponding curvature modes. The CMD effectively captures these damage-induced local features, making it more adept at detecting local damage than directly using frequency or modal displacements. Moreover, the first-order curvature mode adequately reflects the structure’s vibration characteristics and is easier to obtain. Therefore, the FCMD was used in this study as a damage indicator to explore its application in identifying structural sealant damage.
The FCMD values of the glass panel unit are presented in Figure 7 and Figure 8. Figure 7 shows distinct FCMD wave peaks across Conditions 2 to 5 at the damaged locations. The peak values and distribution ranges remain consistent for equivalent damage extent, maintaining an average value of 0.22 (averaging the peak values of Conditions 2–5). In undamaged locations, the FCMD fluctuations are attributed to minor deformations resulting from impact-induced vibrations in the glass panel. However, these FCMD variations are not indicative of structural damage. Figure 8 demonstrates that under Conditions 6 and 7, which involve more extensive structural sealant damage, elevated FCMD wave peaks are still detected within the affected regions, with recorded maximum values of 0.226 (Condition 6) and 0.272 (Condition 7)—significantly exceeding the 0.22 baseline. Through systematic analysis of FCMD wave peak ranges, the location and length of structural sealant damage can be reliably identified.

3.3. Quantitative Analysis of Curvature Mode Difference Damage Identification

Due to the damage to the structural sealant on the glass panel, the elastic support condition around the panel is disrupted. As a result, more pronounced changes in boundary modal characteristics are observed when structural sealant damage occurs. In this study, the experimental data for each working condition were divided into two independent datasets based on spatial characteristics. The boundary modal dataset was processed through modal extraction and renumbering procedures to analyze the vibration characteristics of the glass panel’s boundary region, as shown in Figure 9. The complete dataset containing boundary nodes at structural sealant damage locations (six damage conditions, 24 nodes total) was collected for modal analysis. For comparison, data from 120 boundary nodes in the undamaged sealant regions across the same six damage conditions were synchronized to establish a baseline reference value for the undamaged state. Simultaneously, the internal modal dataset was established to record the dynamic response characteristics of the panel’s internal region.
Significant regularity was observed in the characteristic parameters of the damaged nodes. The average FCMD value for the damaged nodes was calculated as 0.194, which is significantly higher than the average value for undamaged nodes (−0.0034). A peak value of 0.11 (Condition 7, node 10) was identified in the undamaged region for the damaged scenario, whereas the minimum value for damaged nodes was measured at 0.131 (Condition 7, node 13). A nonlinear transition region was detected between these two characteristic ranges. Therefore, to establish a baseline threshold for quantitative damage identification, the peak value of the undamaged group (0.11) was combined with the minimum value of the damaged group (0.131). As presented in Table 2, the damage threshold is defined as 0.1205, calculated by taking the arithmetic mean of 0.11 and 0.131. Based on this principle, the criterion is established: structural sealant damage is considered to have occurred at that location as the FCMD of any node exceeds 0.1205.
To comprehensively evaluate the performance of curvature mode difference (CMD) for structural sealant damage identification, the experimental results from all six damage conditions (Table 1) were systematically analyzed. The first-order curvature mode difference (FCMD) exhibited a clear correlation between damage severity and localized response magnitude. This proportional relationship aligns with the theoretical expectation that stiffness reduction amplifies curvature mode perturbations [38].

3.4. Damage Identification Method Based on Boundary Modes

Based on the analysis in Section 3.3, the boundary modal characteristics exhibit a significant correlation with structural sealant damage. Based on this observed pattern, an optimization scheme for the modal test procedure was proposed: the number of data collection points was reduced from 49 in the full-plate distribution to 24 key nodes in the boundary region (a reduction of 51.02%), and the test time was shortened by 50% per condition, significantly improving testing efficiency.
The comparative analysis in Figure 10 and Figure 11 demonstrates that the peak of FCMD for the boundary damage nodes closely aligns with the results of the global modal analysis in terms of both damage localization effectiveness and sensitivity to the degree of damage. This further validates the superiority of the boundary modes for structural sealant damage identification. According to the analysis of engineering applicability, this scheme offers two main advantages: it reduces test time and improves efficiency, and it enhances operational feasibility by extracting only the panel boundary modes, excluding internal nodes, thus reducing experimental error. Additionally, it provides a valuable reference for practical engineering applications.
While this study focused on unilateral debonding to establish fundamental detection thresholds, future work will extend validation to multi-edge and irregular damage patterns to further verify generalizability. The boundary-mode approach is theoretically adaptable to such scenarios through localized threshold calibration.
The single-stage first-order curvature mode difference (FCMD) approach streamlines the curvature mode difference method, minimizing computational demands and error risks by employing a single, direct metric for damage identification. The introduction of a statistically derived, quantitative FCMD threshold enhances the method’s objectivity and reproducibility. By focusing on boundary FCMD extraction, the approach significantly reduces experimental effort. Furthermore, the method shows potential for detecting both boundary and internal damage in thin-plate structures.
The derived damage threshold (FCMD > 0.1205) achieved 100% accuracy in boundary damage identification across all tested conditions. However, two limitations emerged. The experimental scope did not include damage threshold calculations for diverse sample categories or configurations with varied layout sampling point densities. Furthermore, the current threshold determination methodology lacks comprehensive validation for universal applicability across different experimental conditions. The threshold was calibrated exclusively for boundary damage scenarios. Internal debonding (e.g., mid-panel damage) may require adaptive threshold adjustments, as suggested by Nguyen et al. [39] for slab structures, where curvature mode sensitivity varies with spatial stiffness distribution. Laboratory conditions minimized ambient vibrations, but field applications may introduce noise. Integrating noise-suppression techniques, such as the Tikhonov regularization method [40], could enhance signal-to-noise ratios in practical settings.
Although curvature modes are sensitive to noise, the boundary-focused FCMD method demonstrates empirical robustness, as damage-induced peaks (e.g., 0.272 for 100% debonding) significantly exceed noise levels in undamaged regions (FCMD ≤ 0.11). The 0.1205 threshold further safeguards against noise interference. Comparative studies with noise-robust alternatives [32,33] remain a valuable future direction.

4. Conclusions

A comparative analysis of natural frequency and FCMD responses under varying damage conditions (extents and locations) was conducted to address the challenge of quantifying structural sealant damage in HFGCWs. It was demonstrated that although natural frequency exhibits high sensitivity to damage severity, it lacks spatial resolution for structural sealant damage. In contrast, the FCMD was proved to be a robust indicator, enabling simultaneous quantification of damage severity and spatial localization.
(1)
The FCMD values in damaged sealant regions are significantly higher than in intact areas, allowing accurate determination of damage extent and location through peak distribution analysis.
(2)
Based on boundary node FCMD distribution characteristics, a damage threshold of 0.1205 is established for quantitative damage detection. This threshold is validated using boundary modal data, achieving 100% verification accuracy. Specifically, structural sealant damage is confirmed when FCMD exceeds 0.1205.
(3)
Modal data classification reveals that boundary modes are more effective for damage identification than internal modes. Consequently, the modal test is optimized by reducing measurement points to 24 boundary nodes, halving the testing workload while maintaining FCMD accuracy. This boundary-specific approach enhances diagnostic reliability and practical applicability, streamlining structural sealant inspection in HFGCWs.

Author Contributions

Methodology, Y.Y., X.W. and X.L.; Software, X.W.; Formal analysis, X.L.; Investigation, F.Y.; Resources, X.Z.; Data curation, X.W. and X.Z.; Writing—original draft, Y.Y. and X.W.; Writing—review & editing, J.S.; Supervision, J.S.; Project administration, J.S.; Funding acquisition, J.S. All authors have read and agreed to the published version of the manuscript.

Funding

This work was supported by the Natural Science Foundation of Shandong Province (ZR2022ME186), the National Natural Science Foundation of China (52001188) and Shandong Key R&D Program—Innovation Empowerment Initiative for Tech SMEs (2024TSGC0979, 2024TSGC0110).

Institutional Review Board Statement

Not applicable.

Informed Consent Statement

Not applicable.

Data Availability Statement

The original contributions presented in this study are included in the article. Further inquiries can be directed to the corresponding author.

Acknowledgments

This work was supported by the Natural Science Foundation of Shandong Province (ZR2022ME186), the National Natural Science Foundation of China (52001188) and Shandong Key R&D Program—Innovation Empowerment Initiative for Tech SMEs (2024TSGC0979, 2024TSGC0110).

Conflicts of Interest

The authors declared no potential conflicts of interest with respect to the research, authorship, and publication of this article.

References

  1. Huang, Z.; Xie, M.; Chen, C.; Du, Y.; Zhao, J. Engineering application of a safety-state evaluation model for hidden frame-supported glass curtain walls based on remote vibration. J. Build. Eng. 2019, 26, 100915. [Google Scholar] [CrossRef]
  2. Huang, T.-T.; Zhang, D.-W.; Zhao, Y.-X.; Liu, J.-J.; Li, J.-H. Comprehensive appraisal of the safety of hidden frame glass curtain wall based on fuzzy theory. J. Build. Eng. 2019, 26, 100863. [Google Scholar]
  3. Liu, X.G.; Bao, Y.W. Reliability Evaluation of Glass Curtain Wall via Vibration Detection. Key Eng. Mater. 2012, 492, 410–414. [Google Scholar] [CrossRef]
  4. Hong, X.; Lin, J.; Liu, Y.; Xu, W. Active thermal sensing for bonding structure damage detection of hidden frame glass curtain wall. Sensors 2018, 18, 3594. [Google Scholar] [CrossRef] [PubMed]
  5. Zheng, H.; Guo, T.; Zhi, G.; Hu, Z. A Novel Debonding Damage Identification Approach of Hidden Frame-Supported Glass Curtain Walls Based on UAV-LDV System. Appl. Sci. 2024, 14, 5412. [Google Scholar] [CrossRef]
  6. Hong, X.; Liu, Y.; Liufu, Y.; Lin, P. Debonding detection in hidden frame supported glass curtain walls using the nonlinear ultrasonic modulation method with piezoceramic transducers. Sensors 2018, 18, 2094. [Google Scholar] [CrossRef]
  7. Hong, X.; Liu, Y.; Lin, P.; Xu, W. Interfacial adhesion–strength detection of structural silicone sealant for hidden frame–supported glass curtain wall based on nonlinear ultrasonic Lamb wave. J. Aerosp. Eng. 2018, 31, 04018047. [Google Scholar] [CrossRef]
  8. Lin, J.; Hong, X.; Ren, Z. Laser in-depth heating thermal wave detection of adhesive debonding in glass curtain walls: Numerical simulation and experiment. Measurement 2021, 177, 109268. [Google Scholar] [CrossRef]
  9. Xu, D.; Wang, Y.; Xie, J. Monitoring and Analysis of building curtain wall deformation based on optical fiber sensing technology. Iran. J. Sci. Technol. Trans. Civ. Eng. 2022, 46, 3081–3091. [Google Scholar] [CrossRef]
  10. Mojškerc, B.; Kek, T.; Grum, J. Pulse-Echo Ultrasonic Testing of Adhesively Bonded Joints in Glass Façades. J. Mech. Eng. 2016, 62, 147–153. [Google Scholar] [CrossRef]
  11. Brusa, E.; Bruzzone, F.; Delprete, C.; Di Maggio, L.G.; Rosso, C. Health indicators construction for damage level assessment in bearing diagnostics: A proposal of an energetic approach based on envelope analysis. Appl. Sci. 2020, 10, 8131. [Google Scholar] [CrossRef]
  12. Rucka, M. Non-destructive testing of structures. Materials 2020, 13, 4996. [Google Scholar] [CrossRef] [PubMed]
  13. Luo, X.; Yu, F.; Qian, J.; An, B.; Duan, N. An Intelligent Fault Diagnosis Model for Rolling Bearings Based on IGTO-Optimized VMD and LSTM Networks. Appl. Sci. 2025, 15, 4338. [Google Scholar] [CrossRef]
  14. Liu, W.; Luo, Q.; Dai, G.; Tang, X. Experimental and Numerical Study on Dynamic Response of High-Pier Ballastless Continuous Beam Bridge in Mountainous Area. Appl. Sci. 2025, 15, 4341. [Google Scholar] [CrossRef]
  15. Yi, Q.; Wu, Z.; Zhao, L.; Li, Z.; Wang, S. Flexural Wave Propagation and Defect States of Periodic Slab Track Structure in High-Speed Railway. Appl. Sci. 2025, 15, 1070. [Google Scholar] [CrossRef]
  16. Zheng, H.; He, D.; Guo, T.; Chen, Z. A new damage identification approach of HFSGCW based on LDV and wavelet packet band energy method. J. Build. Eng. 2024, 95, 110113. [Google Scholar] [CrossRef]
  17. Jiang, K.; Pan, D.; Huang, Y.; Fu, X. Construction defect identification for structural sealant by statistical driving-point accelerance. Constr. Build. Mater. 2023, 392, 131817. [Google Scholar] [CrossRef]
  18. Pan, D.; Jiang, K.; Zhang, X.; Huang, Y. Sealant Delamination Detection of Structural Sealant Glazing Systems Based on Driving-Point Accelerance. Shock Vib. 2020, 2020, 7260438. [Google Scholar] [CrossRef]
  19. Gu, J.; Hao, W.; Luo, Y. Investigation of damage identification for glass curtain wall based on Hilbert-Huang transform and transmissibility function. Int. J. Model. Identif. Control 2011, 13, 38–45. [Google Scholar] [CrossRef]
  20. Yang, G.; Long, X.; Wang, X.; Liu, X.; Li, H.; Liu, Z. Structural adhesive damage identification of glass curtain wall. Nonlinear Dyn. 2022, 110, 2573–2587. [Google Scholar] [CrossRef]
  21. Nguyen, D.H.; Nguyen, Q.B.; Bui-Tien, T.; De Roeck, G.; Wahab, M.A. Damage detection in girder bridges using modal curvatures gapped smoothing method and Convolutional Neural Network: Application to Bo Nghi bridge. Theor. Appl. Fract. Mech. 2020, 109, 102728. [Google Scholar] [CrossRef]
  22. Xiang, C.-S.; Li, L.-Y.; Zhou, Y.; Yuan, Z. Damage identification method of beam structure based on modal curvature utility information entropy. Adv. Civ. Eng. 2020, 2020, 8892686. [Google Scholar] [CrossRef]
  23. Chinka, S.S.B.; Putti, S.R.; Adavi, B.K. Modal testing and evaluation of cracks on cantilever beam using mode shape curvatures and natural frequencies. Structures 2021, 32, 1386–1397. [Google Scholar] [CrossRef]
  24. Khiem, N.T. Mode shape curvature of multiple cracked beam and its use for crack identification in beam-like structures. Vietnam J. Mech. 2020, 42, 123–132. [Google Scholar] [CrossRef]
  25. He, M.; Yang, T.; Du, Y. Nondestructive identification of composite beams damage based on the curvature mode difference. Compos. Struct. 2017, 176, 178–186. [Google Scholar] [CrossRef]
  26. Hakim, S.; Mhaya, A.; Noh, M.; Paknahad, M.; Tami, H.; Alshalif, A. Utilizing mode shape curvature and artificial neural networks for structural damage assessment in beam-like structures. In Proceedings of the IOP Conference Series: Earth and Environmental Science, Langkawi, Malaysia, 18–19 September 2024; p. 012013. [Google Scholar]
  27. Pandey, A.; Biswas, M.; Samman, M. Damage detection from changes in curvature mode shapes. J. Sound Vib. 1991, 145, 321–332. [Google Scholar] [CrossRef]
  28. Wang, Q.-m.; Zhu, R.-h.; Zheng, J.-h.; Wang, N.; Luo, M.-y.; Che, Y.-f. A method for the damage detection of pile foundation in high-pile wharf based on a curvature mode deletion model. China Ocean Eng. 2020, 34, 871–880. [Google Scholar] [CrossRef]
  29. Zhang, X.; Jiang, K.; Pan, D.; Fu, X.; Hu, N. A Two-Stage Damage Localization Method for Structural Sealants Based on Boundary Modal Curvature. Appl. Sci. 2024, 14, 9641. [Google Scholar] [CrossRef]
  30. Li, W.; Liu, Y.; Yuan, X.; Li, Q.; Zhou, G. Rail hidden damage detection based on the modal curvature differences method. Adv. Mech. Eng. 2024, 16, 16878132241279500. [Google Scholar] [CrossRef]
  31. Zhang, Y.; Guo, J.; Xie, Y.; Xu, J. Warship damage identification using mode curvature shapes method. Appl. Ocean Res. 2022, 129, 103396. [Google Scholar] [CrossRef]
  32. Boscato, G.; Civera, M.; Zanotti Fragonara, L. Recursive partitioning and Gaussian process regression for the detection and localization of damages in pultruded glass fiber reinforced polymer material. Struct. Control Health Monit. 2021, 28, e2805. [Google Scholar] [CrossRef]
  33. Civera, M.; Boscato, G.; Fragonara, L.Z. Treed gaussian process for manufacturing imperfection identification of pultruded GFRP thin-walled profile. Compos. Struct. 2020, 254, 112882. [Google Scholar] [CrossRef]
  34. Rabiepour, M.; Zhou, C.; Chase, J.G. A Hysteresis Model Incorporating Varying Pinching Stiffness and Spread for Enhanced Structural Damage Simulation. Appl. Sci. 2025, 15, 724. [Google Scholar] [CrossRef]
  35. Chen, C.; Xie, M.; Du, Y.; Pang, W. A new method of safety detection in high-rise building curtain walls based on natural vibration frequency. In Proceedings of the IOP Conference Series: Earth and Environmental Science, Zhuhai, China, 15–17 January 2021; p. 012092. [Google Scholar]
  36. Wang, Z.; Liu, X.; Cao, D.; Wan, D.; Wei, S. Detection and safety assessment of bonding defects in architectural decorative surface layer based on the variation of vibration acceleration amplitude. Case Stud. Constr. Mater. 2025, 22, e04278. [Google Scholar] [CrossRef]
  37. Back, J.H.; Bae, J.B.; Kang, J.H.; Kim, J.J. Comparing Bolt Implementation Methods in Vibration Testing for Accurate Dynamic Behavior Analysis. Appl. Sci. 2025, 15, 505. [Google Scholar] [CrossRef]
  38. Bagherkhani, A.; Baghlani, A. Enhancing the curvature mode shape method for structural damage severity estimation by means of the distributed genetic algorithm. Eng. Optim. 2021, 53, 683–701. [Google Scholar] [CrossRef]
  39. Nguyen, D.H.; Wahab, M.A. Damage detection in slab structures based on two-dimensional curvature mode shape method and Faster R-CNN. Adv. Eng. Softw. 2023, 176, 103371. [Google Scholar] [CrossRef]
  40. Rucevskis, S.; Sumbatyan, M.A.; Akishin, P.; Chate, A. Tikhonov’s regularization approach in mode shape curvature analysis applied to damage detection. Mech. Res. Commun. 2015, 65, 9–16. [Google Scholar] [CrossRef]
Figure 1. Schematic diagram of the experimental setup: (a) exciting system; (b) vibration signal acquisition system.
Applsci 15 06568 g001
Figure 2. Experimental samples.
Applsci 15 06568 g002
Figure 3. Schematic diagram of experimental samples (ag).
Applsci 15 06568 g003
Figure 4. Schematic diagram of the layout and numbering of sampling points.
Applsci 15 06568 g004
Figure 5. Natural frequencies (modes 1–6) of side A under different damage degrees (af): (a) first order; (b) second order; (c) third order; (d) fourth order; (e) fifth order; (f) sixth order.
Applsci 15 06568 g005
Figure 6. Natural frequencies (modes 1–6) under identical damage degree.
Applsci 15 06568 g006
Figure 7. First-order curvature mode difference under identical damage degree (ad) of (a) Condition 2; (b) Condition 3; (c) Condition 4; (d) Condition 5.
Applsci 15 06568 g007
Figure 8. First-order curvature mode difference in side A under different damage degrees of (a) Condition 2; (b) Condition 6; (c) Condition 7.
Applsci 15 06568 g008
Figure 9. Schematic of boundary modal sampling points.
Applsci 15 06568 g009
Figure 10. First-order curvature mode difference under identical damage degree (ad) at the boundary of (a) Condition 2; (b) Condition 3; (c) Condition 4; (d) Condition 5.
Applsci 15 06568 g010
Figure 11. First-order curvature mode difference in side A under different damage degrees (a,b) at the boundary of (a) Condition 6; (b) Condition 7.
Applsci 15 06568 g011
Table 1. Structural adhesive damage condition.
ConditionsCondition 1Condition 2Condition 3Condition 4Condition 5Condition 6Condition 7
Damage
scenario
description
UndamagedSide A
debonding
(33%)
Side B
debonding
(33%)
Side C
debonding
(33%)
Side D
debonding
(33%)
Side A
debonding
(66%)
Side A
Debonding
(100%)
Corresponding
diagram
Figure 3aFigure 3bFigure 3cFigure 3dFigure 3eFigure 3fFigure 3g
Table 2. Critical threshold demarcation between damaged and undamaged conditions.
ConditionsAverage ValueMaximum ValueMinimum ValueDamage Threshold
Undamaged−0.00340.11−0.110.1205
Damaged0.1940.2720.131
Disclaimer/Publisher’s Note: The statements, opinions and data contained in all publications are solely those of the individual author(s) and contributor(s) and not of MDPI and/or the editor(s). MDPI and/or the editor(s) disclaim responsibility for any injury to people or property resulting from any ideas, methods, instructions or products referred to in the content.

